=\AtBeginShipoutBox\AtBeginShipoutBox
Star-forming regions at the periphery of the supershell surrounding the Cyg OB1 association. II. ISM kinematics and YSOs in the star cluster vdB 130 region
Abstract
We present an observational study of small-scale feedback processes operating in the star-forming region located in the wall of the expanding supershell around the Cyg OB1 association. The interstellar gas and dust content and pre-stellar populations in the vicinity of the open star cluster vdB 130 are analysed based on new optical and IR observations performed with the 6-m (3D spectroscopic mapping in the [S ii] doublet) and 2.5-m (optical and NIR images) Russian telescopes along with the archival data of Spitzer and Herschel space telescopes. Analysing ionized gas kinematics and emission spectra, we discovered a compact region with supersonic motions. These motions may be caused either by stellar wind, or a bipolar outflow from a protostellar disc. Young stellar objects were identified and classified in the area under study. Two star-forming regions were identified. One of them is a region of ongoing star formation in the head of the molecular cloud observed there and another one is a burst of star formation in the cloud tail.
keywords:
ISM: kinematics and dynamics – ISM: clouds – ISM: lines and bands – ISM: bubbles – ISM: evolution – open clusters and associations: individual: vdB 1301 Introduction
In recent years, with the growing availability of sub-mm and IR observations of high angular resolution and sensitivity, investigations of star formation prerequisites attract significant attention. In particular, new observational facilities have extended modern studies toward numerous extragalactic star-forming regions. The available observations indicate that in many galaxies short local starburst episodes (with a duration of about 10 Myr) that manifest themselves as complexes of ionized gas reside mainly within dense walls of supershells around OB associations and in walls of giant H i structures (see e.g. Egorov et al. 2018 and references therein).
Turbulence, feedback from outflows, shell collisions, supernova explosions, expanding H ii regions and other factors work together sculpting a fine structure of molecular clouds with filaments, pillars, and blobs, peppered with young stellar objects (YSOs). Given this complexity, along with large-scale studies of giant supershells in other galaxies, a detailed look at some nearby objects can be useful for analysing the star formation processes.
The aim of this work is to continue the study of star-forming regions in walls of an expanding supershell formed by the wind and the UV radiation of stars in the Cyg OB1 association (Lozinskaya & Sitnik, 1988; Lozinskaya & Repin, 1990; , 1992; Lozinskaya et al., 1997, 1998), using our new optical and IR observations of the region along with archival observational data from the Spitzer and Herschel space telescopes. The Cyg OB1 association includes at least 50 OB stars (Humpreys & McElroy, 1984), and the size of the supershell driven by this association is degrees.
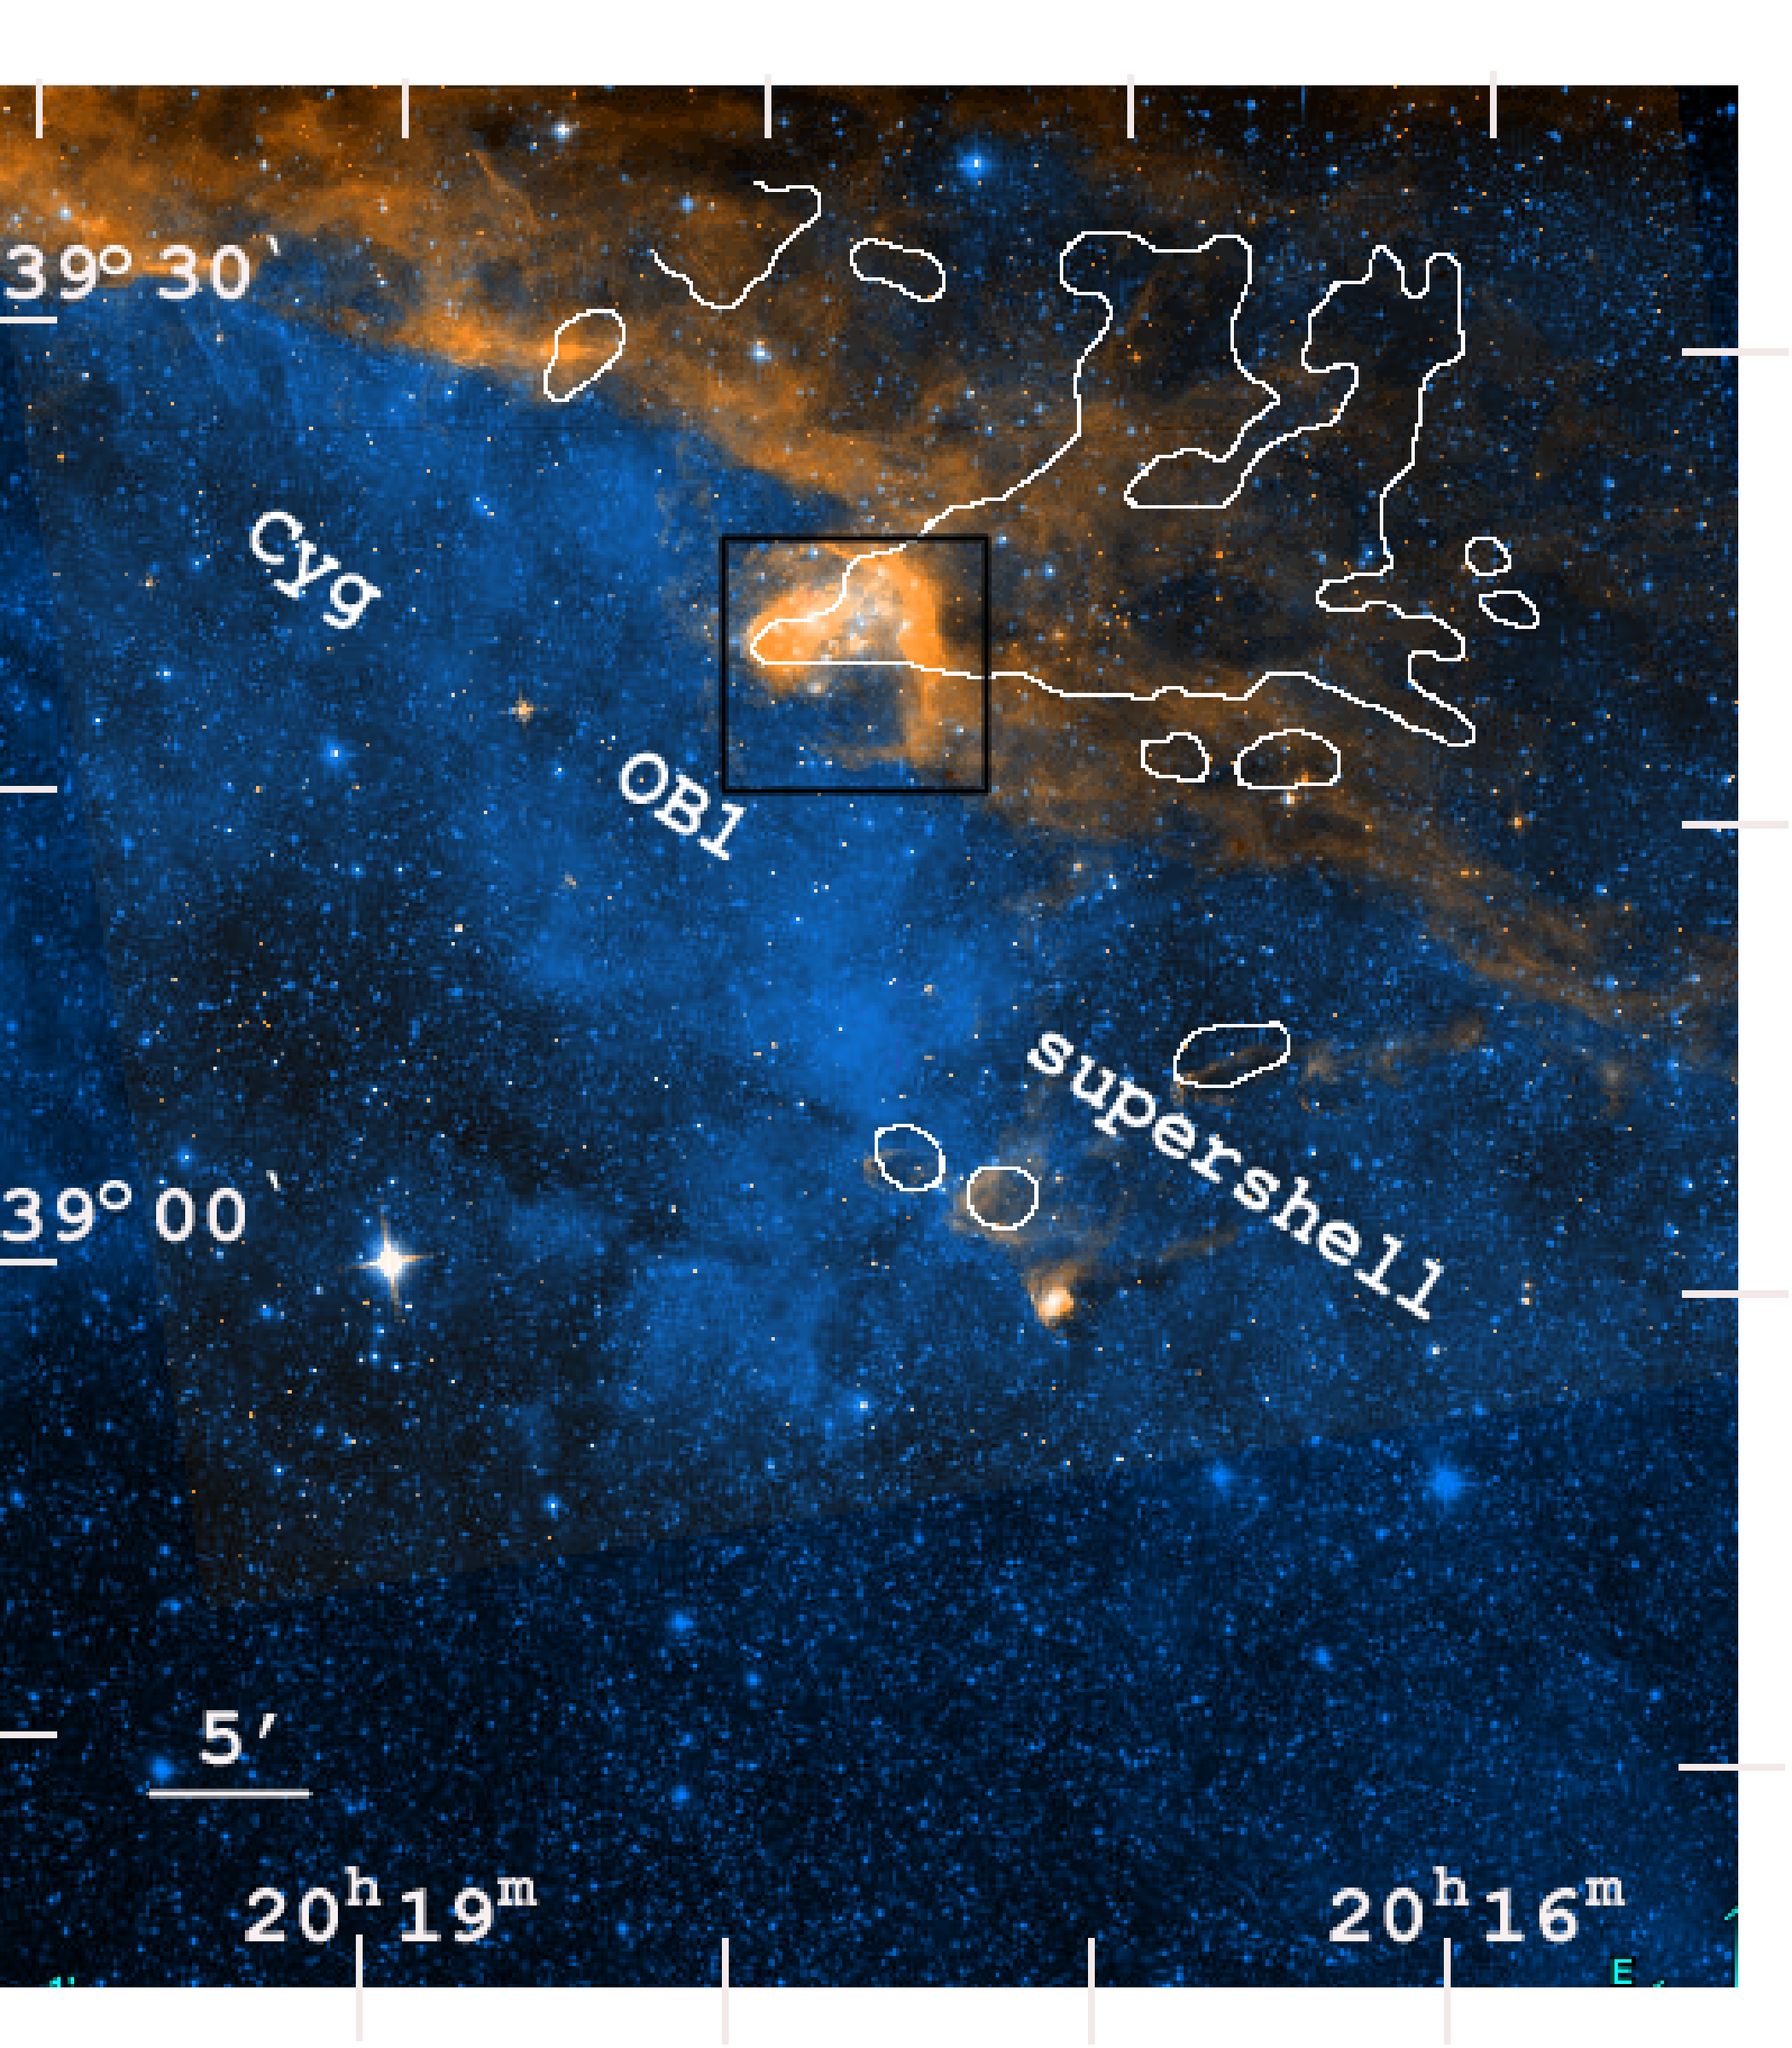
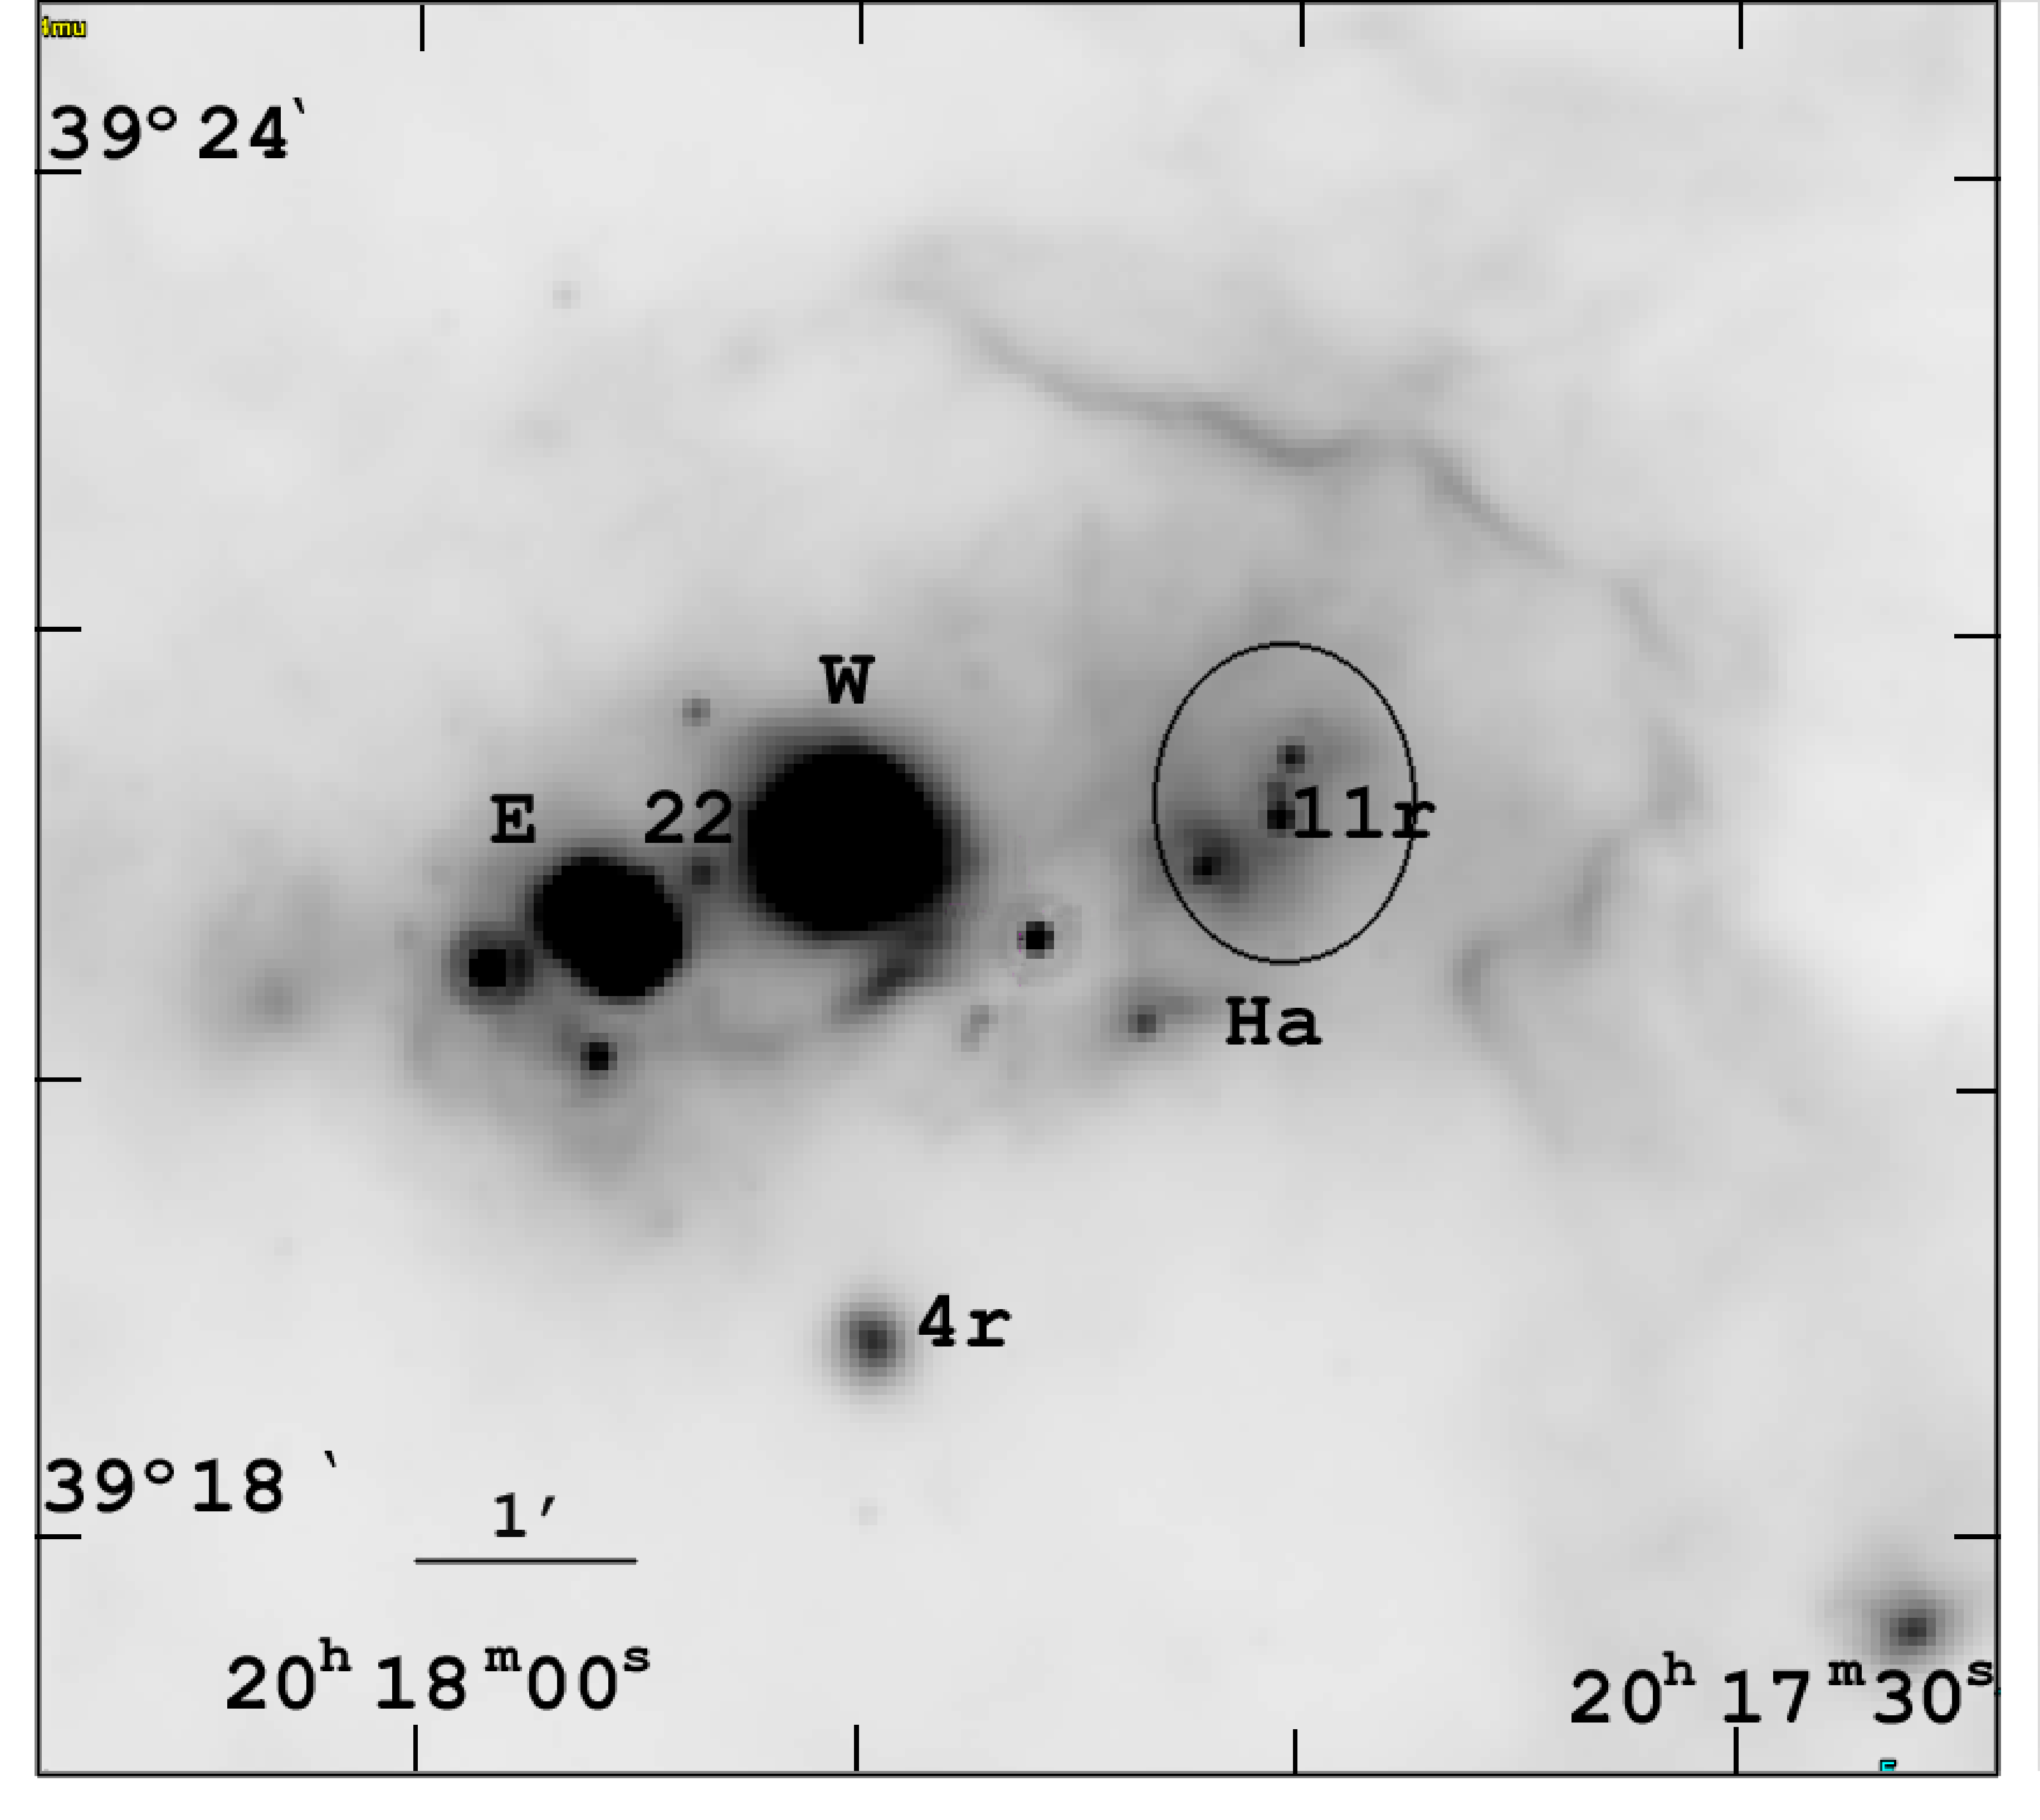
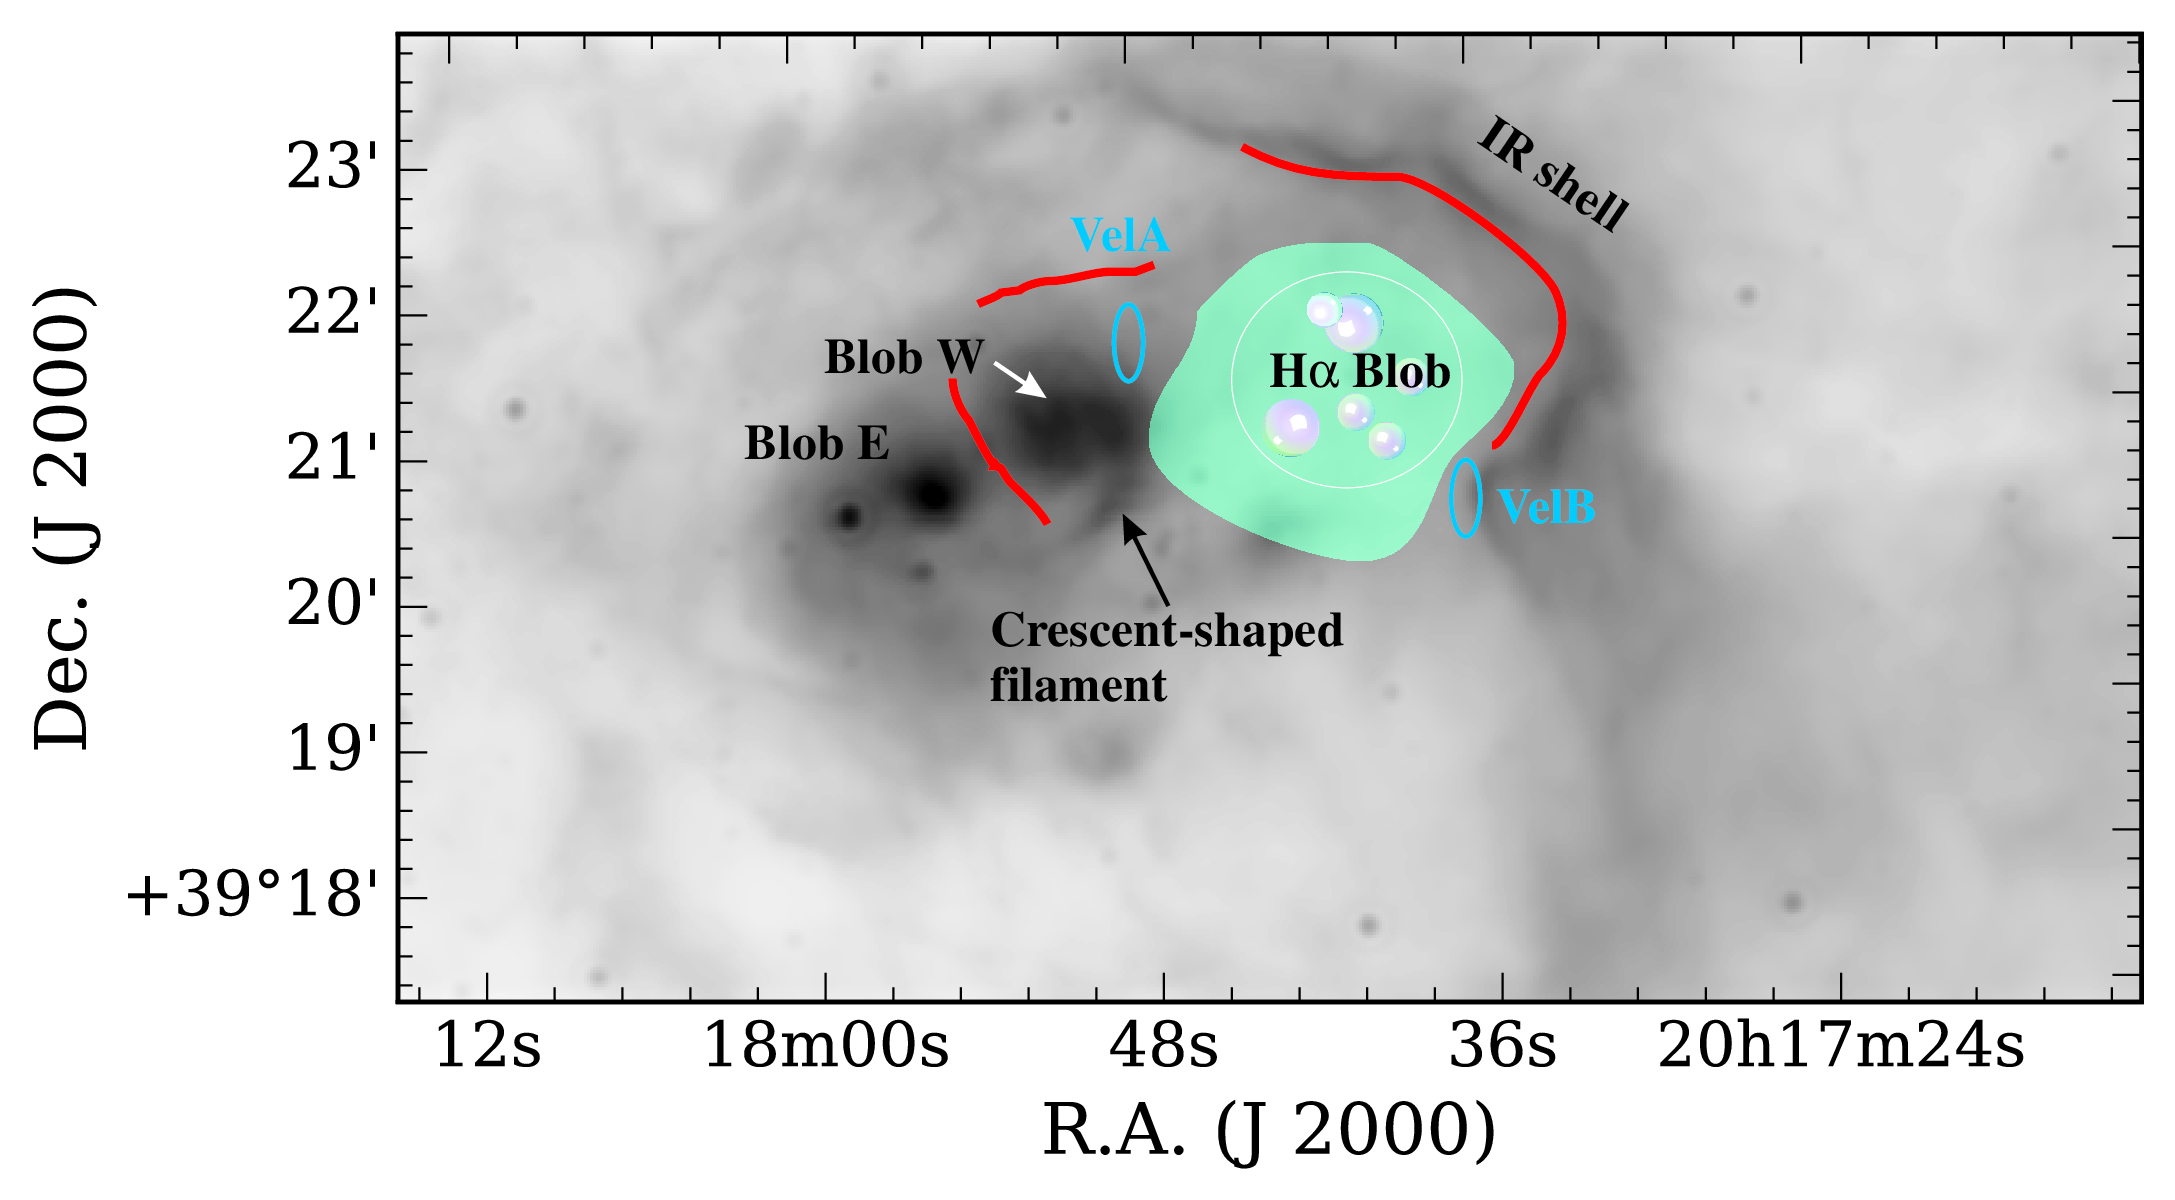
In Sitnik et al. (2015) (hereinafter referred to as Paper I) and (2016) we have already partially studied the regions of ongoing star formation located in the supershell and related to the globule family (Arkhipova et al., 2013) and the cometary molecular cloud, or pillar (Schneider et al., 2007). A young ( Myr) star cluster vdB 130 (Racine, 1968) is observed in the direction of the head of the CO cloud (see square on Fig. 1, top). The physical relation between the Cyg OB1 association, the supershell, the vdB 130 cluster, and the cloud follows from the distance and radial velocity estimates, as well as from several indirect factors (see Paper I, ). With the assumed distance of kpc111Further we use an average distance value of 1.7 kpc throughout the paper., the size of the cluster, whose stars surround the head of the cometary cloud, is no larger than 6 pc (10 arcmin) (Fig. 1, top). Some cluster stars are surrounded by gas and dust nebulae that can be distinguished in the optical and IR ranges. The central part of the cluster is enclosed in a partial IR shell with a size of about 3 pc, visible in all Spitzer space telescope bands (Fig. 1, bottom). The interstellar extinction law in the cluster region differs significantly from the normal law, with reaching values of . On the other hand, the normal extinction law is valid along the line of sight to the cluster (, 2016). Some cluster stars are located in the centres of dust clumps located in the interior of the IR shell and designated as Blob W and Blob E in Paper I. Also, an H emitting region referred to as ‘H Blob’ in Paper I resides within the shell. The diameters of Blob W and Blob E are 0.4 pc and 0.2 pc, respectively. Traces of a faint shock have been detected in the sky plane between these blobs (Paper I).
The structure of the supershell region under study is such that all the extended sources (the cometary molecular cloud, the system of blobs) are aligned in the direction of the illuminating source, that is, in the direction of the closest projected Cyg OB1 association stars, whereas the IR shell around vdB 130 is opened toward the association.
In Paper I we considered the possibility of the following scenario of the evolution of this region. In the cluster vicinity, the expanding supershell around Cyg OB1 interacts with the molecular cloud. A typical cometary shape of the cloud (an IR pillar; see Fig. 1, top) is an indirect confirmation of such an interaction.According to this scenario, the wind and the UV radiation of the Cyg OB1 stars had triggered the star formation in the pillar, having resulted in the emergence of the vdB 130 cluster. Stars of the cluster interact with Blob W and Blob E in the east and with the cometary cloud in the west, presumably, triggering the next episode of the star formation. A similar scenario for the Carina nebula has been discussed in Smith et al. (2010). To check the validity of this scenario for the IR supershell, it would be good to confirm it with the age estimates as, for example, in Oey et al. (2005). Our estimate for the age of vdB 130 is in apparent contradiction with the IR supershell age of 1 Myr given by (1992). However, we should keep in mind that the uncertainties in the age determination are very large. So, the age comparison can be used neither as an evidence in favour of triggering, nor as an argument against triggering.
| Data set | Telescope,instrument | Filter | Date of obs | , sec | px | , ′′ | sp. range | , Å | or FWHM, Å |
|---|---|---|---|---|---|---|---|---|---|
| FPI Field 1 | 6-m, SCORPIO-2 | AC6730 | 17/18 Jun 2015 | 0.36 | 2.6 | [S ii] 6717, 6731Å | 6720 | ||
| FPI Field 2 | 6-m, SCORPIO-2 | AC6730 | 17/18 Jun 2015 | 0.36 | 2.8 | [S ii] 6717, 6731Å | 6720 | ||
| BTA images, field #1 | 6-m, SCORPIO-2 | FN655 | 16/17 Oct 2014 | 0.36 | 3.5 | H[N ii]+cont. | 6559 | 97 | |
| 6-m, SCORPIO-2 | FN674 | 16/17 Oct 2014 | 0.36 | 3.5 | [S ii]+cont. | 6733 | 60 | ||
| 6-m, SCORPIO-2 | FN641 | 16/17 Oct 2014 | 0.36 | 3.5 | continuum | 6413 | 179 | ||
| 6-m, SCORPIO-2 | FN712 | 16/17 Oct 2014 | 0.36 | 3.5 | continuum | 7137 | 209 | ||
| BTA images, field #2 | 6-m, SCORPIO-2 | FN655 | 16/17 Oct 2014 | 0.36 | 4.1 | H[N ii]+cont. | 6559 | 97 | |
| 6-m, SCORPIO-2 | FN674 | 16/17 Oct 2014 | 0.36 | 4.1 | [S ii]+cont. | 6733 | 60 | ||
| 6-m, SCORPIO-2 | FN641 | 16/17 Oct 2014 | 0.36 | 4.1 | continuum | 6413 | 179 | ||
| 6-m, SCORPIO-2 | FN712 | 16/17 Oct 2014 | 0.36 | 4.1 | continuum | 7137 | 209 | ||
| CMO image, field #1 | 2.5-m, NBI | OIII | 26/27 Aug 2017 | 0.16 | 2.3 | [O iii]+cont. | 4992 | 63 | |
| CMO image, field #2 | 2.5-m, NBI | OIII | 26/27 Aug 2017 | 0.16 | 2.7 | [O iii]+cont. | 4992 | 63 | |
| CMO image, field #3 | 2.5-m, NBI | OIII | 27/28 Aug 2017 | 0.16 | 1.3 | [O iii]+cont. | 4992 | 63 | |
| CMO image, field #4 | 2.5-m, NBI | OIII | 27/28 Aug 2017 | 0.16 | 1.4 | [O iii]+cont. | 4992 | 63 | |
| CMO NIR Images | 2.5-m, ASTRONIRCAM | CO | 17/17 Dec 2017 | 0.27 | 0.8 | CO+cont. | 2.285 m | 302 | |
| 2.5-m, ASTRONIRCAM | J | 07/08 Mar 2016 | 0.27 | 1.2 | continuum | 1.25 m | 1665 | ||
| 2.5-m, ASTRONIRCAM | H | 07/08 Mar 2016 | 0.27 | 1.2 | continuum | 1.64 m | 2928 | ||
| 2.5-m, ASTRONIRCAM | K | 26/27 Apr 2017 | 0.27 | 0.8 | continuum | 2.2 m | 3162 |
The possibility of triggered star formation is a hot topic, which is widely discussed in the literature, with numerous examples having been suggested both for Galactic and extragalactic sources. However, the subject is very uncertain, and various proposed signposts of the triggered star formation can be insufficient. On the one hand, observations do indicate higher density of younger stellar objects at edges of bubble structures around massive stars (see e. g. Palmeirim et al., 2017). On the other hand, features that are believed to be signatures of triggering can be misleading, even when they are quite persuasive (Dale et al., 2015).
To study further this region, in this work we present new observational data, which are used to analyse the ionized gas kinematics and the optical and IR emission-line morphology of the vdB 130 cluster region. These observations and methods of their reduction are described in Section 2. Section 3 describes the results of narrow-band optical and infrared observations. In Section 4 we analyse the kinematics of the area, and uncover traces of interaction between the stellar and interstellar populations. Possible causes of the appearance of supersonic motions are discussed in Section 5. An analysis of the distribution of young stellar objects in the area based on the observations of the Spitzer space telescope is presented in Section 6. The obtained results are summarized in Section 7.
2 Observations and data reduction
This study is based on optical observations performed with the 6-m telescope of the Special Astrophysical Observatory of the Russian Academy of Sciences (SAO RAS) and the 2.5-m telescope of the Caucasian Mountain Observatory (CMO) of Sternberg Astronomical Institute, Lomonosov Moscow State University (SAI MSU), as well as on archival IR data obtained with Spitzer and Herschel space observatories. The log of our observations used in this analysis, including those previously described in Paper I, is given in Table 1, where the used instrument and filter, the total exposure time (), the pixel size of the final images (px), the final angular resolution (), the covered spectral range, the central wavelength of the used filter () and the final spectral resolution ( or FWHM) or the bandwidth of the used filter (FWHM) are indicated for each data set.
2.1 Fabry–Perot observations
In order to investigate the ionized gas kinematics in the studied region we observed it with a scanning Fabry–Perot interferometer (FPI) mounted inside the SCORPIO-2 multi-mode focal reducer (Afanasiev & Moiseev, 2011) at the 6-m telescope of SAO RAS. The operating spectral range around the [S ii] emission lines was cut by a bandpass filter with an Å bandwidth. During the scanning process, we have consecutively obtained 40 interferograms at different distances between the FPI plates.
Data reduction was performed using a software package running in the idl environment. For a detailed description of the data reduction algorithms and software see Moiseev (2002); Moiseev & Egorov (2008) and Moiseev (2015). After the initial reduction, sky line subtraction, photometric and seeing corrections made using reference stars, and wavelength calibration, the observational data were combined into data cubes, where each pixel in the field of view contains a 40-channel spectrum. Because of the large angular size of the region, we separated it into two overlapping fields. Each of them was observed at two position angles in order to remove the parasitic ghost reflection. These data were reduced separately to obtain the wavelength cubes for each field. After heliocentric correction, we merged both fields into single mosaic data cubes. In order to increase signal-to-noise ratio we made pixels binning of this mosaic data cube to the pixel size of 1.05 arcsec. This spatial scale provides an optimal sampling of data taken with a typical seeing value of 2.8 arcsec (see Tab. 1).
The [S ii] line profiles in the obtained data cube were analysed using single-component Voigt fitting (Moiseev & Egorov, 2008). Because both [S ii] 6717 Å and 6731 Å (from neighbouring orders of interference) lines are visible in the resulting spectra, we fitted them simultaneously with two Voigt functions having similar FWHM and fixed velocity separation. To describe ionized gas motions in several regions with line-profile asymmetry we used multi-component Voigt fitting.
Unfortunately, weather conditions during the FPI observations were far from ideal: the channel-to-channel seeing variations were about 20 per cent, and the transparency variations were 20–40 per cent. We corrected this effect using photometry of field stars as described in Moiseev (2002). However, even after photometric corrections we detected artefacts in some regions of the final data cube caused by the atmospheric transparency variations: arc-like structures on the maps of emission lines parameters. The maximum RMS of the parasitic arcs is 1.5 km/s in the velocity field and 6 km/s in the velocity dispersion maps. These values limit the accuracy of our line-of-sight velocity estimates presented below.
2.2 Optical and NIR narrow-band images
We obtained a large set of images in the vicinity of vdB 130 cluster in the following spectral bands: H, [S ii] and [O iii] optical emission lines; the optical continuum on both sides of H and [S ii] lines; the NIR CO() emission line together with the J, H, and K band continuum. The parameters of all the data sets are given in Table 1.
H, [S ii] and optical continuum observations were performed with the 6-m BTA telescope of SAO RAS equipped with the SCORPIO-2 multi-mode focal reducer. Because of the limited field of view ( arcmin), we observed two overlapping fields separately, and then combined the reduced images for each filter into a mosaic. The details of the observations and reduction of these data sets are given in Paper I. Note that because the FWHM of the used FN655 filter is broader than the separation between H and [N ii] emission lines, the image in this filter is contaminated by [N ii] 6548, 6584 Å emission. Given that the typical ratio of [Nii]6548,6584/H in the region (Paper I), we may expect the contribution of [N ii] lines to be up to 30 per cent of the total observed flux. Hereafter, the ‘H’ notation is used to refer to the emission in the H line with this additional contribution due to the [N ii] lines.
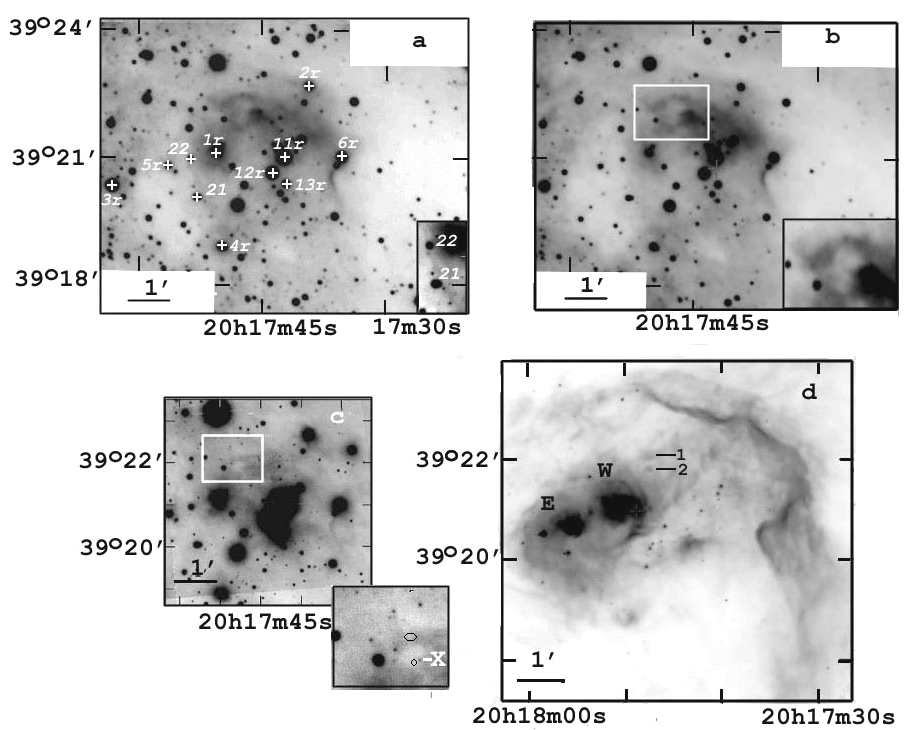
The [O iii] line images of vdB 130 vicinity were obtained with a 4k4k camera (made in the Niels Bohr Institute, Copenhagen; here and after – NBI camera) mounted in the Cassegrain focus of the 2.5-m telescope CMO of SAI MSU. In this camera, the CCD-matrix contains two E2V CCD 44-82 detectors pixels each, providing a arcmin field of view with a blind zone between the detectors. We observed four overlapping fields with different exposures and under different seeing conditions. Images of each of the fields were reduced separately. Data reduction included bias subtraction, correction for non-linearity of each detector, flat-field correction, removal of background air-glow emission and removing cosmic-ray hits. The final images were combined into a mosaic. Its central part is analysed in this paper (shown in Fig. 2c).
We subtracted the underlying stellar continuum from optical images in H and [S ii] lines using the images obtained in the filters FN641 and FN712. The residuals from the subtraction of the bright stars were masked in all subsequent images in the paper. We did not observed the continuum around the [O iii] line, so in all figures containing [O iii] image the underlying continuum is not subtracted.
NIR images of the vdB 130 region were obtained with the ASTRONIRCAM infrared camera (, 2017) mounted in the Nasmyth-1 focus of the 2.5-m telescope. We observed the region of interest in four bands allowing us to obtain the CO() (= 2.285 m) emission line images and the J, H, and K band photometric images. Observations were performed using the dithering method, with the telescope shifting between individual frames by arcsec. Each frame was corrected for non-linearity, dark current, and flat field.
2.3 Archival data used
This work is partially based on observational data of Spitzer and Herschel space telescopes. These data were downloaded from the Spitzer Heritage Archive222http://sha.ipac.caltech.edu and the Herschel Science Archive333http://herschel.esac.esa.int/Science_Archive.shtml.
The studied region was observed by Spitzer space telescope within the framework of the program called ‘A Spitzer Legacy Survey of the Cygnus-X Complex’444http://www.cfa.harvard.edu/cygnusX (Hora et al., 2011). The images in the four bands at m, m, m, and m were taken with the IRAC camera, and the m image was taken with the MIPS camera. The spatial resolution of the images taken with the two cameras are equal to 0.6 and 2.45 arcsec per pixel, respectively.
We used Herschel archival data obtained within the framework of the ‘Hi-GAL: Herschel Infrared Galactic Plane Survey’555https://tools.ssdc.asi.it/HiGAL.jsp program (Molinari et al., 2010). This region around vdB 130 was imaged with the PACS instrument at m and m and the SPIRE instrument at m, m, and m with a spatial resolution ranging from 3.2 to 14.0 arcsec per pixel. In our analysis we mostly use PACS m and SPIRE m data with a resolution of 6 and 14 arcsec per pixel, respectively.
3 Optical and IR emission line morphology of the region
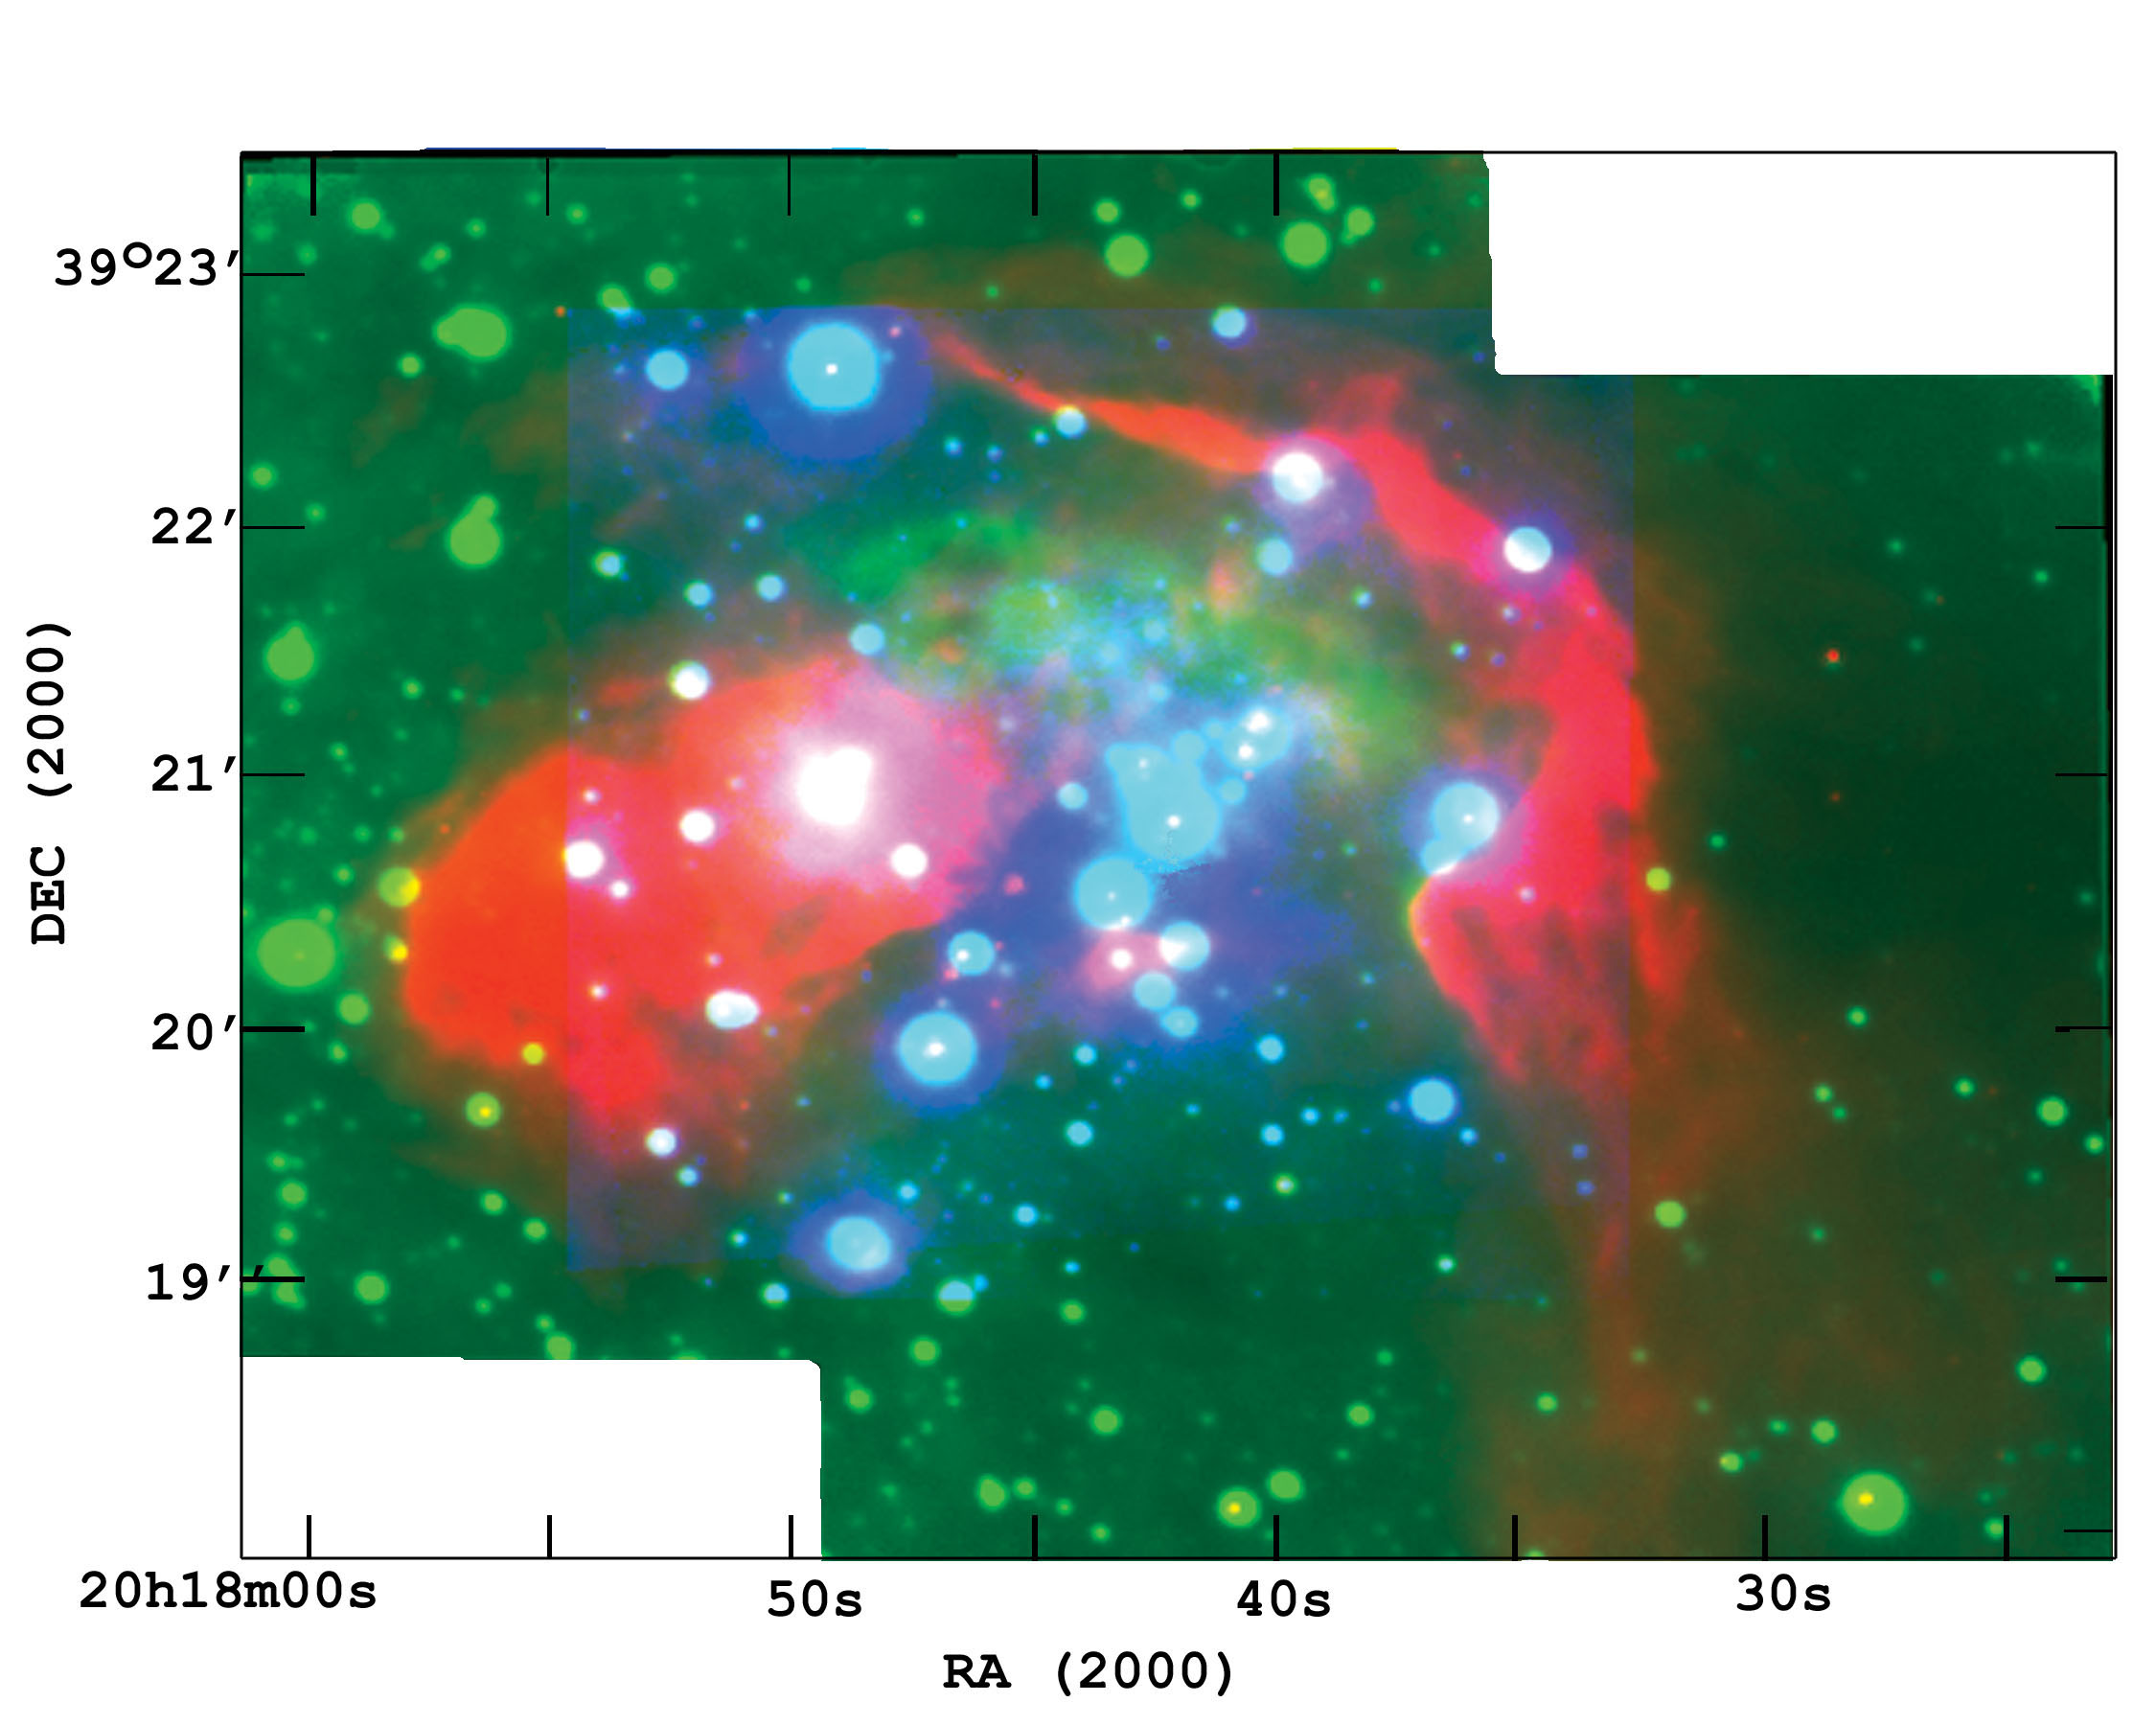
Fig. 2 shows the [S ii] 6717, 6731Å, H, [O iii] 4959, 5007Å and 8 m band images of the studied region. As is evident from the figure, [S ii] and H line emission dominates in the north-western part of the region, near the IR-shell, whereas [O iii] emission is observed primarily toward the cluster core stars 11r, 12r, and 13r as well as between these stars and Blob W. Mid-IR emission, [S ii]+H emission, and [O iii] emission are further summarized in Fig. 3 (top). Three zones stand out in this RGB-image. Red colour (IR emission) shows the locations of the IR shell, Blob W and Blob E. Regions of bright [S ii]+H emission are indicated by green colour. Centred on the cluster core is the [O iii] emission shown with blue colour.
The overall structure of the area has been discussed in detail in Paper I and is illustrated in Fig. 14. Here we note some peculiar features of this region. Among the peculiarities of the area, there is a cavity with a size of approximately arcmin ( pc), shown on insets of Fig. 2. It is distinguishable in all the observed lines. Also, several diffuse [O iii] filaments are visible between H Blob (around the vdB 130 core stars) and Blob W. [O iii], [S ii] and H line emission is noticeable in the direction of Blob W. The crescent-shaped filament in Blob W, noticeable only in the IR, neighbours the [O iii] emission region in the plane of the sky (Fig. 2d and 3, top). An [O iii] emission brightening is evident to the west of Blob W (at the base of the crescent-shaped filament).
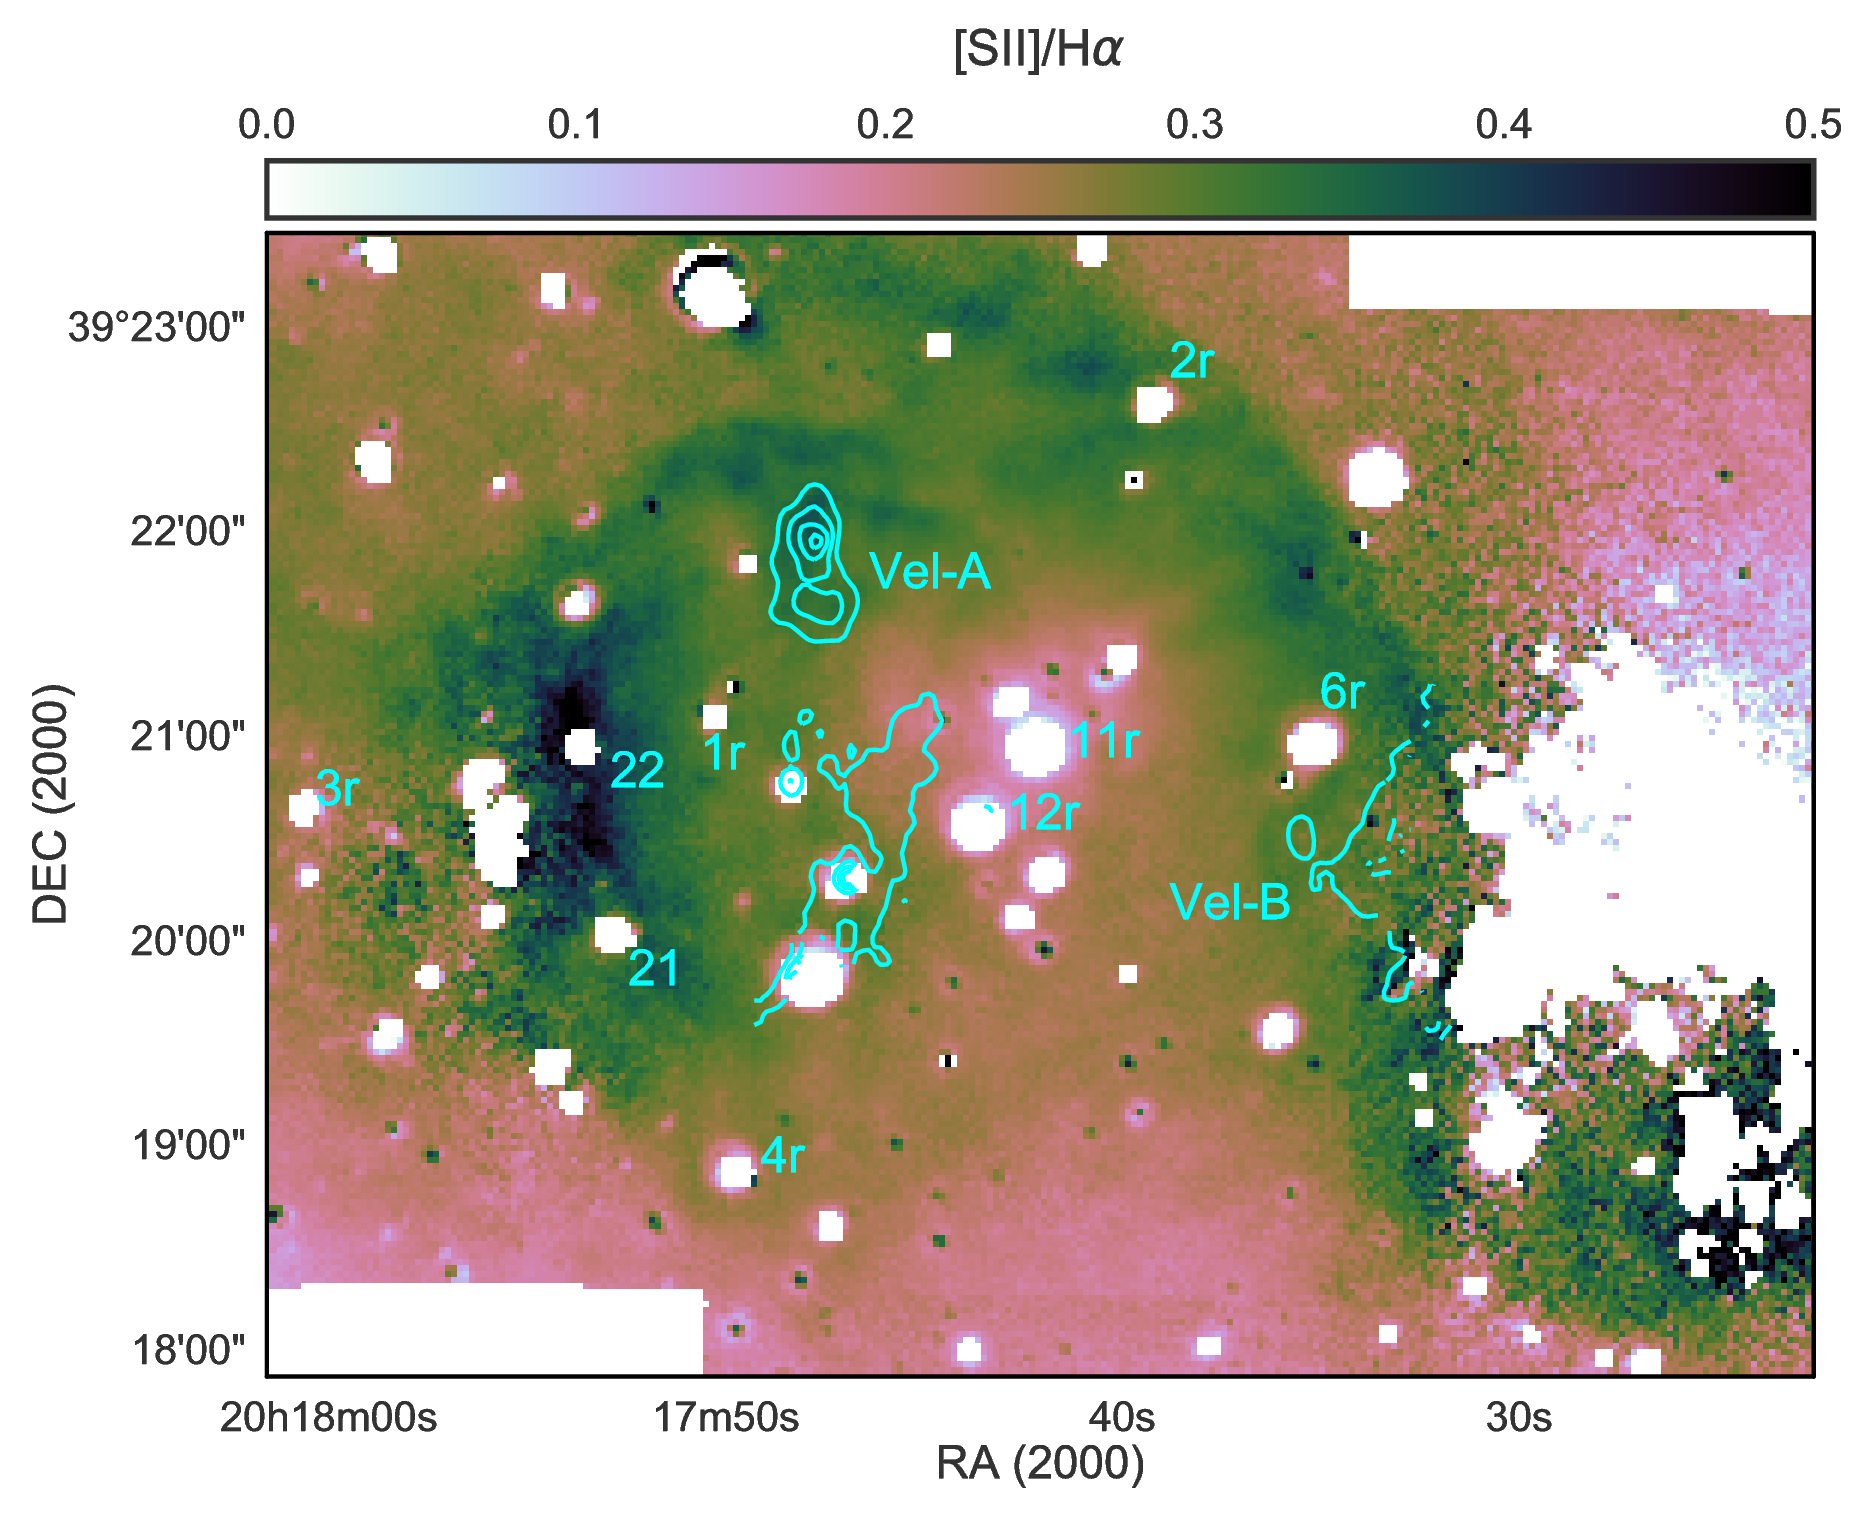
In Paper I, signatures of a weak shock were detected between Blob W and Blob E (Fig. 3, bottom), based on the distribution of the [S ii] H ratio (Allen et al., 2008). The shock front coincides with the faint [S ii] filament at the eastern part of the region (Fig. 2a). Signs of a shock wave are also visible around and inside the cavity (Fig. 3, bottom). The shock front to the north of the cavity looks like an extension of the shock front located between Blob W and Blob E. Note that, according to the analysis reported in Paper I, only the western part of the X-shaped structure with an increased [S ii] H ratio can be considered as an indication of a shock front.
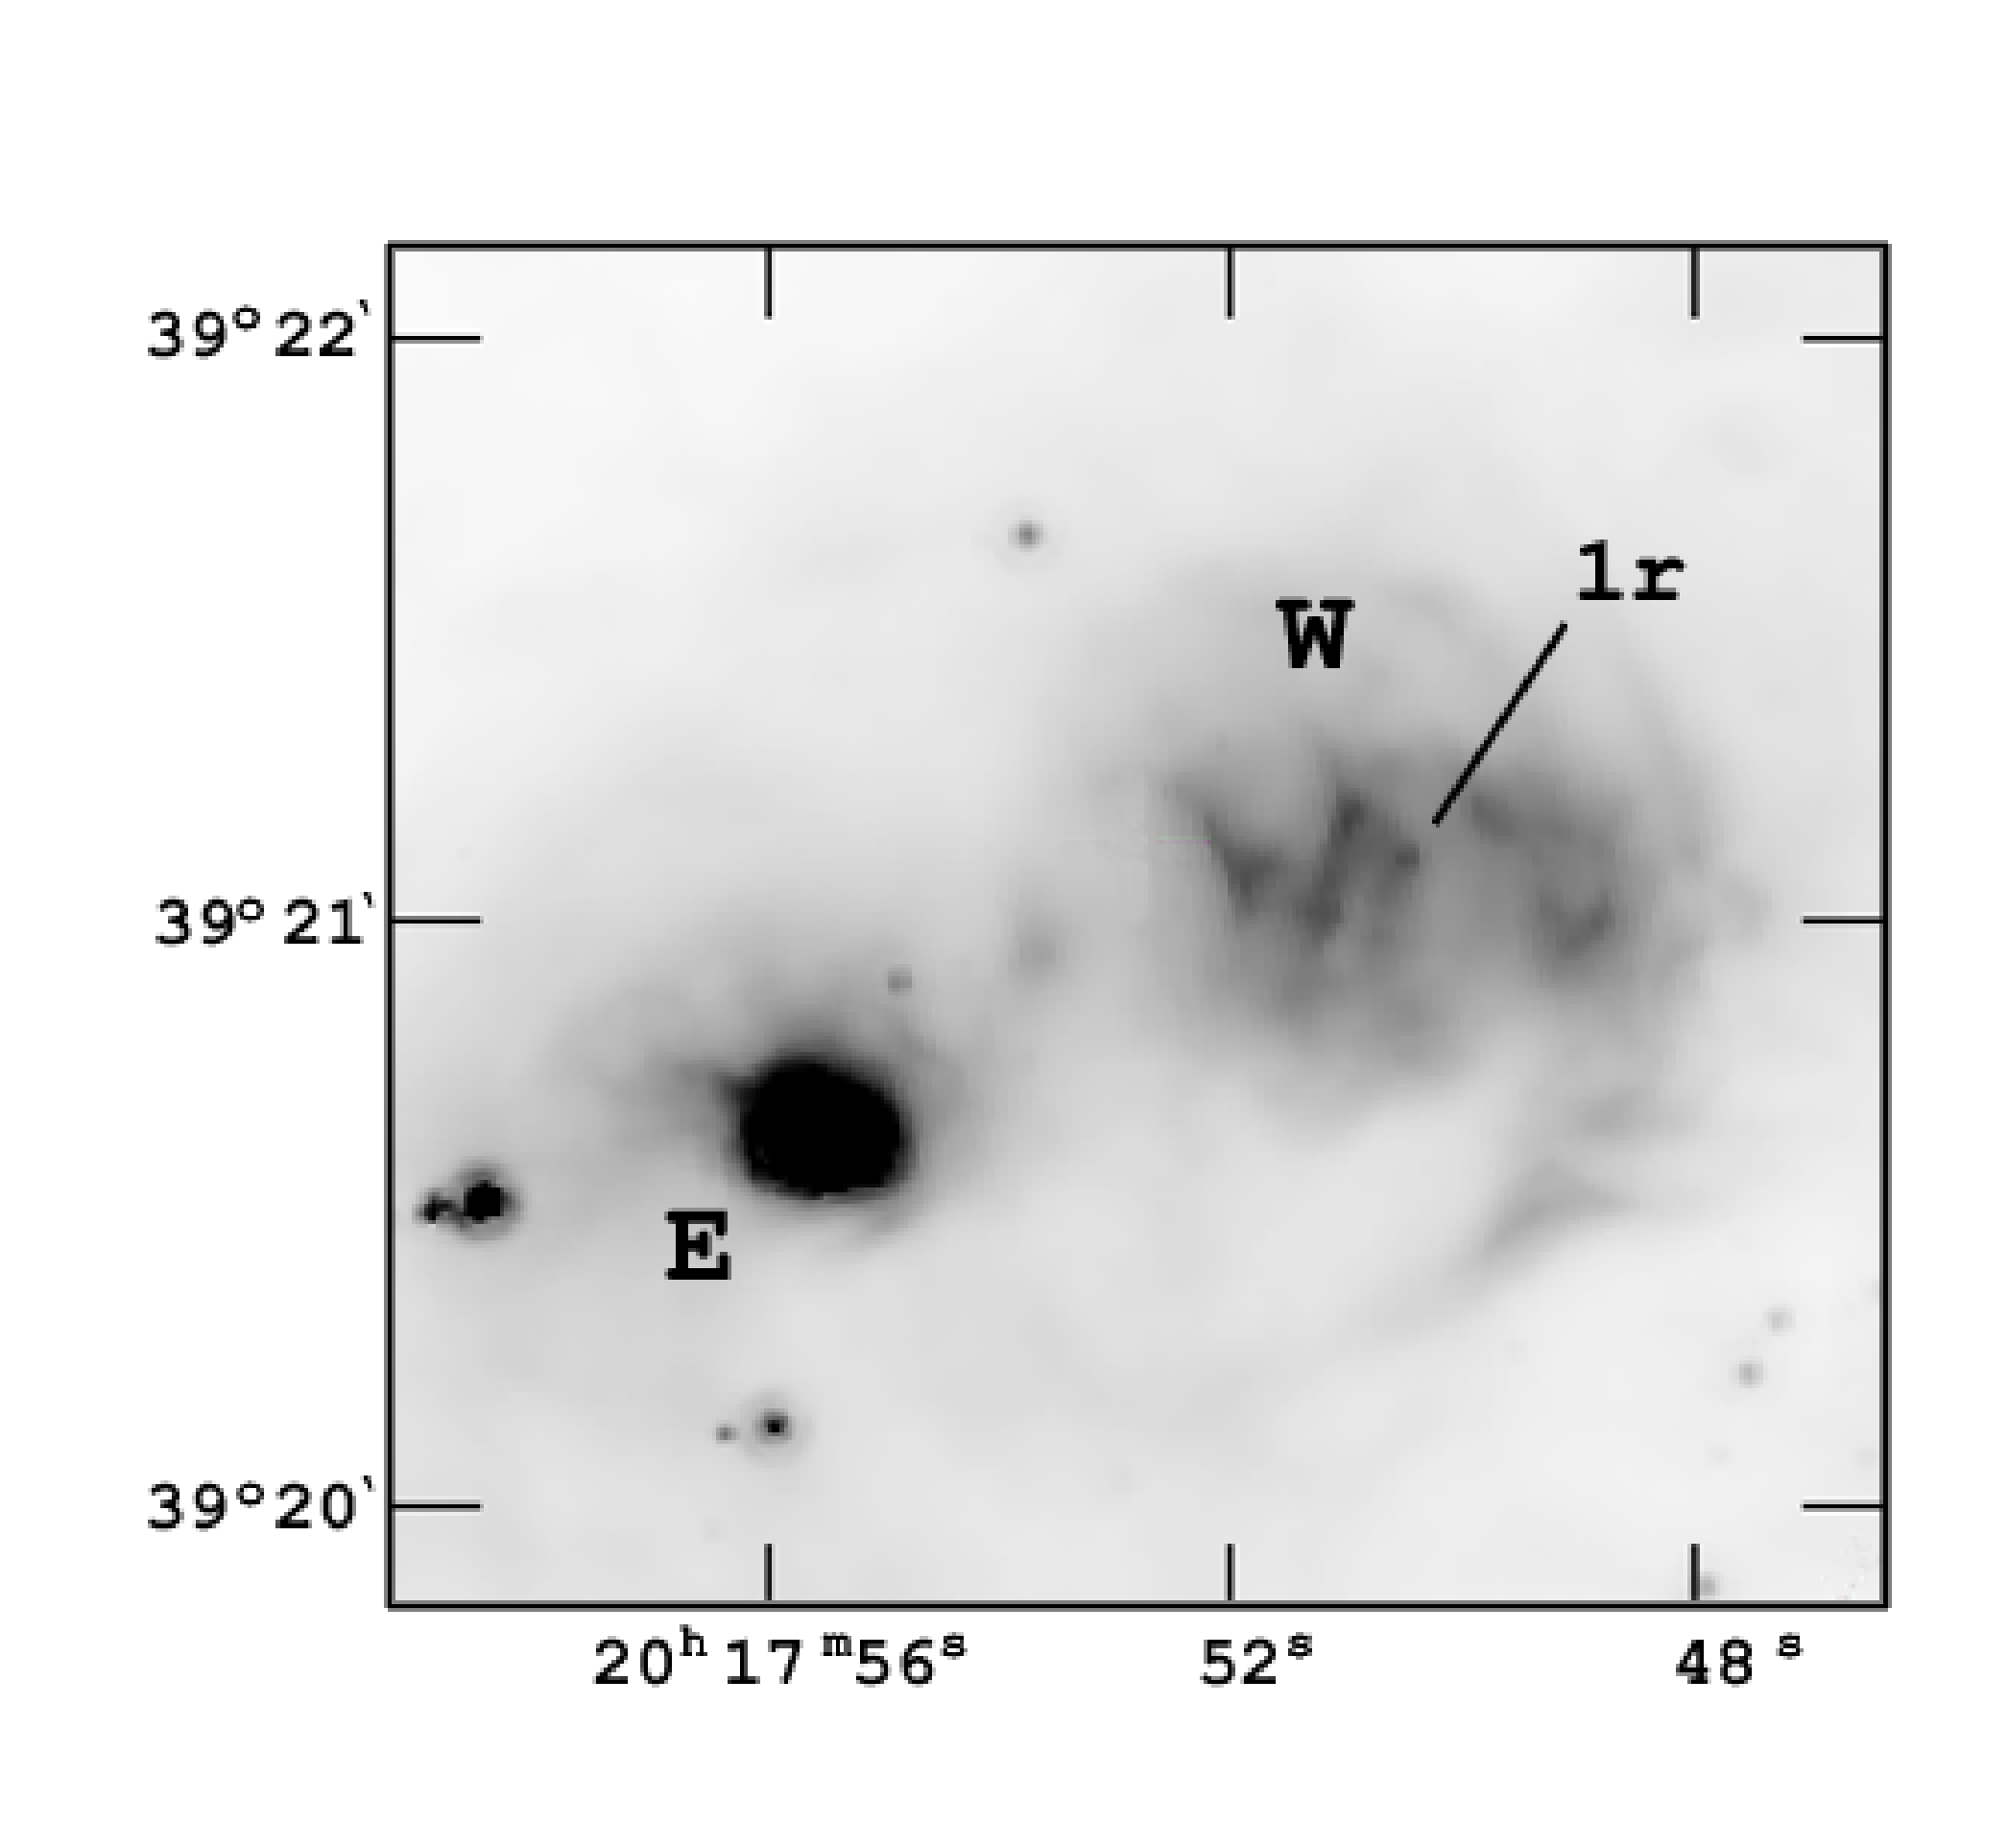
Blob W is located in the area affected by UV radiation and stellar winds from the cluster core. Traces of this influence are clearly seen in Fig. 4 (left). The brightest 8, 5.8 and 3.6 m band emission features in Blob W constitute a system of filaments visible in polycyclic aromatic hydrocarbon (PAH) emission and oriented approximately in the north-south direction. As is the case with ionized gas regions, PAH emission is dominant in the outer regions of the blobs and characterizes the blob shell, whereas hot dust emits at 24 m, primarily in the central parts of Blob W and Blob E (Fig. 1, bottom).
The cluster star 1r (B1V) (Racine, 1968; , 2016) and a Class I protostar (see Section 6) are located inside Blob W, ‘destroying’ it from inside (Fig. 4, right). The structure of Blob W is also clearly seen in the CO() 2.285 m band image of the region. A central cavity around the star is bounded from east and west by thin filaments surrounded by more diffuse CO emission, and opened from north and south. The CO filaments appear to border the 24 m emission and are spatially coincident with the 8 m filaments, possibly, representing the broken shell of the bubble. The CO 2.285 m band emission brightness depends on the medium density, and amplifies in a shock wave (Draine & Roberge, 1984). In our case, both conditions are satisfied: there are traces of a shock wave, and, according to the estimates of (2016), the density inside the blob is quite high as the extinction there amounts to about 10 mag.
4 Kinematics of ionized gas
In the top panel of Fig. 5 we show the distribution of line-of-sight velocities, , in the vicinity of vdB 130 obtained by fitting two single-component Voigt profiles to the observed [S ii] 6717,6731 Å line profiles in each pixel of the data cube. For comparison, the bottom panel of Fig. 5 demonstrates the IR image of the same region in the 8 m band. The region under investigation is bounded by the shock front from the east (from the side of the Cyg OB1 association) and by the IR shell enveloping the north-western ionization front (Paper I).
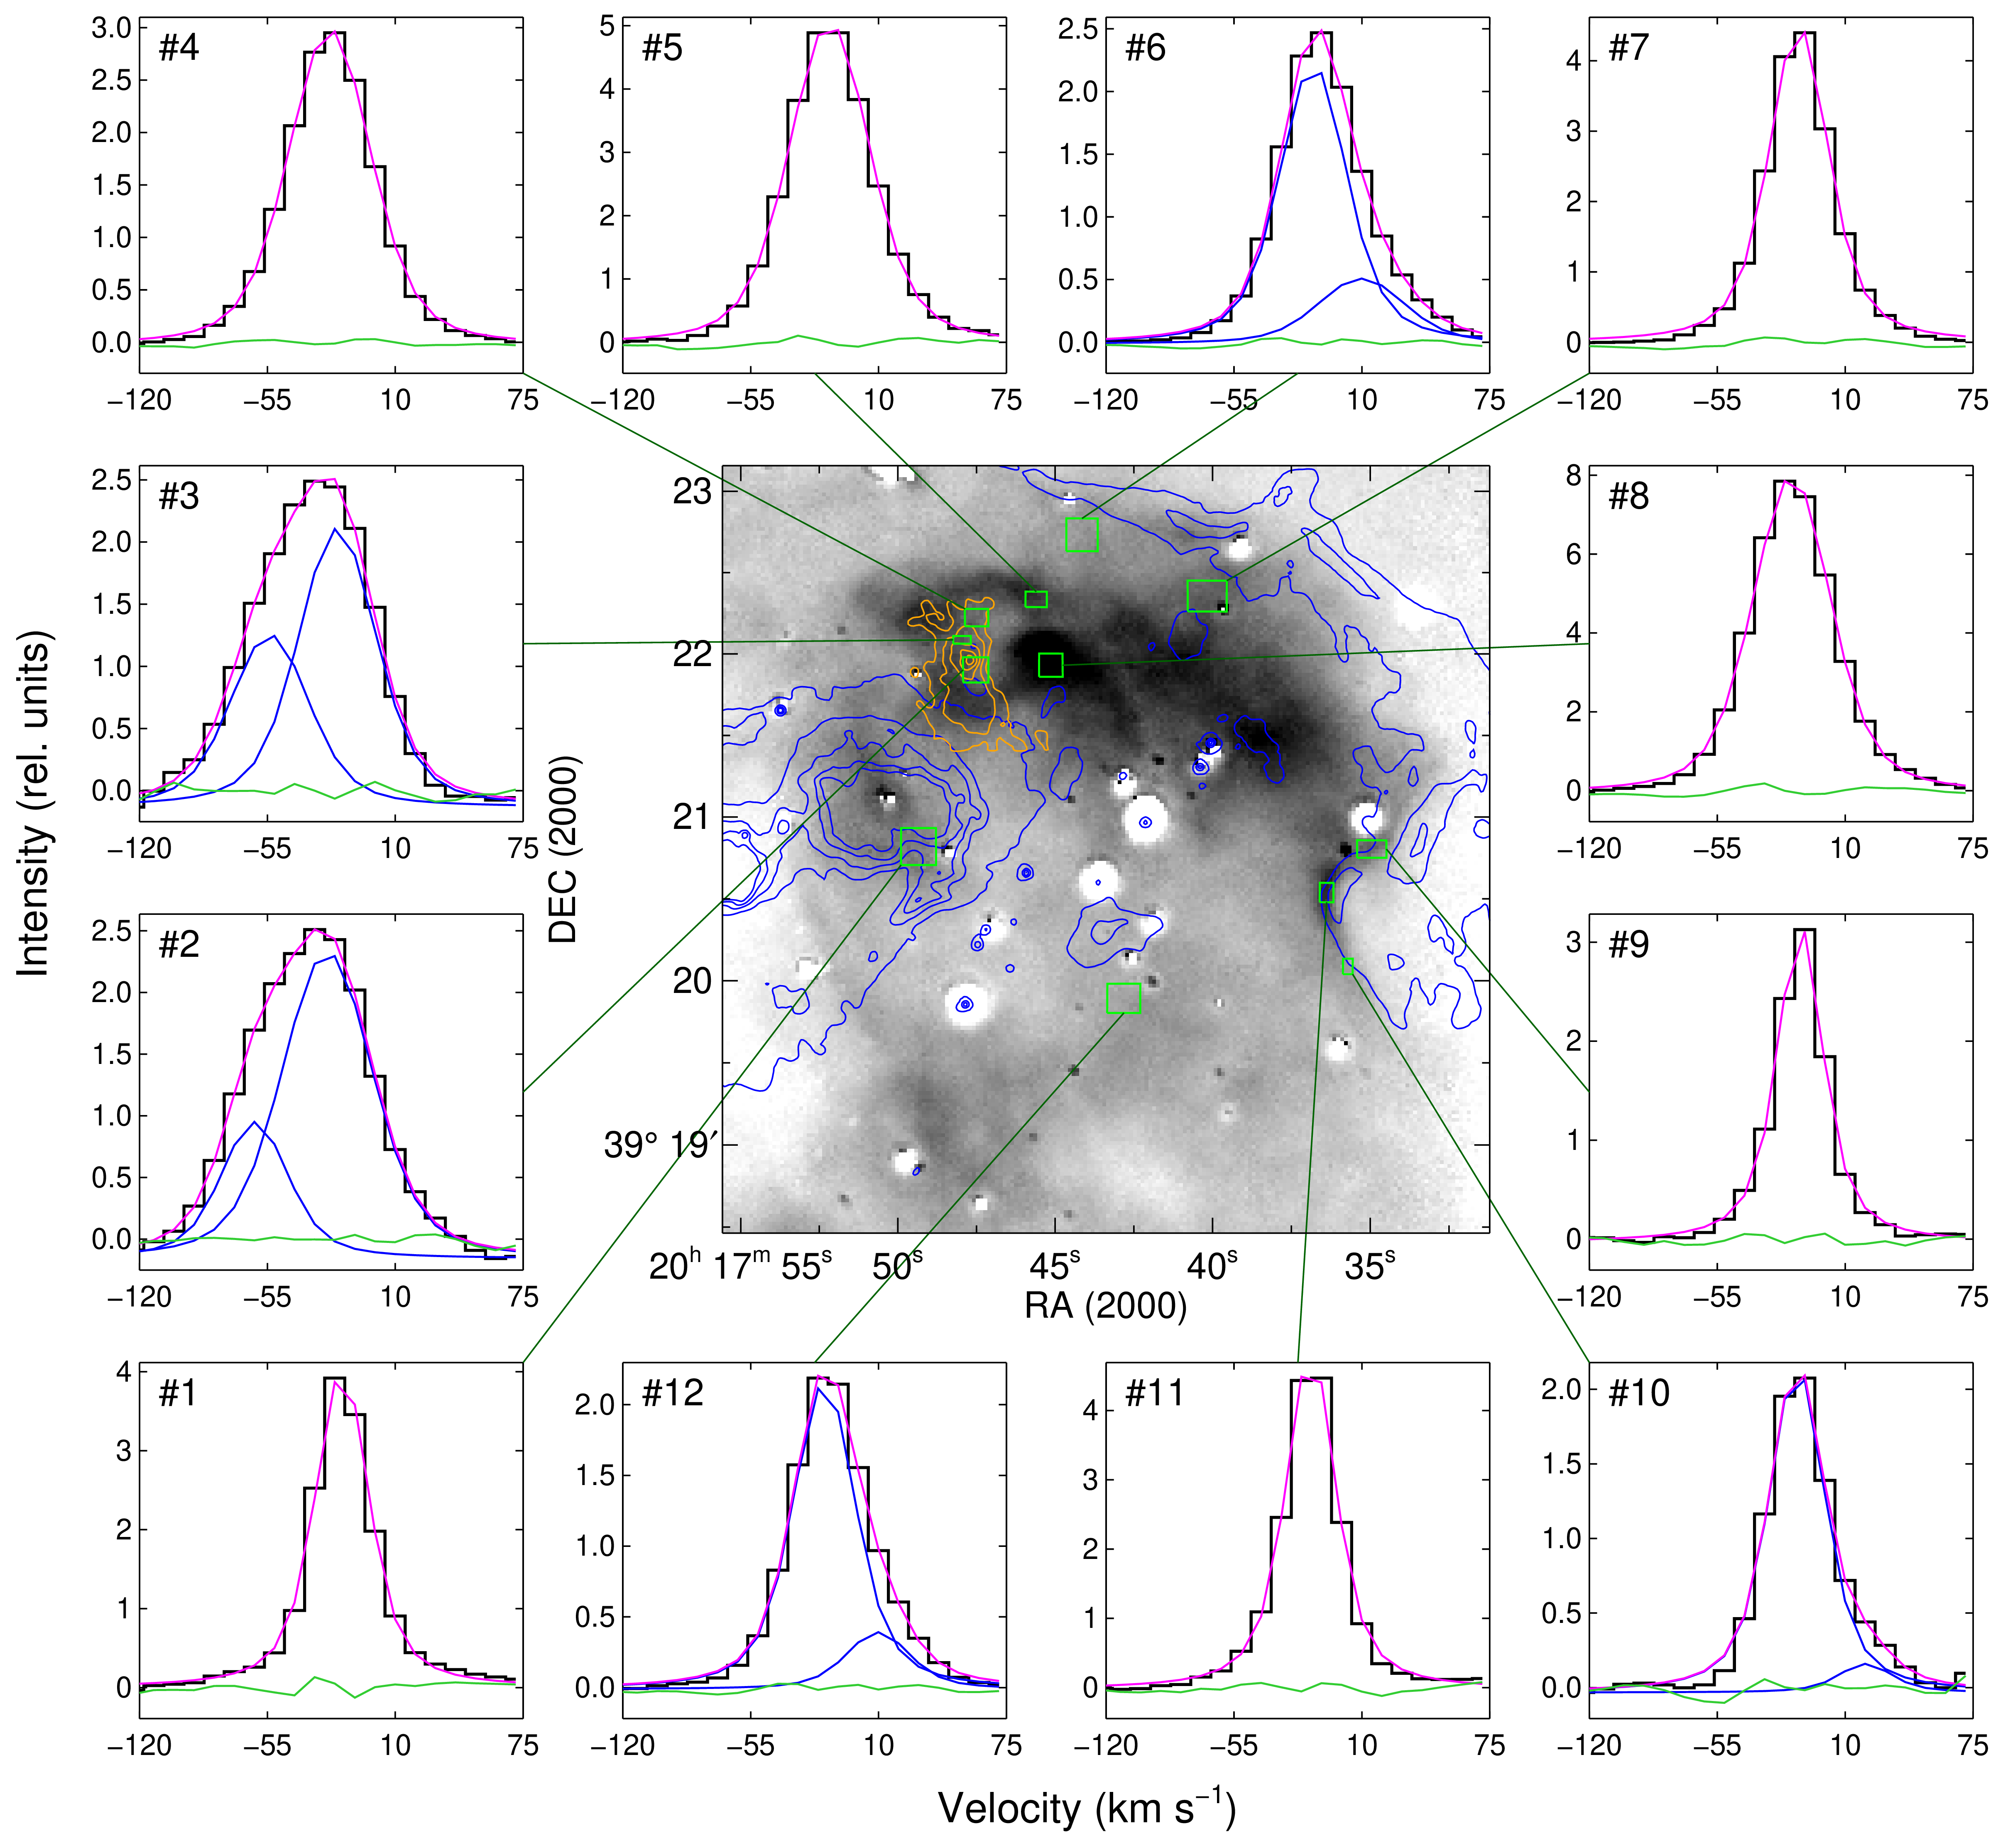
An analysis of the velocity field together with the line profiles decomposition revealed the following (Figs 5 and 6).
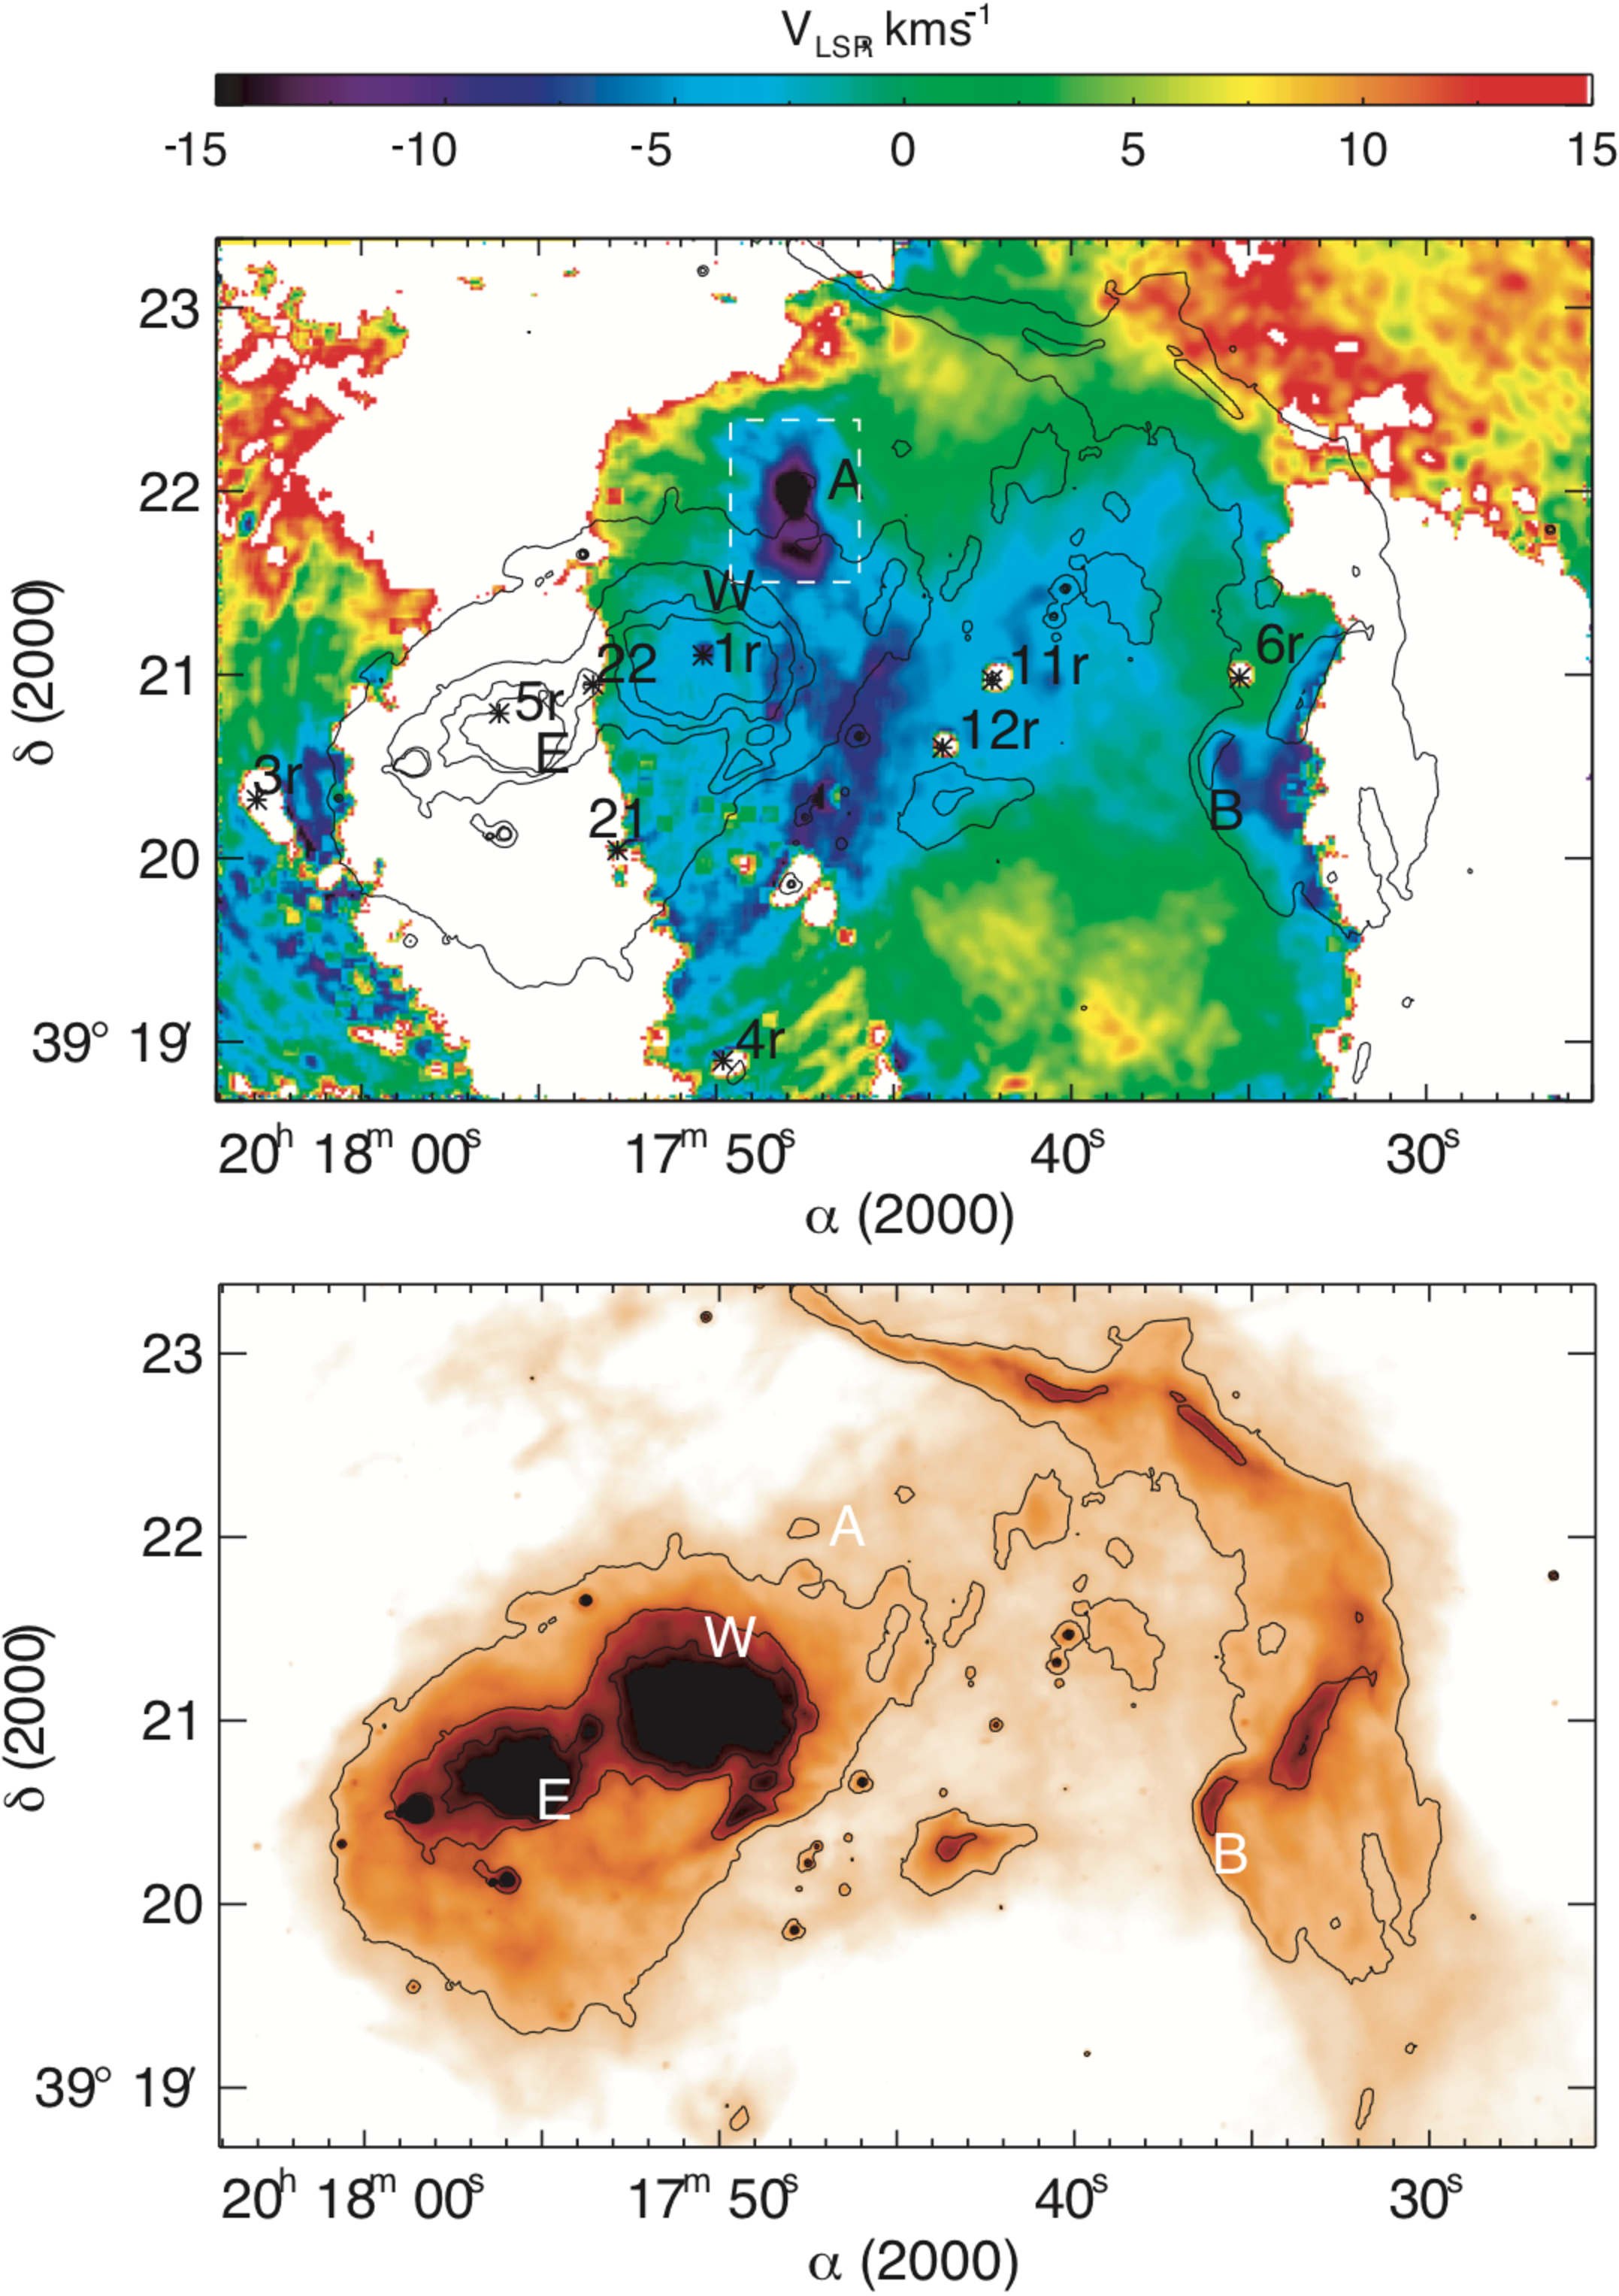
-
1.
In general, the [S ii] line profiles are symmetric, but in several locations they exhibit broadening or asymmetry and might be decomposed into two components with a velocity separation of up to (see Fig. 6, profiles #2, #3, #6, #10, #12).
-
2.
The range of the main component in the area is (green areas in Fig. 5, top). These values agree with the velocity estimates for the ionized hydrogen and the molecular cloud (see Paper I, and references therein). The main velocity component of H and CO lines, observed outside the cluster in the direction of the molecular cloud, corresponds to . (In this direction galactic rotation velocities are positive up to a distance of 5 kpc.)
-
3.
In the vicinity of the B-stars 11r and 12r (in H Blob), velocities of are dominant.
-
4.
is observed in Blob W. However, as for most of the [S ii] line observations within the blob, accurate velocity measurements are impossible. Ionized gas emits at velocities of to the south-west of Blob W (outside the crescent-shaped IR filament). The same velocities, , are observed in the direction of some parts of the crescent-shaped filament itself.
- 5.
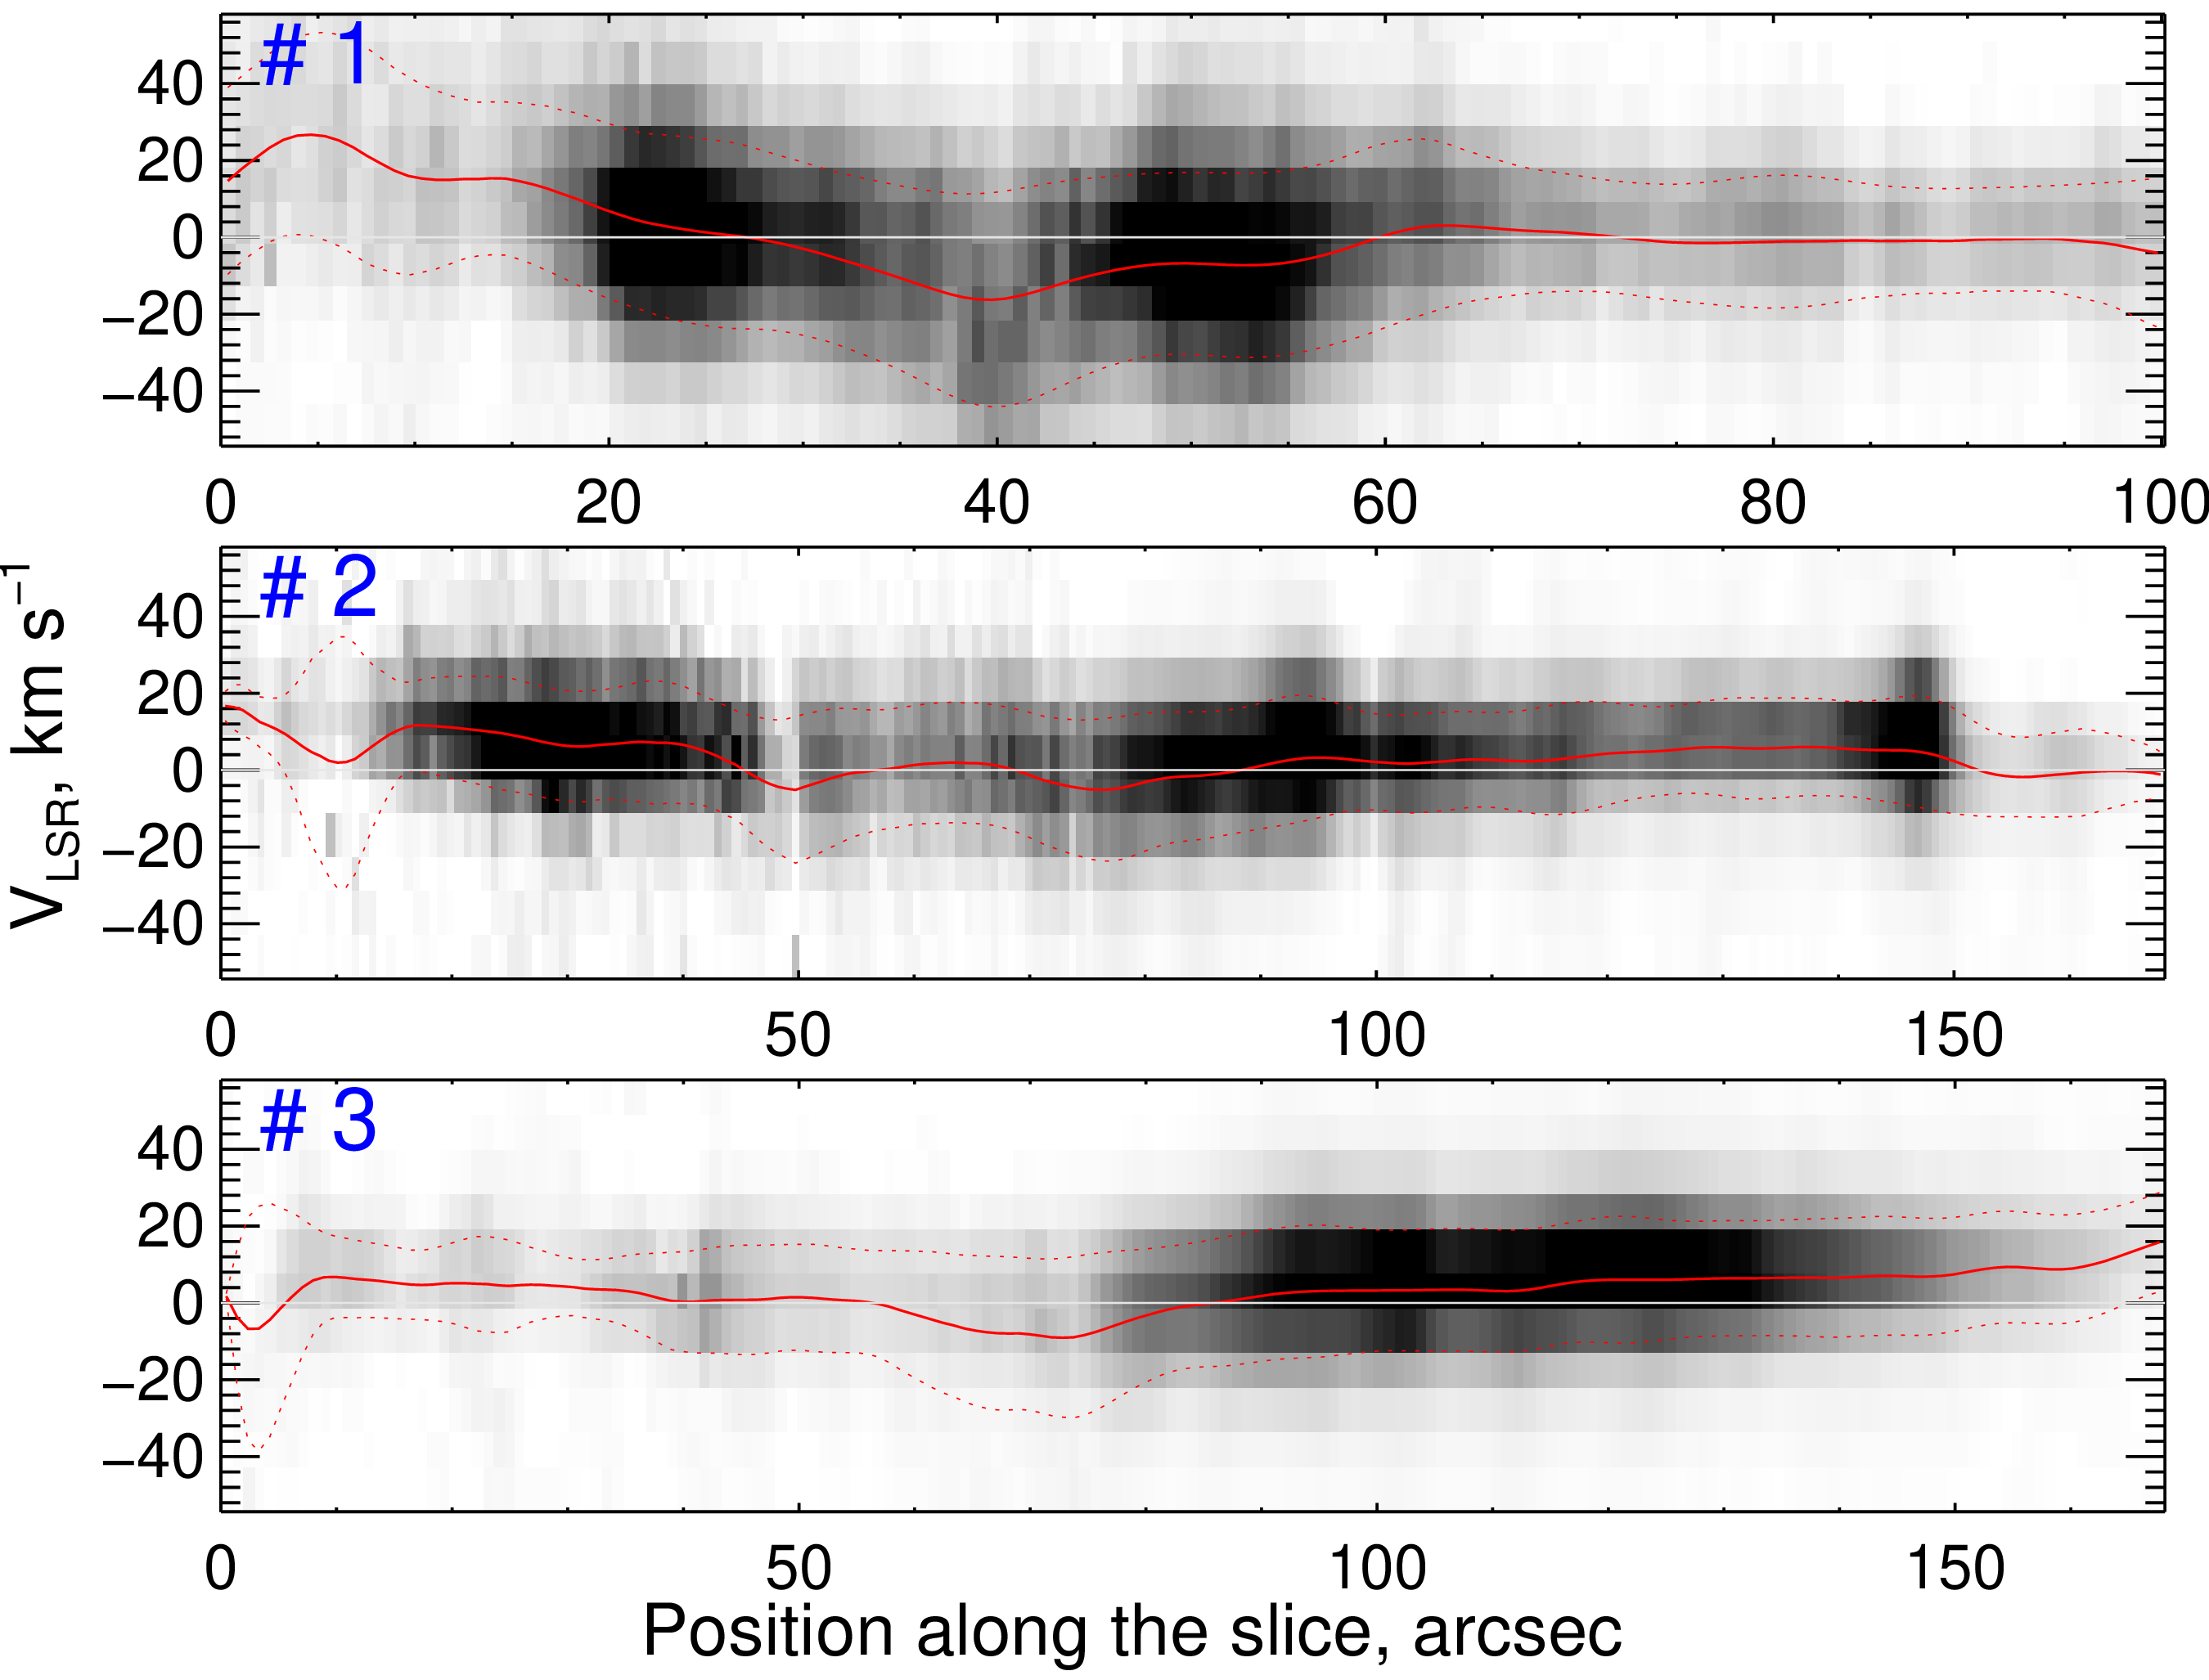
An outline of region Vel-A in Fig. 8a is eight-shaped. The plotted position-velocity (PV) diagrams for this region clearly reveal an approaching part of the velocity ellipse (diagram #1 in Fig. 7). The mean ionized gas velocity in the northern part of the ‘eight’, which coincides with the cavity, and in the southern wall of the cavity. The size of the high-velocity area is arcmin ( pc). The velocity dispersion in region Vel-A is equal to , which is far greater than anywhere inside the IR shell.
Region Vel-B is located in the direction of the IR shell at velocities in the range of (see top panel in Fig. 5 and 145–148 arcsec positions on PV-diagram #2 in Fig. 7). Region Vel-B is coincident with a thin filament emitting in the IR and all the considered visual band lines.
Thus, in the vicinity of the cluster, we see variations in the line-of-sight velocity of ionized sulphur from to . Regions with dominant motions (shown by cyan-blue in Fig. 5a) generally coincide with the [O iii] emission areas (Fig.2c). As follows from PV-diagram #3 in Fig. 7, the gas inside the IR shell around stars 11r and 12r expands with a velocity of up to (Fig. 1 bottom, see also Fig. 12d in Paper I). This conclusion is consistent with the assumption on the expansion of the H Blob and the IR shell around vdB 130 core B-stars and its interaction with Blob W (see Paper I). In some directions (Fig. 6, profiles #6, #12) we observe two-component profiles that may correspond the approaching and the receding walls of the shell. Presumably, it is the influence of the wind and radiation of the cluster core stars that is responsible for the formation of the shock between the blobs.
Note that the large scatter of the main component radial velocities may hamper distinguishing between local low-velocity motions (like the expansion of H Blob) and those on a large scale, determined by galactic rotation.
5 On the origin of the shock waves in region Vel-A
The vdB 130 cluster neighbourhood is a compact region of ongoing star formation in the supershell around the Cyg OB1 association, populated by young stars, which actively interact with the surrounding inhomogeneous interstellar medium. Tracing individual relations between various components of the complex is fairly hard. We therefore consider different possible explanations for the nature of the detected high-velocity motions of ionized gas.
5.1 What do we know about region Vel-A
The region is distinguished by the highest negative radial velocities (Fig. 8, top left) over the entire vdB 130 cluster area. The following additional peculiarities are observed in the direction of region Vel-A:
- 1.
- 2.
- 3.
- 4.

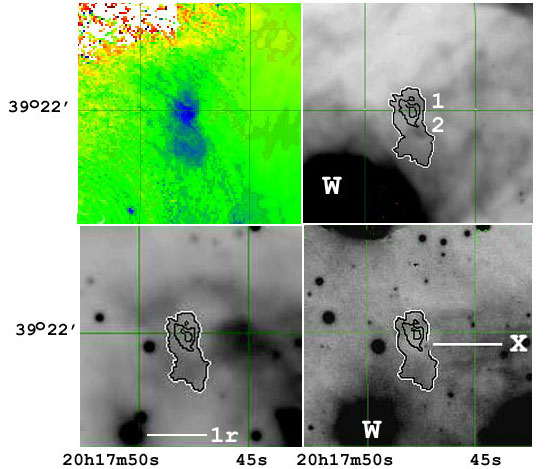
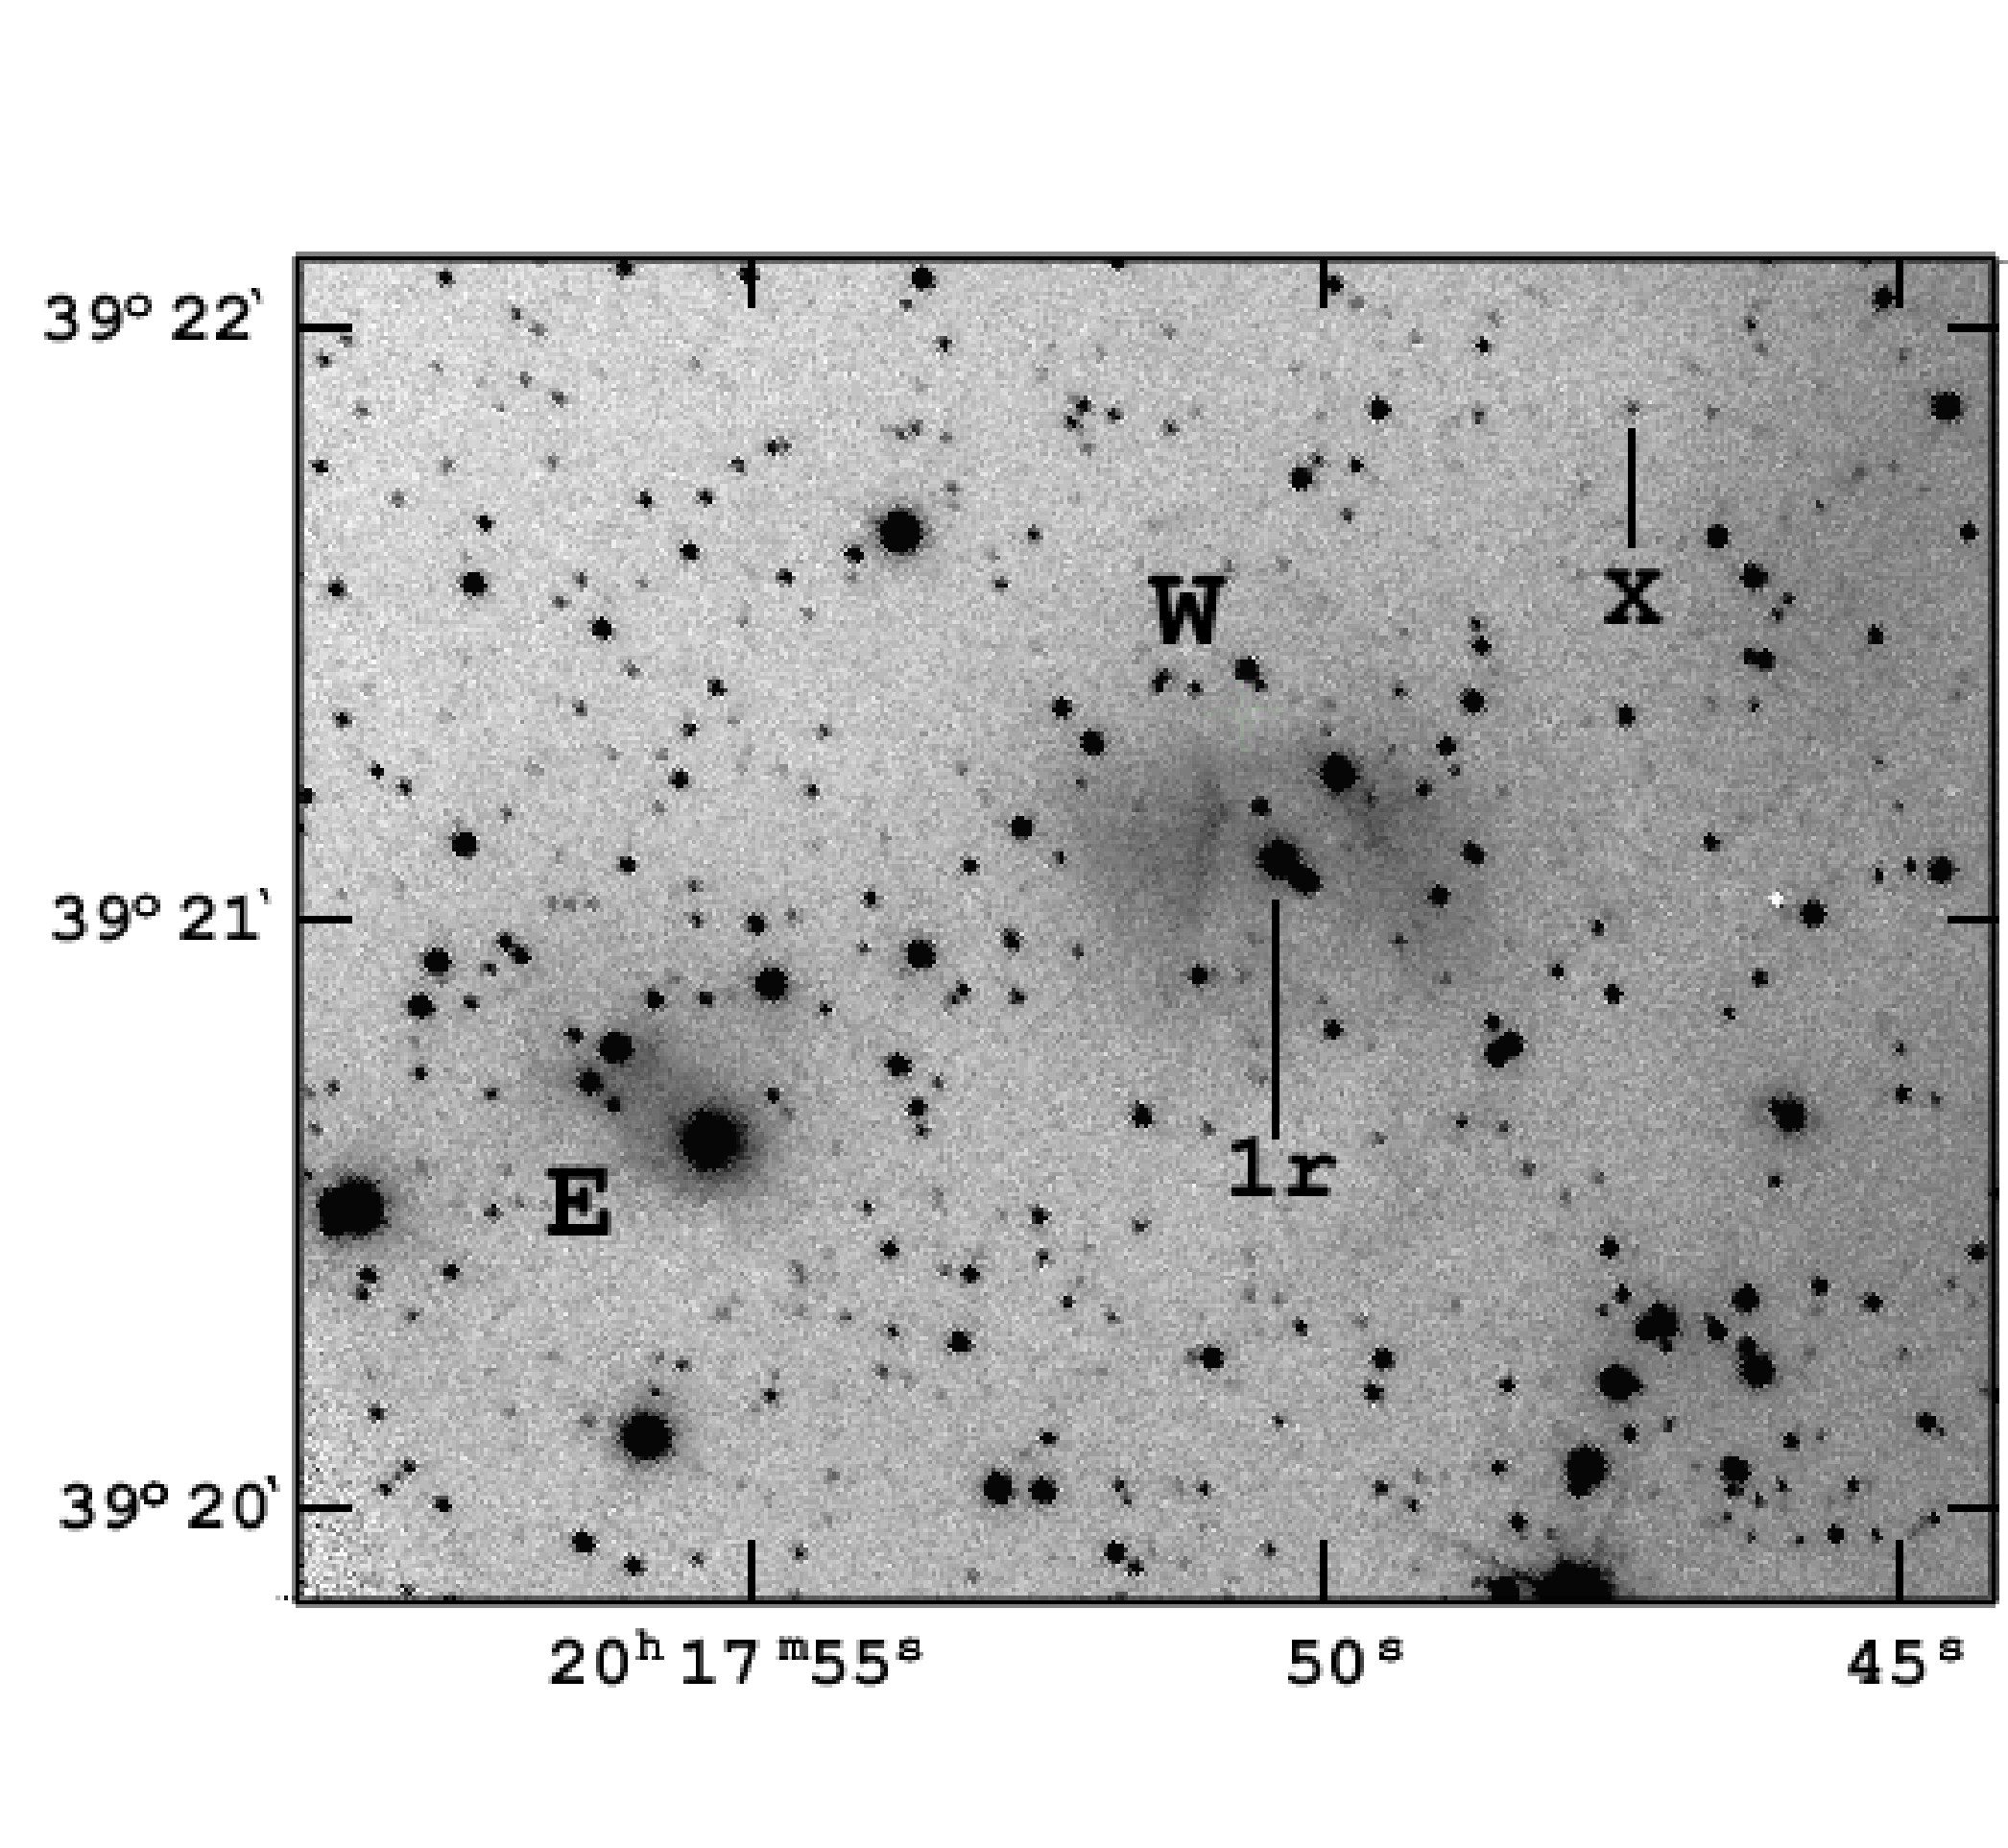
We have detected neither any point sources (Class I-III protostars), nor any stars brighter than mag (or K mag) inside the region Vel-A. A sole exception is a point source X () located near the western edge of the southern lobe (Figs 2c and 4). In the optical band, this source stands out only in [O iii] images and in JHK bands; it is also visible at the limit of sensitivity in 3.6 and 4.5 m Spitzer bands. The source X is most probably a star with a chance projection of a foreground dust clump. This star is therefore observed through a layer of absorbing material. However, we were not able to determine whether or not it belongs to the cluster.
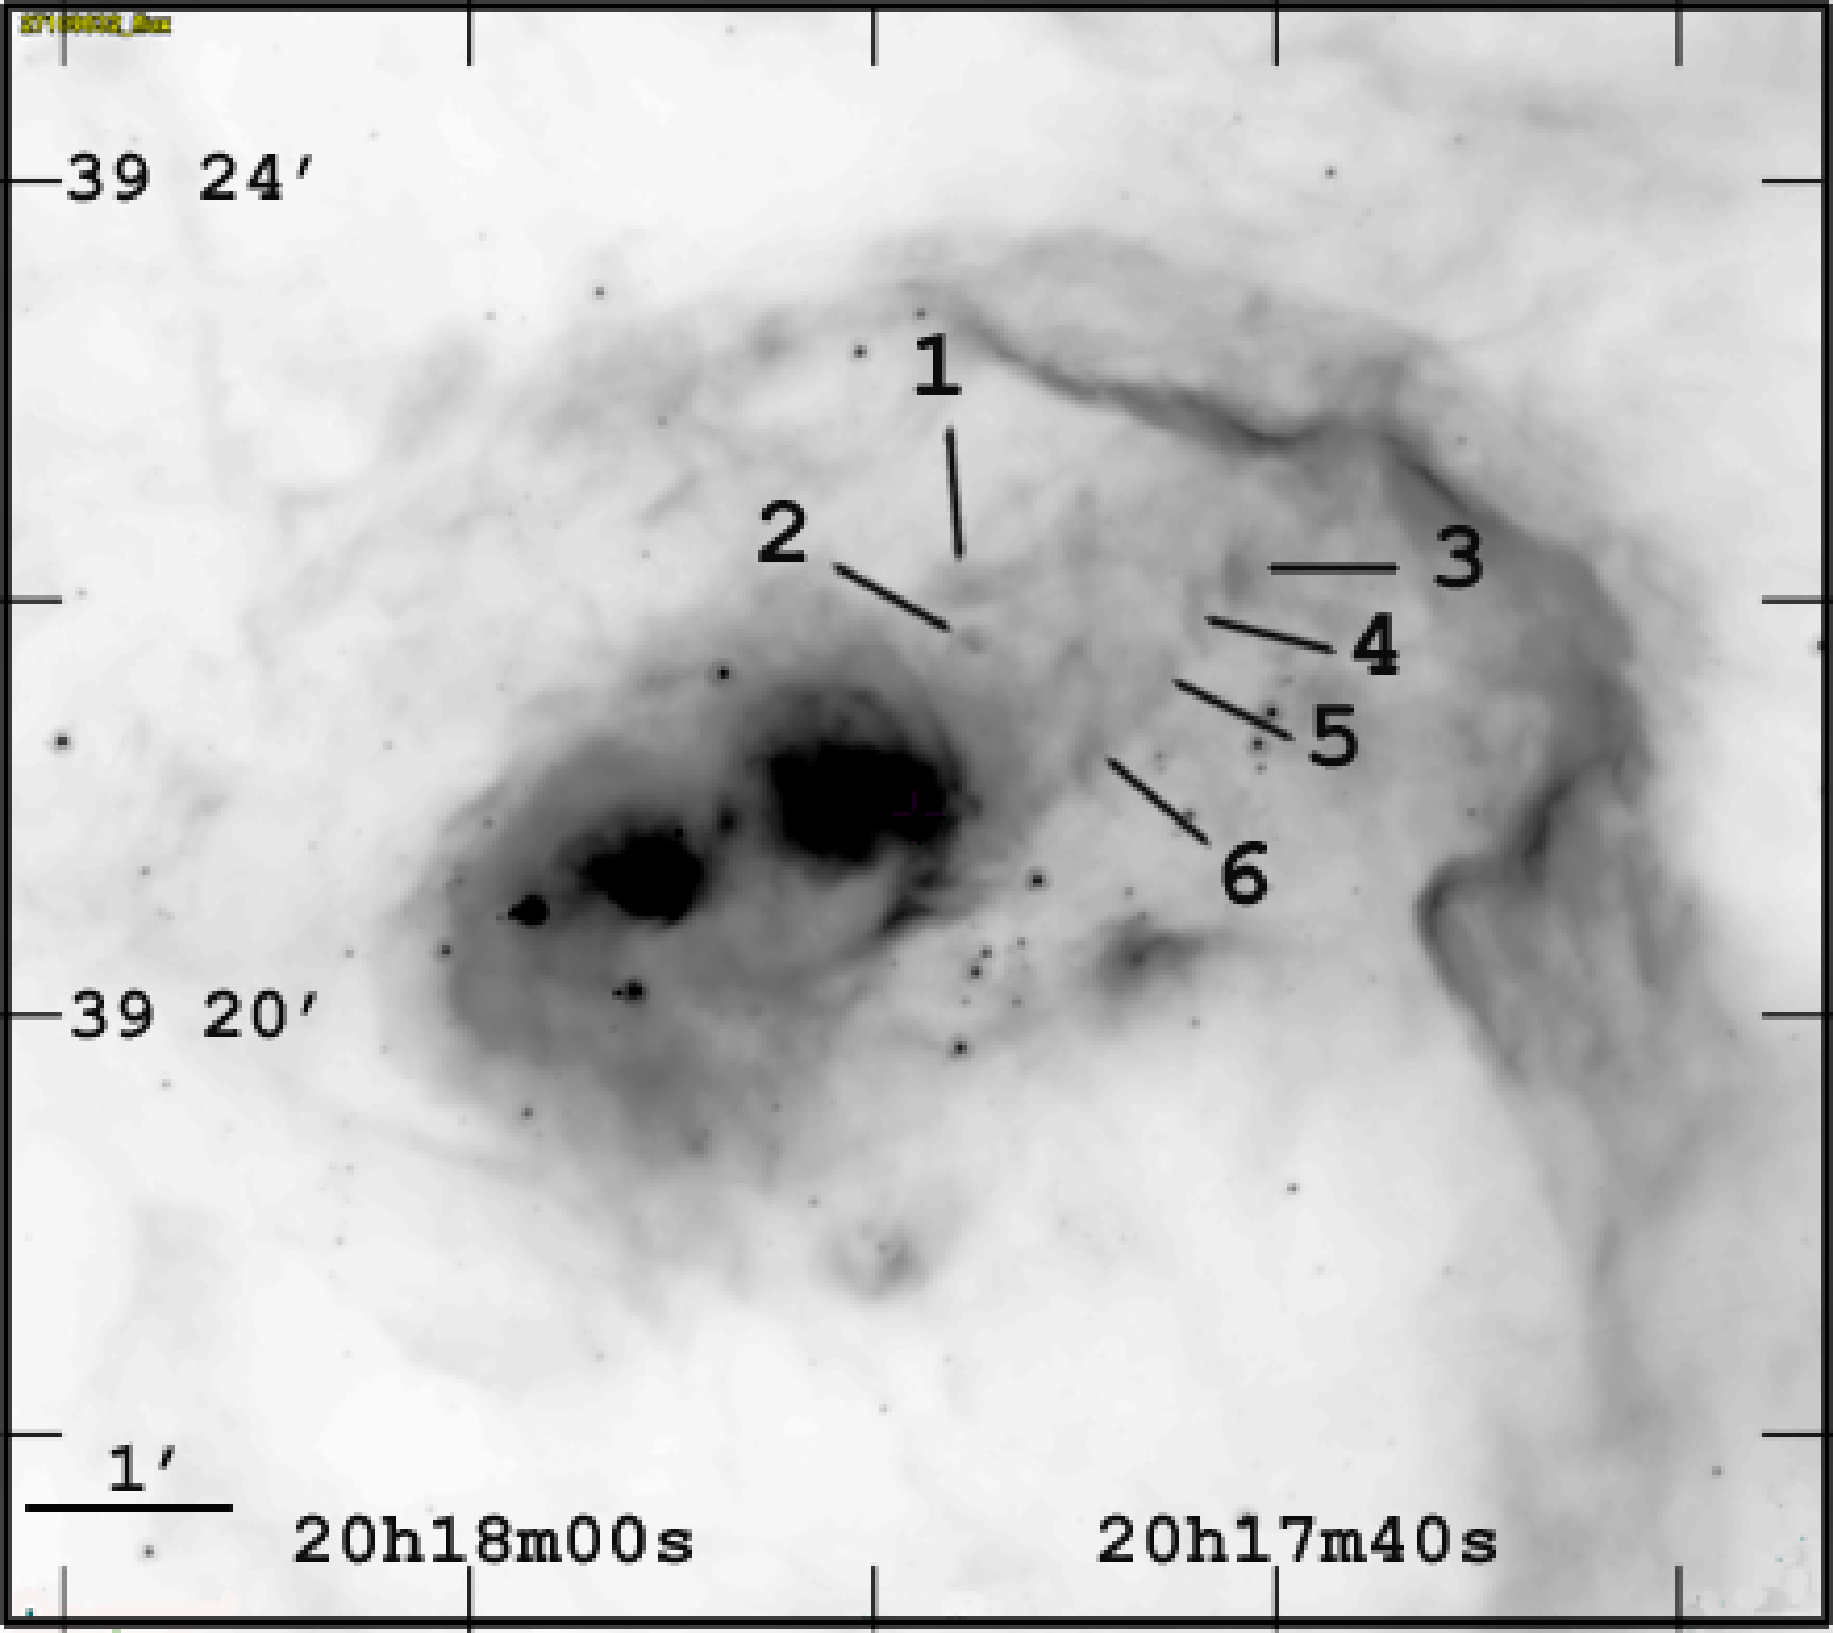
Considering the fact that the two IR emission spots (Fig. 8, top right) are projected onto the region Vel-A, we searched for possible embedded sources in the dust clumps. We plotted the spectral energy distributions (SEDs) for spots 1 and 2 and also for four other IR emission spots located along the northern boundary of the molecular cloud (Fig. 9, top) as well as for several less bright areas in the vicinity of these spots. The surface brightness of these spots in the range 3.6 m – 8 m was measured with a arcsec aperture. For the 24 m band, 10 arcsec aperture was used. The size of the aperture was chosen so that the visible boundaries of the spots were outside it. The background was determined outside the IR shell. The [3.6] – [4.5] and [4.5] – [5.8] colours were estimated using the normalizing data from Gutermuth et al. (2008).
Fig. 9, bottom, shows the SEDs of all the spots investigated. The curves are normalized to spectral density at a wavelength of 8 m. The SEDs in all the marked areas have similar shapes. The deviation of the points from the average value in the 3.5 – 8 m range does not exceed 10%. The accuracy decreases in the 24 m band due to the smaller angular resolution. Such a similarity of the SEDs for different spots and also for the common IR shell may hint at the similarity of physical conditions or, specifically, may be an indication of the absence of bright embedded objects. However, we should note that we have only constructed SEDs for m that may not be sufficient to detect deeply embedded sources.
Since the shapes of the SEDs of all the investigated IR spots look alike, we can estimate the typical values of the corresponding colour indices, mag, mag. Correction of the colour indices for interstellar extinction using (, 2016) yields mag and mag. According to the colour index diagram presented by Ybarra et al. (2014) (see their Fig. 1), colours of all the shown IR spots are consistent with those of PDRs with a cloud thickness of mag in front of the far-UV source. This fact also agrees with the assumption of the ongoing star formation in the region.
5.2 Possible origin of regions Vel-A and Vel-B
5.2.1 Region Vel-A as a result of the influence of a wind from a young star onto the ISM
Considering the fact that the high-velocity pc sized region Vel-A is partly projected onto a cavity with a size of pc (Fig. 8), the most likely cause of the supersonic motions there can be attributed to stellar wind. Traces of a faint shock wave have indeed been detected inside this cavity and in the northern part of its shell (Fig. 3, bottom, see also Paper I), which agrees with the supersonic velocities of ionized sulphur found here independently: inside the cavity (between IR spots 1 and 2) and at the outskirts (see 20–50 arcsec positions on PV-diagram #1 in Fig. 7).

The observed average velocity gradient towards the centre of the cavity, the velocity ellipse, and a confident decomposition into two components allow us to conclude that the peculiarity of region Vel-A may be related to the expanding local shell of ionized gas, albeit the source of the radiation and stellar wind is unclear. The only point source inside the cavity is the source X mentioned above. We do not know, however, if this source is a star belonging to the cluster. According to the DSS catalog and our own optical images, there are no other point sources in the cavity brighter than 23 mag. One should not rule out, though, that in this area with high and inhomogeneous extinction the source of stellar wind may be hidden by a compact gas-dust knot (Racine, 1968; , 2016). For example, mag would be sufficient for a B2-star located at the distance of the cluster to have mag.
The radial velocity distribution in the southern part of the ‘eight’ has some interesting features (Fig. 8, top left). Smaller radial velocities (grey-green details) are observed in the direction of the centre of IR spot 2, compared to those at the outskirts of the ‘eight’ (blue details). Such a radial velocity distribution suggests that a hypothetical star is located behind a dust clump, where the shock wave propagates slower due to a higher density. In other words, the southern IR feature (spot 2) may be a line-of-sight cloud located in front of the point source, but still in the vicinity of vdB 130 (top right panel of Fig. 8).
Possibly, for that same reason of high and inhomogeneous interstellar matter density in the region we see only the wall of the shell around the cavity, approaching us at a supersonic speed. Note also that the ‘optical’ cavity is partly filled with dust clumps, namely IR spots 1 and 2, although we cannot rule out that these spots are located in the front wall of the expanding cavity shell.
As for the Vel-B region, it is in an expanding shell. Perhaps here we observe the ionized gas flow around a small protrusion of part of the PDR of the western rim of the shell (Fig. 3,top). As a result, the line-of-sight projection of the shell expansion velocity increases. And we see both negative and positive components of the velocity (see Fig. 6, spectrum #10, and Fig. 7, PV diagram #2).
5.2.2 Region Vel-A as a result of an outflow from a protostellar disc
While a wind hypothesis seems to be a preferable one, we cannot completely ruled out that the observed line-of sight velocities in region Vel-A (Fig. 8a) may have arisen due to a bipolar outflow from the disc of a Class 0 protostar (see, e.g. Frank et al., 2014). In our case, both the northern and southern parts of region Vel-A demonstrate negative average line-of sight velocities ( and ), and the of the main gas component due to the galactic rotation is equal to . Such a line-of sight velocity distribution can indeed be attributed to bipolar outflow, if the disc is tilted by a small angle to the plane of the sky, and the outflowing gas propagates in a solid angle whose projection onto the plane is more than twice the tilt angle.
However, bipolar outflows from discs of Class 0 protostars are observed in molecular SiO and CO lines, as well as those of atomic oxygen (Frank et al., 2014). In our case, the supersonic velocity region is seen in the ionized sulphur lines (the maximum line-of-sight velocity relative to the main component is , see decomposition of [S ii] line profiles #2 and #3 in Fig. 6.). One might suggest that the ejected ‘cold’ material, moving at supersonic speeds, could have heated to sulphur ionization temperatures due to collisions with dense interstellar clouds. Also, region Vel-A is located within the range of influence of UV radiation and winds from the vdB 130 cluster stars, so that we cannot exclude their contribution to the outflow ionization (see also McLeod et al., 2015).
6 Young stellar objects towards the vdB 130 star cluster
Four evolutionary stages can be distinguished among young stellar objects (YSOs). The objects corresponding to these stages are attributed to Classes 0, I, II and III (Lada, 1987, 2005). Class 0 sources are very faint at wavelengths less than 10 m, but have considerable luminosities in the sub-millimetre range. Unlike these objects, those of Class I are much brighter in the IR range. However, it is impossible to distinguish between these two classes of objects with only IR data available. Therefore, Class 0 protostars might be present among the selected YSOs of Class I.
The objects of most interest to our investigation are the YSOs of Class I and Class II. To separate them, we used the results of photometry in four IRAC bands, carried out based on the Spitzer CygnusX Legacy Project (Hora et al., 2011) survey. The catalog with selected point sources and their photometry is available on the project website666http://irsa.ipac.caltech.edu/cgi-bin/Gator/nph-dd.
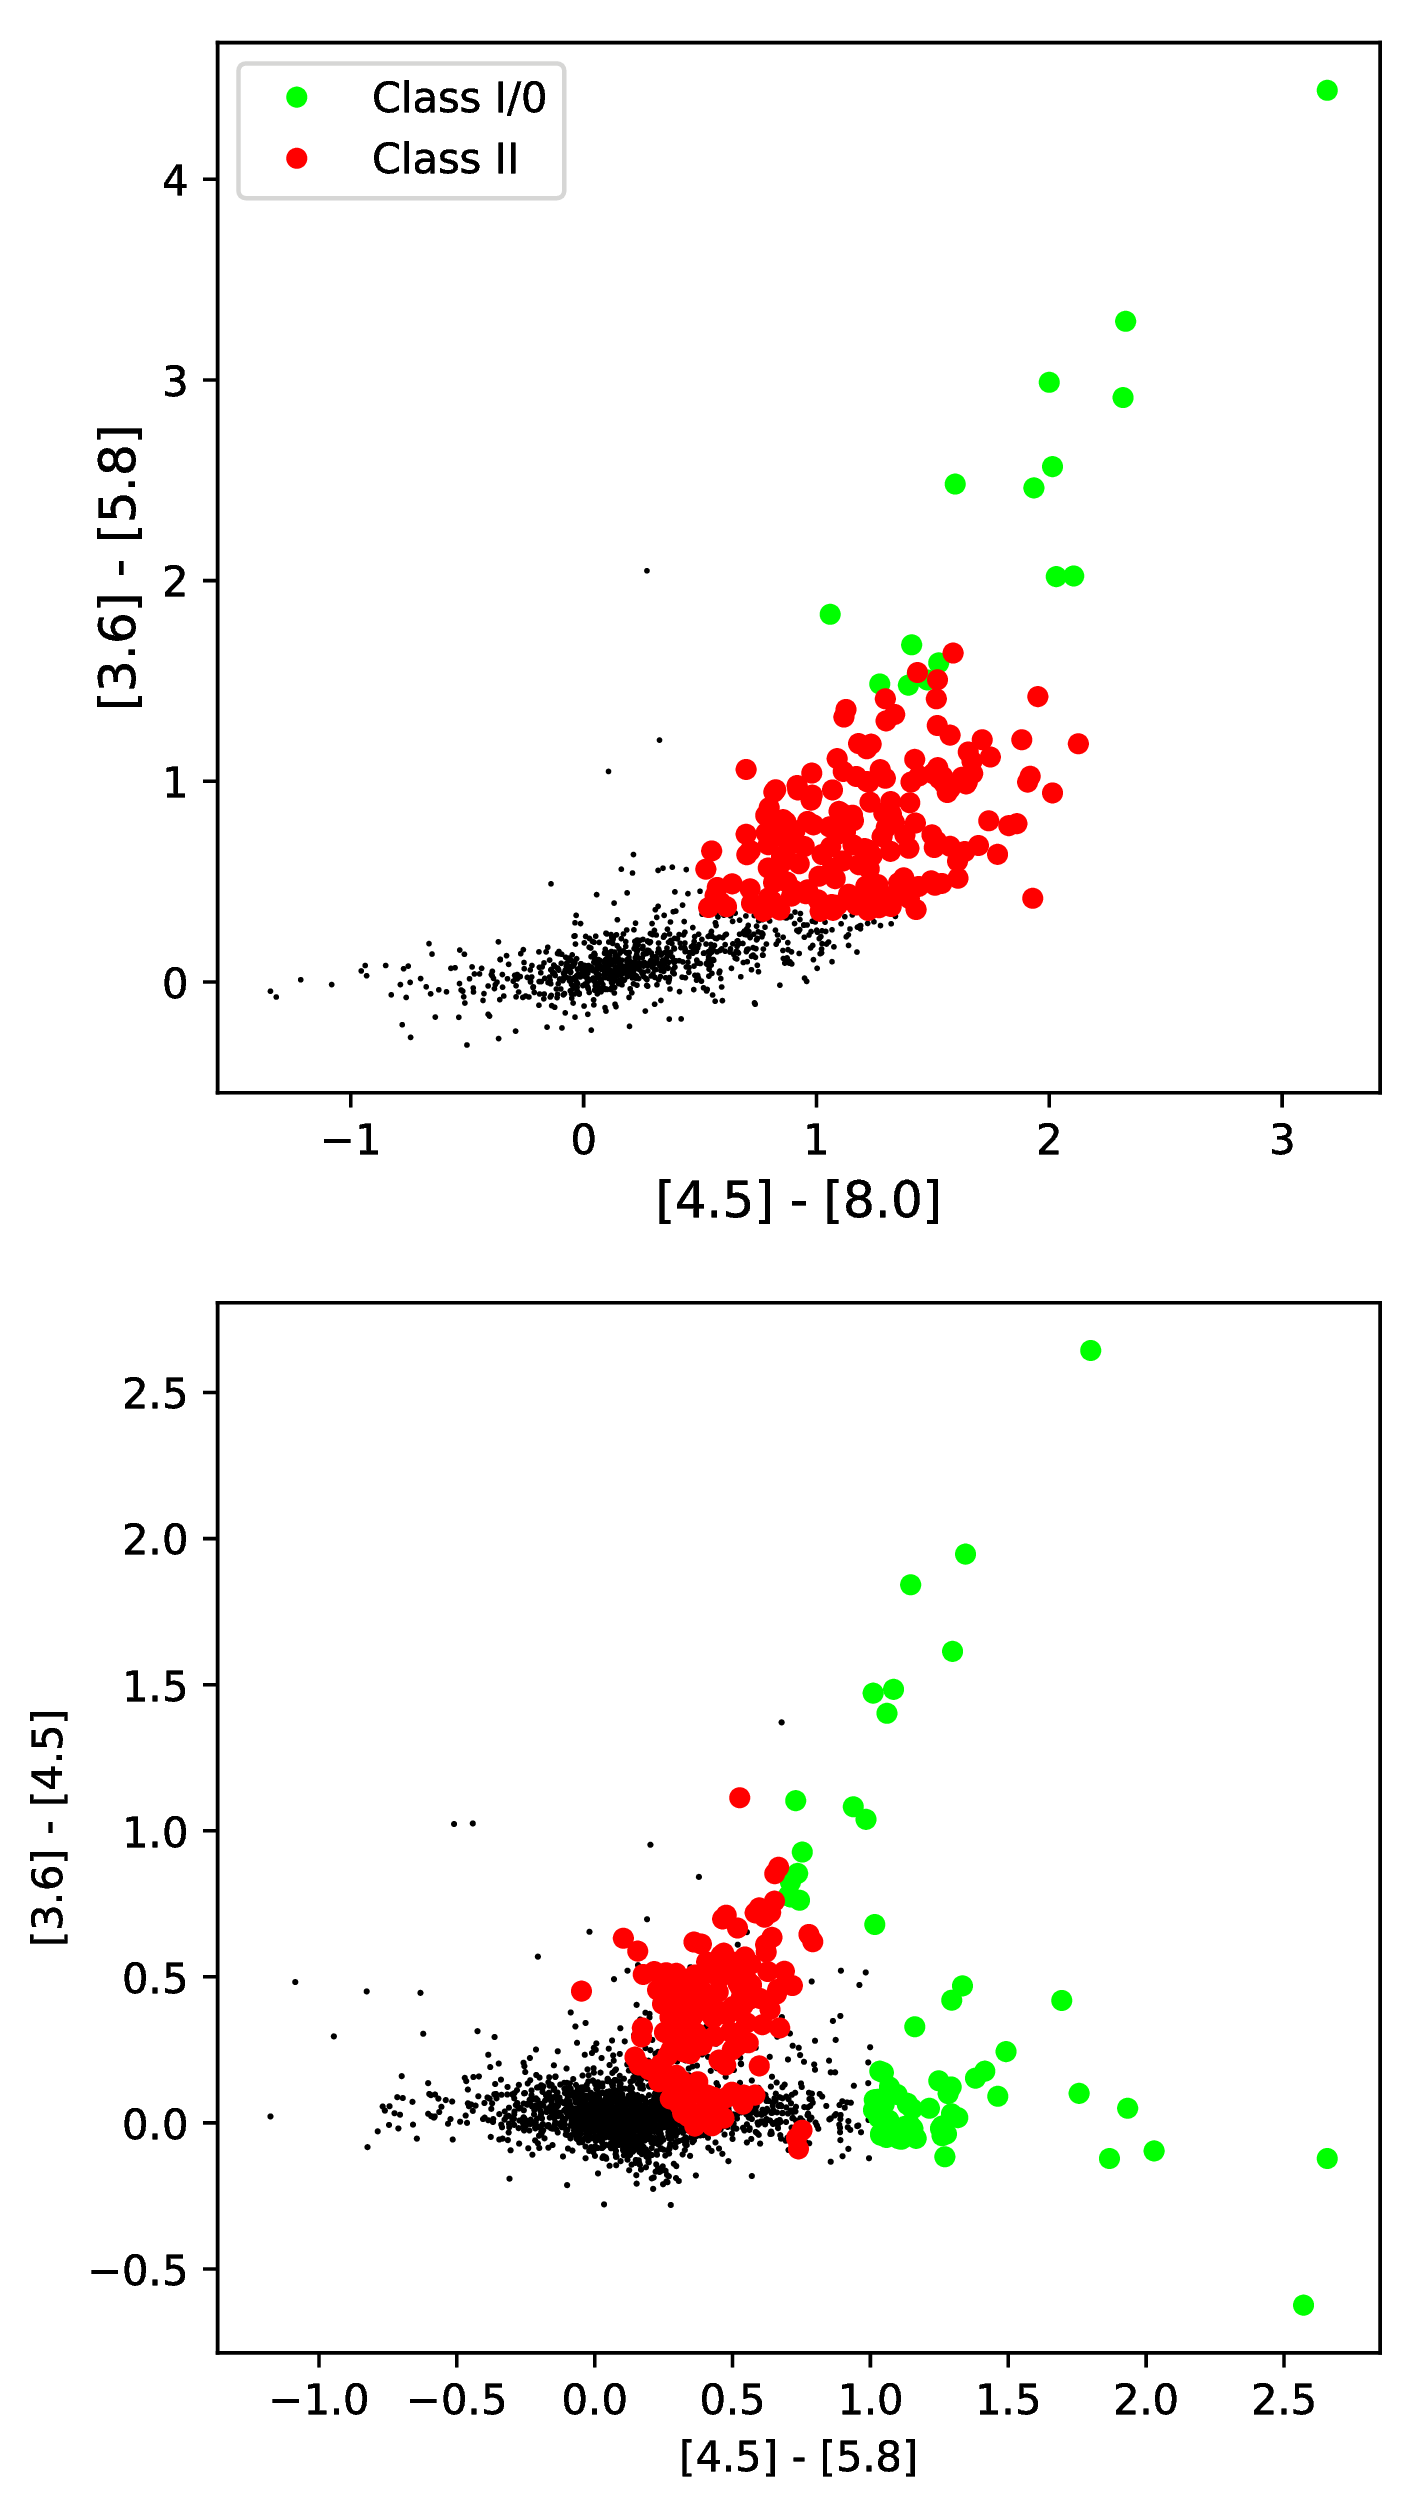
According to the point source catalog, 59 sources with measured magnitudes in 3.6, 4.5 and 5.8 m bands777Note that many of the remain sources in catalogue have no listed magnitudes in 8 m band. We leave them for analysis because this band is not used in the identification of the Class I objects. The number of identified Class II objects does not change if we exclude these sources. are observed in the studied region around the vdB 130 cluster. To single out the Class I and II YSOs, we used the method proposed by Gutermuth et al. (2008). First, we excluded the extragalactic sources (241 such sources were discovered) and unresolved shock knots (3 source) based on their colours (see details in sec. 4.1 and appendix of Gutermuth et al. 2008). We then selected 69 Class I objects (shown in blue) and 176 Class II objects (red) based on their positions on the colour-colour diagrams (Fig. 10). The remaining sources are either field stars or Class III objects.
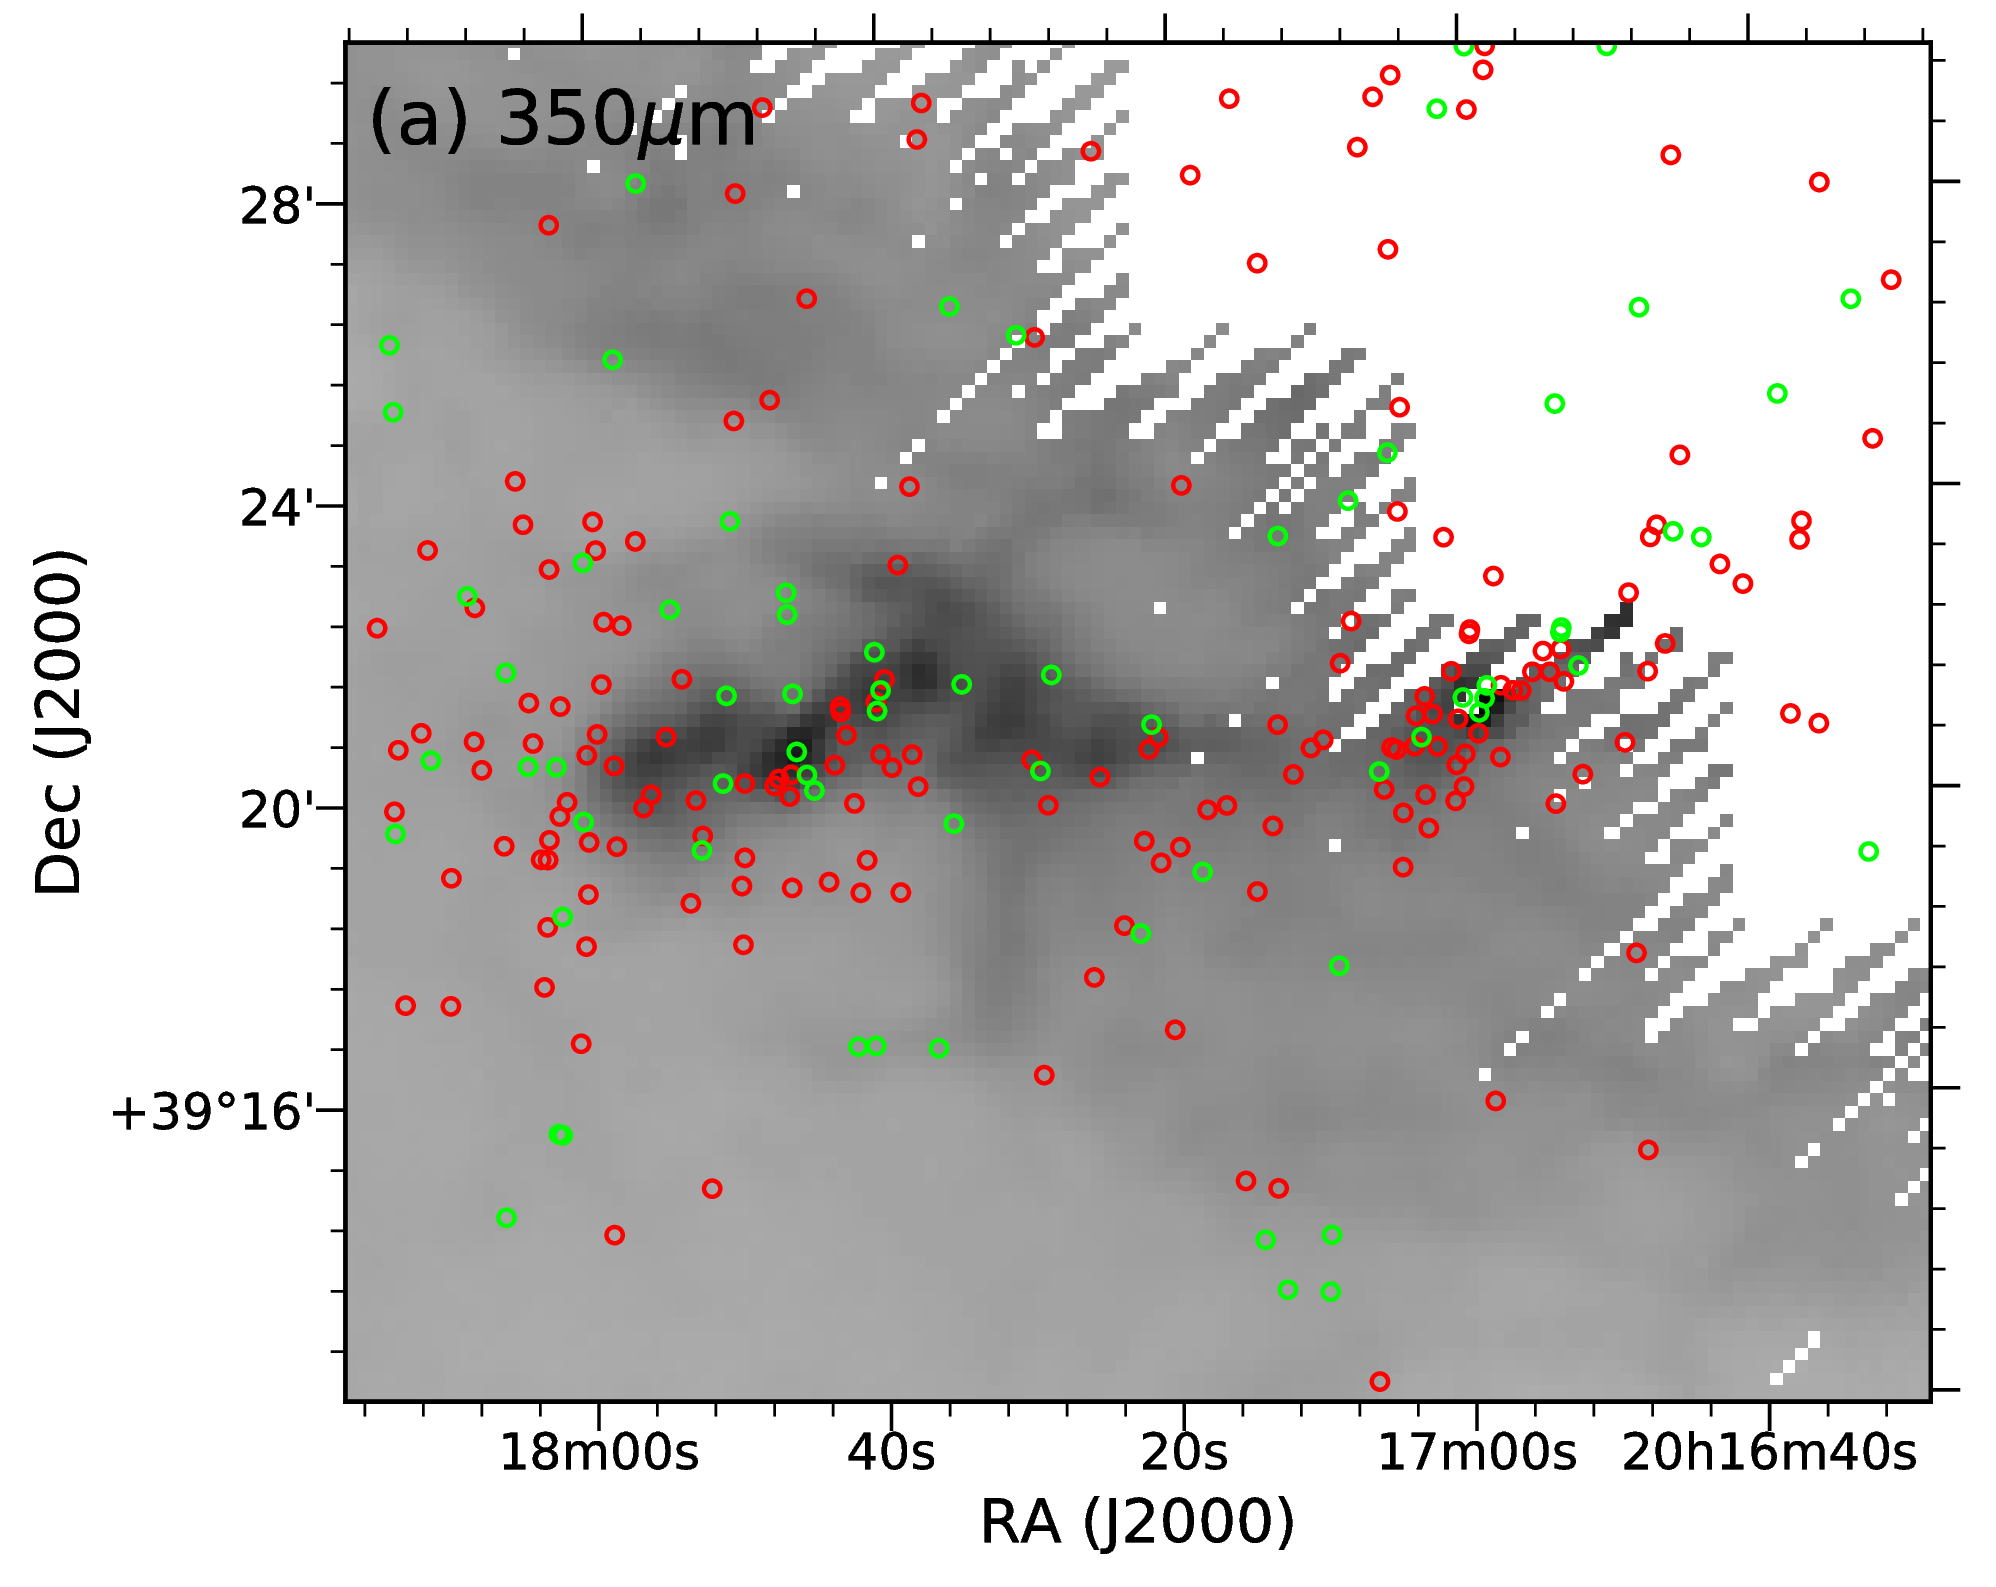
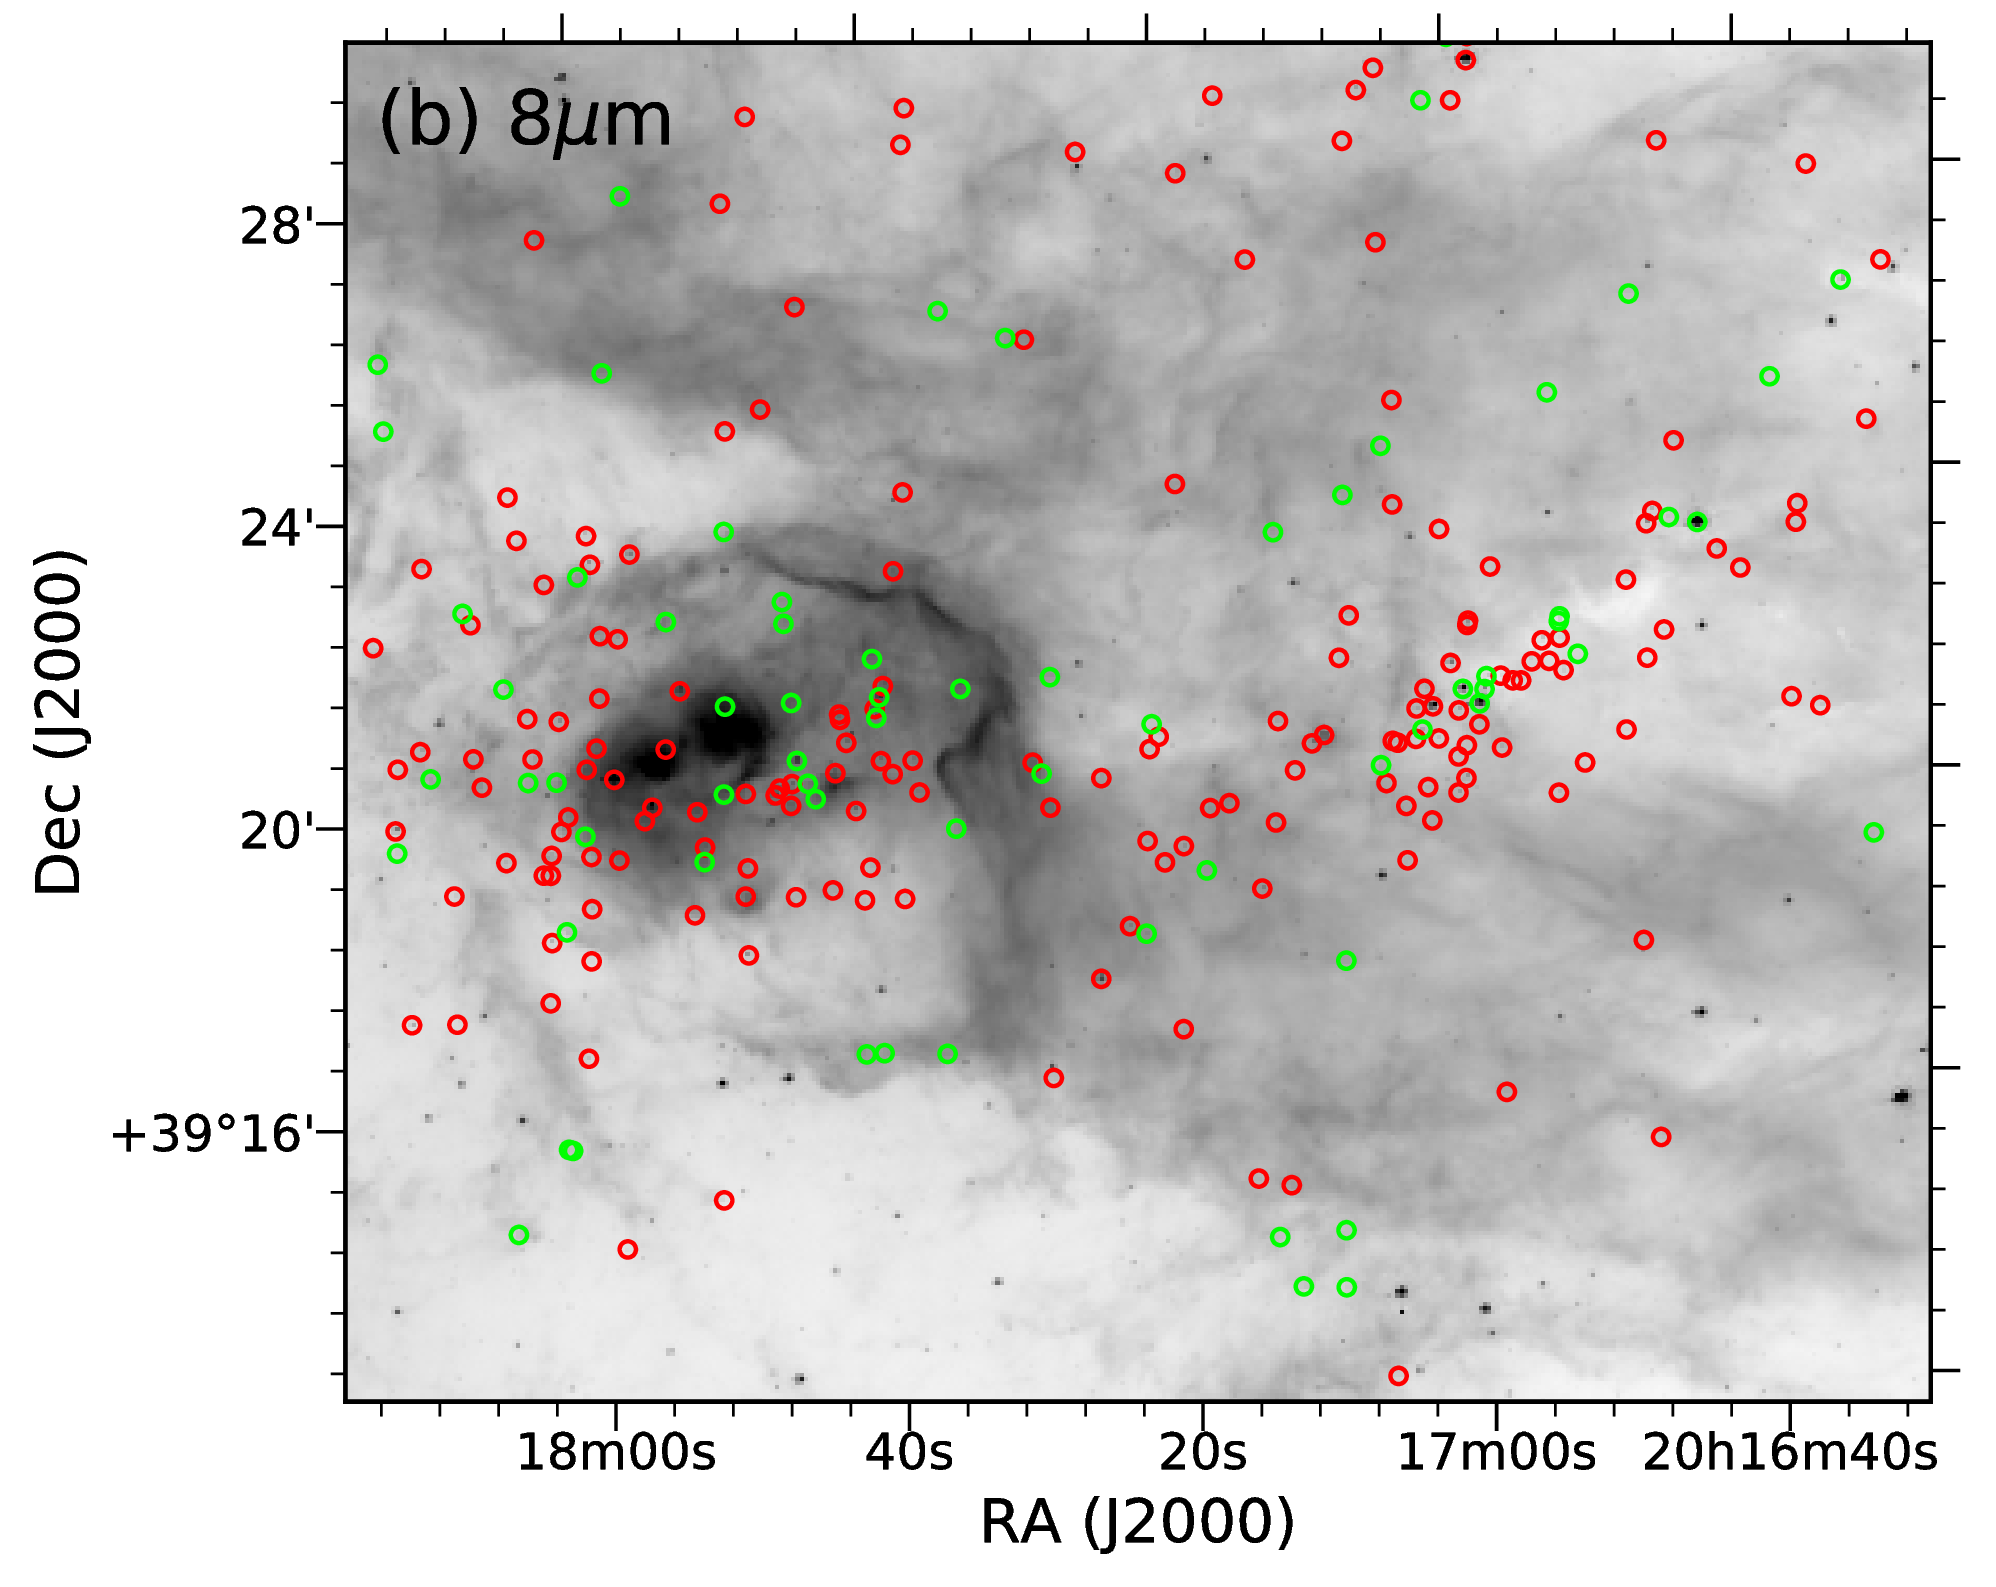
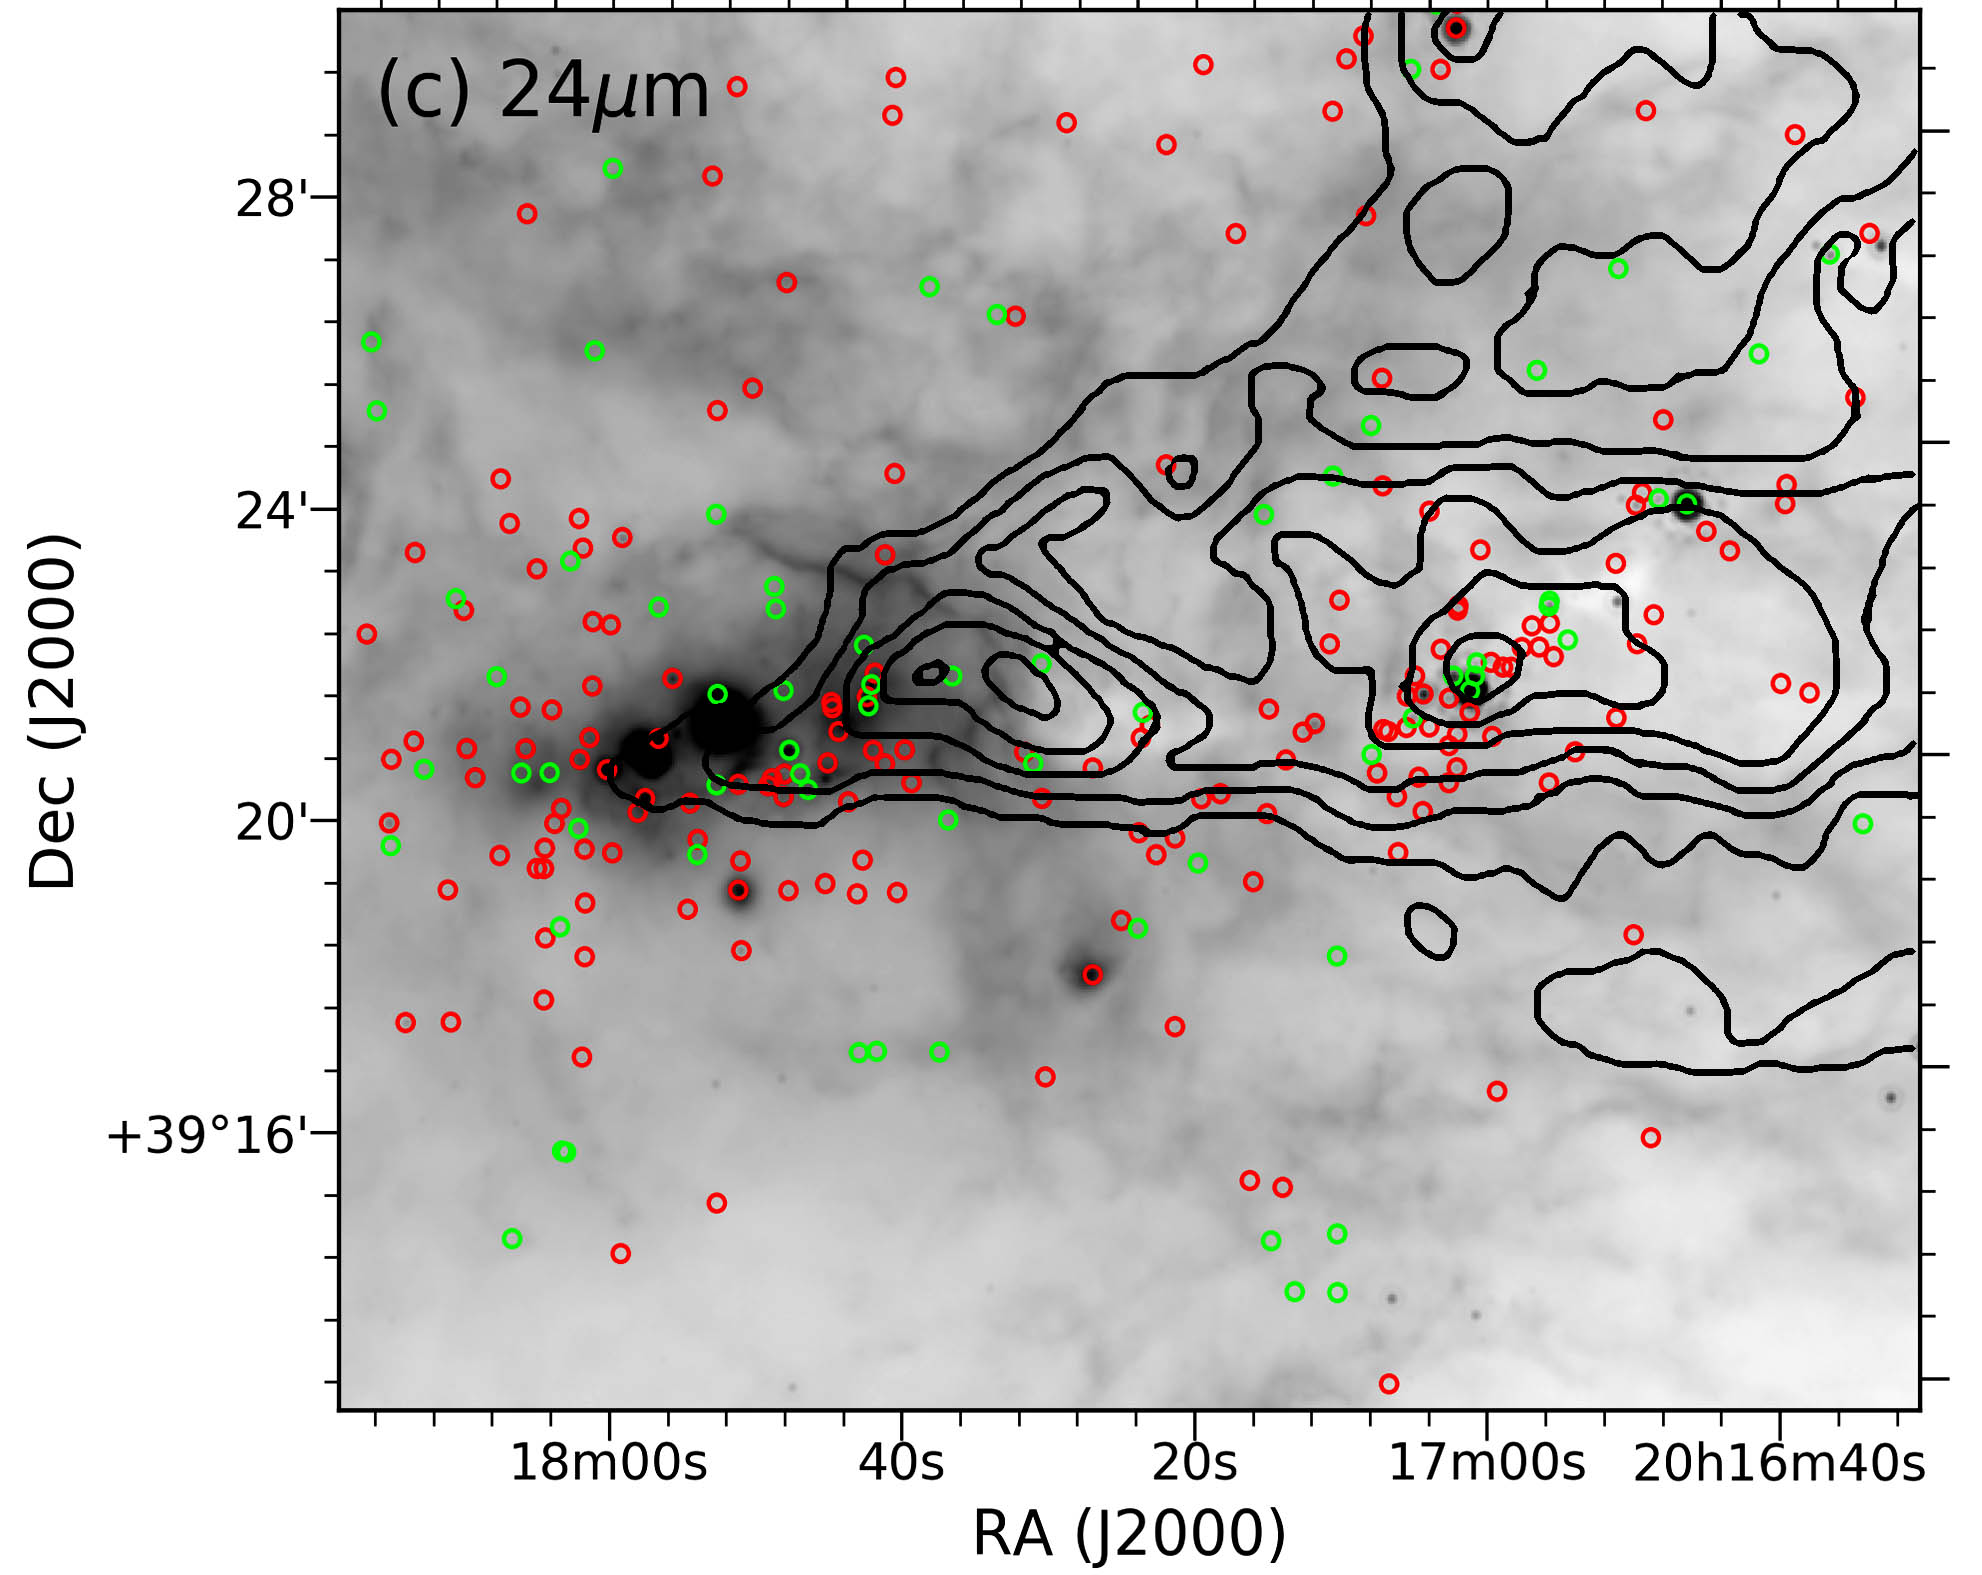
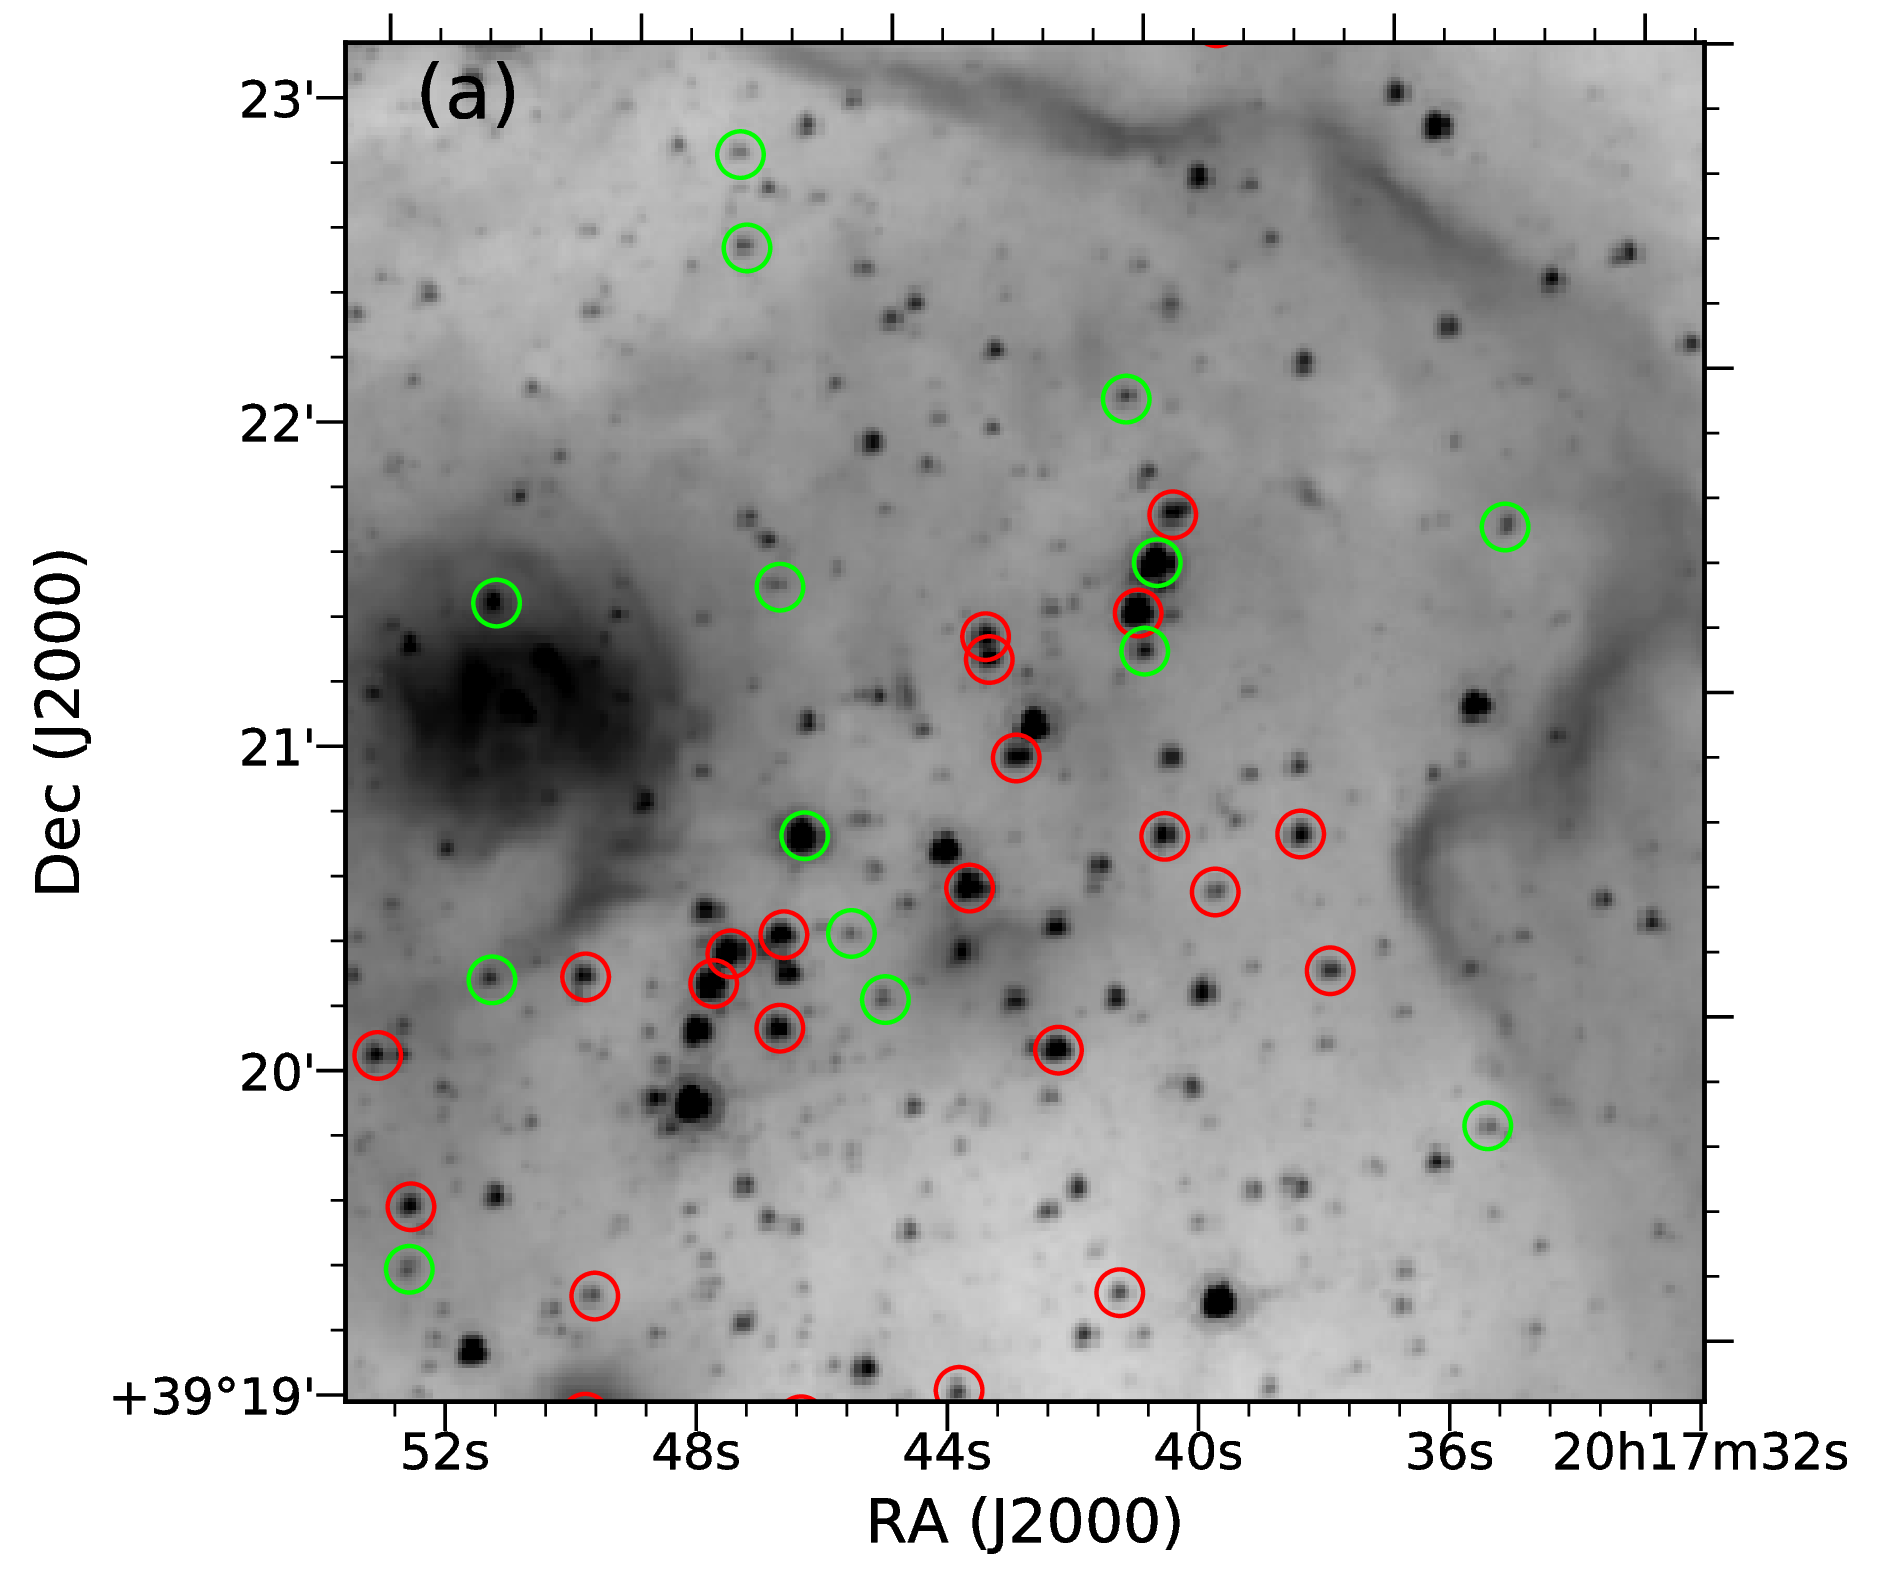
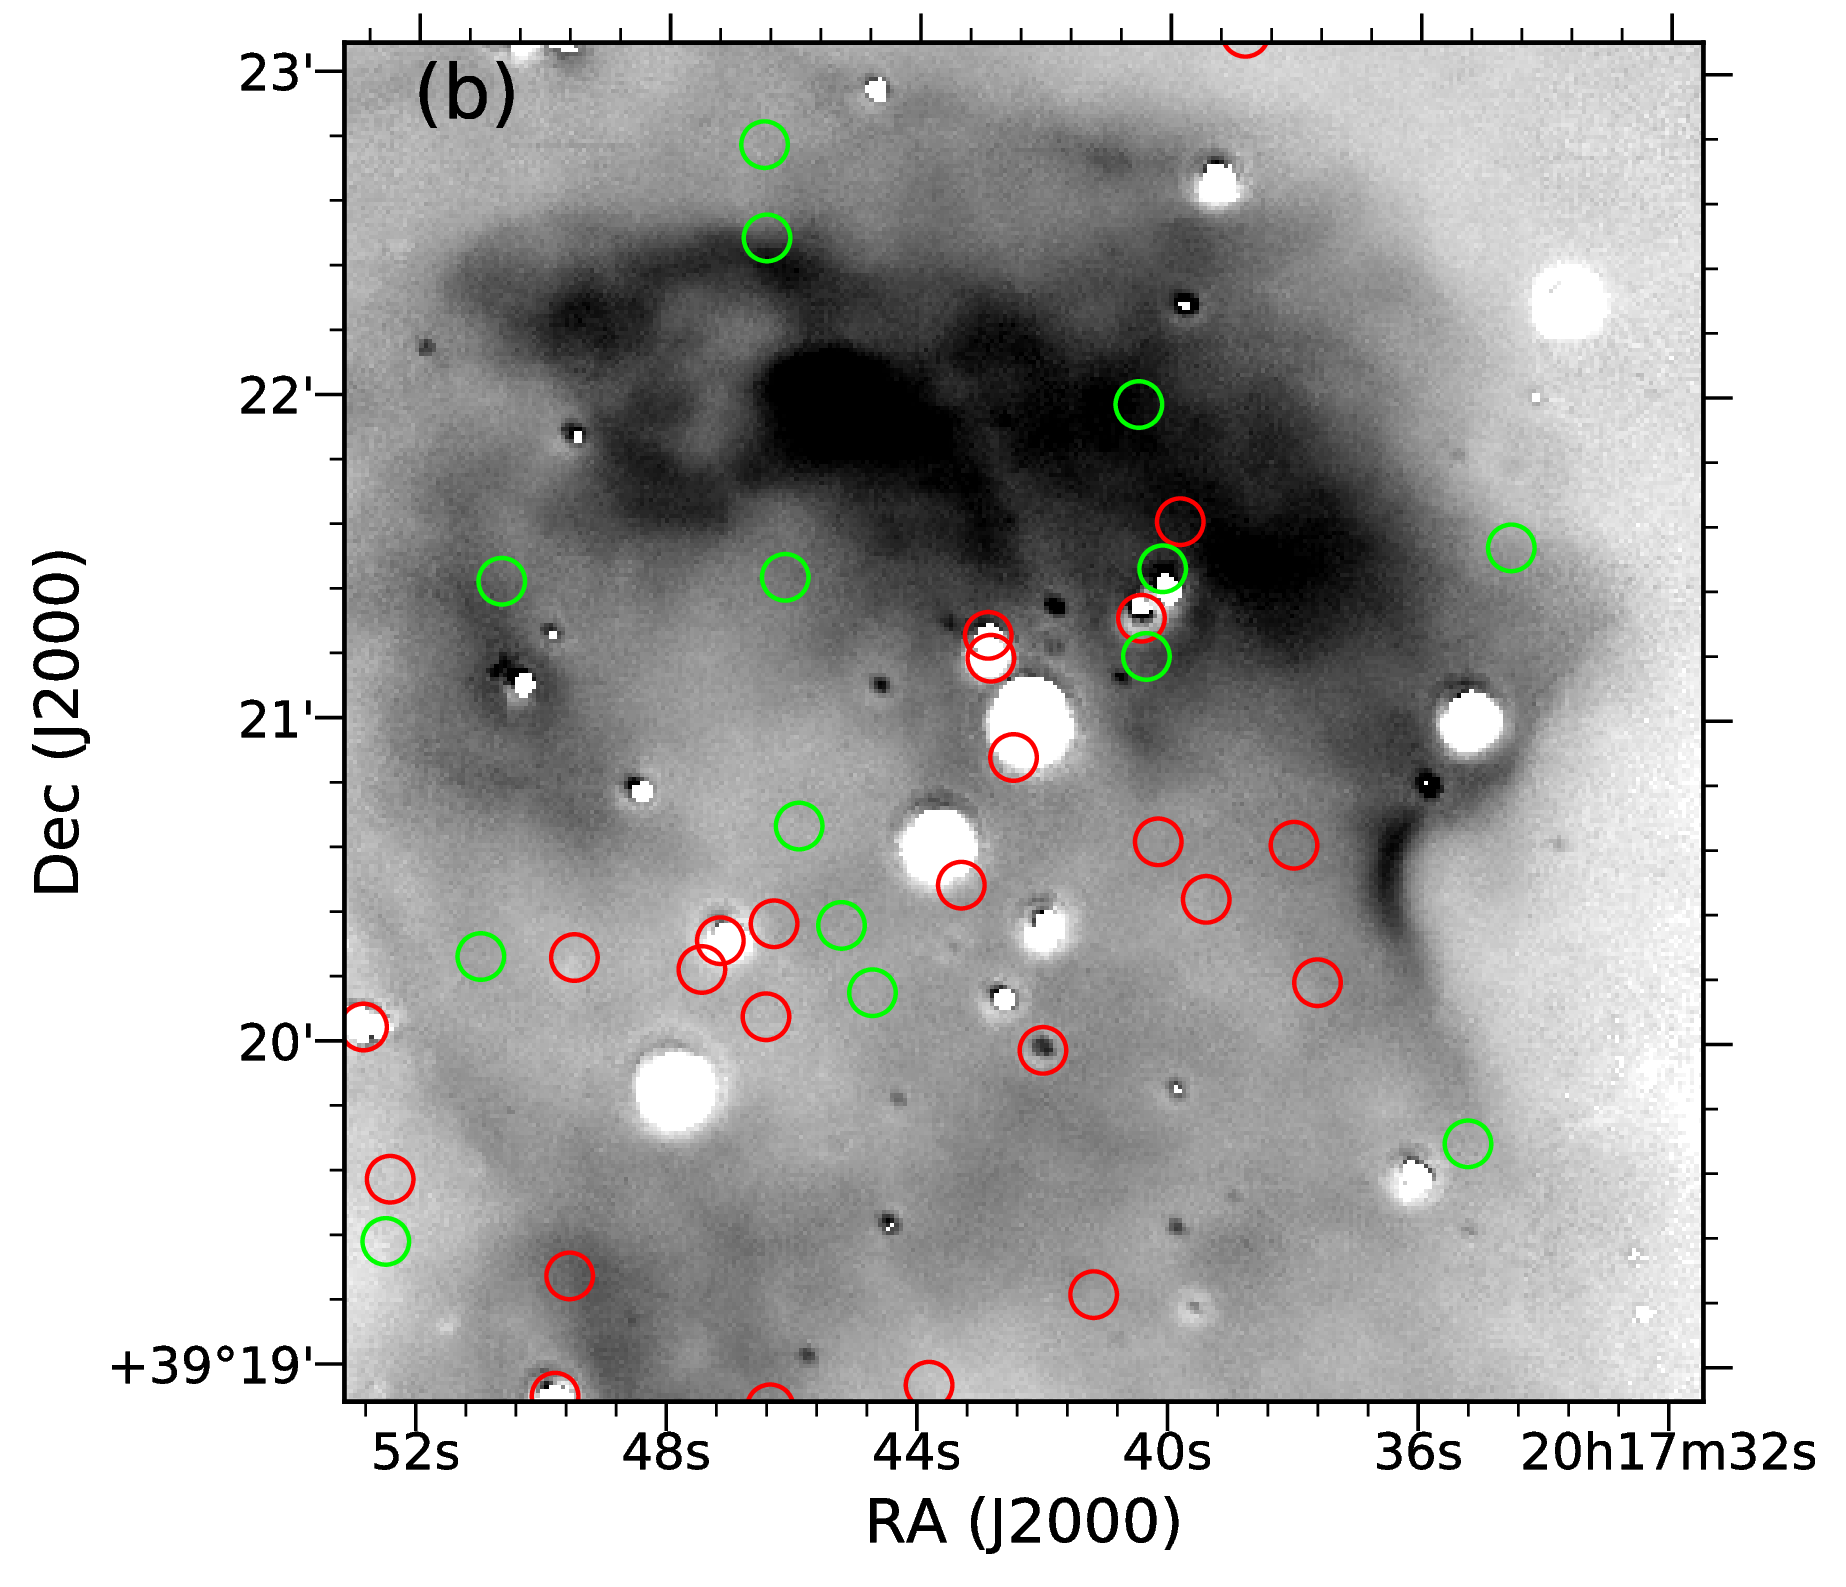
Fig. 11 shows the m, m and m band positions of Class I and II YSOs. Additionally, we plotted the isocontours of the molecular cloud on the m band image of the region (Schneider et al., 2007). Two bursts of star formation are clearly seen: inside the IR shell and near the dense cloud core in the western part of the region. We can see that star formation is ongoing in the vicinity of vdB 130, in the remnants of the progenitor cloud inside the IR shell. Moreover, the protostars are distributed more or less evenly inside the IR shell, with an insignificant concentration towards the bright features in the ‘Herschel cloud’, which coincides with the head of the molecular cloud (Fig. 11a). The process of star formation has recently began in the second star forming region, and here we observe a compact cluster of protostars near the dense cloud core (Motte et al., 2007).
The distribution of YSOs inside the IR shell is shown in Fig. 12. Note that only rare individual Class I protostars are observed in the area of enhanced optical emission between Blob W and the north-western part of the IR shell (Fig.3 top). The detailed analysis of the distribution of protostars and young stars in the area will be presented elsewhere.
Finally, we have used Herschel data to analyse dust temperatures and column densities in the studied large-scale region. Specifically, observational data in 70, 160, 250, and 350 m Herschel bands were fitted to the modified black body to estimate and , as shown in Fig. 13. In the upper panel we clearly see the dense vicinity of Blob W and Blob E, the head of the molecular cloud, and the IR shell. The head of the molecular cloud appears to a part of a large filament extending deep into the wall of the supershell. The second star-forming region is located in one of the density enhancements along the filament. While warm dust surrounding the blobs is clearly visible in the bottom panel of Fig. 13, material is much colder in the areas of younger star-forming regions. Apparently, protostar emission there still was not able to heat large amounts of dust.
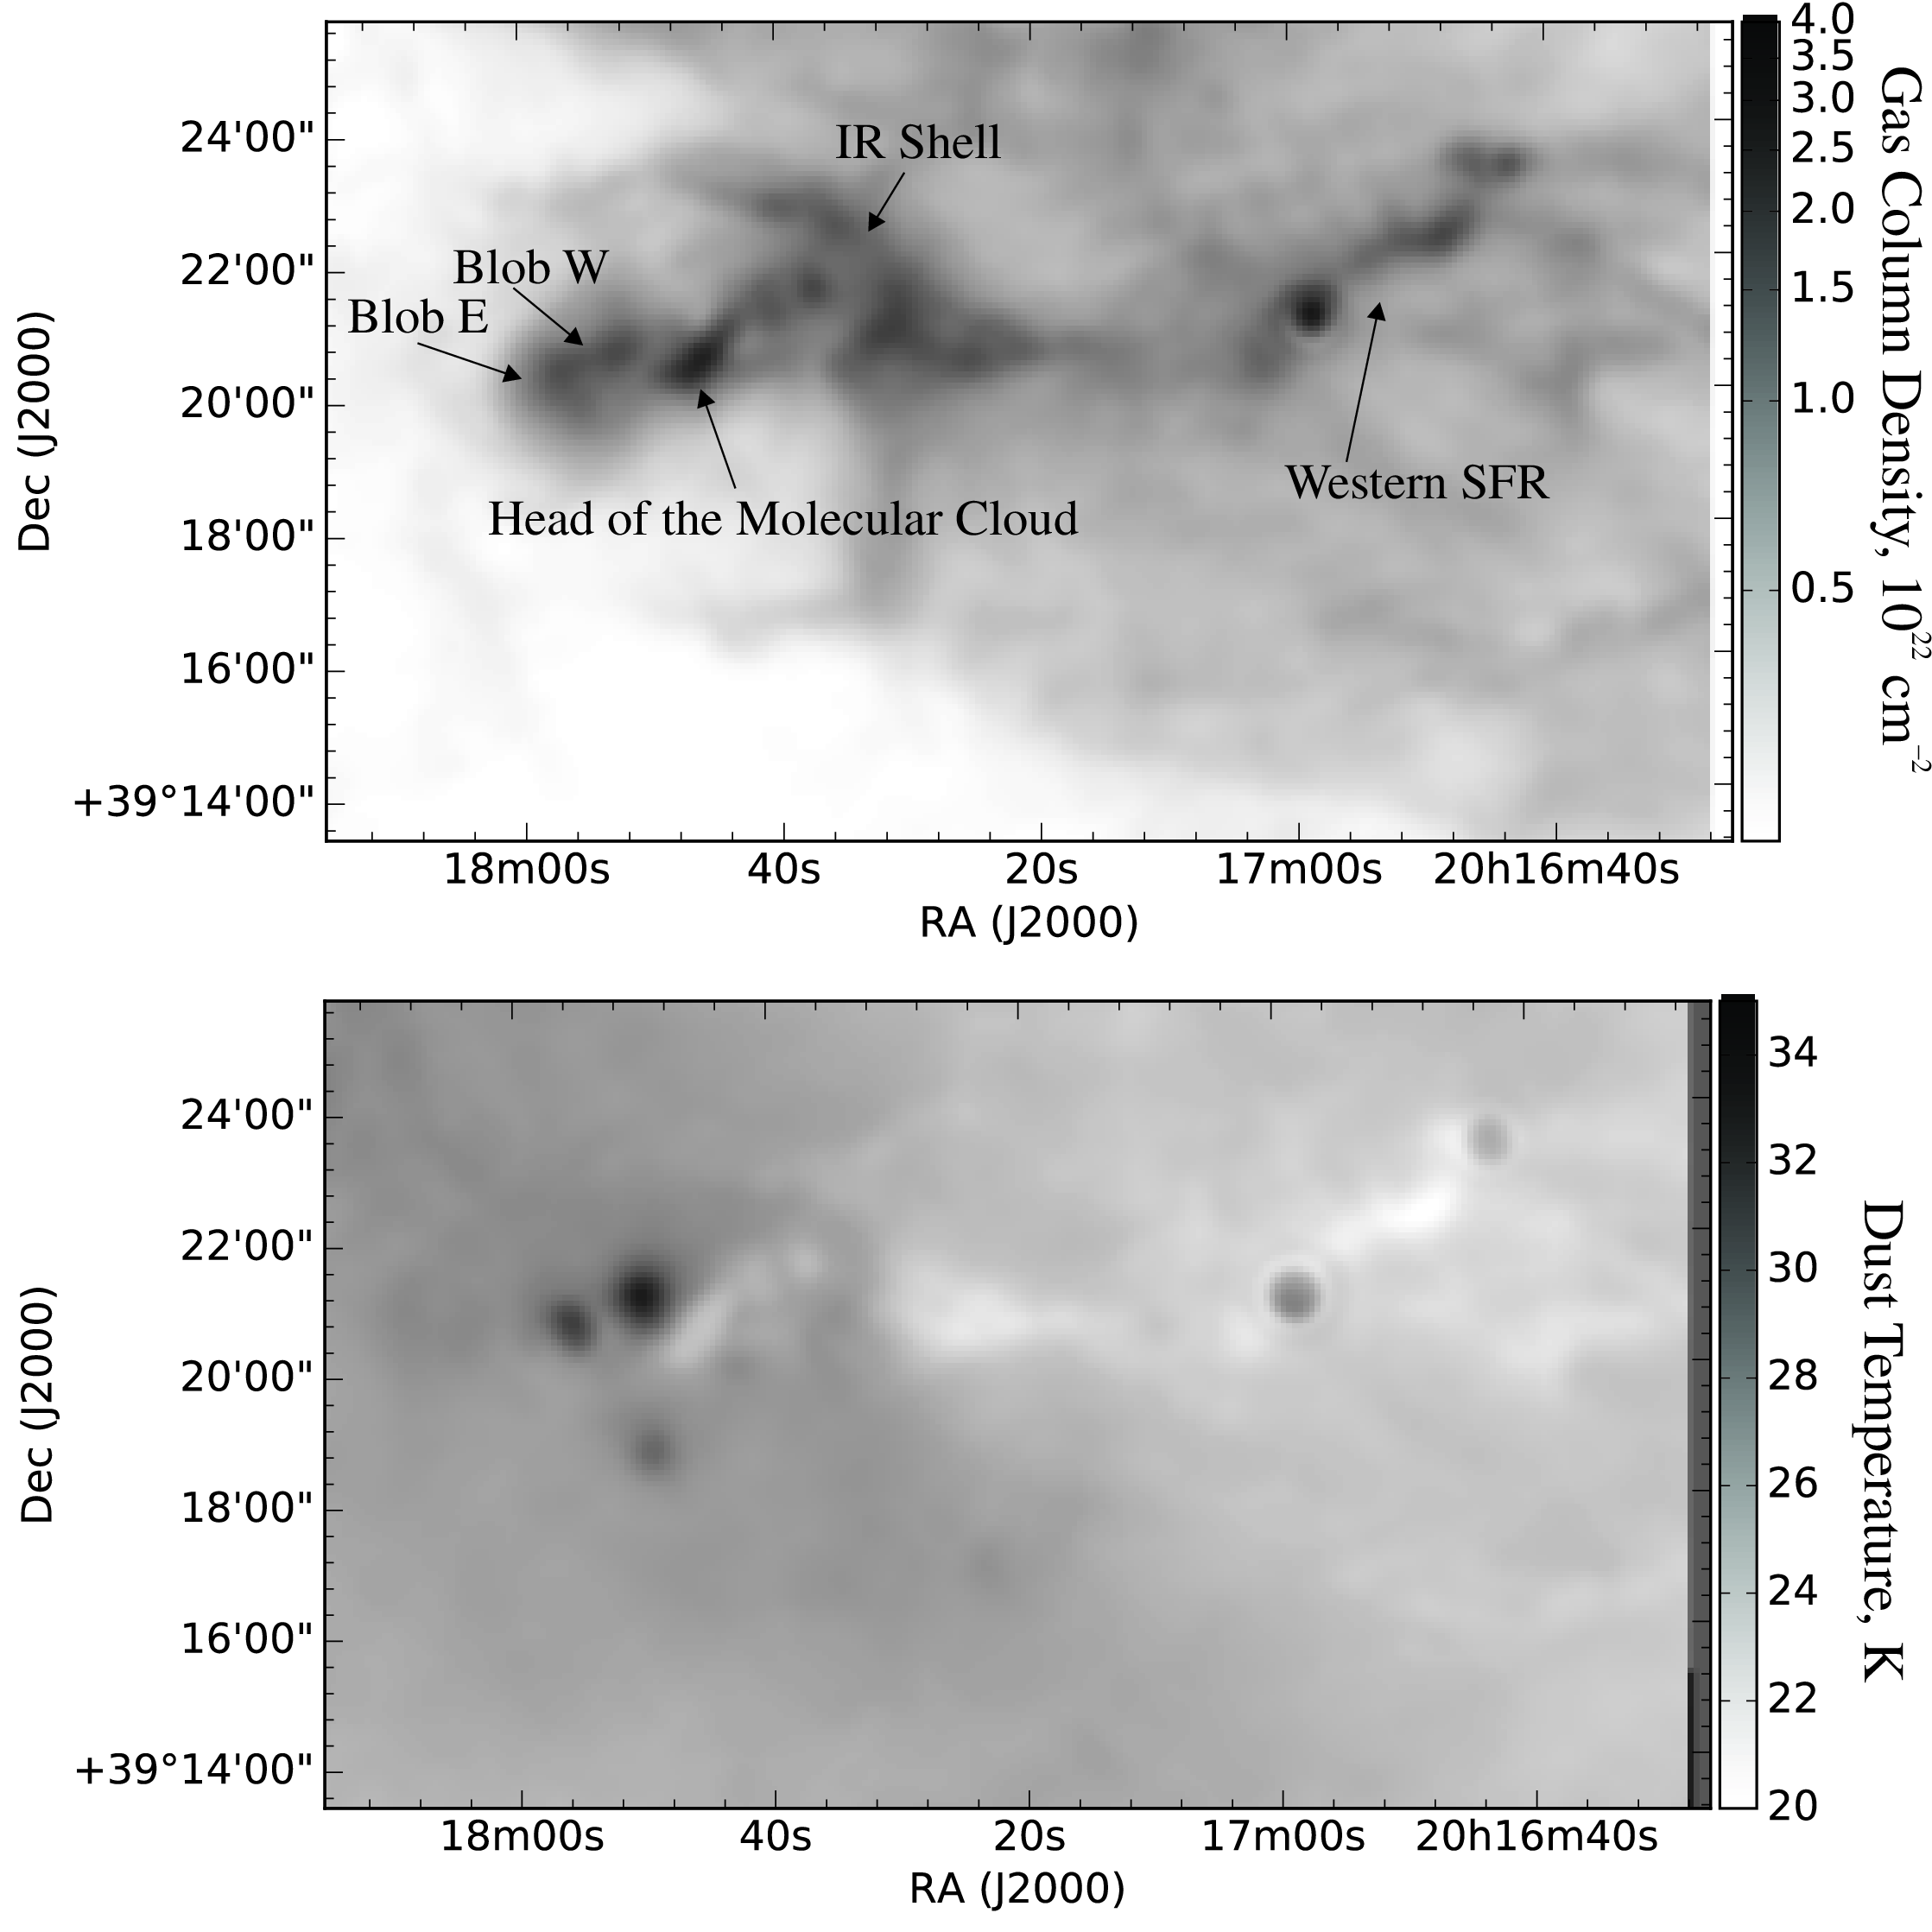
While the eastern star-forming region (in the head of the molecular pillar) might have been brought to life by the energetic influence of vdB 130 stars, the western star-forming region may represent an example of spontaneous star formation in the filament. In general, vdB 130 cluster, the dust blobs, and the eastern star-forming region may all be fossils of the filament, which is being gradually destroyed by the expansion of the Cyg OB1 supershell.
7 Summary
We investigated a region of ongoing star formation in the vicinity of the young star cluster vdB 130 located inside a wall of an expanding supershell around the Cyg OB1 association. A complex of gas and dust nebulae around the stars of the vdB 130 cluster is observed in a 3 pc region. From north, west, and south the complex is surrounded by an IR shell, visible in the 3.6 – 24 m near IR range, and is open from the side of the association. The IR shell represents an ionization front generated by the vdB 130 stars, which propagates through the cometary molecular cloud (pillar), formed by the wind and UV radiation of Cyg OB1 stars. A shock front is observed in the eastern part of the region, where the IR shell is not seen. It is marked by the [S ii] H ratio and coincides with the [S ii] filament in the eastern part of the area (Paper I).
The following results were obtained.
-
1.
We analysed the [S ii] line radial velocity field inside the IR shell. We show that the gas line-of-sight velocity in this area varies from to . The radial velocity, corresponding to large-scale motions (galactic rotation) amounts to and coincides with the velocity of the cometary molecular cloud. We confirm the suggestion mentioned in Paper I about the expansion of the H ii region around the cluster core stars with a velocity of about , which is consistent with the presence of the faint shock visible between Blob W and Blob E.
-
2.
An analysis of the kinematics in the cluster region revealed a compact region Vel-A inside the IR shell, where high-velocity motions are observed. Region Vel-A is projected onto a pc cavity seen in the optical emission distribution. The ionized gas inside the cavity moves at an average velocity of . Since no Class I or II protostars or stars brighter than 23 mag are found in this region, we suggest two explanations for the supersonic motions: the stellar wind from the point source, which is seen inside the cavity in [O iii] line and near-IR images of the region, and a bipolar outflow from the protostellar disc of a Class 0 protostar, since region Vel-A appears to consist of two lobes.
-
3.
Another region (Vel-B) with relatively large negative gas radial velocities (in the range of ) is located in the IR shell. The observed increased velocities here may be a consequence of the gas flow around the protrusion in the IR-shell.
-
4.
We discovered two star forming regions: a region of ongoing star formation in the vicinity of the vdB 130 cluster inside the IR shell (around the pillar), and a star burst inside the cometary molecular cloud, where a compact proto-cluster is observed near a dense clump.
-
5.
Temperatures and column densities in the studied region indicate that the head of the molecular cloud is a part of a large filament extending deep into the wall of the supershell. The cluster vdB 130, the dust blobs, and the entire eastern star-forming region may all be fossils of the filament, which is being gradually destroyed by the expansion of the Cyg OB1 supershell.
Acknowledgements
We thank the anonymous referee for useful comments that helped us to improve this manuscript.
This work was supported in part by M.V. Lomonosov Moscow State University Program of Development. This work was supported by the Russian Foundation for Basic Research (project # 18-02-00976). The work is based in part on observations obtained with the 6-m telescope of the Special Astrophysical Observatory of the Russian Academy of Sciences. The authors thank S.A. Lamzin for useful discussions and G.V. Smirnov-Pinchukov for his help with the data reduction. OE, TL and AT acknowledge the support from the Program of development of M.V. Lomonosov Moscow State University (Leading Scientific School ‘Physics of stars, relativistic objects and galaxies’). DW was supported by the P-12 Program (Presidium of the Russian Academy of Sciences) ‘Questions of origin and evolution of the Universe’.
This work is based in part on observations made with the Spitzer Space Telescope, which is operated by the Jet Propulsion Laboratory, California Institute of Technology under a contract with NASA and on observations made with the Herschel, which is an ESA space observatory with science instruments provided by European-led Principal Investigator consortia and with important participation from NASA.
References
- Afanasiev & Moiseev (2011) Afanasiev V.L., Moiseev A.V., 2011, Baltic Astronomy, 20, 363
- Allen et al. (2008) Allen M.G., Groves B.A., Dopita M.A., Sutherland R.S., Kewley L.J., 2008, ApJS, 178, 20
- Arkhipova et al. (2013) Arkhipova V. P. et al., 2013 MNRAS, 432, 2273
- Boch & Fernique (2014) Boch T., Fernique P., 2014, Astronomical Data Analysis Software and Systems XXIII, eds. N. Manset and P. Forshay, ASP conference series, 485, 277
- Bonnarel et al. (2000) Bonnarel F., Fernique P., Bienaymé O., Egret D., et al., 2000, A&AS, 143, 33
- Dale et al. (2015) Dale J.E., Haworth T.J., Bressert E., 2015, MNRAS, 450, 1199
- Draine & Roberge (1984) Draine B. T., Roberge W.G., 1984, ApJ, 282, 491
- Egorov et al. (2018) Egorov O. V., Lozinskaya T. A., Moiseev A. V., Smirnov-Pinchukov G. V., 2018, MNRAS, 478, 3386.
- Frank et al. (2014) Frank, A. et al., 2014, Jets and Outflows from Star to Cloud: Observations Confront Theory, 451
- Gutermuth et al. (2008) Gutermuth R.A. et al, 2008, ApJ, 674, 356
- Hora et al. (2011) Hora J.L. et al., 2011, Bulletin of AAS, 43, AAS Meeting #217, #258.07
- Hora et al. (2008) Hora J.L.et al, 2008, in: New Light on Young Stars: Spitzer’s View of Circumstellar Disks,Proc. Fifth Spitzer conf.; Pasadena, CA: CalTech, http://www.ipac.caltech.edu/ spitzer2008/talks/JosephHora Spitzer2008Conference.pdf
- Humpreys & McElroy (1984) Humpreys R.M., McElroy D.B., 1984 Astrophys. J., 284, 565
- Lada (1987) Lada C. J., 1987, in: Star forming regions; Proceedings of the IAU Symposium, 115, 1
- Lada (2005) Lada C. J., 2005, Progress of Theor. Phys. Suppl., 158, 1
- Lozinskaya & Sitnik (1988) Lozinskaya T.A., Sitnik T.G., 1988, SvAL, 14, 100
- Lozinskaya & Repin (1990) Lozinskaya T.A., Repin S.V., 1990, SvA, 34, 580
- Lozinskaya et al. (1997) Lozinskaya T. A., Pravdikova V. V., Sitnik T. G., Esipov V. F., Mel’nikov V. V., 1997, Astron. Lett., 23, 450
- Lozinskaya et al. (1998) Lozinskaya T. A., Pravdikova V. V., Sitnik T. G., Esipov, V. F., Mel’nikov V. V., 1998, Astron. Reports, 42, 453
- Lozinskaya et al. (2003) Lozinskaya T. A., Moiseev A. V., Podorvanyuk N. Yu., 2003, Astron. Letters, 29, 77
- McLeod et al. (2015) McLeod A. F., Dale J. E., Ginsburg A., Ercolano B., Gritschneder M., Ramsay S., Testi L., 2015, MNRAS, 450, 1057
- Molinari et al. (2010) Molinari S. et al, 2010, PASP, 122, 314
- Motte et al. (2007) Motte F., Bontemps S., Schilke P., Schneider N., Menten K. M., Broguiere D., 2007, A&A, 476, 1243
- Moiseev (2002) Moiseev A. V., 2002, Bull. of the Special Astrophysics Observatory, 54, 74
- Moiseev & Egorov (2008) Moiseev A. V., Egorov O. V., 2008, Astrophys. Bull., 63, 181
- Moiseev (2015) Moiseev A. V., 2015, Astrophys. Bull., 70, 494
- (27) Nadjip A.E., Tatarnikov A.M., Toomey D.W., Shatsky N.I., Cherepashchuk A.M., Lamzin S.A., Belinski A.A, 2017, Astrophys. Bull., 72, 382
- Oey et al. (2005) Oey M.S., Watson A.M., Kern K., Walth G.L., 2005, AJ, 129, 393
- Palmeirim et al. (2017) Palmeirim P., Zavagno A., Elia D., Moore T., et al., 2017, A&A, 605, A35
- Racine (1968) Racine R., 1968, AJ, 73, 233
- (31) Saken J.M., Shull J.M., Garmany C.D., Nichols-Bohlin J., Fesen R., 1992, ApJ, 397, 537
- Schneider et al. (2007) Schneider N., Simon R., Bontemps S., Comeron F., Motte F., 2007, A&A, 474, 873
- Sitnik et al. (2015) Sitnik T.G. et al, 2015, MNRAS, 454, 2486
- Smith et al. (2010) Smith N. et al, 2010, MNRAS, 406, 952
- (35) Tatarnikova A. A., Tatarnikov A. M., Sitnik T. G., Egorov O. V., 2016, Astron. Lett., 42, 790
- Ybarra et al. (2014) Ybarra J. E., Tapia M., Román-Zúñiga C. G., Lada E. A. 2014, ApJL, 794, L25
Appendix A Region map
To facilitate reading the paper, we provide a sketch of the main features in the cluster vdB 130 area.