SN 2016hil – a Type II supernova in the remote outskirts of an elliptical host and its origin
Abstract
Type II supernovae (SNe) stem from the core collapse of massive () stars. Owing to their short lifespan, we expect a very low rate of such events in elliptical host galaxies, where the star-formation rate is low, and which mostly consist of an old stellar population. SN 2016hil (iPTF16hil) is a Type II supernova located in the extreme outskirts of an elliptical galaxy at redshift (projected distance kpc). It was detected near peak brightness ( mag) 9 days after the last nondetection. SN 2016hil has some potentially peculiar properties: while presenting a characteristic spectrum, the event was unusually short lived and declined by mag in days, following an apparently double-peaked light curve. Its spectra suggest a low metallicity (). We place a tentative upper limit on the mass of a potential faint host at using deep Keck optical imaging. In light of this, we discuss the possibility of the progenitor forming locally, and other more exotic formation scenarios such as a merger or common-envelope evolution causing a time-delayed explosion. Further observations of the explosion site in the ultraviolet are needed in order to distinguish between the cases. Regardless of the origin of the transient, observing a population of such seemingly hostless Type II SNe could have many uses, including an estimate the number of faint galaxies in a given volume, and tests of the prediction of a time-delayed population of core-collapse SNe in locations otherwise unfavorable for the detection of such events.
1. Introduction
The progenitors of Type II supernovae (SNe) are recognized to be massive stars (; e.g., Smartt 2009) at the end of their lives. Owing to their short lifespan, we expect a very low rate of such events far from star-forming regions (James & Anderson, 2006), and in particular in early-type galaxies, which mostly consist of an old stellar population (i.e., of low-mass stars). Indeed, a systematic analysis of the hosts of SNe (Hakobyan et al., 2012) reveals no core-collapse SNe (CCSNe) in elliptical (E) hosts, and only two cases in lenticular (S0) hosts, in comparison to 147 Type Ia SNe in such galaxies from the same sample. The few hosts of Type II/Ib SNe previously thought to be early-type galaxies were misclassified according to this analysis. Another analysis of these debated cases (Suh et al., 2011) demonstrates a systematically bluer color and stronger radio emission of the supposed early-type hosts of CCSNe compared to early-type hosts of SNe Ia – signatures of recent star formation (SF). More generally, a fraction of early-type galaxies have demonstrated some SF (see, e.g., Crocker et al. 2011, Kaviraj et al. 2007, or Kaviraj et al. 2008). It has been suggested that minor mergers are the main mechanism of such residual star formation (Kaviraj et al., 2009). This gives reasons to expect a residual rate of CCSNe in early-type galaxies.
There are also possible reasons to expect a residual population of CCSNe in regions with no recent SF. Zapartas et al. (2017) suggest that a significant fraction () of CCSNe are caused by mass transfer between a pair of intermediate-mass (4–8 ) binaries, occurring up to 200 Myr after stellar birth (“late” events). Similarly, Soker (2019) outlines several possible mechanisms through which common-envelope evolution may terminate in CCSNe. Such scenarios would involve a secondary star or stripped core spiraling into the envelope of a larger primary star, resulting in a SN explosion.
From an observational point of view, there have been rare cases of non-Ia SNe in early-type hosts, where no nearby star formation could be measured. For example, the Type Ibn SN PS1-12sk (Sanders et al., 2013) occurred in the local environment of an E host (projected separation kpc). Hosseinzadeh et al. (2019) analyse deep ultraviolet (UV) images of the event obtained with the Hubble Space Telescope (HST), and find no measurable SF activity in the region. In light of this, it has been suggested that the progenitor of PS1-12sk might not have been a massive star, and some alternatives have been suggested.
Similarly, “Ca-rich” SNe Ib (Filippenko et al., 2003) are thought to be the product of interactions between two white dwarfs and not a result of core collapse (Perets et al., 2010; Waldman et al., 2011), as they essentially always occur in or near old stellar environments (Lunnan et al., 2017). For example, the environment of SN 2005cz (Kawabata et al., 2010) was investigated thoroughly and demonstrated to exhibit no star formation (Perets et al., 2011).
Finally, early-type galaxies may have dwarf satellites which do present some SF activity. Given the limiting magnitudes ( mag) of the Sloan Digital Sky Survey (SDSS; York et al. 2000) and the Panoramic Survey Telescope and Rapid Response System 1 (PS1; Chambers et al. 2016), we would be unable to detect galaxies fainter than mag at a redshift , which is relevant for this study. We certainly expect a non-negligible fraction of CCSNe to occur in such hosts (Arcavi et al., 2010).
In the past decade, automated and systematic surveys have increased by orders of magnitude the rate of SN discoveries. These include the Palomar Transient Factory (PTF; Law et al. 2009), its inheritor the intermediate Palomar Transient Factory (iPTF; Kulkarni 2013), the All Sky Automated Survey for Supernovae (ASAS-SN; Shappee et al. 2014), the Asteroid Terrestrial-impact Last Alert System (ATLAS; Tonry et al. 2018), PS1, and the Gaia Photometric Science Alerts (Wyrzykowski et al., 2012). For example, (i)PTF discovered more than SNe, of which were core-collapse events. This provides access to populations which occur at a rate of of all core-collapse events. Within the next year, the Zwicky Transient Facility (ZTF; Bellm et al. 2019) is expected to observe a similar number of events. This will open a window for studying new and exotic populations of transients, of which few events were observed in the past or that are completely unknown.
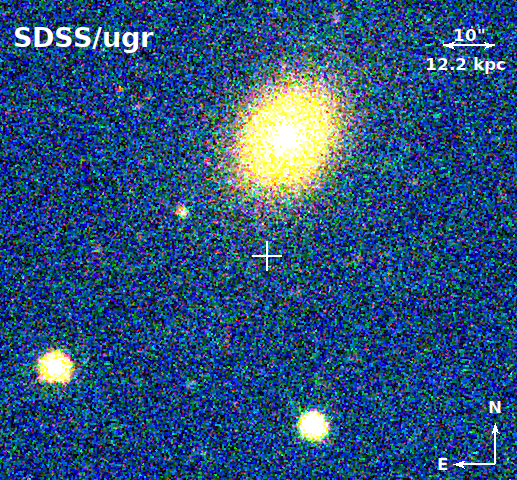
Here we present the case of SN 2016hil. The event was discovered (Kasliwal & Cao, 2018) and classified (Irani, 2019) by iPTF as a spectroscopically regular Type II SN (e.g., Filippenko, 1997; Gal-Yam, 2017). SN 2016hil occurred in an unusual location – the outskirts of an E galaxy. We describe our spectroscopic and photometric observations in Sect. 2, present our findings concerning the transient and its host galaxy in Sect. 3, and discuss possible origins for the event in Sect. 4. Throughout this paper we assume and a CDM cosmology with and (Planck Collaboration et al., 2014).
2. Observations
2.1. Discovery, classification, and host galaxy
SN 2016hil was detected using the 48-inch telescope at Palomar Observatory (P48), on 2016 October 22 (UT dates are used throughout this paper) at 07:55 (JD 2457683.801), in the r band ( mag) and was observed in the g band ( mag) 40 min later. The source was at , (J2000). The last nondetection was 9 days before the explosion down to a limit of 20.89 mag in the r band, although an earlier marginal detection was later identified (see Sect. 2.3).
2.2. Optical Spectroscopy
We collected four optical spectra during a period of 40 days when SN 2016hil was visible. On 2016 October 26, the first spectrum of the SN was obtained using the Double Beam Spectrograph (DBSP; Oke & Gunn, 1982) mounted on the Palomar 200-inch Hale telescope (P200). The gratings of 600/4000 and 316/7500 were used for the blue and red cameras, respectively, with the D55 dichroic. The data were reduced using standard procedures, including bias and flatfield corrections, one-dimensional (1D) spectral extraction, wavelength calibration with comparison lamps, and flux calibration using observations of standard stars observed during the same night and at approximately similar airmasses to the SN.
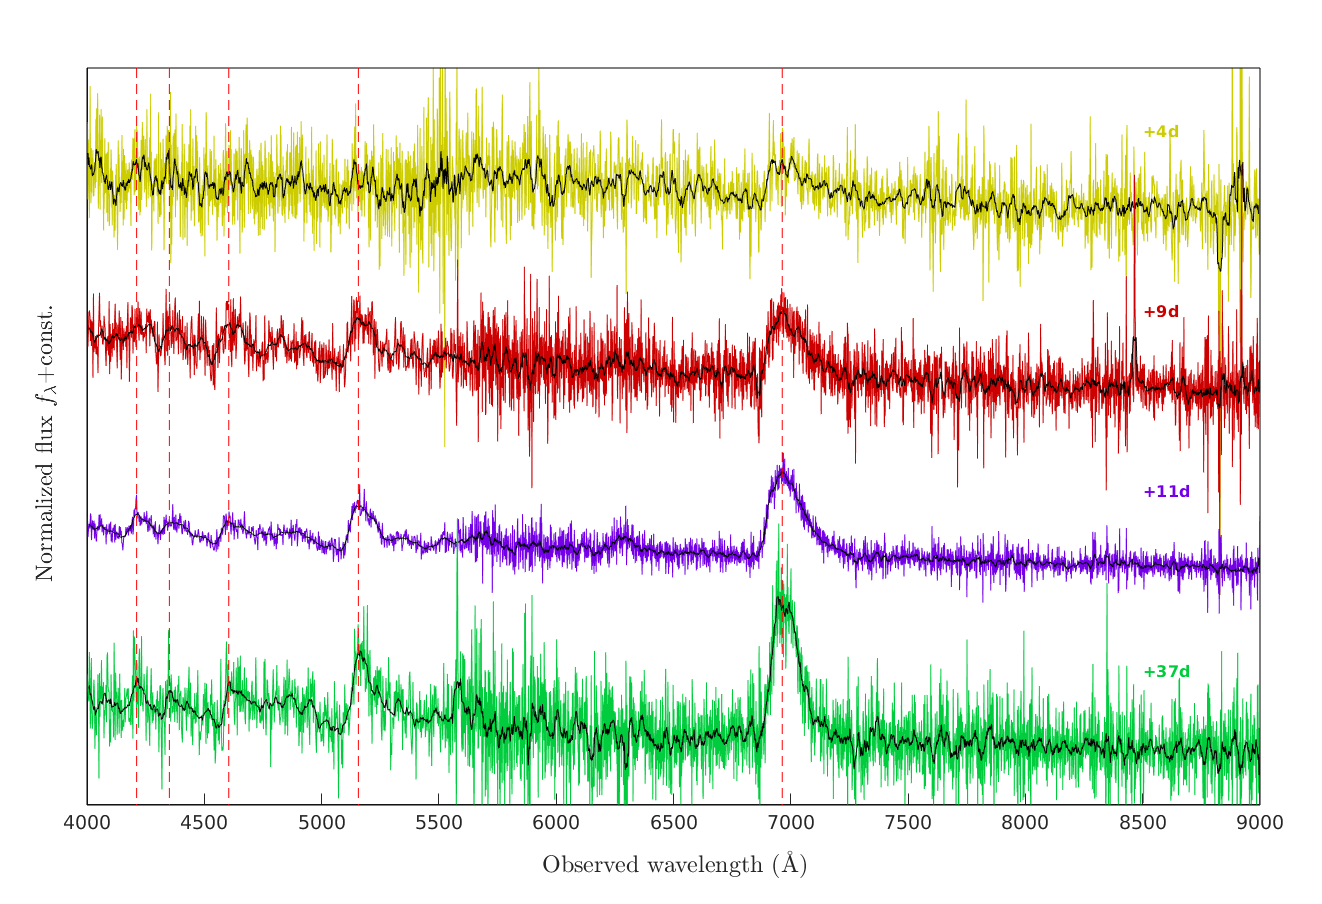
Three additional spectra were obtained with the Low Resolution Imaging Spectrometer (LRIS; Oke et al. 1995) on the 10-m Keck I telescope. The gratings of 300/3400 and 300/8500 were used for the blue and red cameras, respectively, with the 560 dichroic. The data were reduced using the LRIS automated reduction pipeline (LPipe) (Perley, 2019), and are made available to the public on WISeREP (Yaron & Gal-Yam, 2012). In Table 1 we report our spectral observation log and in Fig. 2 we present the full set of spectra. They exhibit broad hydrogen emission features which evolve rapidly throughout the observation period, based on which SN 2016hil is classified as a Type II SN.
| Date | (d)a | Instrument | Exp. time (s) | Airmass |
|---|---|---|---|---|
| 2016 Oct. 26 | 4 | P200/DBSP | 6002 | 1.10 |
| 2016 Oct. 31 | 9 | Keck/LRIS | 1850 | 1.35 |
| 2016 Nov. 02 | 11 | Keck/LRIS | 1160 | 1.07 |
| 2016 Nov. 28 | 37 | Keck/LRIS | 870 | 1.41 |
2.3. Optical Photometry
After the detection, follow-up observations were made using the Spectral Energy Distribution Machine (SEDM; Blagorodnova et al. 2018) mounted at the 60-inch telescope at Palomar Observatory (P60) in addition to routine monitoring with the P48. Photometry was acquired with SDSS g and Mould- bands for the P48 images, and with SDSS gri bands for the P60 images. Mould- was then converted to the SDSS r band using the Lupton color equations (2005).111https://www.sdss3.org/dr10/algorithms/sdssUBVRITransform.php Since SN 2016hil is located on a simple background, we chose to use aperture photometry in order to extract source fluxes. This was done by designing custom apertures and annuli with the MATLAB Astronomy & Astrophysics Toolbox222https://github.com/EranOfek/MAAT (Ofek, 2014). We calibrated zeropoints with SDSS stars. Using the images from the days previous to first detection, we summed the nondetection fluxes and derived summed nondetection limits to constrain the shape of the light curve before peak brightness (not including the flux from the marginal detection at d). We repeated this procedures for the epochs after rebrightening observed at d, when poor weather conditions at Palomar prevented further photometric observations.
Moreover, we obtained approximate photometry synthesized from the Keck/LRIS spectrum taken at 37 days after first detection. To acquire some estimate for the systematic error involved in synthetic photometry, we compared the scatter of the synthetic photometry acquired from the earlier spectra to the linear interpolation of the light curve in the relevant filter. For the i-band filter for which no such data exist, we took the error to be the mean of the uncertainty in the gr bands.
We corrected for Galactic extinction using the NASA/IPAC Extragalactic Database333https://ned.ipac.caltech.edu/extinction_calculator (NED), which cites a value of mag for this line of sight based on Schlafly & Finkbeiner (2011).
S-corrections (Stritzinger et al., 2002) were estimated for the appropriate filters at the times of the spectra, and by then linearly interpolating the trend for different epochs. This became significant (up to mag) for the P60 r-band photometry since at the redshift of SN 2016hil the evolving H feature is at the boundary of the filter (see Fig. 2). Absolute magnitude light curves are thus plotted separately.
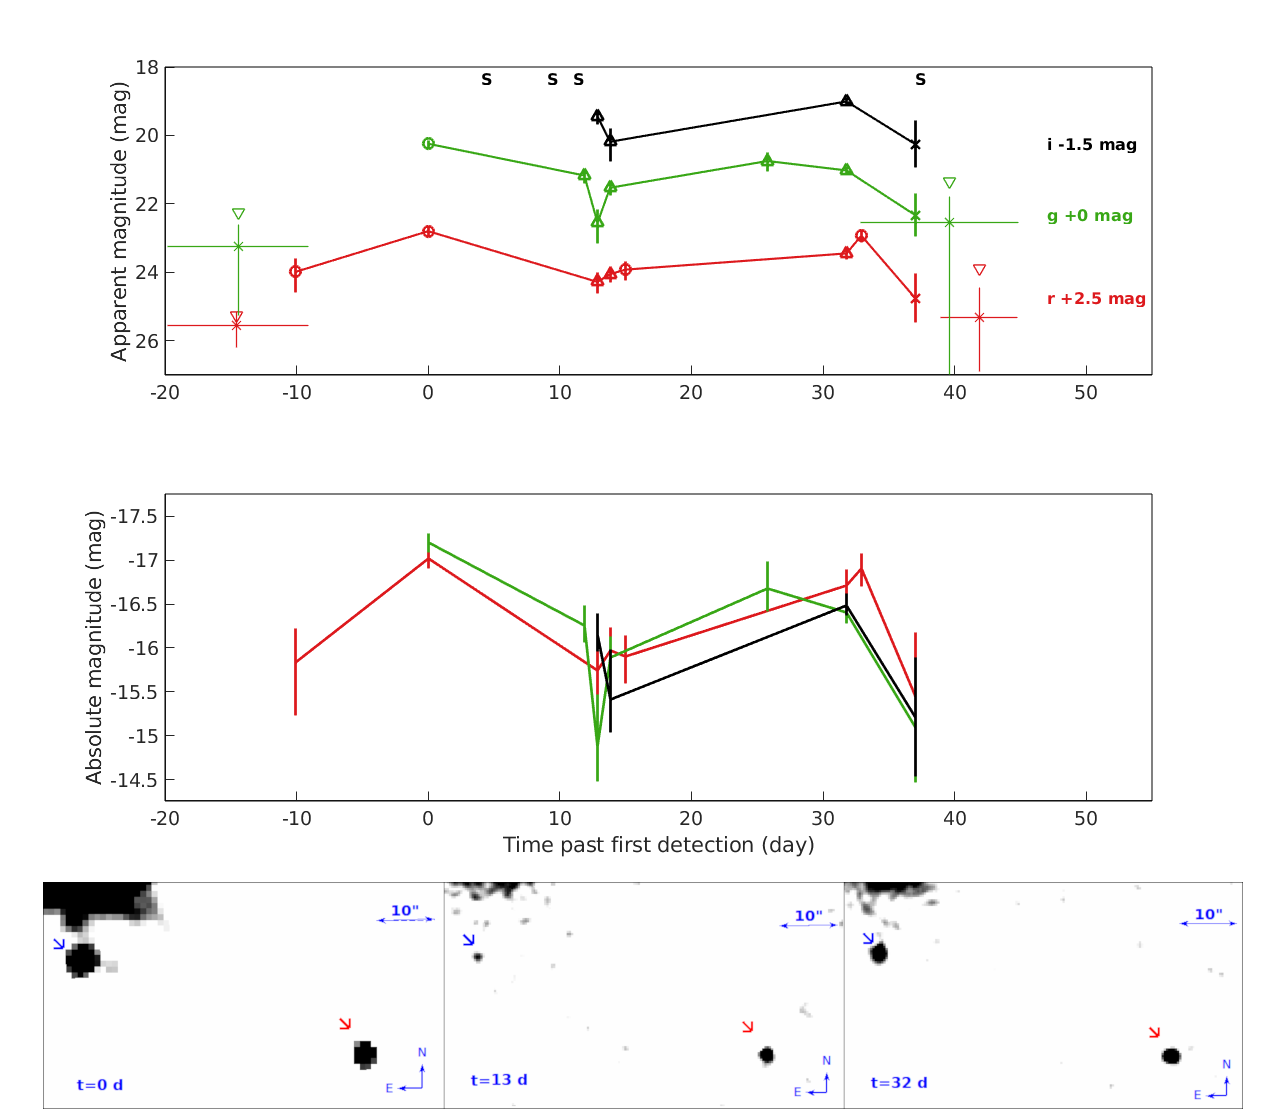
Table 2 reports the measured the gri magnitudes for the Palomar data, as well as the late-time photometry from Keck in Sect. 2.4. The gri S-corrected light curve is presented in Fig. 3. Photometry is made available on WISeREP. Although the S/N is low, we tentatively suggest that the light curve of SN 2016hil clearly has a double peak, which can also be corroborated by the lower panel of Fig. 3.
| (d)a | Instrument | Filter | AB Mag | BC (mag)b |
|---|---|---|---|---|
| -10.07 | P48 | r | 21.49 0.61 | 0.055c |
| 0.00 | P48 | r | 20.30 0.12 | |
| 4.00 | P200/DBSP† | r | 21.04 0.73 | |
| 9.00 | Keck/LRIS† | r | 20.17 0.73 | |
| 11.00 | Keck/LRIS† | r | 20.97 0.73 | |
| 12.86 | P60/SEDM | r | 21.78 0.34 | |
| 13.82 | P60/SEDM | r | 21.55 0.26 | |
| 14.99 | P48 | r | 21.42 0.31 | |
| 31.79 | P60/SEDM | r | 20.95 0.18 | |
| 32.91 | P48 | r | 20.43 0.21 | |
| 37.00 | Keck/LRIS† | r | 22.25 0.73 | |
| 246.29 | Keck/LRIS | r | 25.32 0.50 | |
| 771.05 | Keck/LRISd | r | 25.96 0.83 | |
| 0.03 | P48 | g | 20.24 0.12 | 0.055 |
| 4.00 | P200/DBSP† | g | 21.64 0.63 | |
| 9.00 | Keck/LRIS† | g | 20.35 0.63 | |
| 11.00 | Keck/LRIS† | g | 21.26 0.63 | |
| 11.86 | P60/SEDM | g | 21.17 0.23 | 0.051 |
| 12.87 | P60/SEDM | g | 22.55 0.59 | 0.051 |
| 13.82 | P60/SEDM | g | 21.53 0.24 | 0.050 |
| 25.78 | P60/SEDM | g | 20.75 0.31 | 0.041 |
| 31.79 | P60/SEDM | g | 21.02 0.13 | 0.035 |
| 37.00 | Keck/LRIS† | g | 22.33 0.63 | 0.028 |
| 246.29 | Keck/LRIS | g | 26.44 0.46 | -0.947 |
| 771.05 | Keck/LRISd | g | 27.15 0.73 | |
| 4.00 | P200/DBSP† | i | 20.91 0.68 | |
| 9.00 | Keck/LRIS† | i | 19.91 0.68 | |
| 11.00 | Keck/LRIS† | i | 20.57 0.68 | |
| 12.87 | P60/SEDM | i | 20.95 0.24 | |
| 13.82 | P60/SEDM | i | 21.68 0.57 | |
| 31.79 | P60/SEDM | i | 20.51 0.13 | |
| 37.00 | Keck/LRIS† | i | 21.75 0.68 | |
| 246.29 | Keck/LRIS | r+g | 24.99 0.41 |
2.4. Late-time observations
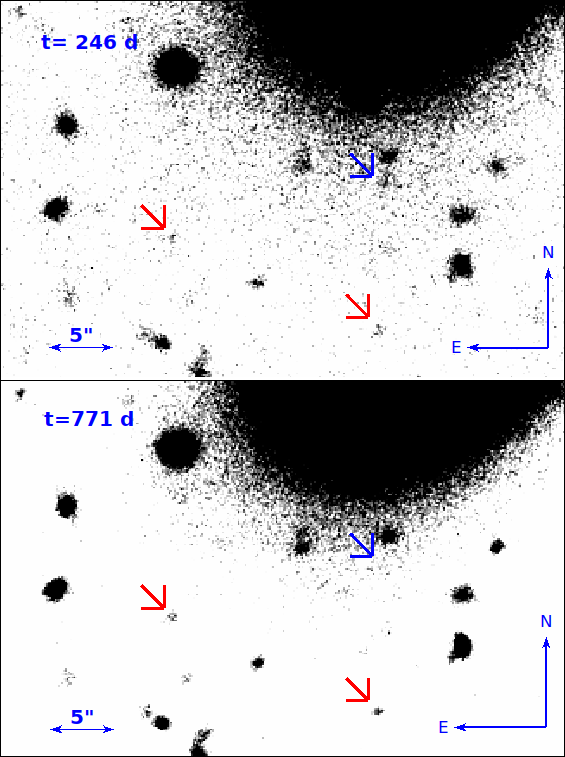
On the nights of 2017 June 24 ( d) and 2018 December 1 ( d) we obtained simultaneous r and g photometry of SN 2016hil with Keck/LRIS. The 2017 June data consist of four dithered exposures totaling 1290 s in g and 1200 s in r. The 2018 December data consist of eight dithered exposures totaling 2598 s in g and 2400 s in r. These data were processed following standard techniques for CCD reductions using LPipe.
In order to eliminate contamination by residual light from the nearby galaxy and from surrounding sources, aperture photometry was performed manually: background and background noise were estimated by establishing an elliptical contour of the host and extending it to reach the location of the event. A series of custom apertures (with a radius of ) were then constructed along this contour, and the background flux was measured with adjustments for any additional flux gradient. The manual measurements were performed in SAOImageDS9 (Joye & Mandel, 2003). The photometric zeropoints were acquired using unsaturated stars in the field and by comparing them to the converted SDSS catalog filters as discussed in Sect. 2.3. Extinction was treated as discussed in Sect. 2.3, and no S-corrections were applied.
In the first epoch, there were faint and marginally significant detections of the transient in r and g separately. In order to boost the significance of the detection, r and g images were summed, after manual cross-astrometry was performed using the Graphical Astronomy and Image Analysis Tool (GAIA; Draper et al. 2014). This resulted in a detection in the summed image.
In Fig. 4 a comparison between both epochs in the synthetic +g band is made, demonstrating the presence of a transient in the first epoch and its absence in the later epoch.
3. Results
3.1. Light curves
SN 2016hil has peculiar photometric properties for a spectroscopically regular SN II. These usually present a plateau light curve (IIP) or a linearly declining light curve (IIL); in the most rapid cases, the latter decline by mag over a period d (Arcavi, 2017). The light curve of SN 2016hil is thus unusually short lived, declining by mag in days. The event also presents a double peak in the bands, as can be corroborated from the lower panel of Fig. 3. Although not consistent with a plateau or a linear decline, the photometry is quite noisy. It remains to be seen whether these peculiarities will repeat in similar events in the future. For the rest of the paper, we assume the double peak of the light curve is real. However, none of our main conclusions change if this is not the case.
Unusual for a spectroscopically normal SN II, a double-peaked light curve is more characteristic of Type IIb events (see, e.g., Arcavi 2017 for discussion). The spectroscopic features of SN 2016hil, however, exclude the SN IIb classification since there are no strong helium signatures and prominent presence of hydrogen persists throughout the spectral evolution. In SNe IIb, double-peaked light curves have been suggested to be the result of a peculiar density structure Bersten et al. (2012). Nakar & Piro (2014) show that such a light curve can be produced by a compact core surrounded by an extended low-mass envelope. In some cases the double-peaked structure is attributed to binary interaction (as shown, for example, by Benvenuto et al. 2013). On the other hand, Sapir & Waxman, 2017 claim that such a density structure is not necessary to produce a double peak, which can be produced by a standard progenitor star. In such double-peaked light curves, the first peak is generally thought to be powered by shock cooling, and the second peak by the radioactive decay of . The double-peaked light curve of SN 2016hil seems to indicate that the event had at least an unusual progenitor.
3.2. Bolometric light curve
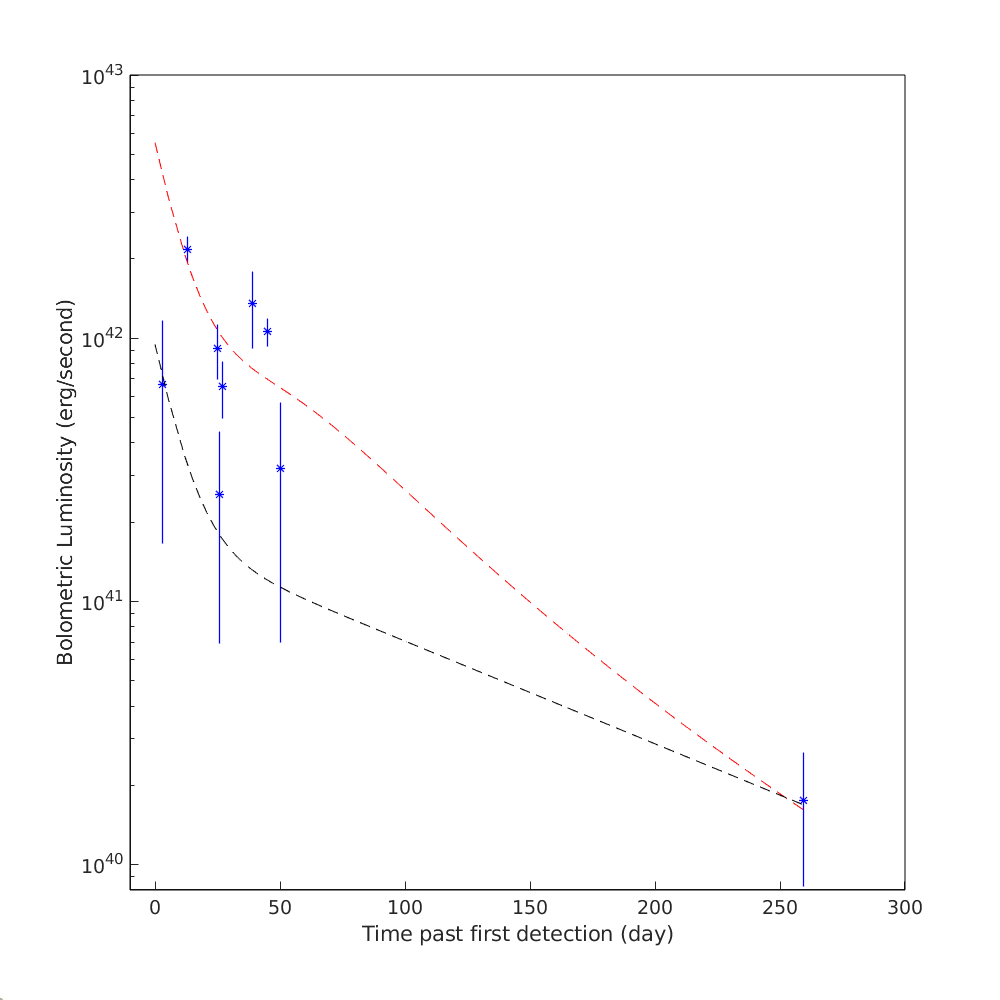
We estimated the bolometric light curve of SN 2016hil to see if it is consistent with a radioactively powered light curve, and acquire limits on the corresponding mass. The bolometric correction was estimated from g magnitudes and the g-r color, by using a quadratic fit to the color based on a sample of SNe II as described by Lyman et al. (2014). Since the color evolution was observed to be linear over the entire period of observations, but color was not available for all epochs, we fit a linear trend and used this fit to compute the bolometric correction for all times where a measurement in either g or r was available [including the late-time ( d) synthetic photometry point]. The bolometric correction as calculated appears in Table 2. Using the bolometric luminosity, the integrated bolometric energy output of the SN is estimated to be erg.
We assume the following model for decay (see Nakar et al., 2016; Wygoda et al., 2019; Katz et al., 2013). At early times, all -rays produced in the decay are scattered and deposit their energy in the ejecta. At late times, only a fraction of the -rays deposit their energy in the ejecta, where is the -ray escape time. A common interpolation for the intermediate times is , which captures the correct limits at late and early times. Using this, the total energy output produced by decay is given by
where is the total fraction of deposited energy due to the radioactive decay, including the energy deposited by positrons. Using this expression, we can place a lower bound on the total mass at late times by assuming that all the luminosity at 246 d is due to decay, and that . This gives a lower bound of . Alternatively, we can compute the for a given .
We can further note that since for all times ( is a conserved quantity, accounting for adiabatic losses), we can place an upper bound on the 56Ni mass for a given , using the 56Ni mass required to power the entire light curve:
This gives an upper limit of , above which the mass as measured from late times will not agree with the integrated luminosity. We note that this upper limit is somewhat dependent on the starting point of the integration, but will not change our results or conclusions significantly. For example, changing the explosion time to 5 days earlier than the first photometry point would increase the upper limit by to , which is still well within the typical range for SNe II.
In Fig. 5 we present the bolometric light curve plotted together with the two limiting cases , d and , for the energy production from decay. We can thus conclude that the late-time photometry of SN 2016hil can provide a content consistent with the second peak of the light curve being powered by decay.
3.3. Spectral properties
As can be seen in Fig. 2, spectra of SN 2016hil display a strong presence of hydrogen, but few other features were identified. SN 2016hil can thus be classified as a spectroscopically regular SN II. The absorption minima of the P-Cygni profile of the feature correspond to expansion velocities of km s throughout the spectral evolution. Across all spectra, this absorption minimum is weak relative to those of other Blamer features. This is more characteristic of a SN IIL than of a SN IIP (see, e.g., Fig. 18 in Arcavi 2017). In all spectra, there are no indications of narrow host emission lines, which could serve as indicators of SF. In the spectrum taken 11 d after detection, an unidentified broad emission feature appears near 6300 Å. It is not seen in the spectrum taken 2 d earlier, probably owing to the low S/N. The lack of other features seems to indicate a low metallicity, which is expected from a low-luminosity host galaxy (i.e., according to the mass- relation; Tremonti et al. 2004). However, since a metallicity gradient is present in many galaxies (e.g., Sánchez et al. 2014) the low metallicity of the event could also be consistent with the environment in the outskirts of the main host galaxy.
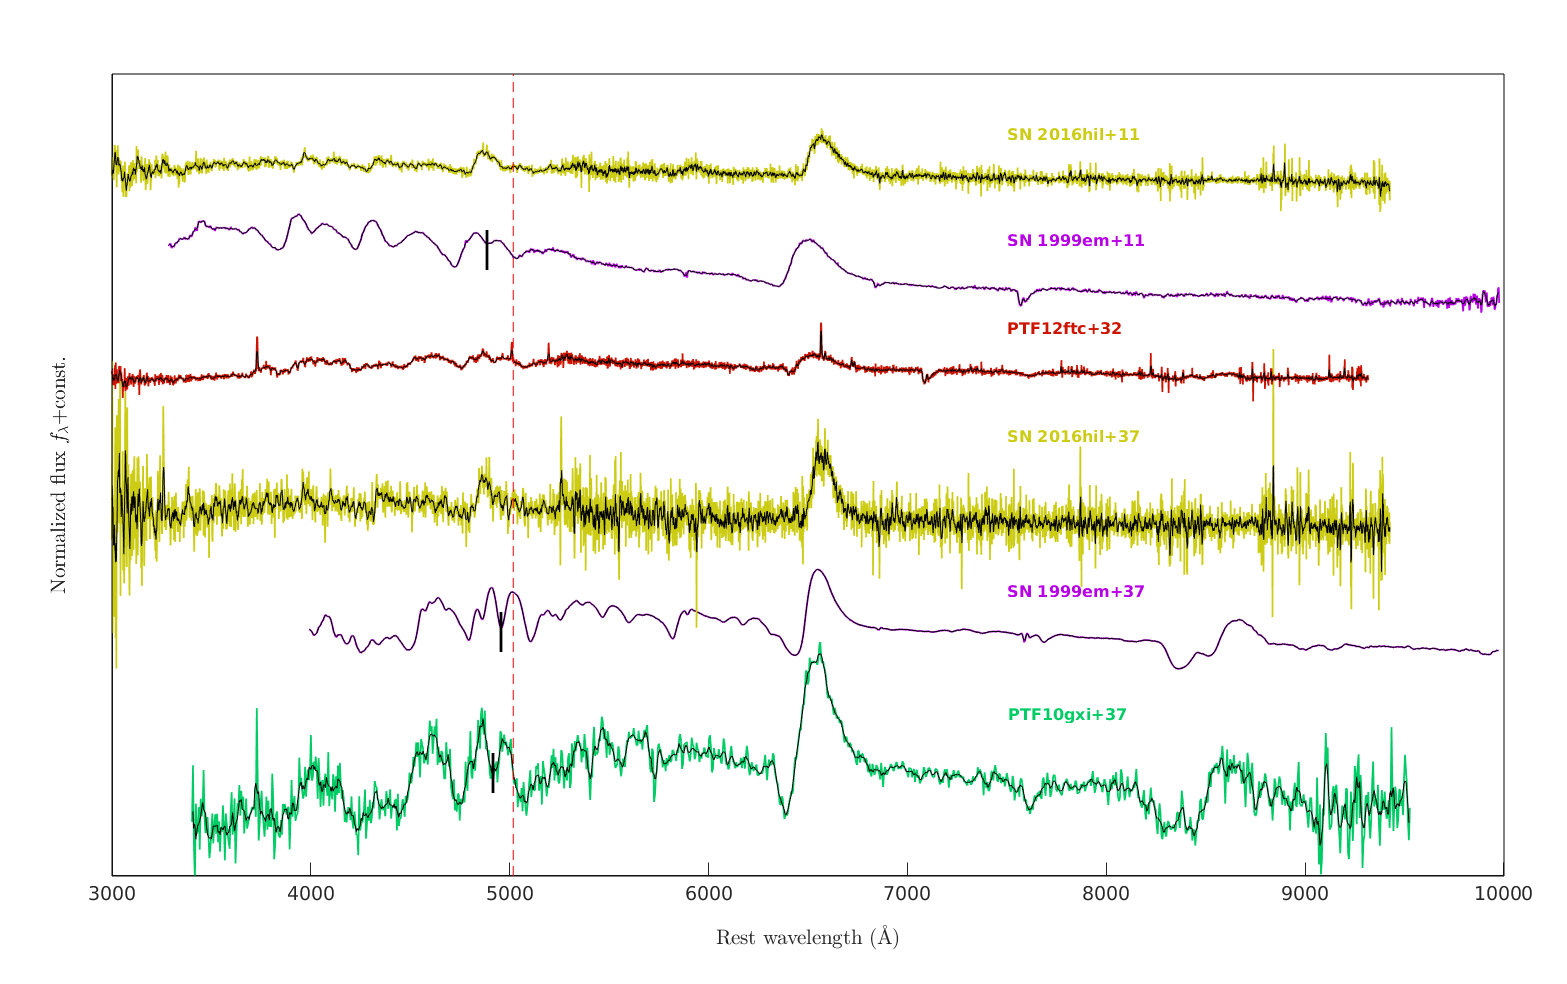
In a sample by Taddia et al. (2016), the strength of the Fe II feature was used to determine the metallicity according to the method of Dessart et al. (2014). In Fig. 6 we put the spectra of SN 2016hil in context of such SNe, including PTF10gxi and PTF12ftc for which the metallicity was determined to be . The fact that the Fe II feature is visible in the spectra of both SNe, and not in any of the spectra of SN 2016hil, suggests that it has a similar or lower metallicity content (e.g., Anderson et al., 2016, 2018).
| Date | (d) | Temperature (K) |
|---|---|---|
| 2016 Oct. 26 | 4 | 6462 40 |
| 2016 Oct. 31 | 9 | 7648 38 |
| 2016 Nov. 02 | 11 | 6709 16 |
| 2016 Nov. 28 | 37 | 7134 46 |
The continua of the spectra were fitted to blackbody emission. This was done by iteratively fitting a continuum, subtracting it, removing outliers, and refitting the remaining data, until the temperature converges. In all spectra, the temperature was found to be close to 7000 K, without a clear trend in time. Uncertainties were estimated using 68% confidence bounds, not accounting for systematic errors. The fitted temperatures and their corresponding uncertainties appear in Table 3.
3.4. Host galaxy
Identifying the host of SN 2016hil with certainty is crucial for putting this event in context. Our initial association of SN 2016hil with the galaxy SDSS J011024.51+141238.7 is primarily due to SN 2016hil having a redshift consistent with that of the nearby galaxy. We compared the host spectrum, acquired from the SDSS Science Archive Server (SAS), to templates of various galaxy types (Kinney et al., 1996). It is most consistent with being an E galaxy.
To put this host in context of the general population of host galaxies of SNe II, we compare its photometric properties to the host galaxies of the (i)PTF CCSN sample (Schulze et al., in prep.). This homogeneous sample consists of over 520 SNe II, detected between the beginning of 2009 and the beginning of 2017. We retrieved archival images of the host galaxy from Galaxy Evolution Explorer (GALEX) Data Release (DR) 8/9 (Martin et al., 2005), SDSS DR9 (Ahn et al., 2012), PS1 DR1 (Chambers et al., 2016), the Two-Micron All Sky Survey (2MASS; Skrutskie et al., 2006), and the unWISE (Lang, 2014) images from the NEOWISE (Meisner et al., 2017) Reactivation Year 3. Furthermore, we use the matched-aperture photometry software package Lambda Adaptive Multi-Band Deblending Algorithm in R (LAMBDAR; Wright et al., 2016) that is based on a photometry software package developed by Bourne et al. (2012) and tools which will be presented by Schulze et al. (in prep.). The photometry was either calibrated against zeropoints (GALEX, PS1, SDSS, and NeoWISE) or against a set of stars (2MASS). The resulting photometry is summarized in Table 4.
As for the (i)PTF CCSN host-galaxy sample, we model the spectral energy distribution (SED) of the host with the software package LePhare444http://www.cfht.hawaii.edu/~arnouts/LEPHARE/lephare.html version 2.2 (Arnouts et al., 1999; Ilbert et al., 2006) and standard assumptions (Bruzual & Charlot 2003 stellar population-synthesis models with the Chabrier initial mass function Chabrier 2003, an exponentially declining star-formation history and the Calzetti et al. 2000 attenuation curve).
| Instrument/ | Magnitude | |
|---|---|---|
| Filter | (Å) | |
| GALEX/FUV | 1542 | |
| GALEX/NUV | 2274 | |
| SDSS/ | 3595 | |
| SDSS/ | 4640 | |
| SDSS/ | 6122 | |
| SDSS/ | 7440 | |
| SDSS/ | 8897 | |
| PS1/ | 4776 | |
| PS1/ | 6130 | |
| PS1/ | 7485 | |
| PS1/ | 8658 | |
| PS1/ | 9603 | |
| 2MASS/ | 12,482 | |
| 2MASS/ | 16,620 | |
| 2MASS/ | 21,590 | |
| NEOWISE/ | 33,526 | |
| NEOWISE/ | 46,028 |
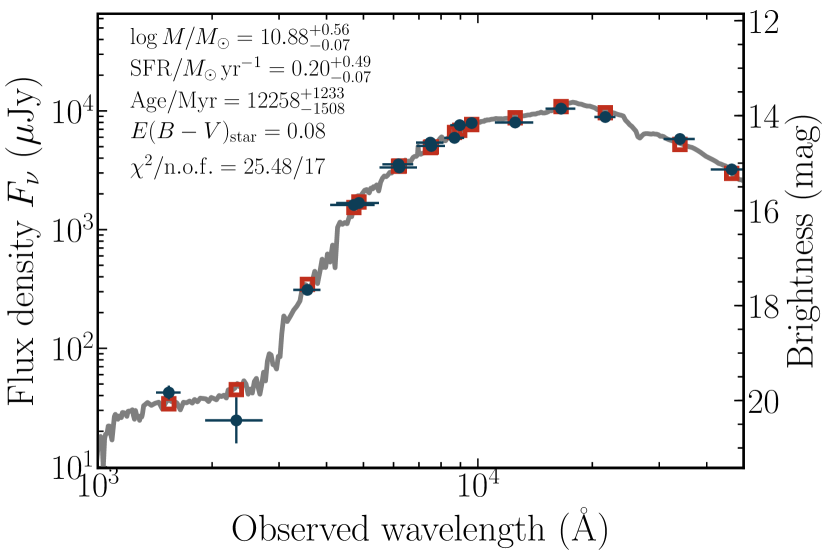
Figure 7 shows the observed SED. It is best described by a galaxy, dominated by an old stellar population, with a large stellar mass content of and a low SF rate (SFR) of . The age of the stellar population and the large mass corroborate the conclusion from the SDSS spectrum that this is indeed an E galaxy. The low but non-negligible SFR is not in conflict with this interpretation. Schawinski et al. (2007) showed that of a volume-limited sample of luminous E galaxies exhibited signs of recent SF.
Another option could be that SN 2016hil occurred in a faint satellite of the main host, where there is still SF activity. As can be seen in Fig. 4, the relatively deep Keck/LRIS images reveal no obvious dwarf galaxy or star-forming region at the location of SN 2016hil. Using the low-S/N () flux detected in the d epoch in the r and g bands, we attempt to constrain the galaxy mass and SFR of a possible dwarf satellite host. We repeated the SED fitting process using the r and g photometry. The results constrain the presence of a potential dwarf host such that , and SFR . As the SED is based only on g and r photometry, the mass estimate should be regarded as an upper limit.
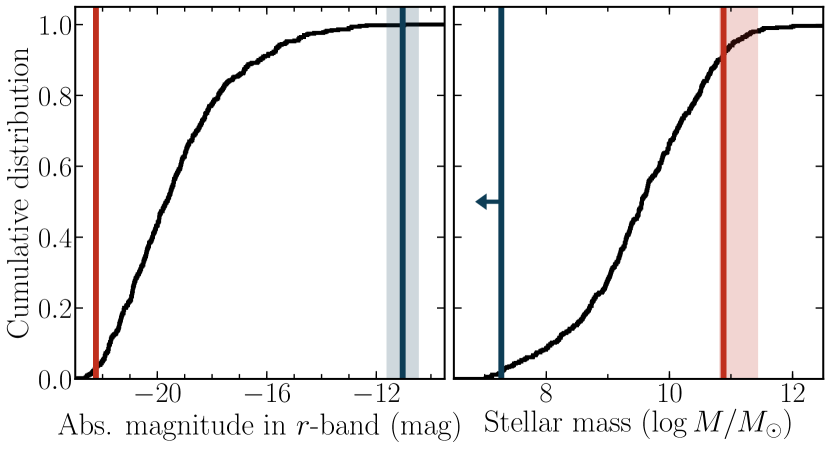
To put both host-galaxy candidates in the context of the general population of SN II host galaxies, we compare their masses and absolute magnitudes to those of the SN II hosts from the (i)PTF survey (Fig. 8; values taken from Schulze et al., in prep.). Both candidate host galaxies have extreme values for a SN II host. The E galaxy is among the most luminous and the most massive galaxies in the sample. At the other extreme, the potential dwarf galaxy cospatial with the SN site would be the least luminous host in the SN II (i)PTF sample. Moreover, the mass limit of puts this object at the low end of mass functions of star-forming galaxies.
4. Discussion and conclusions
Although it is a SN II, SN 2016hil was detected in an unlikely location – the extreme outskirts of an early-type galaxy, where no SF is expected. The SN presented a low-metallicity spectrum with moderate expansion velocities and blackbody temperatures. Its photometry reveals a double-peaked and short-lived light curve, and late-time photometric observations are consistent with a mass sufficient to power the second peak. This being said, the quality of the photometric data is relatively low. It remains to be seen whether similar future events will exhibit comparable properties.
Deep optical photometry of the environment of SN 2016hil shows no significant sources which could have provided an alternative host where normal SF activity would still be taking place. This, as well as the fact that the nearby galaxy shares the same redshift as SN 2016hil, make it the immediate candidate for being the host of SN 2016hil. Still, we do not have enough data to fully exclude the possibility of a very faint host gravitationally bound to the nearby galaxy. That being said, such a dwarf host would have mag and an extremely low stellar content of . Whether such an extreme host exists could be probed with very deep observations in the visible (below our current Keck limits), and any SF can be best probed by deep observations in the UV from HST.
SN 2016hil is thus either a peculiar SN in a normal galaxy, or a peculiar SN in a peculiar galaxy. In either case, this unusual host environment could have interesting implications. We outline several possibilities for the origin of SN 2016hil.
(1) The progenitor was formed in the main part of the nearby E host, and was ejected with high velocity. In such a case, the event is tracing a residual population of massive stars in early-type galaxies – the result of the remaining high-mass () star formation in the host. Kasliwal et al. (2012) show that the vast majority of SNe occur within of the host-galaxy nucleus. A simple calculation demonstrates that such a star would have to travel with a velocity of in order to travel within the of its life span. We tentatively conclude that this option does not seem very likely, as it requires two rare phenomena to occur: residual SF in an E galaxy and a hypervelocity ejection.
(2) The star was formed locally in a star-forming satellite of the E galaxy, which still produces high-mass stars. This option is favored as it does not require any modification of the standard paradigm of SN II formation, but is disfavored by the fact that we have strong constraints on the mass and luminosity of a possible host at the location of the event, which can be further tightened in the near future. If this turns out to be the case, SN 2016hil would be the SN II with the faintest host observed by (i)PTF to date. Collecting the statistics of such seemingly hostless SNe could provide a handle on the number of almost invisible faint dwarf galaxies in a given volume and redshift.
(3) The progenitor is part of a middle-aged diffuse population of stars extending around the host. How can such stars explode as SNe II? Several ideas involving interactions of lower-mass progenitors have been proposed. Zapartas et al. (2017) outline evolutionary channels through which “late” CCSNe (up to 200 Myr after star formation) may occur. One option is that a pair of main-sequence (MS) intermediate-mass stars (4–8 ), or an intermediate-mass MS star and a post-MS star, could merge completely. Such a merger would revive the merger product, which will recover its equilibrium structure and eventually terminate in a CCSN. Other options include the reverse merger of a compact object and a post-MS star, resulting in a CCSN after an initial common-envelope phase, as discussed by Sabach & Soker (2014).
These binary interaction scenarios could provide a reasonable explanation for a double-peaked light curve – in the aftermath of a merger, we expect a significant increase in the size of the surrounding envelope. Such an expansion could create a low-mass and extended envelope that could could produce the two peaks. This is reminiscent of our current understanding of SNe IIb, where the envelope of a star is thought to be mostly stripped owing to binary interaction, thus revealing the helium core during its spectral evolution. In this case, however, a hydrogen envelope could remain around the merged core, so that the spectral evolution would remain dominated by hydrogen.
With the increasing number of SNe detected in the era of automated wide-area transient surveys, new populations of transients are being revealed. We expect that events similar to SN 2016hil will be discovered in the near future, and a population could be established. SN 2016hil shows some potentially peculiar spectroscopic and photometric properties, in addition to its unusual location. Once we discover more SN 2016hil-like events, we can identify their observational characteristics. These will presumably allow us to answer the question of their origin.
5. Acknowledgements
We thank A. Ho and K. De for assistance with some of the observations. A.G.-Y. is supported by the EU via ERC grant No. 725161, the ISF, the BSF Transformative program, and a Kimmel award. A.V.F.’s supernova group at U.C. Berkeley is supported by the TABASGO Foundation, the Christopher R. Redlich Fund, Gary and Cynthia Bengier, and the Miller Institute for Basic Research in Science.
This research has made use of the NASA/IPAC Extragalactic Database (NED), which is operated by the Jet Propulsion Laboratory, California Institute of Technology, under contract with the National Aeronautics and Space Administration (NASA). Part of this research was carried out at the Jet Propulsion Laboratory, California Institute of Technology, under a contract with NASA. Some of the data presented herein were obtained at the W.M. Keck Observatory, which is operated as a scientific partnership among the California Institute of Technology, the University of California, and NASA; the Observatory was made possible by the generous financial support of the W.M. Keck Foundation. The authors wish to recognize and acknowledge the very significant cultural role and reverence that the summit of Maunakea has always had within the indigenous Hawaiian community. We are most fortunate to have the opportunity to conduct observations from this mountain. Based in part on observations obtained with the 48-inch Samuel Oschin Telescope and the 60-inch Telescope at the Palomar Observatory as part of the intermediate Palomar Transient Factory (iPTF) project, a scientific collaboration among the California Institute of Technology, Los Alamos National Laboratory, the University of Wisconsin, Milwaukee, the Oskar Klein Center, the Weizmann Institute of Science, the TANGO Program of the University System of Taiwan, and the Kavli Institute for the Physics and Mathematics of the Universe.
References
- Ahn et al. (2012) Ahn, C. P., Alexandroff, R., Allende Prieto, C., et al. 2012, ApJS, 203, 21
- Anderson et al. (2016) Anderson, J. P., Gutiérrez, C. P., Dessart, L., et al. 2016, A&A, 589, A110
- Anderson et al. (2018) Anderson, J. P., Dessart, L., Gutiérrez, C. P., et al. 2018, Nature Astronomy, 2, 574
- Arcavi (2017) Arcavi, I. 2017, in Handbook of Supernovae, ed. A. W. Alsabti & P. Murdin (Springer International Publishing AG), 239
- Arcavi et al. (2010) Arcavi, I., Gal-Yam, A., Kasliwal, M. M., et al. 2010, ApJ, 721, 777
- Arnouts et al. (1999) Arnouts, S., Cristiani, S., Moscardini, L., et al. 1999, MNRAS, 310, 540
- Bellm et al. (2019) Bellm, E. C., Kulkarni, S. R., Graham, M. J., et al. 2019, Publications of the Astronomical Society of the Pacific, 131, 018002
- Benvenuto et al. (2013) Benvenuto, O. G., Bersten, M. C., & Nomoto, K. 2013, ApJ, 762, 74
- Bersten et al. (2012) Bersten, M. C., Benvenuto, O. G., Nomoto, K., et al. 2012, ApJ, 757, 31
- Blagorodnova et al. (2018) Blagorodnova, N., Neill, J. D., Walters, R., et al. 2018, Publications of the Astronomical Society of the Pacific, 130, 035003
- Bourne et al. (2012) Bourne, N., Maddox, S. J., Dunne, L., et al. 2012, MNRAS, 421, 3027
- Bruzual & Charlot (2003) Bruzual, G., & Charlot, S. 2003, MNRAS, 344, 1000
- Calzetti et al. (2000) Calzetti, D., Armus, L., Bohlin, R. C., et al. 2000, ApJ, 533, 682
- Chabrier (2003) Chabrier, G. 2003, PASP, 115, 763
- Chambers et al. (2016) Chambers, K. C., Magnier, E. A., Metcalfe, N., et al. 2016, arXiv:1612.05560
- Crocker et al. (2011) Crocker, A. F., Bureau, M., Young, L. M., & Combes, F. 2011, MNRAS, 410, 1197
- Dessart et al. (2014) Dessart, L., Gutierrez, C. P., Hamuy, M., et al. 2014, MNRAS, 440, 1856
- Draper et al. (2014) Draper, P. W., Gray, N., Berry, D. S., & Taylor, M. 2014, GAIA: Graphical Astronomy and Image Analysis Tool, ascl:1403.024
- Filippenko (1997) Filippenko, A. V. 1997, Annual Review of Astronomy and Astrophysics, 35, 309
- Filippenko et al. (2003) Filippenko, A. V., Chornock, R., Swift, B., et al. 2003, International Astronomical Union Circular, 8159, 2
- Gal-Yam (2017) Gal-Yam, A. 2017, in Handbook of Supernovae, ed. A. W. Alsabti & P. Murdin (Springer International Publishing AG), 195
- Hakobyan et al. (2012) Hakobyan, A. A., Adibekyan, V. Z., Aramyan, L. S., et al. 2012, A&A, 544, A81
- Hosseinzadeh et al. (2019) Hosseinzadeh, G., McCully, C., Zabludoff, A. I., et al. 2019, ApJ, 871, L9
- Ilbert et al. (2006) Ilbert, O., Arnouts, S., McCracken, H. J., et al. 2006, A&A, 457, 841
- Irani (2019) Irani, I. 2019, Transient Name Server Classification Report, 2019-199, 1
- James & Anderson (2006) James, P. A., & Anderson, J. P. 2006, A&A, 453, 57
- Joye & Mandel (2003) Joye, W. A., & Mandel, E. 2003, in Astronomical Society of the Pacific Conference Series, Vol. 295, Astronomical Data Analysis Software and Systems XII, ed. H. E. Payne, R. I. Jedrzejewski, & R. N. Hook, 489
- Kasliwal & Cao (2018) Kasliwal, M., & Cao, Y. 2018, Transient Name Server Discovery Report, 2018-1623, 1
- Kasliwal et al. (2012) Kasliwal, M. M., Kulkarni, S. R., Gal-Yam, A., et al. 2012, ApJ, 755, 161
- Katz et al. (2013) Katz, B., Kushnir, D., & Dong, S. 2013, arXiv:1301.6766
- Kaviraj et al. (2009) Kaviraj, S., Peirani, S., Khochfar, S., Silk, J., & Kay, S. 2009, MNRAS, 394, 1713
- Kaviraj et al. (2007) Kaviraj, S., Schawinski, K., Devriendt, J. E. G., et al. 2007, ApJS, 173, 619
- Kaviraj et al. (2008) Kaviraj, S., Khochfar, S., Schawinski, K., et al. 2008, MNRAS, 388, 67
- Kawabata et al. (2010) Kawabata, K. S., Maeda, K., Nomoto, K., et al. 2010, Nature, 465, 326
- Kinney et al. (1996) Kinney, A. L., Calzetti, D., Bohlin, R. C., et al. 1996, ApJ, 467, 38
- Kulkarni (2013) Kulkarni, S. R. 2013, The Astronomer’s Telegram, 4807, 1
- Lang (2014) Lang, D. 2014, AJ, 147, 108
- Law et al. (2009) Law, N. M., Kulkarni, S. R., Dekany, R. G., et al. 2009, Publications of the Astronomical Society of the Pacific, 121, 1395
- Lunnan et al. (2017) Lunnan, R., Kasliwal, M. M., Cao, Y., et al. 2017, ApJ, 836, 60
- Lyman et al. (2014) Lyman, J. D., Bersier, D., & James, P. A. 2014, MNRAS, 437, 3848
- Martin et al. (2005) Martin, D. C., Fanson, J., Schiminovich, D., et al. 2005, ApJ, 619, L1
- Meisner et al. (2017) Meisner, A. M., Lang, D., & Schlegel, D. J. 2017, AJ, 153, 38
- Nakar & Piro (2014) Nakar, E., & Piro, A. L. 2014, ApJ, 788, 193
- Nakar et al. (2016) Nakar, E., Poznanski, D., & Katz, B. 2016, ApJ, 823, 127
- Ofek (2014) Ofek, E. O. 2014, MATLAB package for astronomy and astrophysics, ascl:1407.005
- Oke & Gunn (1982) Oke, J. B., & Gunn, J. E. 1982, PASP, 94, 586
- Oke et al. (1995) Oke, J. B., Cohen, J. G., Carr, M., et al. 1995, PASP, 107, 375
- Perets et al. (2011) Perets, H. B., Gal-yam, A., Crockett, R. M., et al. 2011, ApJ, 728, L36
- Perets et al. (2010) Perets, H. B., Gal-Yam, A., Mazzali, P. A., et al. 2010, Nature, 465, 322
- Perley (2019) Perley, D. A. 2019, arXiv:1903.07629
- Planck Collaboration et al. (2014) Planck Collaboration, Ade, P. A. R., Aghanim, N., et al. 2014, A&A, 571, A16
- Sabach & Soker (2014) Sabach, E., & Soker, N. 2014, MNRAS, 439, 954
- Sánchez et al. (2014) Sánchez, S. F., Rosales-Ortega, F. F., Iglesias-Páramo, J., et al. 2014, A&A, 563, A49
- Sanders et al. (2013) Sanders, N. E., Soderberg, A. M., Foley, R. J., et al. 2013, ApJ, 769, 39
- Sapir & Waxman (2017) Sapir, N., & Waxman, E. 2017, ApJ, 838, 130
- Schawinski et al. (2007) Schawinski, K., Kaviraj, S., Khochfar, S., et al. 2007, ApJS, 173, 512
- Schlafly & Finkbeiner (2011) Schlafly, E. F., & Finkbeiner, D. P. 2011, ApJ, 737, 103
- Shappee et al. (2014) Shappee, B., Prieto, J., Stanek, K. Z., et al. 2014, in American Astronomical Society Meeting Abstracts, Vol. 223, American Astronomical Society Meeting Abstracts #223, 236.03
- Skrutskie et al. (2006) Skrutskie, M. F., Cutri, R. M., Stiening, R., et al. 2006, AJ, 131, 1163
- Smartt (2009) Smartt, S. J. 2009, Annual Review of Astronomy and Astrophysics, 47, 63
- Soker (2019) Soker, N. 2019, arXiv:1902.01187
- Stritzinger et al. (2002) Stritzinger, M., Hamuy, M., Suntzeff, N. B., et al. 2002, AJ, 124, 2100
- Suh et al. (2011) Suh, H., Yoon, S.-c., Jeong, H., & Yi, S. K. 2011, ApJ, 730, 110
- Taddia et al. (2016) Taddia, F., Moquist, P., Sollerman, J., et al. 2016, A&A, 587, L7
- Tonry et al. (2018) Tonry, J. L., Denneau, L., Heinze, A. N., et al. 2018, Publications of the Astronomical Society of the Pacific, 130, 064505
- Tremonti et al. (2004) Tremonti, C. A., Heckman, T. M., Kauffmann, G., et al. 2004, ApJ, 613, 898
- Waldman et al. (2011) Waldman, R., Sauer, D., Livne, E., et al. 2011, ApJ, 738, 21
- Wright et al. (2016) Wright, A. H., Robotham, A. S. G., Bourne, N., et al. 2016, MNRAS, 460, 765
- Wygoda et al. (2019) Wygoda, N., Elbaz, Y., & Katz, B. 2019, MNRAS, 484, 3941
- Wyrzykowski et al. (2012) Wyrzykowski, Ł., Hodgkin, S., Blogorodnova, N., Koposov, S., & Burgon, R. 2012, in 2nd Gaia Follow-up Network for Solar System Objects, 21
- Yaron & Gal-Yam (2012) Yaron, O., & Gal-Yam, A. 2012, Publications of the Astronomical Society of the Pacific, 124, 668
- York et al. (2000) York, D. G., Adelman, J., Anderson, Jr., J. E., et al. 2000, AJ, 120, 1579
- Zapartas et al. (2017) Zapartas, E., de Mink, S. E., Izzard, R. G., et al. 2017, A&A, 601, A29