Imaging the AGN Torus in Cygnus A
Abstract
We present the first direct imaging of what may be the thick torus in the active galactic nucleus (AGN) of the archetype powerful radio galaxy Cygnus A, using the Jansky Very Large Array (VLA) at 18 GHz to 48 GHz, with a resolution down to 45 mas. Such a torus has long been a key component of AGN models, but direct imaging on the relevant physical scales in sources of extreme (quasar-like) luminosities, remains scarce. An elongated structure, perpendicular to the radio jets and centered on the core, is well resolved, with a full length of (528 pc), and a full width of (286 pc). The radio emission spectrum is consistent with optically thin free-free emission. We present a toy model of a flaring torus, with a half-opening angle for the poloidal region of . The radio jets are oriented along the poles. The observations require a clumpy gas distribution, with the free-free emission dominated by clumps with densities cm-3
Subject headings:
galaxies - radio, AGN - jets1. Introduction
An active galactic nucleus (AGN) corresponds to the process of prodigious energy production by gas in-fall onto a supermassive black hole (SMBH; Hickox & Alexander (2018); Netzer (2015); Ramos-Almeida & Ricci (2017)). In order to explain the observed spectral properties of AGN at gamma-ray through radio wavelengths, a number of structural elements have been hypothesized: On scales pc, a hot, thin accretion disk is formed immediately around the SMBH, giving rise to X-ray emission, and to the ultraviolet ’big blue bump’. Highly ionized gas clouds in this inner zone give rise to broad UV and optical emission lines (line widths km s-1). On scales of a few pc to 100 pc, gas from the host galaxy falls into a zone dominated by the gravitational potential of the SMBH. Conservation of angular momentum drives the gas to form a toroidal structure, centered on the SMBH. This torus is seen predominantly through infrared emission from warm dust. The poloidal regions of the torus are lower density, and the residual gas clouds in these regions are ionized by radiation from the AGN, giving rise to narrow (few hundred km s-1), optical emission lines. At larger radii, beyond the radius where the supermassive black hole dominates the gravitational potential, the structures then merge with the large-scale structures of the parent galaxy itself. In some 10% of AGN, highly collimated relativistic jets of plasma are generated, oriented along the polar axis of the torus, and emitting strong radio synchrotron emission.
While the above picture may be idealized, a structure acting as a thick obscuring torus is a defining aspect of the AGN unification model: Type 1 AGN (broad line), correspond to sources where our line of sight passes down the axis of the polar region, providing an unobscured view of the hot accretion disk and broad line region. For Type 2 AGN (narrow line), our line of sight to the broad line region and hot accretion disk passes through the torus, and hence these regions are obscured in the optical by dust in the torus (Hickox & Alexander, 2018; Urry & Padovani, 1995; Antonucci, 1984; Barvainis, 1987). The obscuring torus is part of the general unification model of radio loud quasars and radio galaxies, with the former being the radio loud Type I AGN, and the latter, Type II. The radio jets propagate along the polar direction of the torus. Certainly, the rich relationship between Type I and II AGN is more involved (Padovani et al., 2017), however, the notion of an obscuring torus remains paramount in the physics and unification of Type I and II AGN.
An important conclusion regarding AGN obscuring tori is clumpiness. Both Type I and II AGN show a similar correlation between the mid-IR emission and hard X-ray emission, implying a large mean free path for both X-ray and mid-IR photons in the torus. Hence, the tori must be clumpy and multi-phase, with dense clouds of self-shielding dust embedded in a medium of atomic and ionized gas (Tacconi et al., 1994; Nenkova et al., 2008; Ramos-Almeida & Ricci, 2017). Collisions between clumps are also invoked to increase turbulent pressure, to help provide vertical support of the torus, along with radiation pressure, and possibly magnetic pressure (Netzer, 2015; Krolik & Begelman, 1988; Krolik, 2007).
Observations with near-IR interferometers, and with the HST, as well as high resolution ALMA observations of gas and dust, are starting to resolve torus-scale regions in growing samples of AGN, such as Centaurus A, NGC 1068, Circinus, 3C 273, and others (Garcia-Burillo et al., 2016; Izumi et al., 2018; Burtscher et al., 2013; Tristram et al., 2009; Gallimore et al., 1997, 2004, 2016; Combes, 2018; Aalto, 2017; Imanishi et al., 2018; Gravity Collaboration, 2018; Jaffe et al., 1996, 2004). However, the samples are, for the most part, comprised of lower luminosity AGN, and even in the more extreme cases, such as 3C 273, the black hole masses are still an order of magnitude smaller than in Cygnus A.
Cygnus A, at z = 0.0562, is ten times closer than the next radio galaxy of similar radio luminosity111Radio luminosity erg s-1. The nuclear regions in Cygnus A have been observed extensively at radio through X-ray wavelengths (Carilli & Barthel, 1996). The inner few arcseconds is a complex mix of optically obscuring dust clouds (Vestergaard & Bartel, 1993; Lopez-Rodriguez et al., 2014; Whysong & Antonucci, 2004; Merlo et al., 2014), atomic gas seen in narrow line emission (Stockton et al., 1994; Taylor et al., 2003), HI 21cm absorption toward the inner radio jets, with a neutral atomic column density cm-2, depending on HI excitation temperature (Struve & Conway, 2010), polarized, broad optical emission lines due to scattering by dust (Antonucci et al., 1994; Ogle et al., 1997), and a highly absorbed hard X-ray spectrum with a total gas column density of cm-2 (Reynolds et al., 2015; Ueno et al., 1994). VLBI radio observations at 0.05 mas resolution reveal highly collimated jets originating on scales times the Schwarzschild radius (Boccardi et al., 2016). Tadhunter et al. (2003), derive a black hole mass of M⊙ from HST and Keck spectroscopy of Pa- and [OIII], and conclude that Cygnus A contains an AGN with a bolometric luminosity of order 1046 erg s-1, comparable to high redshift quasars (Runnoe et al., 2012). This AGN is highly obscured in the optical due to dust along our line of sight, with magnitudes, based on near-IR spectroscopy (Imanishi & Ueno, 2000). Studies of the mid- to far-IR spectral and polarization properties have led to a model of a clumpy, dusty torus obscuring the AGN in Cygnus A, with a radius of at least 130 pc, although these conclusions are based on spatially integrated properties; these observations did not have the spatial resolution to resolve the torus, and hence are partially contaminated by emission from the radio core-jet (Privon et al., 2012; Lopez-Rodriguez et al., 2018).
While substantial evidence exists for an obscured AGN with a quasar-like luminosity in the center of Cygnus A, to date, no direct imaging observations have been made of the torus at a resolution and sensitivity sufficient to resolve the torus structures on the relevant scales of 50 pc to 100 pc. In this letter, we present VLA observations of the nuclear regions of Cygnus A down to 45 mas resolution222At the distance of Cygnus A, mas. We detect a prominent structure perpendicular to the radio jet axis, centered on the core. The emission spectrum of this structure is consistent with free-free emission. We model this as emission from the ionized gas associated with the thick, clumpy torus.
2. Observations, Calibration, and Imaging
Cygnus A was observed for 5 hours on October 21, 2016, and on April 28, 2018, with the VLA in its A configuration. Observations were made in five frequency bands, including the 18 GHz to 26 GHz band, the 30 to 38 GHz band, and the 40 to 48 GHz band, using the wide band (8 GHz) correlator set-up in full polarization333We also present spectral points for the radio core from lower frequencies observed as part our larger Cygnus A VLA program. These data will be presented in full elsewhere (Perley et al. in prep)..
Editing and calibration of the data utilized the AIPS processing system. The flux density scale was set using coefficients for 3C48 for 2016 observations, and 3C286 for 2018 observations (Perley & Butler, 2013a). The accuracy of the flux scale, including errors associated with transfer of the flux density scale to the target objects, is estimated to be . Bandpass and delay calibration utilized the nearby point-source J2007+4029, which was in turn utilized for amplitude and phase calibration of the target source Cygnus A. Polarization calibration utilized J2007+4029 to determine the leakage terms, and both 3C48 and 3C286 to set the linear polarization position angle (Perley & Butler, 2013b).
Self-calibration was employed starting with a point source model for the nucleus of Cygnus A. The nucleus dominates the visibilities above 20 GHz, at the resolution of the VLA A-configuration, where the lobes and hot spots are highly attenuated by the primary beam and highly resolved by the interferometer. Further self-calibration using the resulting clean component model resulted in a final dynamic range .
The visibility data, with the optimum radio core flux subtracted (see the appendix), were then ported to CASA, where imaging was performed using a multifrequency synthesis CLEAN, with Briggs weighting with robust = -0.5. The imaging was performed separately on 2GHz wide sub-bands within the bands, for a total of 12 frequency images from 19 GHz to 47 GHz. The primary beam of the VLA has a FWHM of at 23 GHz, at 34 GHz and at 44 GHz. The full double lobed radio source in Cygnus A has an extent of , hence the hot spots at the extremities of the lobes, and outer lobes, which dominate the luminosity of the source, are highly down-weighted by the primary beam. Still, the shortest visibility spacings showed substantial emission from large scale structure, and a uv-minimum of 200 k was employed to avoid artefacts from large scale structure. At 34 GHz and 43 GHz, a uv-taper was employed to obtain a CLEAN Gaussian restoring beam of FWHM = 45 mas. At 22 GHz, the restoring clean beam had FWHM = 67 mas, and images in the 34 GHz and 44 GHz bands were also made at 67 mas resolution.
3. Results
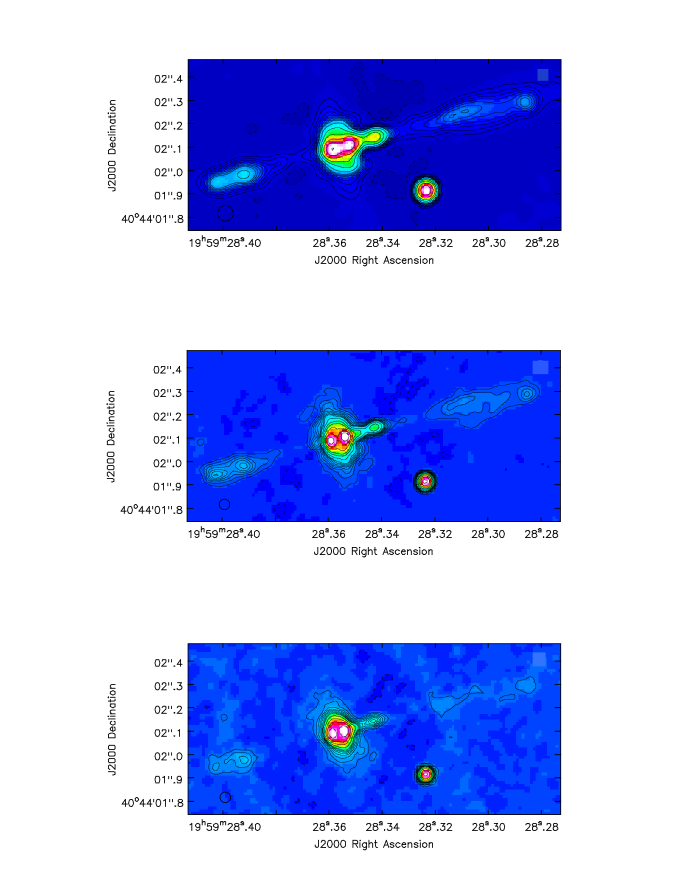
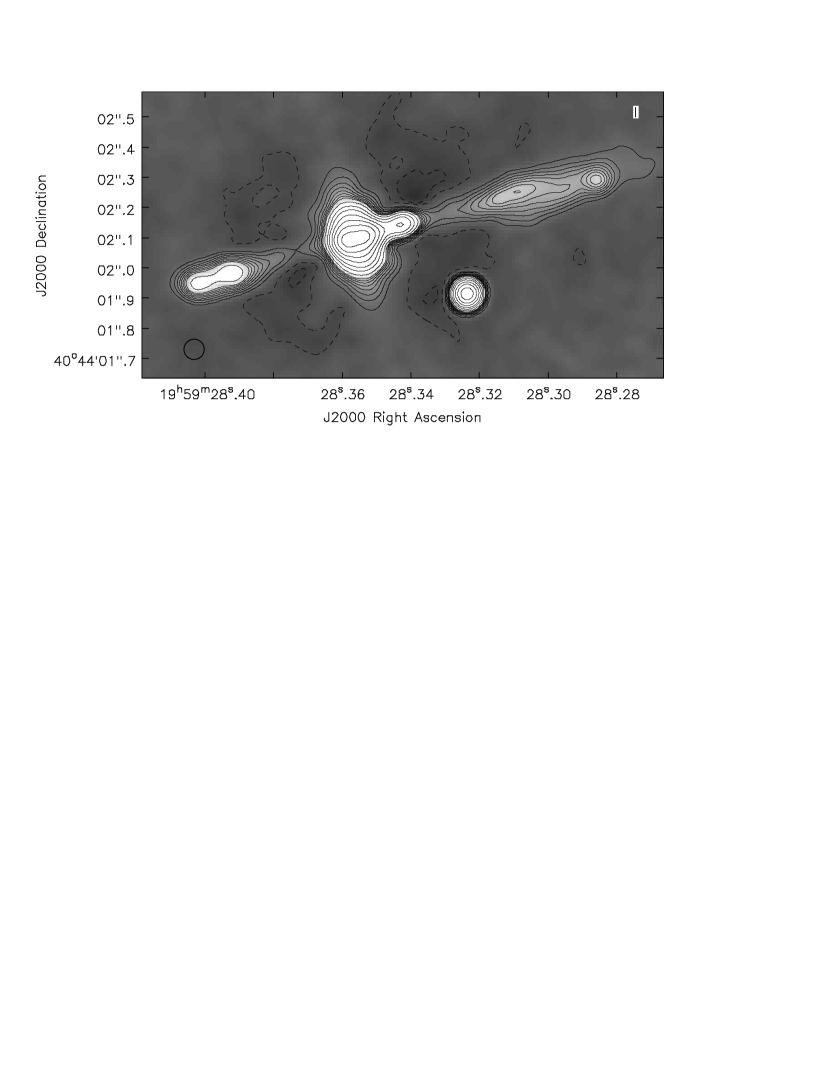
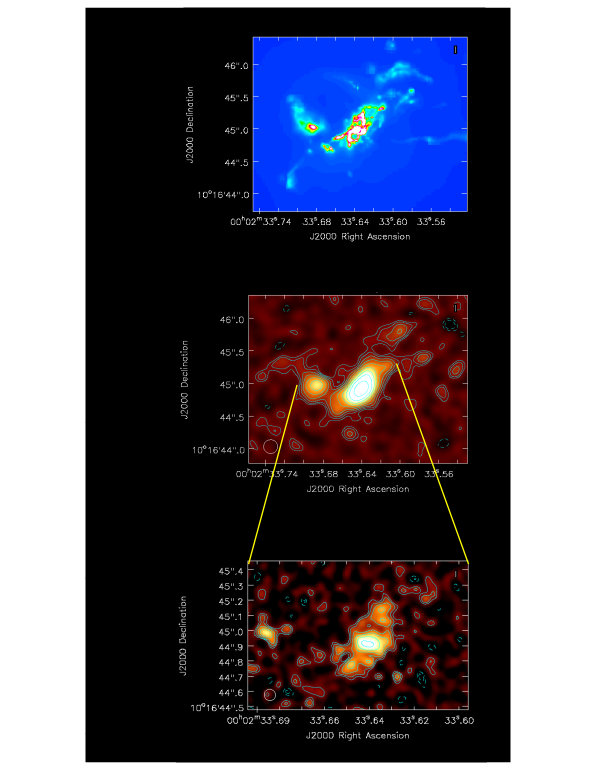
Figure 1 shows the resulting images in each high frequency band, and Figure 2 shows the summed image of the three bands, all after subtraction of the strong nuclear point source (see appendix). The resolution is 45mas in the 34 GHz and 44 GHz bands, and 67 mas in the 22 GHz band and in the summed image. The jets are seen ranging from to distance from the radio core, oriented roughly north of west. The recently discovered radio transient is detected southwest of the nucleus (Perley et al., 2017). Two knots of emission are seen within 50 mas of the core, along the jet directions, in these core-subtracted images. These knots may correspond to the inner radio jets seen on small scales (Carilli et al., 1994; Sorathia et al., 1996; Krichbaum et al., 1998), although, based on analysis of the core subtraction process (see the appendix), we restrict our quantitative analysis to radii further than about the FHWM of the lower resolution image ( mas), from the core.
The focus of this paper is the structure seen extending perpendicular to the jet direction, symmetrically to the north and south of the core. The structure is very similar in the high resolution images at Ka and Q band. The full lengths of the major and minor axes at the 4 surface brightness level in the summed image are 480 mas and 260 mas, respectively. In the analysis below, we adopt the term ’torus’ for this structure, for ease of reference.
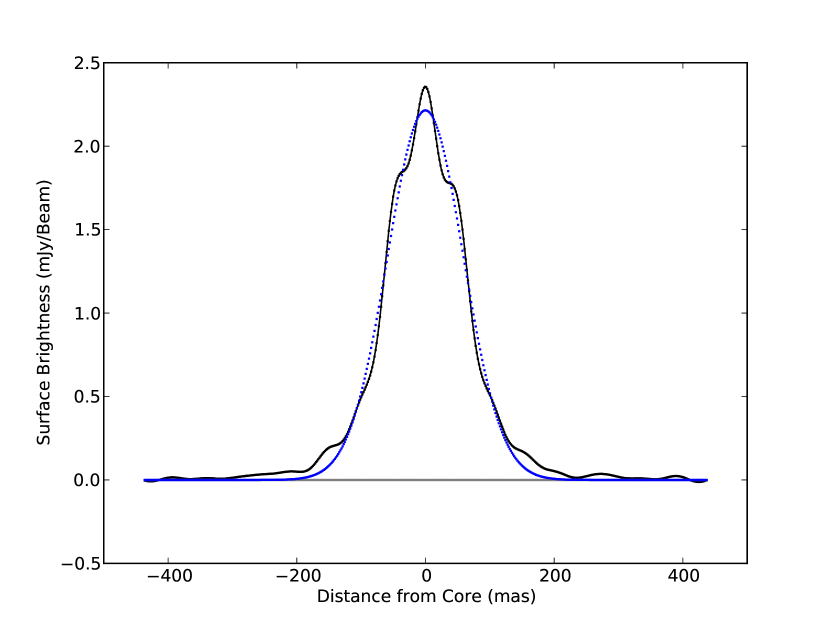
Figure 3 shows a slice in surface brightness along the torus in the 32 GHz image, through the core position and perpendiculat to the jet. We do not consider the structure in the inner mas reliable, due to unknowns in the core subtraction process (see appendix). Beyond 50 mas distance from the core, the torus is reasonably well characterized by Gaussian wings with a FWHM = 138 mas, out to about 125 mas radius. Beyond that, the torus shows a broader skirt, again extending to about 240 mas radius, before it is lost in the noise.
We imaged the polarized emission from the nuclear regions of Cygnus A. A faint (4.5 mJy) point source is present in the polarized intensity image at the position of the core, implying a fractional polarization at 35GHz of 0.3%. We consider this an upper limit, given it is at the limit of the polarization calibration capabilities of the VLA (Perley & Butler, 2013b). No polarized emission is seen anywhere else in the region, down to a level of 50 Jy beam-1 at 35 GHz, and 70 Jy beam-1 at 43 GHz. The upper limit to the fractional polarization at the positions of the torus considered in the spectra below is about 10% (1). The limits for the brighter inner halo, and bright jet knot 150 mas northwest of the core, are a few percent.
4. Analysis
4.1. Spectrum and
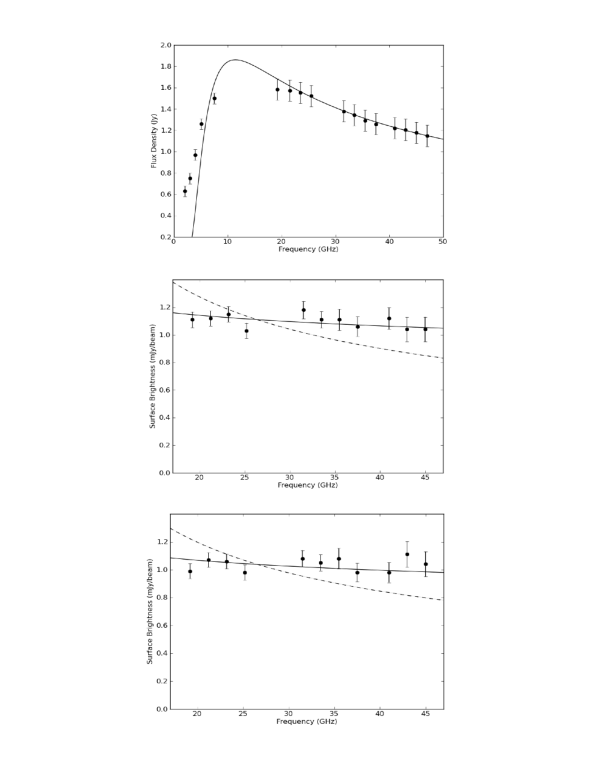
Figure 4 shows spectra at different positions along the torus. Figure 4a is a spectrum of the radio core itself, made at resolutions ranging from the 45 mas at high frequency, to about at the lowest frequency. At the lower resolutions and frequencies, we estimate, based on the structures seen in Fig. 1, that the jets and disk contribute as much as 20% to the total flux density in the lower frequency points in Figure 4a. However, the uncertainty in this estimate is substantial, and we make no correction for this contamination at lower frequency to the data points in Figure 4a. Figures 4b and c show spectra in the torus, at positions 100 mas north and south of the core, along the disk major axis, at 67 mas resolution.
We plot two power-law model spectra in Figs. 4b and 4c, with indices of -0.1 and -0.5, respectively. The former is appropriate for optically thin free-free emission. The latter would be the spectrum of Thomson scattered radiation from the radio nucleus (ie. same spectrum as the nucleus, see below). The free-free model fits the data reasonably, with a cumulative probability based on the reduced in both cases . The Thomson scattering model is clearly much too steep relative to the data, with a formal probability . We note that synchrotron radiation from spatially diffuse emission typically has an even steeper spectrum (index ). Likewise, thermal emission from warm dust would have a sharply rising (Rayleigh-Jeans) spectrum at these frequencies.
The surface brightnesses in the 34 GHz image at the two torus positions shown in the spectra are 0.447 mJy beam-1 and 0.496 mJy beam-1. We adopt the mean value of 0.47 mJy beam-1 in the following analysis. The implied brightness temperature in the torus at 100 mas from the core is K. If the emission were optically thin free-free emission, the Emission Measure is then: pc cm-6 pc cm-6, where is the electron temperature in K (assumed to be K, see below), and is the observing frequency, in GHz (Condon & Ransom, 2018). As a point of comparison, observations of free-free absorption toward the counter-jet in the low luminosity radio AGN in the nearby galaxy, NGC 1275, determined an emission measure of pc cm-6 on scales of a few parsecs, which they attribute to the AGN accretion disk or torus (Walker et al., 2000).
The spectrum of the radio core shows a sharp turn-over at frequencies below 10 GHz. The model in Figure 4a is a power-law spectrum, with the power-law index of -0.5 set by fitting to the 34 GHz and 44 GHz data, plus free-free absorption at lower frequency using an opacity set by the emission measure value measured in the torus above: (Condon & Ransom, 2018), with in GHz. Curiously, the location in frequency of the predicted spectral turnover based on the EM of the torus, GHz, is close to the observed spectral turnover. However, we cannot conclude that free-free absorption is the dominant cause for the turnover, for the following reason.
VLBI imaging of the core-jet of Cygnus A at 22 GHz and 43 GHz down to resolutions of 0.1 mas show 90% of the flux density at 43 GHz in the VLA spectrum comes from jet and counterjet structures within 3 mas radius of the nominal radio core. These structures show a variety of spectral indices between 20 GHz and 43 GHz, ranging from -1 to +1. The ‘radio core’ is identified as the most inverted (sharply rising) spectral component, likely due to synchrotron self-absorption (Krichbaum et al., 1998).
We calculate the expected turnover frequency due to synchrotron self-absorption of the jet components in Cygnus A. We adopt the outermost jet knot, J7, in the 43 GHz VLBI image, about 2 mas from the radio core. This component has a flux density of 42 mJy and a size of 0.36 mas, derived from Gaussian-fitting (Boccardi et al., 2016). The implied equipartition magnetic field is 0.1 G (Miley, 1980). The implied frequency for the turnover (peak frequency), for synchrotron self-absorption is given by: GHz = 6 GHz (Pacholczyk, 1970), where B is in Gauss, is the surface brightness in Jy arcsec-2 at observing frequency , in GHz, and is the spectral index444 This equation is good to 15% for in the range -0.5 to -0.8 (Pacholczyk, 1970). VLBI knots closer to the core will have even higher turnover frequencies.
Hence, even for the outer knots on these VLBI scales, the expected turnover frequency due to synchrotron-self absorption is GHz. The implication is that the spectral turnover is as plausibly due to synchrotron self-absorption, as due to free-free absorption, or possibly a combination of these phenomena.
4.2. Polarization
We imaged the linear polarized emission from the nuclear regions, and find no polarized emission from the torus or the jets to limits of a few to 10%. Polazation could potentially be used as a diagnostic on the emission mechanism: Thermal free-free emission is expected to be unpolarized. Scattered radiation is naturally polarized, eg. the scattered optical broad lines in Cygnus A are 16% polarized (Ogle et al., 1997). Synchrotron radiation from the jet would also likely be significantly intrinsically polarized tens of percent (Zensus, 1997; Bridle & Perley, 1984).
However, Faraday Rotation complicates the analysis. For instance, taking a mean density of cm-3, a pathlength of pc, and assuming the magnetic fields in the nuclear regions of galaxies can be of order a milli-Gauss (McBride et al., 2014), implies a rotation measure of: rad m2, with in cm-3, in Gauss, and in pc. This rotation measure would cause 5000 radians of rotation of the intrinsic position angle for the polarized emission, even at 43 GHz (7mm). Hence, in practice, any minute gradient in this RM screen across the synthesized beam , or any mixing of such a screen in the emitting regions, would depolarize the emission, even at sub-cm wavelengths. Hence, the lack of polarization from the inner radio jet likely results from large values of Faraday Depolarization, as the light propagates through the dense nuclear regions of Cygnus A.
4.3. Torus Model
Overall, while we cannot prove that the emission from this torus in thermal free-free emission, the flat spectra of the torus regions are consistent with such a model, and inconsistent with either Thomson scattering, diffuse synchrotron emission, or thermal emission from warm dust. Similarly, free-free emission from these regions does not uniquely imply a torus (Gallimore et al., 2004). However, the observed spatial distribution implies a structure substantially elongated perpendicular to the radio jets, and symmetrically distributed north and south of the core, and in the following discussion we adopt a toy model representation of a torus, for further investigation.
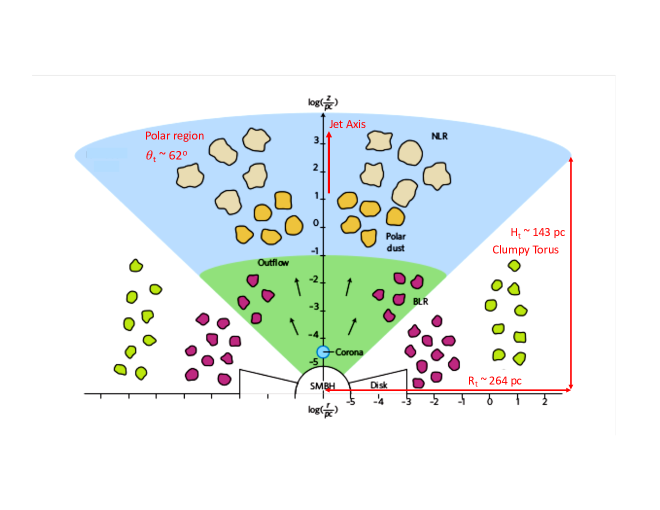
We assume that the dense material is in a cone-like region, with the polar regions of this torus oriented roughly in the sky plane. The radio jets propagate in the polar directions. We note that the latest VLBI analysis of the radio jets on pc-scales suggests a jet inclination angle with respect to the sky plane of (Boccardi et al., 2016). The torus, in this model, is a mixture of dense, self-shielded dust clouds, enveloped in atomic and ionized gas (Nenkova et al., 2008; Netzer, 2015). A schematic of the model is shown in Figure 5.
The maximum observed radius of the torus is about pc, while the height above the midplane is pc. Note that the ratio of length to width is not a measure of inclination angle. That would be true only for a thin disk. For a thick torus, regardless of the mean inclination angle, the AGN must be obscured along our line of sight, and therefore some part of the torus must cover our line of sight to the core. Assuming an approximate conical structure, the observed ratio of radius over the height is roughly the tangent of the half-opening angle of the poloidal regions of the torus, implies a half-opening angle of .
The mean density can be derived from the emission measure, given a pathlength through the torus. In this model, the diameter of the torus is: pc, but we measured the EM at 100 mas from the core along the major axis, which reduces the pathlength to: pc. Using pc cm-6, then implies a mean density of: cm-3.
However, if the torus was filled with a diffuse gas of this mean density, the following issue arises. The column density through the torus to the core is then: cm-2. The Thomson scattering optical depth is: , where is the electron Thomson scattering cross section. Removing the poloidal areas (which cover roughly half the sky seen from the core), means that of the light from the radio core will be Thomson scattered isotropically, i.e., that the torus would have an integrated radio flux of Jy = 170 mJy at 34 GHz. The integrated flux density for the entire torus region seen in Figure 1 is only 21 mJy at 34 GHz after core subtraction, or about 8 times less.
The challenge is that, while the spectra of the torus argue for free-free emission, the process cannot be simply due to a diffuse ionized medium with the mean density as calculated above, or else the emission would be dominated by Thomson scattering, and have a different spectrum. One solution to this apparent paradox is to assume that the ionized gas in the torus is clumpy. The free-free line emission behaves as , while Thomson scattering is linear in . The free-free emission will therefore be strongly weighted toward the densest regions. For instance, a density 8 times higher than the mean in the line emitting clumps would require a total pathlength 64 times less to produce the emission measure, and would decrease the overall optical depth to Thomson scattering by a factor 8.
As discussed in the introduction, models for dusty tori invoke clumpiness in the dust distribution to explain the relative mid-IR and X-ray properties (Nenkova et al., 2008; Ramos-Almeida & Ricci, 2017). It seems natural to extend the clumpy structure into the neutral and ionized gas distributions as well. In this case, the free-free emission is predominantly from regions with densities cm-3.
For comparison, based on their HI 21cm absorption measurements toward the radio jet in Cygnus A, Struve & Conway (2010) quote a density on similar scales of cm-3, comparable to our value. They also quote a scale height of the torus of 20 pc at a radius of 80 pc. In our simple linear flared torus model, the scale height at 80 pc radius is a factor two larger.
Taylor et al. (2003) performed slit spectroscopy with a spatial resolution of of the narrow line emission regions of Cygnus A. While the resolution is clearly not adequate to separate structures on the scales studied herein, the average results on optical line ratios are still useful as rough estimates of the temperatures in the narrow line emitting gas in the nuclear regions. The temperatures they derive range from 8200 K to 15000 K. For a temperature of K, the implied lower limit to the pressure in the free-free emitting clumps is dynes cm-2.
For comparison, we consider the minimum pressure in the relativistic particles and magnetic fields in the inner radio jet. The surface brightness of the jet as it emerges from the torus region in Figure 1, at roughly 100 mas from the core, is 1.2 mJy beam-1 at 34.5 GHz. Assuming the jet is marginally resolved at 45 mas, the implied minimum non-thermal pressure is dynes cm-2 (Miley, 1980). Hence, the lower limit to the pressure in the dense ionized gas is within a factor three of the minimum pressure in the relativistic jets.
5. Discussion
We present the discovery of an elongated, flat spectrum, radio continuum structure in the nuclear regions of Cygnus A, which we designate the ‘torus’. This structure is centered on the radio core, with a length of (528 pc), oriented perpendicular to the jet, and a full width of (286 pc). The radio spectra of this region are consistent with flat spectrum thermal free-free emission, and inconsistent with Thomson scattering of radio emission from the radio core, diffuse synchrotron emission, and thermal emission from warm dust. We consider these results in the context of models for clumpy, multi-phase obscuring tori in AGN.
Our toy model for the thick torus leads to a half-opening angle for the poloidal region of . For comparison, in the clumpy torus models of Nenkova et al. (2008), they calculate that the observed demographics of Type 2 versus Type 1 AGN, in which the fraction of Type 2 to Type 1 AGN lies between 50% and 70% (see for example Wilkes et al. (2013); Hickox & Alexander (2018)), can be explained by tori with half-opening angles between and , depending on the nature of the torus (sharp-edged or Gaussian-edged). They do caution that their models pertain to lower luminosity AGN, with lower mass black holes, as seen in eg. Seyfert galaxies.
For the torus size, models for dusty tori in AGN typically adopt an inner radius set by the sublimation of graphite dust by radiation from the AGN. This radius is small, of order a parsec, even for an AGN with erg s-1 (Kishimoto et al., 2013; Burtscher et al., 2013; Ramos-Almeida & Ricci, 2017; Netzer, 2015). Such a small scale for the inner torus radius is supported by near-IR interferometric observations, as the near-IR probes the hottest dust, near the sublimation radius (Burtscher et al., 2013; Netzer, 2015).
Physical predictions for the outer radius of the torus are more qualitative, and indeed, the exact location may be ill-defined, as the torus structures merge with the larger scale structures of the host galaxy. As an approximate guide for the outer torus radius, Hickox & Alexander (2018) suggest that: ’a natural scale for the outer edge of the torus is the gravitational sphere of influence of the SMBH’ (see also Netzer (2015)). Tadhunter et al. (2003) make a rough estimate of the stellar mass density in the inner 100 pc of Cygnus A of 10 M⊙ pc-3. At this mass density, the mass in stars will exceed that of the SMBH at a radius of 390 pc. A similar calculation can be done using equation (3) in Netzer (2015), and using the stellar velocity dispersion of the Cygnus A galaxy of 290 km s-1 (Tadhunter et al., 1999). This calculation leads to a black hole sphere of influence radius of 130 pc. While these are clearly very rough estimates, it appears the maximum radius of the torus as seen in the radio image (264 pc), is in the range expected for the radius at which the gravitational dynamics transitions from being dominated by the SMBH to dominance by the overall mass distribution in the host galaxy.
The torus size suggested herein is larger than those seen in lower luminosity AGN presented in recent studies (see Ramos-Almeida & Ricci (2017) for a review, and references in Sec. 1). In terms of ionization, the AGN in Cygnus A is certainly luminous enough to maintain ionization to this radius. For example, Netzer (2015) equation (6) implies a radius of 460 pc for the narrow line region in an AGN with a bolometric luminosity of L⊙. However, such a model also requires that ionizing AGN photons can leak through the torus out to these radii. Again, such leakage is a natural consequence of a clumpy torus. As emphasized by Nenkova et al. (2008): ’The (clumpy) models can produce nearly isotropic IR emission together with highly anisotropic obscuration, as required by observations. Clumpiness implies that the viewing angle determines an AGN classification only probabilistically: a source can display Type 1 properties even from directions close to the equatorial plane.’ Of course, we cannot rule-out contributions to the ionization by star formation in the inner few hundred parsecs of Cygnus A (Privon et al., 2012; Hoffer et al., 2012), nor a contribution to the dust-obscuration by dust on larger-scales in the host galaxy of Cygnus A (Merlo et al., 2014).
The fact that Cygnus A is so anomalously close, given its AGN luminosity, has clearly enabled the observation of the possible toroidal structure on scales of tens to a few hundred parsecs. For comparison, observations of the next closest radio galaxy of similar radio luminosity, 3C 295 at , would require five times the angular resolution and five times the sensitivity to perform measurements at similar physical resolution and brightness sensitivity as we have obtained on Cygnus A. The situation gets dramatically worse with increasing redshift due to cosmological surface brightness dimming. The almost edge-on orientation of the torus in Cygnus A (as implied by the jet orientation angle; (Boccardi et al., 2016)), also facilites these findings. Previous observations of Cygnus A lacked the combination of spatial resolution, frequency coverage, and sensitivity to image such a structure (Carilli et al., 1991, 1999). Only with the new systems of the Jansky Very Large Array, in particular, the complete frequency coverage up to 50 GHz and the order of magnitude improvement in continuum sensitivity, have these observations become possible (Perley et al., 2011).
It is the fortuitous combination of proximity, luminosity, and orientation that make Cygnus A such a prime target for future studies of the possible torus. Higher resolution, higher sensitivity observations are required to determine with greater accuracy the morphology and spectrum of this new structure perpendicular to the jets in the nucleus of Cygnus A. The current observations argue for thermal emission from a region that would be consistent with a multi-phase, clumpy torus, comprised of dense clouds of obscuring dust immersed in more diffuse, but also clumpy, atomic and ionized gas.
References
- Aalto (2017) Aalto, S., Muller, S., Costagliola, F., Sakamoto, K., Gallagher, J. S., Falstad, N. et al. 2017, å, 608, 22
- Antonucci (1984) Antonucci, R. 1984, ApJ, 278, 499
- Bridle & Perley (1984) Bridle, A. & Perley, R.A. 1984, ARA&A, 22, 319
- Barvainis (1987) Barvainis, R. 1987, ApJ, 320, 537
- Antonucci et al. (1994) Antonnuci, R., Hurt, T., Kinney, A. 1994, Nature, 371, 313
- Boccardi et al. (2016) Boccardi, B., Krichbaum, T., Bach, U., Bremer, M., Zensus, J.A. 2016, ApJ, 588, 9
- Burtscher et al. (2013) Burtscher, L., Meisenheimer, K., Tristram, K., Jaffe, W., Hönig, S. et al. 2013, å558, 149
- Carilli et al. (1999) Carilli, C., Kurk, J.D., van der Werf, P., Perley, R.A., Miley, G. 199y, AJ, 118, 2581
- Carilli et al. (1991) Carilli, C.L., Perley, R. Dreher, J., Leahy, J.P. 1991, ApJ, 383, 554
- Carilli & Barthel (1996) Carilli, C., Barthel, P. 1996, Astron. Astrophys. Rev, 7, 1
- Carilli et al. (1994) Carilli, C., Bartel, N., Diamond, P. 1994, AJ, 108, 64
- Combes (2018) Combes, F., Garcia-Burilli, S., Audibert, A., Hunt, L. et al. 2018, å, in press, arXiv:1811.00984
- Condon & Ransom (2018) Condon, J., Ransom, S. Essential Radio Astronomy, Princeton University Press (2018)
- Garcia-Burillo et al. (2016) García-Burillo, S., Combes, F., Ramos-Almeida, C., Usero, A., Krips, M., Alonso-Herrero, A. et al. 2016, ApJ, 823, L12
- Hickox & Alexander (2018) Hickox, R.C., Alexander, D.M. Obscured Active Galactic Nuclei 2018, ARA&A, 56, 625
- Gallimore et al. (2016) Gallimore, J., Elitzur, M., Maiolino, R., Alessandro, M., O’Dea C.P. et al. 2016 ApJ, 829, L7
- Gallimore et al. (2004) Gallimore, J., Baum, S.A., O’Dea, C.P. 2004, ApJ, 613, 794
- Gallimore et al. (1997) Gallimore, J., Baum, S.A., O’Dea, C.P. 1997, Nature, 388, 852
- Gravity Collaboration (2018) Gravity Collaboration 2018, Nature, 563, 657
- Imanishi & Ueno (2000) Imanishi, M., Ueno, S. 2000, ApJ525, 626
- Imanishi et al. (2018) Imanishi, Masatoshi, Nakanishi, Kouichiro, Izumi, Takuma, Wada, Keiichi 2018, ApJ, 853, 25
- Jaffe et al. (1996) Jaffe, W., Ford, H., Ferrarese, L., van den Bosch, F., O’Connell, R. 1996, ApJ, 460, 214
- Jaffe et al. (2004) Jaffe, W., Meisenheimer, K., Röttgering, H. J. A., Leinert, Ch., Richichi, A. et al. 2004, Nature, 429, 47
- Izumi et al. (2018) Izumi, T., Wada, K., Fukushige, R., Hamamura, S., Kohno, K. ApJarXiv:1809.09154
- Krichbaum et al. (1998) Krichbaum, T., Alef, W., Witzel, A., Zensus, J.A., Booth, R., Greve, A. Rogers, A. 1998, å, 329, 873
- Kishimoto et al. (2013) Kishimoto, M., Hönig, S., Antonucci, R., Millan-Gabet, R. Barvainis, R. 2013, ApJ, 775, L36
- Kishimoto et al. (2011) Kishimoto, M., Hönig, S., Antonucci, R. et al. 2011, å, 536, 78
- Lopez-Rodriguez et al. (2018) Lopez-Rodriguez, E., Alonso-Herrero, A., Diaz-Santos, T., Gonzalez-Martin, D. et al. 2018, MNRAS, 478, 2350
- Lopez-Rodriguez et al. (2014) Lopez-Rodriguez, E., Packham, C., Tadhunter, C., Mason, R., Perlman, E. 2014, ApJ, 793, 81
- Krolik & Begelman (1988) Krolik, J. & Begelman, M. 1988, ApJ, 329, 702
- Hoffer et al. (2012) Hoffer, A. S., Donahue, M., Hicks, A., & Barthelemy, R. S. 2012, ApJS, 199, 23
- Krolik (2007) Krolik, J. 2007, ApJ, 661, 52
- McBride et al. (2014) McBride, J. Quataert, E., Heiles, C., Bauermeister, A. 2014, ApJ, 780, 182
- Merlo et al. (2014) Merlo, M., Perlman, E., Nikutta, R., Packham, C., Elitzur, M. et al. 2014, ApJ, 788, 6
- Miley (1980) Miley, G. 1980, ARA&A, 18, 165
- Nenkova et al. (2008) Nenkova, M., Sirocky, M., Nikutta, R., Ivezic, Z., Elitzur, M. 2008, ApJ, 685, 160
- Netzer (2015) Netzer, H. 2015, ARA&A, 53, 365
- Ogle et al. (1997) Ogle, P., Cohen, M., Miller, J.S., Tran, H., Fosbury, R., Goodrich, R. 1997, ApJ, 482, L37
- Pacholczyk (1970) Pacholczyk, A., 1970, ’Radio astrophysics. Nonthermal processes in galactic and extragalactic sources’, San Francisco: Freeman
- Padovani et al. (2017) Padovani, P., Alexander, D., Asser, R., De Marco, B., Giommi P. et al. 2017, A& A Reviews, 25, 2
- Perley et al. (2017) Perley, D., Perley, R., Carilli, C., Dhawan, V. 2017, ApJ, 841, L117
- Perley & Butler (2013a) Perley, R.A., Butler, B.J. 2013a, ApJS, 204, 19
- Perley & Butler (2013b) Perley, R.A., Butler, B.J. 2018b, ApJS, 206, 16
- Perley et al. (2011) Perley, R.A., Chandler, C.J., Butler, B.J., Wrobel, J.M. 2011, ApJ, 739, L1
- Privon et al. (2012) Privon, G., Baum, S., O’Dea, C., Gallimore, J., Noel-Storr, J. Axon, D., Robinson, A. 2012, ApJ, 747, 46
- Pushkarev et al. (2017) Pushkarev, A., Kovalev, Y., Lister, M., Savolainen T. 2017, MNRAS, 468, 4992
- Ramos-Almeida & Ricci (2017) Ramos-Almeida, C., Ricci, C. 2017, Nature Astronomy, 1, 679
- Reynolds et al. (2015) Reynolds, Christopher S., Lohfink, Anne M., Ogle, Patrick M., Harrison, Fiona A. et al. 2015, ApJ, 808, 154
- Runnoe et al. (2012) Runnoe, J.C., Brotherton, M., Shang, Z. 2012, MNRAS, 422, 478
- Sorathia et al. (1996) Sorathia, B., Bartel, N., Beitenholz, M., Carilli, C. 1996, in ’Cygnus A, in ‘Cygnus A – Study of a Radio Galaxy’, eds. C.L. Carilli and D.E. Harris, Cambridge University Press p. 86
- Stockton et al. (1994) Stockton, Alan, Ridgeway, S.E., Lilly, S. 1994, AJ108, 414
- Struve & Conway (2010) Struve, C., Conway, J.E. 2010, å513, 10
- Tacconi et al. (1994) Tacconi, L. J. Genzel, R. Blietz, M. Cameron, M. Harris, A. I. Madden, S. 1998, ApJ, 426, 77
- Tadhunter et al. (2003) Tadhunter, C., Marconi, A., Axon, D., Wills, K., Robinson, T., Jackson, N. 2003, MNRAS, 342, 861
- Taylor et al. (2003) Taylor, M., Tadhuner, C., Robinson, T.G. 2003, MNRAS342
- Tadhunter et al. (1999) Thornton, Robert J., Jr.; Stockton, Alan; Ridgway, Susan E. 1999, AJ, 118, 1461
- Tristram et al. (2009) Tristram, K., Raban, D., Meisenheimer, K., Jaffe, W. Röttgering, H. et al. 2009, å, 502, 67
- Ueno et al. (1994) Ueno, S., Koyama, K., Minoru, N., Yamauchi, S., War, M.J. 1994, ApJ, 431, L1
- Urry & Padovani (1995) Urry, C.M. & Padovani, P. 1995, PASP, 107, 803
- Vestergaard & Bartel (1993) Vestergaard, M., Barthel, P.D. The nucleus of the Cygnus A galaxy 1993, AJ, 105
- Walker et al. (2000) Walker, R.C., Dhawan, V., Romney, J., Kellermann, K., Vermeulen, R. 2000, ApJ, 530, 233
- Whysong & Antonucci (2004) Whysong, D., Antonucci, R. 2004, ApJ, 602, 116
- Wilkes et al. (2013) Wilkes, Belinda J., Kuraszkiewicz, Joanna, Haas, Martin, Barthel, Peter, Leipski, Christian et al. 2013, ApJ, 773, 15
- Zensus (1997) Zensus, J.A. 1997, ARA&A, 35, 607
Appendix A Point Source Subtraction
Imaging with these data clearly show the outer regions of the torus, but details within mas of the core are complicated by the restored ‘clean beam’ response of the bright nuclear radio source. To address this issue, a point source model was subtracted from the visibilities, varying the strength to minimize residual artefacts. The nominal ’best fit’ subtraction was adjusted to get the flattest brightness emission profile through the torus along the line perpendicular to the jets. We then added and subtracted values ranging from mJy of this nominal value, in increments of 1 mJy, and investigated the residuals.
Figure A1 shows the resulting images at 31.5 GHz for different levels of core subtraction. Besides the rising and falling point source at the core position by the roughly 1 mJy value expected from the changing model, we determine the surface brightnesses at 40 mas and 70 mas distance from the core along the torus axis at 32 GHz. At 40 mas distance, the surface brightnesses do change, from 1.6 mJy beam-1 to 2.6 mJy beam-1 as the subtracted point source flux density is changed from +4 mJy to -4 mJy around the adopted ’best’ value. However, at 70mas distance, the value remains constant at 1.4 mJy beam-1, to within 3%. Hence, we limit our analysis to greater than 70 mas from the core.
Note that the data were taken on two dates separated by 1.5 years, between which the nuclear core increased by 130 mJy. Hence, the core subtraction process was done separately for each date, and the resulting databases combined.
The typical brightness of the torus is less than 0.1% of that of the nuclear emission at this resolution, a critical question is whether the torus emission is real, and is not some manifestation of the calibration process. While arguments based on the similarity of the structure over a wide frequency range (18 through 48 GHz) are reassuring, a better argument comes from utilizing the same calibration and imaging, and source subtraction, methods on a different source of similar strength. The nearby phase calibrator, J2007+4029, has nearly the same flux density and spectrum as that of the Cygnus A nucleus, and was observed on the same days, at the same frequencies and over the same hour angle range as Cygnus A. Thus, we analyzed the calibrator data in exactly the same manner (Fig. A2). We find that no extended ‘halo’ emission exists on the angular scale of that found in Cygnus A, to a brightness level less than 1/10 that of Cygnus A. J2007+4029 does have a one-sided weak jet, extending about to the south-west of the nuclear emission. Further evidence of the reality of the residual emission is the presence of the two components, located 25 mas from the nucleus along the outer jet axes, as well as the extension seen on mas-scales by in VLBI imaging (Pushkarev et al., 2017).