Modular structure in C. elegans neural network and its response to external localized stimuli
Abstract
Synchronization plays a key role in information processing in neuronal networks. Response of specific groups of neurons are triggered by external stimuli, such as visual, tactile or olfactory inputs. Neurons, however, can be divided into several categories, such as by physical location, functional role or topological clustering properties. Here we study the response of the electric junction C. elegans network to external stimuli using the partially forced Kuramoto model and applying the force to specific groups of neurons. Stimuli were applied to topological modules, obtained by the ModuLand procedure, to a ganglion, specified by its anatomical localization, and to the functional group composed of all sensory neurons. We found that topological modules do not contain purely anatomical groups or functional classes, corroborating previous results, and that stimulating different classes of neurons lead to very different responses, measured in terms of synchronization and phase velocity correlations. In all cases, however, the modular structure hindered full synchronization, protecting the system from seizures. More importantly, the responses to stimuli applied to topological and functional modules showed pronounced patterns of correlation or anti-correlation with other modules that were not observed when the stimulus was applied to ganglia.
pacs:
05.45.Xt,89.75.-kI Introduction
Understanding the network of neuronal connections in the brain is key to unravel the way it works and processes information. The complexity of these networks has been emphasized by many authors Sporns2013 , and characterized with different measures, such as degree distribution, transitivity and betweenness centrality Rubinov2010 . An important feature of neural networks is their high degree of heterogeneity, in the sense that the number of connections per neuron varies considerably and typically displays some sort of power law distribution. Moreover, neurons tend to form communities, where the density of connections is higher within than among communities. Because connections are constrained by anatomical features, neurons are also organized into physically arranged clusters, such as lobes or ganglia, where neurons with different functional roles coexist sporns-betzel2016 ; bacik2016 ; antono2015 .
Communities are often related to specialized areas of the brain and their number and structure are an indication of how many different tasks it can perform kim2014 . The integration of communities, on the other hand, measures how well the outcomes of these different processes can combined to build a global view of the inputs sporns-betzel2016 . When triggered by external stimuli, such as visual or olfactory inputs, the information processing occurs by the synchronized firing of neurons responsible to process those specific tasks Schmidt2015 ; gray1994 . Synchronization of larger sets of neurons, or even global synchronization, indicates cerebral disorders Uhlhaas2006 such as epilepsy global2012 and Alzheimer’s disease global2016 , causing a general breakdown in the neuronal network. Lack of synchronization, on the other hand, suggests difficulty to respond to the stimulus or to function properly, as reported in unsuccessful overnight memory consolidation in old people helfrich2018 , deficiency in the auditory-motor connections sowinskia2013 or brain disorders in autistic individuals autism2013 ; autism2011 . In this context, the knowledge of the organization of different types of neurons in the network and their segregation into modules or communities is fundamental to understand how stimuli affect the target module and under what conditions it propagates to other regions leading to global or poor responses.
In this work we probe the community structure of the neural electrical junction network of the C. elegans using the partially forced Kuramoto model of synchronization us . We aim to understand how the network responds to external localized stimuli and which modules are more affected when a specific group of neurons, that can be a functional group or a physically arranged module, is stimulated. We use two different metrics to characterize the overall behavior of the network under a localized stimulus: the synchronization of neurons within and between modules, as measured by the usual Kuramoto order parameter, and the phase-velocity inter-neuron correlation. We want to investigate the behavior of the system as a function of parameters such as stimulus intensity and inter-neuron connection strength. In particular we are interested in cases leading to global induced synchronization and highly correlated behavior, where the network responds as a whole, or to uncorrelated states, where neurons do not react to each other. Our simulations are guided by the results of a previous paper us where we studied the partially forced Kuramoto model on synthetic networks, using the external force to simulate a localized stimulus.
C. elegans is a nematode animal, unsegmented and with bilateral symmetry, exhibiting physiological similarity to mammals as regards the nerves and neurotransmiters morphologies and it is considered a model organism in studies of disorders related to human nervous system, such as epilepsy epi1 ; epi2 and Parkinson’s disease parkinson1 ; parkinson2 . It was the first multicelular animal to be its whole nervous system mapped, containing only 302 neurons. Its neural network has a huge data with open source, such as the WormAtlas wormatlas and the OpenWorm openworm . Because it is a real complex network, we choose this small neural network, extracting all necessary data from WormAtlas.
The 248 neurons of the electrical junction network are anatomically classified as belonging to head, body or tail, and neuron types are divided into motoneurons, interneurons and sensory neurons. We have also performed a classification into 10 ganglia (A: anterior ganglion, B: dorsal ganglion, C: lateral ganglion, D: ventral ganglion, E: retrovesicular ganglion, F: posterolateral ganglion, G: ventral cord neuron group, H: pre-anal ganglion, J: dorsorectal ganglion, K: lumbar ganglion wormatlas ) which is a finner division of the anatomical one.
The network is first decomposed into three modules based on topological properties and numbered by 1, 2 and 3 from largest to smallest. This modularization procedure was made on software Cytoscape using the app ModuLand moduland . Each module contains neurons from the three anatomical parts, and consequently the 10 ganglia, and of the three types. We applied the stimulus to the largest module, then on the ganglion C and finally to the sensory neurons and then we observe the response of other neurons. We show that no single partition of the brain into communities can account for its behavior under stimuli. All partitions analyzed here, topological, anatomical and functional, play a role in the response to external localized stimuli, revealing the complexity of the brain’s wiring and function.
This paper is organized as follows: in section II we describe the materials and methods, showing the partially forced Kuramoto model, the C. elegans neural connectome and the order parameters used to measure the state of the network. The results of numerical calculations and its analysis are in section III. Finally, we summarize our discussion in section IV.
II Materials and Methods
II.1 Partially forced Kuramoto model
The Kuramoto model of coupled oscillators Kuramoto1975 is a paradigm in the study of synchronization and has been explored in connection with biological systems, neural networks and the social sciences Rodrigues2016 ; Acebron2005 . Here we consider a modified version of the original Kuramoto model where each oscillator interacts only with a subset of the other oscillators, as specified by a network of connections Arenas2008 . Moreover, part of the oscillators also interacts with an external periodic force Sakaguchi1988 ; Ott2008 ; Childs2008 ; us . The force can be interpreted as an external stimulus and the set of oscillators coupled to it represents the ’interface’ of the system, like the photo-receptor cells in the eye gray1994 . The oscillators are described by their phase and system is governed by the equations us
| (1) |
where is the number of oscillators, is the internal coupling strength, is the adjacency matrix of internal connections; is the degree of node ; and are respectively the amplitude and frequency of the external force; and is the subgroup of oscillators subjected to the external force. We have also defined if and zero otherwise and we shall call the number of oscillators in the set . The natural frequencies are taken from a distribution , which is here chosen to be Gaussian with zero average.
Following Childs2008 we define
| (2) |
In these new variables the explicit time dependence disappears and the equations become
| (3) |
where .
The adjacency matrix gives the strength of interaction between oscillators and . For unweighted networks assumed the value 1 if they interact and 0 otherwise, but weighted networks like that of the C. elegans, might have very inhomogeneous distributions of weights. For networks that can be divided into anatomical or functional communities, the external force can be applied to one of the communities as a way to probe its influence on the others. Thus, we will investigate how the control parameters, and , affect the spontaneous and induced synchronization of the focal community (where the force is applied) and how it spreads to the other communities of the system.
If there is no external force and if the internal coupling constant is sufficiently large the oscillators synchronize spontaneously with frequency in the original coordinates or with frequency in the rotating frame . On the other hand, if both and are large the system synchronizes with the external frequency in the original frame or in the rotating frame. In our simulations, since the Gaussian distribution is symmetric, , so that spontaneous synchronization corresponds to global frequency and forced synchronization to frequency .
Following us we can estimate the minimum intensity of the external force, , required to induce global synchronization using the relation
| (4) |
where is the fraction of forced neurons; and are the average degree of the network and the forced module, respectively.
II.2 C. elegans neural connectome
Based on structural and functional properties of the neural network of C. elegans, Varshney et al chen2011 and Yan et al nature presented a division of neuronal classes, totalizing 118, in three categories: sensory neurons (SN), which respond to environmental variations, motoneurons (MN), recognized by the presence of neuromuscular junctions and responsible by locomotion, and the interneurons (IN), which cover all of other classes. The adjacency weighted matrix is defined as follows: the element represents the total number of synapses interchange between the pair of neurons . In chen2011 the authors also divide the set into the gap junction network, which refers to the electrical synapses, and the chemical synapses network.
Gap junctions are a medium for electrical coupling between neurons and, since the electric signal can be made in both directions, the electrical junction network is considered undirected and, consequently, its adjacency matrix symmetric. On the other hand, the chemical synapses network is a directed and weighted network, whose adjacency matrix is assymetric. Here we will concentrate on the electrical junction network only.
We analyzed the gap junctions neural network of nematode C. elegans extracting the data from WormAtlas wormatlas . The full connectome has 279 neurons (nodes) and 514 gap junctions (connections) divided into a giant component with 248 neurons plus 31 neurons not connected with it. Here we will study the dynamics on the giant component. Thereby, we built the weighted electrical junction (EJ) network of the C. elegans with 248 neurons and 511 gap junctions. We also used a hierarchical algorithm to detect communities on the EJ network. For that, we used the package ModuLand moduland available on the free software Cytoscape. The algorithm provided three modules (, , ) with modularity .
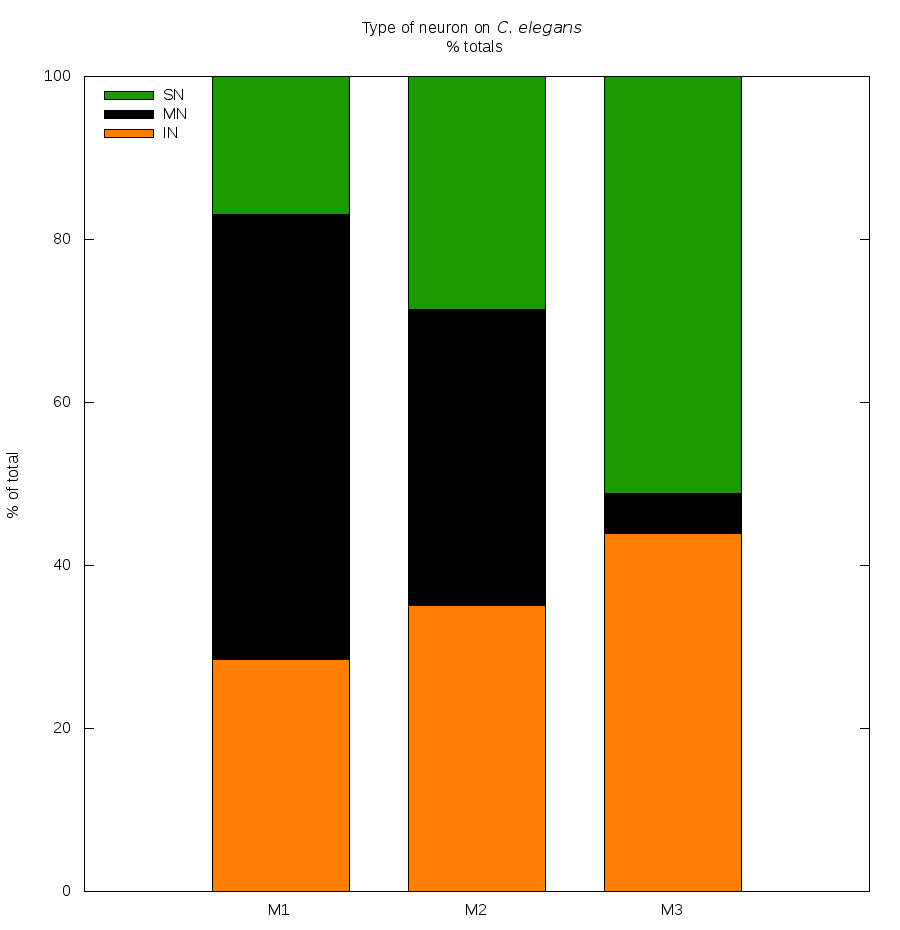
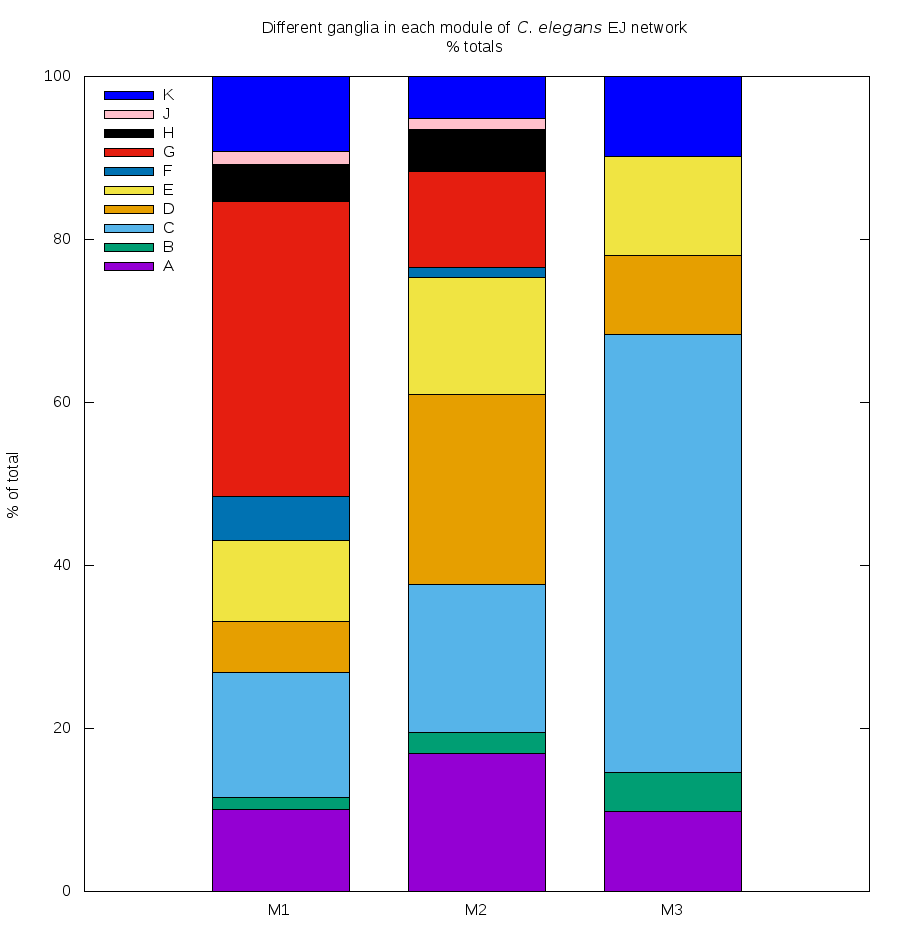
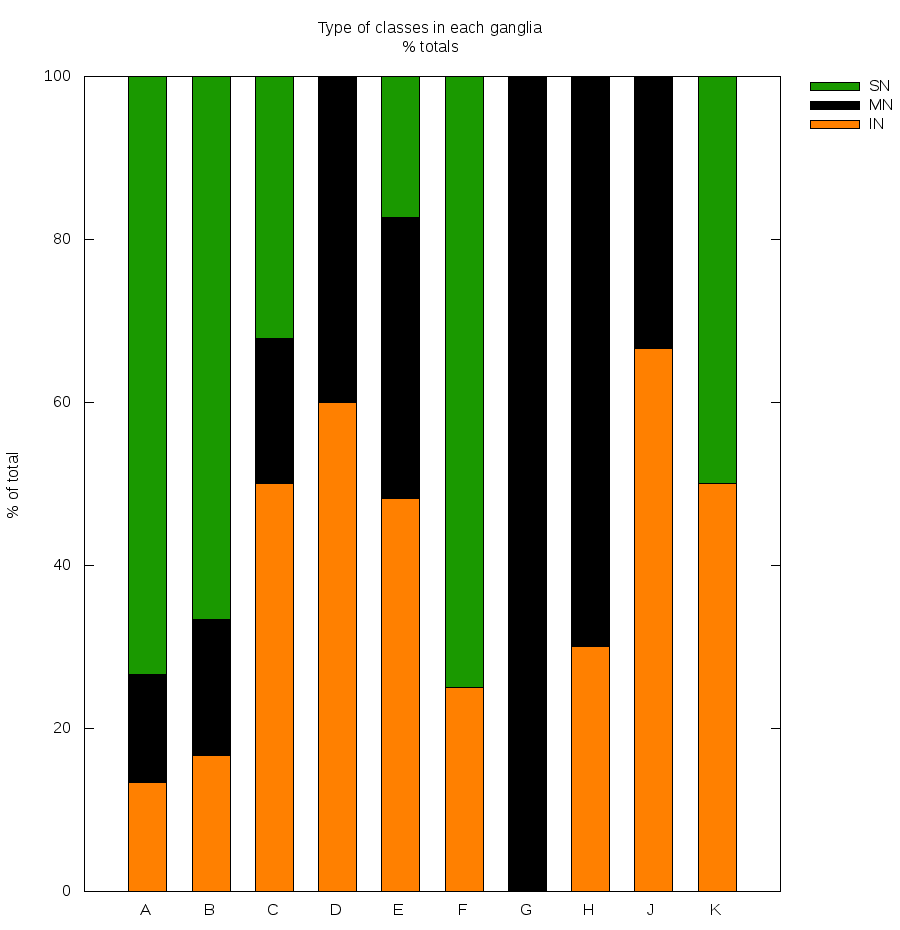
We classified each neuron as belonging to one of three categories (sensory, motor and interneurons) and based on ganglia (A: anterior ganglion, B: dorsal ganglion, C: lateral ganglion, D: ventral ganglion, E: retrovesicular ganglion, F: posterolateral ganglion, G: ventral cord neuron group, H: pre-anal ganglion, J: dorsorectal ganglion, K: lumbar ganglion wormatlas ). The compositions of neuronal categories and ganglionic classification in each module are shown in Figure 1 (left) and 1 (right), respectively. The ganglia are a finner division of the anatomical classification into head (H), body (B) and tail (T). The left histogram of figure 2 shows that the ganglia A, B, C and D belong to the head, G is entirely localized at the body, while J and K belong to the tail.

This set of divisions of the neural network into communities can be classified as (i) topological (, , ); (ii) anatomical (ganglia) and; (iii) functional (SN, MN, IN). They are clearly all different, showing that EJ network has a complex modular structure. Table 1 shows the relevant data to modular network used. We calculated the fraction and the average degree of each classification and of the whole network, , and the respective values of critical force as given by Eq.(4).
| Module 1 | Ganglia C | Sensory Neurons | Network | |
| Number of neurons | = 130 | = 56 | = 65 | = 248 |
| Fraction of nodes | = 52.42 % | = 22.58 % | =26.21 % | = 100 % |
| Average degree | = 7,96 | = 10,16 | = 5,27 | = 7,13 |
| Critical force (theoretical) | = 5,17 | = 9,32 | = 22,98 | = 3,00 |
II.3 Order parameters and correlations
The partially forced Kuramoto dynamics will be applied to the C. elegans as a way to probe its modular structure. Forcing a particular module may or may not induce synchronization with the external frequency on other modules of the system. In order to monitor the behavior of separate modules we define
| (5) |
where the subscript specifies the module of size . Therefore, is a local order parameter that measures how much the oscillators in the module are synchronized among themselves. The angular velocity provides information about the motion of the set: implies sync with the external force, refers to spontaneous sync whereas nonconstant values indicate more complex behavior.
Intermodule behavior will also be monitored by the quantities
| (6) |
with similar interpretations.
We also compute velocity-velocity correlations between all pairs of oscillators. We define
| (7) |
where
| (8) |
and is a sufficiently long time so that the transient dynamics has passed.
The normalized velocity-velocity correlation function is then defined as:
| (9) |
where . We note that the correlation is computed in terms of the fluctuations of the average velocity, that was subtracted out in Eq. (7). The 248 248 correlation matrix gives direct information about the effect of one neuron over another, irrespective of their synchronization state. If an increase in the velocity of leads to the average increase in the velocity of then nodes and are positively correlated and . If, on the other hand the velocity of decreases, they are negatively correlated and . Finally, if they are uncorrelated . In the simulations we used and which was enough for the equilibration of the system.
The parameters provide information about the synchronization of each module, whereas the average value of the phase velocity tells whether the module follows the external force or spontaneous collective motion. This information is complemented by the velocity-velocity correlation, which measures the effect of one node over the other even if they synchronize with different frequencies or are not synchronized at all.
III Results
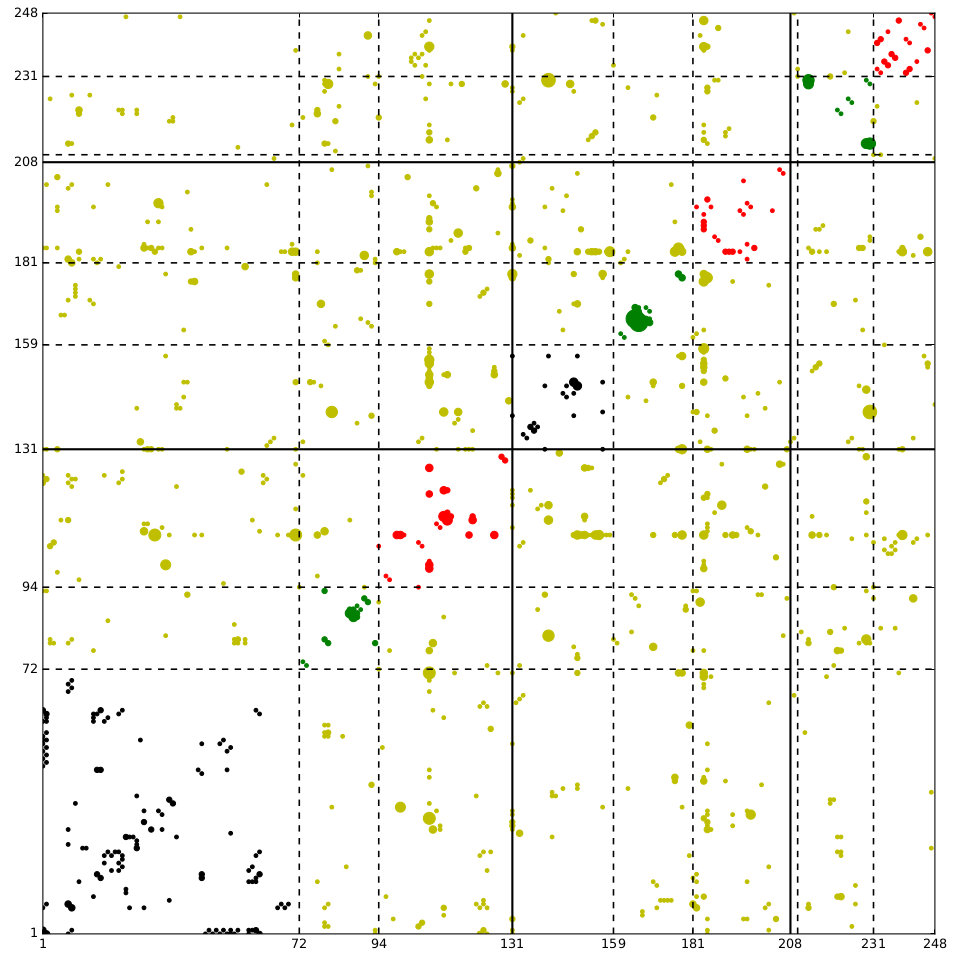
Figure 3 shows the weighted adjacency matrix ordered according to the topological modules , and (left panel). Modules are separated by thick black lines and subdivided into motoneurons (black), sensory neurons (green) and interneurons (red) by dashed black lines. The size of the dot is proportional to the intensity and intermodule connections are represented in yellow. The right panel shows the adjacency matrix ordered by ganglia, from head to tail. The thick black lines highlight 5 groups of ganglia: {A, B}; {C}; {D, E, F}; {G} and {H, J, K}. Subdivisions and intermodule connections follow the functional colors of left panel. The indexes in both panel delimit the divisions made.

In order to analyze the interdependencies of the modules for different partitions of the EJ network, we have simulated
the application of an external stimulus to one of the modules and observed its effect on the others. The stimulus is
modeled by an external periodic force acting only on the selected module under the Kuramoto dynamics as described in
section II.1. In all our simulations we have fixed . The effects on the other modules
is measured by local order parameters, such as , and the normalized velocity-velocity correlation function as
described in section II.3. The numerical results are shown in figures 4, 5 and 6 below and in figures 1, 2 and 3 of
SM. In what follows we show results when the stimulus is applied only to , or to ganglion C or to the sensory
neurons.
Stimulating the : the role of topology
Figure 4 shows the results of simulations for four values of the internal coupling when only the neurons of are forced (indexes 1 to 130 in the left panel of figure 3.) The local order parameters as a function of the intensity of the external force are exhibited in panels (a) to (d) and the velocity-velocity correlation matrices are in panels (e) to (t). The neurons of are spontaneously synchronized for with (see Fig. 1 on SM). As increases, the neurons go through a region of desynchronization around , which is close to theoretical value = 5.17 calculated from eq. (4), and then the neurons synchronize with the external force (, Fig. 1 on SM) for larger than about 10, where . For large internal coupling , all modules sync with external force (see panel (d) of Fig. 4 and panel (l) of Fig. 1 on SM), but has large fluctuations in (panel (p), Fig. 1 on SM). Besides, does not fully synchronize since the order parameter reaches its maximum value for .
The most striking feature of these simulations is the strong anti-correlation patterns developed between
and for . From the top panels we notice that, in these cases, is synced with the external
force and is synchronized spontaneously. Nevertheless the effects of over are very clearly shown by
the purple areas of the correlation plots.
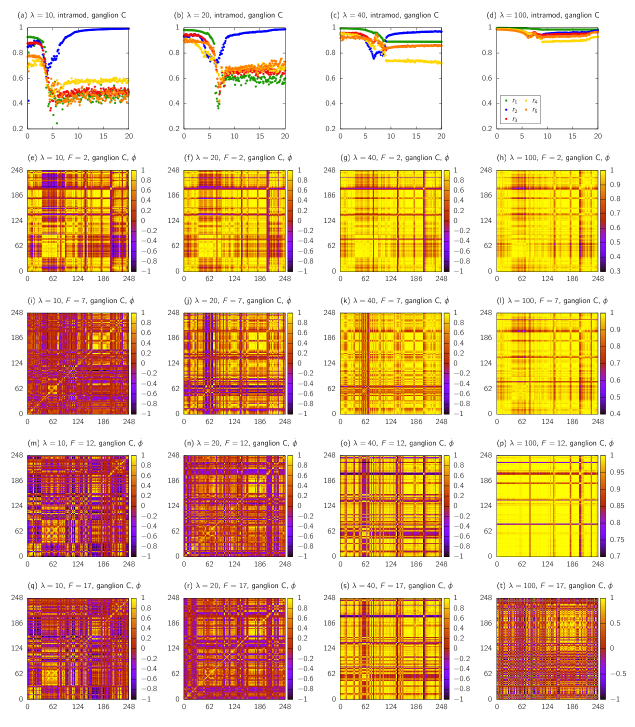
Stimulating ganglion C: the role of anatomy
Figures 5 shows the results of simulations when ganglion C is forced. The values of the internal coupling are the same used in Fig. 4. The local order parameters as a function of are in panel (a) to (d) of each figure. The behavior of the order parameters as a function of is similar to that observed when forcing the neurons of , exhibiting a region of desynchronization between and , which contains the theoretical value calculated by eq. (4), , followed by stabilization for larger . The forced neurons are clearly seen as a bright yellow block in panels (e) to (h).
For sufficiently large ganglion C synchronizes with the external force (, panels (a) to (d), and , Fig. 2 on SM) for all values of considered. However, the velocity-velocity correlation matrices show much simpler patterns: either nearly complete correlation occurs (yellow areas in panels (g), (h), (k), (l) and (p)), or almost no correlation is observed (large red areas in panels (i), (m), (n), (q) and (r)) where ganglion C itself shows reduced internal correlations. Even for , where indicates that C is nearly fully synchronized for all ’s, the correlation matrices show regions of mixed behavior, especially for small , which means that part of neurons of C are non-correlated with each other or even anti-correclated (see also Fig. 2, panels (a), (b), (i) and (j) on SM). Although all ganglia seem to synchronize with the external force for and , their dynamics are uncorrelated with other ganglia. The only exception is ganglia G, that shows up as a yellow square in the plots (see also Figs. 4 and 5 on SM).
We also note that for the motor part of ganglion C (small yellow squares indexed by 37 to 46) correlates separately from the rest of C for , panel (o), and , panel (s), which means that motoneurons respond differently to external stimuli. For fixed, the motoneurons of ganglion C first synchronize spontaneously ( panel (f) and Fig. 2, panels (b) and (f) on SM), then exhibit mixed behavior, with most pairs uncorrelated ( panel (j) and Fig. 2, panels (b) and (j) on SM). As the force intensity increases the group regains part of the synchrony (now with the external force) but never fully correlated (panels (k) and (l) and regions of in panels (b), (c) and (d)).
For , panels (q), (r), (s) and (t), the number of correlated neurons increases from to
but for the entire network goes out of phase, with the exception of ganglion G: it keeps its internal
correlation at all times, maybe because it is entirely a motor ganglion type. Note that is close to 1 only for
, panel (d), which means that full synchronization requires large internal coupling.
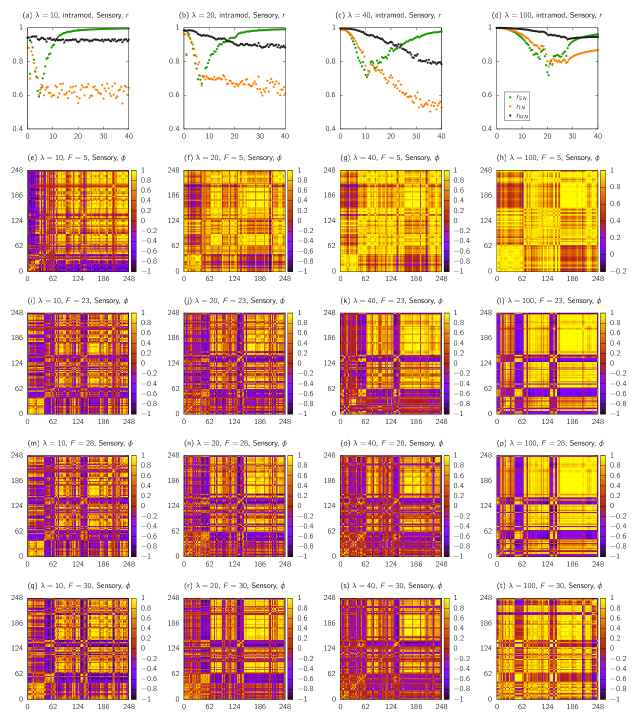
Stimulating the sensory neurons: the role of function
Figure 6 shows the numerical results when all sensory neurons receive the external stimuli. In this case, we divided the network in three groups based on functional classes - sensory neurons, interneurons and motoneurons. The values of internal coupling are the same used previously. From panels (a) to (d) it can be seen that the behavior of sensory neurons is complex, synchronizing with the external force for: and on panels (a) and (i) of Fig. 3 (see SM), and on panels (b) and (j) of Fig. 3 (see SM), and on panels (c) and (k) of Fig. 3 (see SM) and and on panels (d) and (l) of Fig. 3 (see SM). In and the values of are close to the theoretically calculated one, which is . Differently from all other cases, larger values of hinders the synchronization of the forced group, since decreases from to , although (Fig. 3, SM).
For , the motoneurons and almost half of interneurons were spontaneous sync (panels (a), (b), (i) and (j) on Fig. 3, SM), while for and most neurons were synchronized with external stimuli. Furthermore, the results of velocity-velocity matrices also show regions of anti-correlation and non-correlation, as can be seen on purple and red areas of Fig. 6, respectively, and they are more prominent for weak internal coupling, . In these cases, the lack of correlation seems to indicate a lower value of inter-modules order parameter , as can be seen in panels (e) to (h) of Fig. 3 on SM.

IV Discussion
Information processing in the brain requires the synchronous firing of specific groups of neurons as a response to external stimuli. Groups of neurons can be defined in many ways, taking into account their anatomical location, their functional role or their topological properties in the network. In this paper we have investigated the importance of these divisions as targets to stimuli, as well as their roles in spreading the inputs to other parts of the brain. We used a much simplified model of synchronization given by the Kuramoto system of phase oscillators subjected to localized external stimuli that was applied to a subset of neurons representing a topological module (Fig. 4), a ganglion composed of different functional neurons (Fig. 5) or all sensory neurons (Fig. 6). The response of the electrical neural network to the stimulus was different is each case, as we summarize below.
The modularization procedure applied to EJ network reveals that the modules do not contain purely anatomical groups or functional classes, but mixes neurons belonging to different ganglia and functional classes, such as sensory, motor and interneurons. This is illustrated in Fig. 1, where we have analyzed the distribution of neuronal class and ganglia membership in each module. This corroborates previous studies antono2015 ; pan2010 ; sohn ; chen2011 ; arenas2007 and shows the complexity of the neuronal wiring and function.
Stimulation of the neurons of the largest topological module induced strong anti-correlation in the velocity fluctuations of the neurons in and (purple areas of panels (i), (j) and (m) on Fig. 4 or between and (panel (k) on the same figure), which kept their original state of spontaneous synchronization for moderate values of the internal coupling constant . This anti-correlation also seems to suggest a lower value of the inter-modules order parameter , as can be seen between - and - (panel (k) on Fig. 4 and Fig. 1 on SM). On the other hand, the presence of positive correlations between and (panel (q) on Fig. 4), is accompanied by an increase of .
The smallest topological module remained oblivious to the stimulus even for large values of . Interestingly, for intermediate values of the forcing (panel (j) on Fig. 4), the neurons of became mostly uncorrelated (red areas on Fig. 4), indicating a parameter region of poor response to the stimulus. It is possible, however, to identify the modular structure by the presence of three blocks, each of one corresponding to , and .
Ganglia are structures formed by the grouping of cell bodies of neurons and are responsible for the control of specific regions. In C. elegans it was possible to classify 10 ganglia groups, since most of the cell bodies of neurons are clustered in these structures wormatlas . The response of the network to stimulation of ganglion C was quite different from the other two cases we considered, displaying essentially two distinct regions with (I) large parameter intervals of almost complete uncorrelated behavior, which occurs for (red areas on panels (i), (m), (n), (q), (r) and (t) on Fig. 5) and (II) complete correlated behavior, with (yellow areas on Fig. 5). Effective synchronization of ganglion C with the external force required large values of the coupling constant. Contrary to what occurs when forcing the topological module, the blocks of the correlation matrix corresponding to ganglia groups cannot be clearly distinguished, except for ganglion G (Figs. 4 and 5 on SM), which seems to hold high correlation between its neurons, possibly because it is the only group entirely composed by one class (motoneurons).
Sensory neurons are responsible for collecting information from external environment and react to stimuli inside the organism, acting as an input channel. In this sense, C. elegans uses these neuronal functions to explore the ambient, navigating over thermal, chemical and oxygen variations, in addition to avoid hostile behavior wormatlas . The response of these neurons to the stimulus leads to induced synchronization for , while the other two classes show spontaneous sync. It was only with strong internal coupling, , and force larger than the theoretical value, , that most of neurons were induced to the forced sync. The results also show many regions of anti and non-correlation (purple and red areas on Fig. 6, respectively) and blocks relative to the three classes are reasonably clear, although showing visible internal structure, which indicates a more complex relationship between them.
The values of the critical force estimated theoretically with Eq. (4) are close to numerical results found by stimulating the EJ network of nematode C. elegans in all cases studied. In particular, for and strong coupling the stimulated group syncs with in all cases. We also found that synchronization and positive correlation between modules seem to be related, since yellow areas on the correlation matrices occurs when .
Previous studies us showed that the Kuramoto model with external localized stimuli leads to global
synchronization on synthetic networks if and are sufficiently large. Here we considered a real neural
network and we did not observe full synchronization, which indicates that the particular modular structure of the
network protects the system from ‘seizures’. The group divisions considered here (topological, functional and
anatomical) are natural but not complete and finer subdivisions might be important understand the system response in more detail.
This shows the complex structure of the neural network.
Acknowledgments: M.A.M.A. acknowledges financial support from CNPq (grant 302049/2015-0) and FAPESP (grants 2016/06054-3 and 2015/11985-3). C.A.M. was supported by CNPq (grant 141021/2017-9).
References
- (1) M. P. van den Heuvel, O. Sporns, “Network hubs in the human brain,” in Trends in Cognitive Sciences, vol. 17, no. 12, pp. 683–696, 2013.
- (2) M. Rubinov, O. Sporns, “Complex network measures of brain connectivity: Uses and interpretations,” in NeuroImage, vol. 52, pp. 1059-1069, 2010.
- (3) O. Sporns and R. F. Betzel, “Modular Brain Networks”, Annu Rev Psychol., vol. 67, pp. 613–640, 2016.
- (4) K.A. Bacik, M.T. Schaub, M. Beguerisse-Diaz, Y.N. Billeh, M. Barahona, “Flow-Based Network Analysis of the Caenorhabditis elegans Connectome,” PLOS Computational Biology, DOI:10.1371/journal.pcbi.1005055, 2016.
- (5) C. G. Antonopoulos, A. S. Fokas and T. C. Bountis “Dynamical Complexity in the C. elegans Neural Network,” The European Physical Journal Special Topics, 2015.
- (6) Kim, J. S., Kaiser, M., “From Caenorhabditis elegans to the human connectome: a specific modular organization increases metabolic, functional and developmental efficiency,” Philos. Trans. R. Soc. Lond B Biol. Sci., vol. 369, 2014.
- (7) R. Schmidt, K. J. R. LaFleur, M. A. de Reus, L. H. van den Berg, and M. P. van den Heuvel, “Kuramoto model simulation of neural hubs and dynamic synchrony in the human cerebral connectome,” BMC neuroscience, vol. 16, no. 1, p. 54, 2015.
- (8) C. M. Gray, “Synchronous Oscillations in Neuronal Systems: Mechanisms and Functions,” Journal of Computational Neuroscience, vol. 1, pp. 11–38, 1994.
- (9) P. J. Uhlhaas and W. Singer, “Neural Synchrony in Brain Disorders: Relevance for Cognitive Dysfunctions and Pathophysiology,” Neuron, vol. 52, no. 1, pp. 155–168, 2006.
- (10) P. Jiruska, M. de Curtis, J. G. R. Jefferys, C. A. Schevon, S. J. Schiff, K. Schindler, “Synchronization and desynchronization in epilepsy: controversies and hypotheses”, J Physiol., vol. 591, pp. 787-797, 2012.
- (11) C. Babiloni, R. Lizio, N. Marzano, P. Capotosto, A. Soricelli, A. I. Triggiani, S. Cordone, L. Gesualdo, C. Del Percio, “Brain neural synchronization and functional coupling in Alzheimer’s disease as revealed by resting state EEG rhythms”, International Journal of Psychophysiology, vol. 103, pp. 88-102, 2016.
- (12) R. F. Helfrich, B. A. Mander, W. J. Jagust, R. T. Knight, M. P. Walker, “Old Brains Come Uncoupled in Sleep: Slow Wave-Spindle Synchrony, Brain Atrophy, and Forgetting,” Neuron, vol-97, no. 1, pp. 221-230, 2018.
- (13) J. Sowińskia, S. D. Bella, “Poor synchronization to the beat may result from deficient auditory-motor mapping,” Neuropsychologia, vol. 51, pp. 1952-1963 ,2013.
- (14) J. Salmi, U. Roine, E. Glerean, J. Lahnakoski, T. Nieminen-von Wendt, P. Tani, S. Leppämäki, L. Nummenmaa, I.P. Jääskeläinen, S.Carlson, P. Rintahaka, M. Sams, “The brains of high functioning autistic individuals do not synchronize with those of others,” NeuroImage: Clinical, vol. 3, pp. 489-497, 2013.
- (15) I. Dinstein, K. Pierce, L. Eyler, S. Solso, R. Malach, M. Behrmann, E. Courchesne, “Disrupted neural synchronization in toddlers with autism”, Neuron, vol. 70, pp. 1218-1225, 2011.
- (16) Moreira, C.A., Aguiar, M.A.M. de, “Global synchronization of partially forced Kuramoto oscillators on networks,” Physica A: Statistical Mechanics and its Applications, vol. 514, pp. 487-496, 2019.
- (17) Williams S.N., Locke C.J., Braden A.L., Caldwell K.A., Caldwell G.A., “Epileptic-like convulsions associated with LIS-1 in the cytoskeletal control of neurotransmitter signaling in Caenorhabditis elegans,” Hum Mol Genet, vol. 13, pp. 2043-2059, 2004.
- (18) Risley,M. G., Kelly, S. P., J. Kauliang, Grill, B. and Dawson-Scully K., “Modulating Behavior in C. elegans Using Electroshock and Antiepileptic Drugs,” PLOS One, vol. 11, pp. 1-13, 2016.
- (19) Martinez B.A., Caldwell K.A., Caldwell G.A., “C. elegans as a model system to accelerate discovery for Parkinson disease,” Curr Opin Genet Dev, vol. 44, pp. 102-109, 2017.
- (20) Coopera, J. F. and Van Raamsdonka, J. M., “Modeling Parkinson’s Disease in C. elegans”, J Parkinsons Dis, vol. 8, pp. 17-32, 2018.
- (21) WormAtlas, Altun, Z.F., Herndon, L.A., Wolkow, C.A., Crocker, C., Lints, R. and Hall, D.H. (ed.s) 2002-2018. Available at http://www.wormatlas.org/.
- (22) The Open Worm Project. Available at http://openworm.org/.
- (23) Szalay-Beko M., Palotai R., Szappanos B., Kovács I.A., Papp B., Csermely P., “ModuLand plug-in for Cytoscape: determination of hierarchical layers of overlapping network modules and community centrality.,” Bioinformatics, vol. 28, pp. 2202-4, 2012.
- (24) Y. Kuramoto, “Self-entrainment of a population of coupled non-linear oscillators,” in International Symposium on Mathematical Problems in Theoretical Physics, pp. 420–422, Berlin/Heidelberg: Springer-Verlag, 1975.
- (25) F. A. Rodrigues, T. K. D. M. Peron, P. Ji, and J. Kurths, “The Kuramoto model in complex networks,” Physics Reports, vol. 610, pp. 1–98, 2016.
- (26) J. A. Acebrón, L. L. Bonilla, C. J. Pérez, F. Ritort, and R. Spigler, “The Kuramoto model: A simple paradigm for synchronization phenomena,” Reviews of Modern Physics, vol. 77, pp. 137-185, 2005.
- (27) A. Arenas, A. Diaz-Guilera, J. Kurths, Y. Moreno, and C. Zhou, “Synchronization in complex networks,” Physics Reports, vol. 469, pp. 93–153, 2008.
- (28) H. Sakaguchi, “Cooperative phenomena in coupled oscillator systems under external fields,” Progress of Theoretical Physics, vol. 79, no. 1, pp. 39–46, 1988.
- (29) E. Ott and T. M. Antonsen, “Low dimensional behavior of large systems of globally coupled oscillators,” Chaos, vol. 18, no. 3, pp. 1–6, 2008.
- (30) L. M. Childs and S. H. Strogatz, “Stability diagram for the forced Kuramoto model,” Chaos, vol. 18, no. 4, pp. 1–9, 2008.
- (31) Varshney L.R., Chen B.L., Paniagua E., Hall D.H., Chklovskii D.B., “Structural Properties of the Caenorhabditis elegans Neuronal Network,” PLOS Computational Biology, vol. 7, 2011.
- (32) Yan G., Vértes, P.E., Towlson, E.K., Chew, Y.L., Walker, D.S., Schafer, W.R., Barabási, A-L., “Network control principles predict neuron function in the Caenorhabditis elegans connectome,” Nature, vol. 550, pp. 519-523, 2017.
- (33) Pan, R.K., Chatterjee, N., Sinha, S., “Mesoscopic Organization Reveals the Constraints Governing Caenorhabditis elegans Nervous System,” PLoS ONE, vol. 5, 2010.
- (34) Sohn, Y., Choi, M.K., Ahn, Y.Y., Lee, J., Jeong, J, “Topological Cluster Analysis Reveals the Systemic Organization of the Caenorhabditis elegans Connectome,” PLoS Computational Biology, vol. 7, 2011.
- (35) A. Arenas, A. Fernández, S. Gómez (2007). “A Complex Network Approach to the Determination of Functional Groups in the Neural System of C. elegans,” Lect. Notes Comput. Sci. 5151, pp. 9-18. 10.10079783540921912_2.