Unveiling the nature of compact object in the LMXB MAXI J1957+032 using Swift-XRT
Abstract
MAXI J1957+032 is a transient Low-mass X-ray binary (LMXB) that underwent four short outbursts in 1.5 years since its discovery in 2015. The nature of the compact object in MAXI J1957+032 is not clear, but it was proposed to be a neutron star based on the short-duration of its outbursts. Here, we report the results obtained after performing spectral analysis using data obtained with the X-ray telescope aboard the Neil Gehrels Swift satellite. When describing the spectrum with an absorbed power law, we found that the spectra softens (the power-law index increases from 1.8 to 2.5) as the luminosity decreases. Near the end of its outbursts the observed value of power-law index () is 2.5. To identify the nature of the compact object in this system, we used as a tracer of the spectral evolution with luminosity. We found that for the distance of 4 kpc, our results suggest that the source harbours a neutron star.
keywords:
X-ray: accretion, stars: neutron, X-rays: binaries, individual: MAXI J1957+0321 Introduction
Low mass X-ray binaries (LMXBs) contain a black hole (BH) or neutron star (NS) that accretes matter from a companion star which typically has a mass lower than that of the accretor. Most low mass X-ray binaries are transients which means they undergo outbursts sporadically while spending most of their time in a quiescent state with X-ray luminosity below . During an outburst, the X-ray luminosity can increase up to a few times . In the last 15 years, it has been found that there are LMXBs which show sub-luminous accretion outbursts, i.e., having peak outburst luminosities within a range of . This class of LMXBs is known as very faint X-ray transients (VFXTs; see, e.g., Wijnands et al., 2006).
One of the challenging aspects in the study of LMXB – and in particular of these VFXTs – is to understand the nature of a compact object. There are only a few observational methods to unambiguously constrain it. If the source shows coherent pulsations or thermonuclear X-ray bursts, then it is a NS. If the mass function (typically from optical/infrared spectroscopy) is measured, then one can generally state if the binary system hosts a NS or a BH. In cases where we lack these measurements, the possible nature of its compact object is inferred from the comparison of its spectral and timing signatures with those observed from systems for which we know the nature of their compact objects (see e.g. Porquet et al., 2005). Studies carried out during the quiescent state can also be used to infer the nature of the accretor (see e.g. Gelino et al., 2006).
The faint luminosities of VFXTs make them difficult
to find with all-sky monitors whose sensitivity is typically not
sufficient to detect those systems beyond the peak of their outburst.
When followed-up and monitored with more sensitive instruments, especially
with Swift, the VFXTs often appear to show brief (few days to few weeks) outbursts,
hence allowing only for a limited time opportunity to study these systems
(e.g. Armas Padilla
et al., 2011, 2014; Degenaar et al., 2015).
In addition, many are found in the Galactic plane and have
thus large distances and typically have large column densities
toward them. This does not allow for detailed studies of their
optical or near-infrared properties and hence not much is
known about their companion stars either.
MAXI J1957+032 (also sometimes referred to as IGR J19566+0326) is an X-ray binary which was first observed
in outburst on May 11, 2015 with the Gas Slit Camera (GSC)
aboard MAXI (Negoro
et al., 2015). It was later also detected using
Integral in 20-60 keV band (Cherepashchuk et al., 2015).
Chandra also observed the source giving the best known position to date (Chakrabarty et al., 2016).
Since its discovery, MAXI J1957+032 exhibited four outbursts; each outburst decayed quite rapidly (within a few
days, see eg., Mata
Sánchez et al., 2017).
These authors showed that the optical spectrum of MAXI J1957+032 during its outburst is
consistent with other LMXB transients. The
same authors also proposed that the source is a NS system
based on the resemblance of the system with the
accreting millisecond X-ray pulsar (AMXP) in NGC 6440 X–2.
Both systems have a exhibited a period during which they displayed
frequent outbursts which only lasted several days. For a reasonable range (2–8 kpc) of distances, MAXI J1957+032 classifies as a VFXT.
So far, no BH system has been identified that also exhibits such short, frequent outbursts.
However, it is unclear whether short outbursts are characteristic only for neutron star
X-ray binaries or that they can also indeed be observed in BH systems.
Knevitt et al. (2014) argued that for BHs with short orbital periods (),
the peak outburst luminosity drops close to the
threshold for radiatively inefficient accretion, and BH LMXBs
can have lower outbursts luminosities and shorter outburst durations
compared to NS systems. However, there exist systems
like Swift J1357.2-0933 (see e.g., Mata Sánchez
et al., 2015; Armas Padilla et al., 2013a) and Swift J1753.5-0127 (see e.g., Ramadevi &
Seetha, 2007; Zurita et al., 2008)
that are believed
to have short orbital periods, but they do not exhibit short outbursts.
Moreover, MAXI J1659–152 is a short orbital period BH but it exhibits
bright outbursts (Kuulkers
et al., 2013).
Wijnands et al. (2015) searched the literature for reports on the spectral properties of NS and BH LMXBs studied using an absorbed power-law model. They compared the spectra of NS and BH transients when they have accretion luminosities between . The authors found that NSs are significantly softer than BHs below an X-ray luminosity (0.5-10 keV) of (Figure 1 of Wijnands et al., 2015). Thus, the spectral shape between 0.5 and 10 keV at these low luminosities can be a useful tool to distinguish LMXBs hosting NSs from those harbouring BHs. In this paper we present the evolution of all the outbursts observed with MAXI and Swift, and we used the results obtained by Wijnands et al. (2015) to try to get more insights into the nature of MAXI J1957+032.
2 Observations
The Neil Gehrels Swift observatory, launched in November 2004 (Gehrels
et al., 2004), has
three instruments on board: a) the Burst Alert Telescope
(BAT) which operates in the energy range of 15-150 keV
(Barthelmy
et al., 2005); b) the X-ray Telescope (XRT), operating in
the range of 0.2-10 keV (Burrows
et al., 2007); c) the Ultraviolet and Optical
Telescope (UVOT) which covers UV and optical bands
(170–600 nm; Roming et al., 2004). In our paper, we have used the
observations of MAXI J1957+032 performed with Swift-XRT
during the 2015 and 2016 outbursts of the source. The
details of observations used are given in Table 1.
Due to the rapid decay of the source during the outbursts,
only during 8 observations enough photons were detected to allow for meaningful
spectral analysis to be carried out.
| Obs-ID | Time (MJD) | Mode | Exp-time (ksec) | 0.3-10 keV count rate () |
|---|---|---|---|---|
| 33770001 | 57156.03 | PC | 3.0 | |
| 33770002 | 57157.67 | PC | 2.0 | |
| 33770005 | 57162.06 | PC | 2.8 | |
| 33770006 | 57164.76 | PC | 0.9 | |
| 33770007 | 57165.78 | PC | 2.2 | |
| 33770009 | 57304.68 | PC | 1.0 | |
| 33770010 | 57305.62 | PC | 1.0 | |
| 33770011 | 57306.67 | PC | 1.0 | |
| 33770012 | 57307.68 | PC | 1.0 | |
| 33770013 | 57308.63 | PC | 1.0 | |
| 33770014 | 57309.27 | PC | 1.0 | |
| 33770015 | 57310.54 | PC | 0.8 | |
| 33770016 | 57311.43 | PC | 1.0 | |
| 33770017 | 57660.69 | WT | 1.0 | |
| 33770018 | 57661.35 | WT | 0.8 | |
| 33770019 | 57662.75 | WT | 0.4 | |
| 33770020 | 57663.08 | WT | 0.036 | |
| 33770020 | 57663.35 | PC | 1.7 | |
| 33770021 | 57664.18 | PC | 1.7 | |
| 33770022 | 57665.61 | PC | 1.4 | |
| 33770023 | 57667.52 | PC | 0.6 | |
| 33770024 | 57668.09 | PC | 2.0 | |
| 33770025 | 57669.76 | PC | 1.7 |

| Outburst | Obs ID | NH (free) | Unabsorbed flux | ||
|---|---|---|---|---|---|
| (0.5-10 keV) | |||||
| (10atoms cm-2) | () at 1 keV | () | |||
| Outburst 1 | 00033770001 | ||||
| Outburst 2 | 00033770009 | ||||
| 00033770010 | |||||
| 00033770017 | |||||
| 00033770018 | |||||
| Outburst 4 | 00033770019 | ||||
| 00033770020 | |||||
| 00033770021 |
Notes:
Errors quoted are for the 90 confidence range. The energy range used is 0.5-10 keV.
is the Normalisation of power law (PL)
The XRT observations were performed in photon counting (PC) and
windowed timing (WT) modes depending on the brightness of the source. We have used
the online tools provided by the UK Swift Science Data
Centre111http://www.swift.ac.uk/ (Evans
et al., 2009) to obtain the
spectrum of each observation. Some of the spectra showed low number of
photons, therefore, did not allow
us to use statistics. To maintain the homogeneity in our analysis, we
grouped the obtained spectra using the ftools task grppha (HEASOFT v6.19) to have at least one count per bin.
Spectra were fitted using
the XSPEC 12.9.1 (Arnaud, 1996). We have used W-statistics which is background subtracted Cash
statistics (Wachter
et al., 1979).
To obtain insight in the nature of the accretor in our target
we compared our results with that of Wijnands
et al. (2015).
We fitted an absorbed power-law to our spectra. tbabs was used to model
the hydrogen column density () using WILM abundances
(Wilms
et al., 2000). The
values of used are discussed in the next section. For the observations made in PC mode,
we fitted the spectra between 0.5 and 10 keV. The WT spectra are fitted
in the range of 0.7-10 keV as there exist low energy spectral residuals
below 0.7 keV in the WT mode spectra222e.g., see: http://www.swift.ac.uk/analysis/xrt/.
All the fluxes reported are the unabsorbed fluxes and we have used the convolution model
‘cflux’ to measure the fluxes in the 0.5–10 keV range.
In the Appendix, we show that an absorbed power-law provides a good fit
to the XRT observations of MAXI J1957+032 where we have used only spectra of sufficient quality
that allowed us to use statistics to determine
the goodness of the fits.
Figure A1 in the Appendix shows the best spectral fit obtained with the brightest observation
made with XRT. Table A1 gives the fit parameters obtained using an absorbed power-law.
The Monitor of All Sky X-ray image (MAXI) is an all sky monitor
(Matsuoka
et al., 2009) which has two instruments on board: the Solid state
Slit Camera (SSC), operating between 0.7-7 keV
(Tomida
et al., 2011) and GSC, operating in the
energy range 2-20 keV (Mihara
et al., 2011). GSC has a wider field-of-view
and much larger collecting area than SSC.
MAXI J1957+032 was detected
with the MAXI-GSC during all the four outbursts.
We have used MAXI-GSC light curves extracted
in the 2-10 keV energy band using the MAXI on-demand
data processing333http://maxi.riken.jp/mxondem/ (Nakahira
et al., 2010).
3 Results
3.1 Light Curves
MAXI J1957+032 underwent four outbursts that started on 2015-05-11 (outburst 1; ATel 7504; Negoro
et al., 2015),
2015-10-06 (outburst 2; ATel 8143; Sugimoto
et al., 2015),
2016-01-07 (outburst 3; ATel 8529; Tanaka
et al., 2016) and 2016-09-29 (outburst 4; ATel 9565; Negoro
et al., 2016b).
The four outbursts of MAXI J1957+032 were observed with MAXI but only three of these
were monitored with Swift. The third
outburst (outburst 3) was not covered with Swift-XRT due
to the Sun angle constraint.
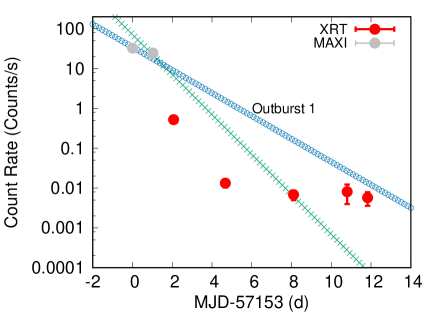
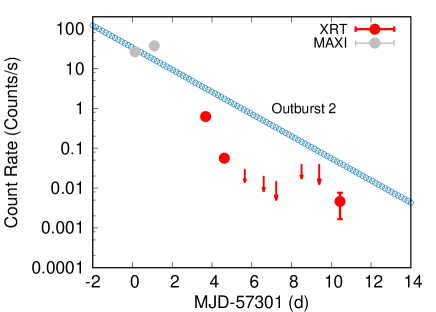
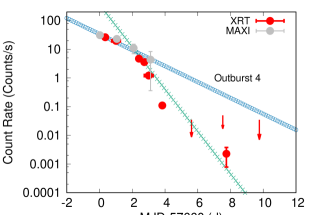
In Figure 1 we show combined light curves of MAXI J1957+032, obtained using MAXI-GSC
and Swift-XRT data, however, for the third outburst we show only the MAXI
light curve. We have used MJD 57153, MJD 57394, MJD 57301, MJD 57660 as
the reference time for outburst 1, outburst 2, outburst 3, outburst 4 respectively.
We have used WebPIMMS HEASARC tool to convert MAXI-GSC count rates obtained in the 2-10 keV energy band
to Swift-XRT count rates
in the 0.3-10 keV energy band. The best-fit values of and obtained using
the spectral fitting of the brighest observation
made with XRT during each outburst were used for this conversion (refer Table 2). However, for the third outburst,
we assumed the
value of
and as observed during its outburst 4.
Figure 1 shows the evolution of four outbursts observed in MAXI J1957+032 and it can be seen that all the four outbursts were equally bright. However, only during the fourth outburst (outburst 4) XRT observations were made close to the peak of the outburst. The peak count rate during the fourth outburst observed with Swift-XRT is 26 which is almost a factor of 50 higher than observed during the other two outbursts. These outbursts do not last more than a few days, and in all cases Swift-XRT observations sample (part of) the outburst decay (Ravi, 2017). We fitted an exponential decay function to the decay to obtain the e-folding time of these outbursts. The decay time scale obtained for outburst 2 is . Here, the exponential decay function was fitted starting from the peak of the outburst. Outburst 1 and 4 indicated the presence of two e-folding times. Therefore, we fitted these two outburst curves using an exponential decay function in two different time ranges. This allowed us to determine slow and fast declines during these outbursts (see Figure 1). The e-folding timescales of outburst 1 are , and days corresponding to the slow and fast declines respectively. For the outburst 4, we obtained , and days to be the slow and fast decay timescales respectively
These obtained decay timescales are consistent with that reported by Mata Sánchez et al. (2017). For the third outburst (outburst 3) it is difficult to determine the decay time scale using the GSC data. The errors quoted on the decay timescales are within confidence range.
3.2 Absorption Column Density ()
From the spectral fitting we found that, when it was left free in the fits, the value of showed a large variation throughout the brightest outburst observed in 2016. To investigate, if the higher value of column density is due to the requirement of a thermal X-ray component, we tried fitting the spectra with a model composed of a soft thermal component (bbodyrad) and a power law component. We noticed, however, that thermal component was not required in all these spectra. During the brighest outburst of MAXI J1957+032, only one of the observations showed the presence of a soft component (for details see Section 4). Thus, a higher value of might indicate the increase in the intrinsic absorption with an decreasing X-ray luminosity. Another possibility, could be that at higher X-ray luminosities the source is far away from a true power law shape. This was also suggested by Cherepashchuk et al. (2015) when the authors found that the simple extrapolation of the XRT spectrum of MAXI J1957+032 to the 20–60 keV energy band resulted into five times lower value of X-ray flux compared to that measured with INTEGRAL.
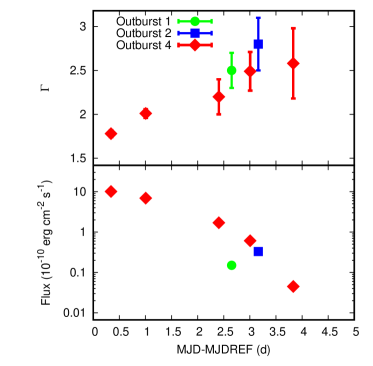
3.3 Spectral Evolution during Outbursts of MAXI J1957+032
In Figure 2 we show the spectral evolution of MAXI J1957+032 during the three outbursts as observed with Swift-XRT. The two panels (from top to bottom) are for the power-law index, and the unabsorbed flux in the 0.5–10 keV band respectively. We found that while generally increases with time, and the 0.5–10 keV absorbed flux decreased; clearly there is an anti-correlation between power-law index and observed flux. During the brightest outburst of MAXI J1957+032 in 2016, the values of power-law index () increased from 1.8 to 2.5 when the fluxes decreased (outburst 4, Figure 1). From the spectral analysis of MAXI J1957+032, we found that reaches the value close to 2.5 during its three outbursts observed with Swift-XRT (see also Mata Sánchez et al., 2017; Ravi, 2017; Kennea et al., 2017).
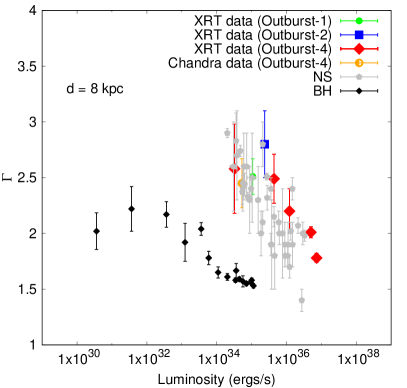
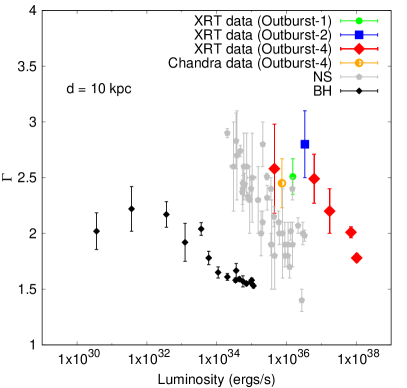
3.4 Photon Index versus luminosity
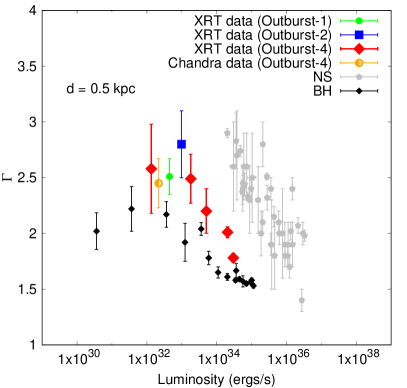
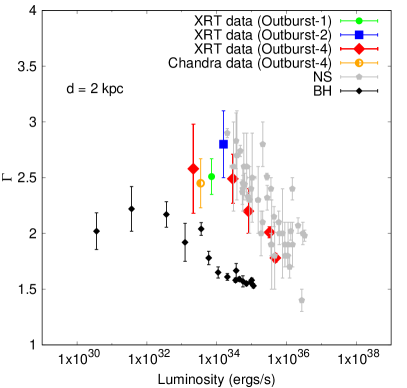
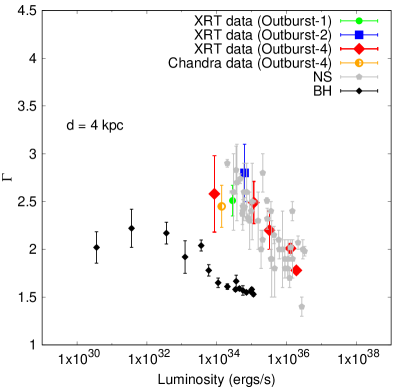
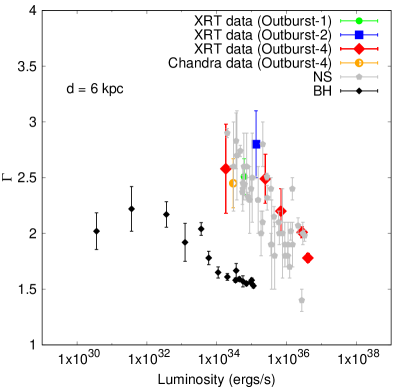
We converted the unabsorbed fluxes in the 0.5-10 keV band (given in Table 2) to X-ray luminosities. The distance to MAXI J1957+032 is not known; therefore, below we discuss different interpretations of our data based on a wide range of distances. Figure 3 shows as a function of X-ray luminosity in the 0.5-10 keV band. This plot includes all the data points used by Wijnands et al. (2015) and also the values we have obtained for MAXI J1957+032. The black and the grey points of the Figure 3 corresponds to BH and the NS binary systems, respectively. The red, blue, and green points are of MAXI J1957+032, obtained using Swift-XRT data while the orange point corresponds to the photon index obtained using the Chandra observation of MAXI J1957+032 during outburst 4 (Chakrabarty et al., 2016).
4 Discussions
In our work, we have used Swift-XRT observations during
three of four outbursts of MAXI J1957+032.
MAXI J1957+032 is believed to be a VFXT and the nature of its compact
object is still not established.
We observe that the light curves of MAXI J1957+032 during its outbursts show a very short
exponential decay timescales of less than a day.
Based on these characteristics like short outbursts and short recurrence time of outbursts,
MAXI J1957+032 was proposed to be an AMXP similar to NGC 6440 X–2 by Mata
Sánchez et al. (2017).
However, there are several VFXTs in the Galactic center which are not AMXPs but show
short duration outbursts (see e.g., Degenaar et al., 2015) and there are also several
bright NS X-ray transients (not AMXPs) that show outbursts which last only for a few days
with a peak luminosity of for example, GRS 1741-2853 (Degenaar &
Wijnands, 2010), XTE J1701–407
(Fridriksson
et al., 2011), Aql X–1 (Coti Zelati et al., 2014), SAX J1750.8-2900 (Wijnands &
Degenaar, 2013).
Outbursts are often believed to be due to accretion disk instabilities.
According to standard accretion disk instability
models e.g., Lasota (2001) one would expect brighter outbursts to be longer.
If MAXI J1957+032 is a short period binary system then one would expect a long interval between
outbursts (also see Heinke
et al., 2010, for details). MAXI J1957+032 showed
an increased activity in a year and half starting from June 2015. It showed outbursts
once every few-hundred days. MAXI/GSC nova alert system (Negoro
et al., 2016a) has triggered on
four outbursts from MAXI J1957+032. To search for other
brightening episodes of MAXI J1957+032, we checked the publicly available MAXI-GSC
light curves which include data before its first outburst (starting from August 2009), however, we did not find
any flaring event prior to the its first X-ray outburst (outburst 1).
Another possible cause of these outbursts is mass-transfer variations from the donor
similar to that suggested for NGC 6440 X–2 (Heinke
et al., 2010).
If MAXI J1957+032 is a triple star system as proposed by Ravi (2017)
one might expect to observe change in the orbital parameters, induced
by the distant companion. However, this would need monitoring of future outbursts
with more sensitive instruments like XMM-Newton, Chandra.
We have studied the spectra (using an absorbed power-law model) and we observed an anti-correlation between and the total flux similar to what has been observed in the spectra of many other LMXBs (see e.g., Armas Padilla et al., 2011; Armas Padilla et al., 2013a; Reynolds et al., 2014). The spectra become softer as the source luminosity decreases (see also Kennea et al., 2015, 2016). After comparing the spectra of several LMXBs (NSs and BHs) Wijnands et al. (2015) reported that NS binary systems tend to be much softer compared to the BH systems at low luminosities. These authors found that in the case of NS X-ray binaries at low luminosities ( ) the value of can be as high as 3. We explore different possible scenarios based on the assumption of different values of source distance of MAXI J1957+032. Figure 3 shows how different distances affect our conclusions which we discuss in more detail here. If the distances of MAXI J1957+032 is as low as 0.5 kpc, our data lay closer to the the track of BHs rather than a NS. In addition, at the lowest X-ray luminosities, the two data points of MAXI J1957+032 are significantly softer than the BH data points. We also note that although the errors on estimated for rest of the data points of MAXI J1957+032 are large, the trend clearly shows higher values of than seen for the BH data points. Moreover, we note that Ravi (2017) proposed the source distance to be 5 kpc using the R-band magnitude for the MAXI J1957+032 counterpart. The authors also suggested that the V-band extinction and measured hydrogen column density are consistent with the proposed source distance.
For the source distance between 2 to 8 kpc, our data better follows the track of the NS LMXBs. At 4 kpc, MAXI J1957+032 falls in the regime of VFXTs that have maximum X-ray luminosities in outburst between (Wijnands et al., 2006). In that case, at around thermal emission from the neutron star surface might become visible and the spectrum should then be described with an absorbed bbodyrad+power-law model (see discussions in Wijnands et al., 2015). Therefore, we re-fitted the spectra by adding bbodyrad component. We found that on adding the bbodyrad component, the the value of decreased from 50 to 43 for the observation with ID 00033770001 and for the observation with ID 00033770020, the value of decreased from 17 to 13 for 2 degrees of freedom (dof) less. Thus, the spectra of two observations (ID 00033770001 & 00033770020; MJDs: 57156.03 and 57663.35 respectively) showed a potential contribution of thermal emission in the form of blackbody The best-fit parameters are given in Table 3. However, we would like to mention that some of the fit parameters are not well constrained owing to the limited statistics. These observations corresponds to the green and fourth red point from the left (between and ) of Figure 3 at d=4kpc. We observe that is harder when a blackbody component is included.
This has also been seen in other VFXTs such as XTE J1709–267,
IGR J17494–3030 which have both been proposed to be NSs
based on their X-ray spectral properties (Degenaar et al., 2013; Armas Padilla et al., 2013b) (see also Wijnands
et al., 2015, for a discussion).
Moreover, the confirmed NS VFXT and AMXP IGR J17062–6143 also shows a thermal component in its spectrum (Degenaar
et al., 2017).
The obtained values and power law that we obtained for MAXI J1957+032 are consistent with studies of
these systems.
We note that in the black hole LMXB and VFXT, namely, Swift J1357.2-0933 the high-quality XMM-Newton
data also required a blackbody component but the contribution of the
soft (thermal) component to the total flux is less than 10 (Armas Padilla et al., 2013a), while we
find that it contributes about 30-40 of the total flux observed for MAXI J1957+032.
We also note that Armas Padilla et al. (2013b); Shidatsu
et al. (2017); Degenaar
et al. (2017) suggested the
possible origin of the observed thermal emission in the X-ray spectra to be neutron
star surface or the accretion disc. From
Table 3, we observe that the obtained values of blackbody radius (2-3 kpc)
are very similar to that have been found in other systems that are either proposed to be NS or
are confirmed NS systems. Thus, the origin of the thermal emission can be a part of the neutron star.
There are systems even as far as 20-50 kpc (e.g., the BHC GS 1354-64 at a distance of about 25 kpc, NS MAXI J0556–332 at a distance 46 kpc see; Casares et al., 2004; Homan et al., 2014). However, we note that a very recent distance measurements performed by Gandhi et al. (2018) using data obtained with Gaia suggests that GS 1354-64 is a nearby system ( 0.6 kpc). If we assume that MAXI J1957+032 is at about kpc, then the highest flux levels we measured would correspond to a source accreting at . The softening we observed could correspond to the softening that it is sometimes seen in some BH and NS systems at high luminosities (see, e.g., Remillard & McClintock, 2006; Lin et al., 2007; Soleri et al., 2013; Fridriksson et al., 2015, and references therein; however note that these works generally use multi-component models, making it difficult to make precise comparisons). We also note that the possibility of MAXI J1957+032 to be a distant source contradicts the measured value of extinction via optical observations and . However, these measurements are based on several assumptions e.g., extinction does not significantly vary between active and quiescent states and if so, then with the current data it is not possible to conclusively state whether this system contains a NS or a BH.
5 Acknowledgments
The authors gratefully acknowledge the referee for his useful suggestions that helped us to improve the presentation of the paper. A.B. gratefully acknowledge the Royal Society and SERB (Science Engineering Research Board, India) for financial support through Newton-Bhabha Fund. A.B. is supported by an INSPIRE Faculty grant (DST/INSPIRE/04/2018/001265) by the Department of Science and Technology, Govt. of India. She is also grateful to Deepto Chakrabarty (MIT), Peter G. Jonker (SRON), Craig B Markwardt (NASA/GSFC) for sharing their Chandra data. DA acknowledges support from the Royal Society. AP and RW acknowledge support from a NWO Top Grant, Module 1, awarded to RW. ND is supported by a Vidi grant awarded to ND by the Netherlands Organization for Scientific Research. We acknowledge the use of public data from the Swift data archive. This research has made use of MAXI data provided by RIKEN, JAXA and the MAXI team.
References
- Armas Padilla et al. (2011) Armas Padilla M., Degenaar N., Patruno A., Russell D. M., Linares M., Maccarone T. J., Homan J., Wijnands R., 2011, MNRAS, 417, 659
- Armas Padilla et al. (2013a) Armas Padilla M., Degenaar N., Wijnands R., 2013a, MNRAS, 434, 1586
- Armas Padilla et al. (2013b) Armas Padilla M., Wijnands R., Degenaar N., 2013b, MNRAS, 436, L89
- Armas Padilla et al. (2014) Armas Padilla M., Wijnands R., Altamirano D., Méndez M., Miller J. M., Degenaar N., 2014, MNRAS, 439, 3908
- Arnaud (1996) Arnaud K. A., 1996, in Jacoby G. H., Barnes J., eds, Astronomical Society of the Pacific Conference Series Vol. 101, Astronomical Data Analysis Software and Systems V. p. 17
- Barthelmy et al. (2005) Barthelmy S. D., et al., 2005, Space Sci. Rev., 120, 143
- Burrows et al. (2007) Burrows D. N., et al., 2007, in UV, X-Ray, and Gamma-Ray Space Instrumentation for Astronomy XV. p. 668607, doi:10.1117/12.735130
- Casares et al. (2004) Casares J., Zurita C., Shahbaz T., Charles P. A., Fender R. P., 2004, ApJ, 613, L133
- Chakrabarty et al. (2016) Chakrabarty D., Jonker P. G., Markwardt C. B., 2016, The Astronomer’s Telegram, 9591
- Cherepashchuk et al. (2015) Cherepashchuk A. M., Molkov S. V., Lutovinov A. A., Postnov K. A., 2015, The Astronomer’s Telegram, 7506
- Coti Zelati et al. (2014) Coti Zelati F., Campana S., D’Avanzo P., Melandri A., 2014, Monthly Notices of the Royal Astronomical Society, 438, 2634
- Degenaar & Wijnands (2010) Degenaar N., Wijnands R., 2010, A&A, 524, A69
- Degenaar et al. (2013) Degenaar N., Wijnands R., Miller J. M., 2013, ApJ, 767, L31
- Degenaar et al. (2015) Degenaar N., Wijnands R., Miller J. M., Reynolds M. T., Kennea J., Gehrels N., 2015, Journal of High Energy Astrophysics, 7, 137
- Degenaar et al. (2017) Degenaar N., Pinto C., Miller J. M., Wijnands R., Altamirano D., Paerels F., Fabian A. C., Chakrabarty D., 2017, MNRAS, 464, 398
- Evans et al. (2009) Evans P. A., et al., 2009, MNRAS, 397, 1177
- Fridriksson et al. (2011) Fridriksson J. K., et al., 2011, ApJ, 736, 162
- Fridriksson et al. (2015) Fridriksson J. K., Homan J., Remillard R. A., 2015, ApJ, 809, 52
- Gandhi et al. (2018) Gandhi P., Rao A., Johnson M. A. C., Paice J. A., Maccarone T. J., 2018, preprint, (arXiv:1804.11349)
- Gehrels et al. (2004) Gehrels N., et al., 2004, ApJ, 611, 1005
- Gelino et al. (2006) Gelino D. M., Balman Ş., Kızıloǧlu Ü., Yılmaz A., Kalemci E., Tomsick J. A., 2006, ApJ, 642, 438
- Heinke et al. (2010) Heinke C. O., et al., 2010, ApJ, 714, 894
- Homan et al. (2014) Homan J., Fridriksson J. K., Wijnands R., Cackett E. M., Degenaar N., Linares M., Lin D., Remillard R. A., 2014, ApJ, 795, 131
- Kennea et al. (2015) Kennea J. A., et al., 2015, The Astronomer’s Telegram, 8146
- Kennea et al. (2016) Kennea J. A., Evans P. A., Beardmore A. P., Krimm H. A., Romano P., Yamaoka K., Serino M., Negoro H., 2016, The Astronomer’s Telegram, 9572
- Kennea et al. (2017) Kennea J., Negoro H., Evans P., Beardmore A., Krimm H., Serino M., Romano P., Yamaoka K., 2017, in Serino M., Shidatsu M., Iwakiri W., Mihara T., eds, 7 years of MAXI: monitoring X-ray Transients, held 5-7 December 2016 at RIKEN. Online at <A href=“https://indico2.riken.jp/indico/conferenceDisplay.py?confId=2357”> https://indico2.riken.jp/indico/conferenceDisplay.py?confId=2357</A>, p.39. p. 39
- Knevitt et al. (2014) Knevitt G., Wynn G. A., Vaughan S., Watson M. G., 2014, MNRAS, 437, 3087
- Kuulkers et al. (2013) Kuulkers E., et al., 2013, A&A, 552, A32
- Lasota (2001) Lasota J.-P., 2001, New Astron. Rev., 45, 449
- Lin et al. (2007) Lin D., Remillard R. A., Homan J., 2007, ApJ, 667, 1073
- Mata Sánchez et al. (2015) Mata Sánchez D., Muñoz-Darias T., Casares J., Corral-Santana J. M., Shahbaz T., 2015, MNRAS, 454, 2199
- Mata Sánchez et al. (2017) Mata Sánchez D., Charles P. A., Armas Padilla M., Buckley D. A. H., Israel G. L., Linares M., Muñoz-Darias T., 2017, MNRAS, 468, 564
- Matsuoka et al. (2009) Matsuoka M., et al., 2009, PASJ, 61, 999
- Mihara et al. (2011) Mihara T., et al., 2011, PASJ, 63, S623
- Nakahira et al. (2010) Nakahira S., et al., 2010, PASJ, 62, L27
- Negoro et al. (2015) Negoro H., et al., 2015, The Astronomer’s Telegram, 7504
- Negoro et al. (2016a) Negoro H., et al., 2016a, PASJ, 68, S1
- Negoro et al. (2016b) Negoro H., et al., 2016b, The Astronomer’s Telegram, 9565
- Porquet et al. (2005) Porquet D., Grosso N., Bélanger G., Goldwurm A., Yusef-Zadeh F., Warwick R. S., Predehl P., 2005, A&A, 443, 571
- Ramadevi & Seetha (2007) Ramadevi M. C., Seetha S., 2007, MNRAS, 378, 182
- Ravi (2017) Ravi V., 2017, ApJ, 851, 114
- Remillard & McClintock (2006) Remillard R. A., McClintock J. E., 2006, ARA&A, 44, 49
- Reynolds et al. (2014) Reynolds M. T., Reis R. C., Miller J. M., Cackett E. M., Degenaar N., 2014, MNRAS, 441, 3656
- Roming et al. (2004) Roming P. W. A., Hunsberger S. D., Nousek J. A., Ivanushkina M., Mason K. O., Breeveld A. A., 2004, in Fenimore E., Galassi M., eds, American Institute of Physics Conference Series Vol. 727, Gamma-Ray Bursts: 30 Years of Discovery. pp 651–654, doi:10.1063/1.1810927
- Shidatsu et al. (2017) Shidatsu M., et al., 2017, ApJ, 850, 155
- Soleri et al. (2013) Soleri P., et al., 2013, MNRAS, 429, 1244
- Sugimoto et al. (2015) Sugimoto J., et al., 2015, The Astronomer’s Telegram, 8143
- Tanaka et al. (2016) Tanaka K., et al., 2016, The Astronomer’s Telegram, 8529
- Tomida et al. (2011) Tomida H., et al., 2011, PASJ, 63, 397
- Wachter et al. (1979) Wachter K., Leach R., Kellogg E., 1979, ApJ, 230, 274
- Wijnands & Degenaar (2013) Wijnands R., Degenaar N., 2013, MNRAS, 434, 1599
- Wijnands et al. (2006) Wijnands R., et al., 2006, A&A, 449, 1117
- Wijnands et al. (2015) Wijnands R., Degenaar N., Armas Padilla M., Altamirano D., Cavecchi Y., Linares M., Bahramian A., Heinke C. O., 2015, MNRAS, 454, 1371
- Wilms et al. (2000) Wilms J., Allen A., McCray R., 2000, ApJ, 542, 914
- Zurita et al. (2008) Zurita C., Durant M., Torres M. A. P., Shahbaz T., Casares J., Steeghs D., 2008, ApJ, 681, 1458
| Outburst | Obs ID | NH (free) | Total Unabsorbed Flux (0.5-10) keV | PL Flux/Total Flux | (dof) | ||||
|---|---|---|---|---|---|---|---|---|---|
| 10atoms cm-2 | keV | , | |||||||
| Outburst 1 | 00033770001 | 1.28 (34) | |||||||
| Outburst 4 | 00033770020 | 0.71 (18) |
Notes: is the blackbody temperature. is the blackbody radius in km. stands for power law.
Appendix A Best fit with an absorbed power-law using chi-squared statistics
Here, we show the spectral fitting using an absorbed power-law model of the spectra with good statistics that allowed us to use statistics to estimate the goodness of the fit. We grouped the obtained spectra using the ftools task grppha to have at least 25 counts per bin.
| Outburst | Obs ID | NH (free) | (dof) | ||
|---|---|---|---|---|---|
| (10atoms cm-2) | () at 1 keV | ||||
| Outburst 1 | 00033770001 | 1.38 (36) | |||
| Outburst 2 | 00033770009 | 0.87 (26) | |||
| 00033770017 | 0.96 (341) | ||||
| 00033770018 | 0.89 (262) | ||||
| Outburst 4 | 00033770019 | 0.75 (12) | |||
| 00033770020 | 0.85 (20) |
