A study of Variability of the Marginal Am star HD 176843 observed in the Kepler field
Abstract
We present results of a study of variability of the marginal Am star HD 176843 observed in the Kepler field. Kepler photometry and ground–based spectroscopy are used to investigate the light variations of the star. HD 176843 is classified as a marginal Am star that shows Sct type pulsations. From an analysis of the Kepler time series, we find that the light curve of HD 176843 is dominated by three modes with frequencies =0.1145, =0.0162 and =0.1078 d-1. The amplitude of the radial velocity variations of about 10 km/s is much more than the radial velocity errors and allows us to conclude clear radial velocity variations. Using the radial velocity data and the adopted spectra, the orbital solution of HD 176843 is also obtained with an orbital period of 34.14 days. However, the available photometric data show no significant evidence for any possible motion in the binary system.
keywords:
stars; variables; stars; oscillations (including pulsations) stars; individual1 Introduction
The classical Am (metallic–lined) stars are those whose spectrum shows relatively strong absorption of metallic lines (Iron or Iron-group elements) and relatively weak Calcium (Ca) and/or Scandium (Sc) lines that appear between A- and early F spectral types [1, 2]. They are organized in subclasses corresponding to the K line, Hydrogen and metallic lines respectively. Thus, Am stars are generally classified into two groups: classical Am stars (Am) and marginal Am stars (Am:). The spectral types of the classical Am stars are determined from the CaII K line, Hydrogen and metal lines corresponding to five and more spectral subclasses (e.g., kA0hA0VmA1). On the other hand, the marginal Am stars show fewer spectral subclasses between the CaII K and metallic lines with milder abundance anomalies unlike the classical ones.
The Am stars are known to be slow rotators [3, 4] which causes abundance anomalies (if d -1) due to interaction between gravitational settling and radiative levitation in the presence of absent or weak magnetic field. In this case, meridional turbulent motions due to slow rotation allow for He to settle from the partial He II ionization zone gravitationally, and therefore Sct type pulsations are not expected to be driven by the mechanism in these stars [5, 6, 7, 8].
The Am stars were historically known as a class of non-pulsating variables [5, 7]. However, pioneering space missions such as MOST [9], CoRoT [10] and, Kepler [11] provided that many hybrid type pulsator, which shows more than one frequency regime (e.g., pressure and gravity modes), candidates with very low amplitudes can be detected with high-precision techniques. Moreover, using the data of A stars from Kepler [12] showed that both high and low frequencies could be observed in all stars that lie at the Sct instability strip. The recent study presented that around 200 of known 1600 Am stars are found to be pulsating Sct and Dor stars [13, 14]. Some marginal Am stars are also found at the red edge of the instability strip [13, 14, 15] rather than where the majority of Am stars are located at the blue age, which means that it can be difficult to distinguish them from Sct stars. These new results have made Am stars unique targets to test the latest diffusion scenario [16] regarding their location in the HR Diagram.
The recent results using WASP photometry show that there are only 11 Am stars found among 249 binaries.[17] also reported that only 4 out of 70 Am stars in eclipsing binary systems have pulsating components detected by WASP. Furthermore, Kepler and K2 telescopes observed 144 Am stars but only 42 of them showed principal pulsation frequencies and amplitudes within the Sct range. In addition, the vast majority of A and Am stars observed with The Large Sky Area Multi-Object Fiber Spectroscopic Telescope (LAMOST) and WASP provided us with the opportunity to claim the presence of Sct pulsations in Am stars which are located to a region close to the cooler edge of the Sct instability strip within range [18, 14].
[19] also showed that the index can be used as metallicism (degree of chemical peculiarity) index to separate the marginal Am stars from the classical ones. Accordingly, this value is defined as indicator of the numerical difference in the k and m spectral types. [14] presented that there is a negative correlation between the incidence of pulsations in Am stars and metallicism. What is more, they found that the maximum amplitude of the pulsations is not significantly related to metallicism.
A large number of the Am stars have been found to be members of short period binary systems [20, 21, 17]. This would be a possible explanation for low rotation rates because of rotational braking induced by tidal friction in a close binary system [22, 23, 14]. For those Am stars found in a binary system, [Ca/Fe] indicator can be associated with some of the binary parameters. This indicator was determined as an expression [Ca/Fe] = [Ca/H] - [Fe/H], where [N/H] = . Am peculiarities were found to increase with increasing orbital eccentricity but no evidence of such a correlation with orbital period was found [24]. It should also be noted that around 60–70 percent of Am stars are suggested to be spectroscopic binaries by[17]. Yet, the role of binarity is not clear for the Am phenomenon.
The star, HD 176843 ( Kepler ID:KIC 9204718 , A3mF0, V=7m .51), was first classified as an Am star by [25] and it was recently listed to be a marginal Am star showing Sct pulsations within a possible contact binary system [26]. Our study is structured as follows: we first present the results of a detailed examination of Kepler photometry, including method of data reduction and frequency analyses. Section 4 deals with the spectroscopic observations. Finally, a brief summary and conclusions are reported in the last section.
2 The Kepler Photometry
Kepler photometry is used to investigate the light variations of HD 176843. The Kepler 111http://kepler.nasa.gov/space telescope, designed to detect Earth-like planets around the Sun-like stars within the habitable zone [27, 11], was launched on 2009 March 6. Kepler continuously observed a 105 square degree area of the sky targeted in the constellations of Cygnus and Lyra. HD 176843 was observed with 1- min exposures in Short–Cadence (SC) mode (only Q3.3) and in Long–Cadence (LC) (29.45 min) modes (Q0-Q17). Since vast majority of the observations were obtained in LC we therefore analyzed the LC data collected between the Kepler commissioning quarters Q0 and Q17. The data are also publicly available on the Barbara A. Mikulski Archive for Space Telescopes 222MAST, http://archive.stsci.edu
3 Light Curve Analyses
In order to perform the analyses, cotrending basis vector (CBV) files were first applied to data for cotrending the simple aperture Photometry (SAP) fluxes and removal of instrumental systematics from the light curve by using kepcotrend task of PyKE package [28]. We converted the raw SAP fluxes to magnitudes by using the formula . The magnitudes were also corrected to zero mean by removing a linear trend. To remove the linear trend in the light curves, we first represented the each quarter dataset by a linear equation, individually. Then we subtracted the equation from each data point of the related quarter.
3.1 Frequency Analysis
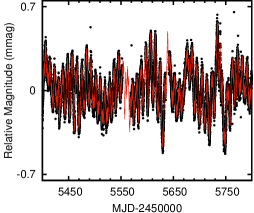
The frequency extraction of HD 176843 was obtained by using the SigSpeC code [29]. The program computes the spectral significance levels for the discrete Fourier transform (DFT) amplitude spectra of time series with arbitrary time sampling. The default significance threshold in SigSpeC is set at 4.1784 that theoretically corresponds to = 3.5 [29, 30]. The theoretical Rayleigh resolution is d-1. Using LC time series, the software package yielded 5 genuine frequencies, 327 combination terms and harmonics up to 5. We also confirm that the light variation is dominated by three frequencies =0.1145, =0.0162 and =0.1078 d-1 as previously reported by [31]. The lowest frequency that appears to be significant is 0.0162 d-1. On the other hand, the term with the lowest amplitude is detected to be significant in the region around 14.5363 d-1. The resulting frequencies of HD 176843 are listed in Table 1, together with their amplitudes, phases and values and uncertainties. The agreement between analysis and the observation is shown for a certain time interval in Fig. 1. The frequency spectrum is also presented in Fig. 2.
| Frequency (d-1) | Amplitude (mmag) | Phase | S/N | |
|---|---|---|---|---|
| 0.11454(2) | 0.098(2) | 1.29(12) | 68 | |
| 0.01619(2) | 0.073(2) | 4.61(15) | 52 | |
| 0.10782(2) | 0.075(3) | 1.75(16) | 49 | |
| 11.1729(4) | 0.031(2) | 2.19(26) | 31 | |
| 14.5363(4) | 0.026(1) | 6.00(26) | 31 | |
| 0.22894(5) | 0.019(1) | 4.98(3) | 25 | |
| 0.34426(28) | 0.002(1) | 3.40(19) | 4 | |
| 0.03277(4) | 0.034(2) | 5.61(3) | 29 | |
| 0.06517(11) | 0.015(3) | 4.18(8) | 10 | |
| 0.08111(8) | 0.011(1) | 2.61(5) | 15 | |
| 0.11279(5) | 0.083(6) | 4.11(3) | 25 | |
| 0.12884(8) | 0.038(4) | 4.83(6) | 14 | |
| 0.14546(16) | 0.005(1) | 1.26(11) | 7 | |
| 0.21535(15) | 0.007(1) | 3.82(10) | 8 | |
| 0.53928(25) | 0.002(1) | 0.64(17) | 5 |

We also analyzed the data covering all LC quarters (Q0-Q17) to test the binary influence on the light variation suggested by [31]. Thus, we pre-whitened all frequencies from the data except 0.5474 d-1 and its harmonics (1.094 d-1 and 1.642 d-1) which is suggested as the binary period. However, the resulting curve folded in 0.5474 d-1 (1.8268 days) showed no variation corresponding to a binary system as previously reported by [31] (Fig. 3).

4 Spectroscopy
Ground-based spectroscopy is used to search for possible changes in radial velocity due to binarity. Spectroscopic observations were carried out with ESPERO-a new-commissioned fiber-fed echelle spectrograph attached to the 2-m RCC telescope of Rozhen National Astronomical Observatory, Bulgaria. An Andor iKon-L CCD-camera has been used to record stellar spectra covering the wavelength range between 4000 Å and 9400 Å and a typical resolving power of approximately 35 000 at 6500 Å. The mean S/N ratio was approximately 50 at 6500 Å. Eighteen spectra have been obtained, most of them between June and September 2016 and a few more in 2017 and 2018. IRAF 333http://iraf.noao.edu/ standard procedures were used for bias subtracting, flat-field normalization and wavelength calibration. The final spectra were corrected to the heliocentric wavelengths.
The radial velocity have been measured by using the procedure FXCOR of IRAF. We calculated synthetic spectra of chosen spectral regions by using the code SYNSPEC ([32]) and Kurucz atmosphere models ([33]) in order to use them as templates for this procedure. The results are shown in Table 2. We have included two more radial velocity measurements obtained by [36] and [37] in 2011 (for details see the text below).
In order to check our system of radial velocities we have obtained spectra of RV standards. The radial velocity measured by us from one night for the standard HD 173398 were while according [34] the value is . For the other star, HD 142639 we have measured from three nights. [35] gives the value . As it is seen our accuracy of measuring radial velocities is high and the values are very close to the published ones.
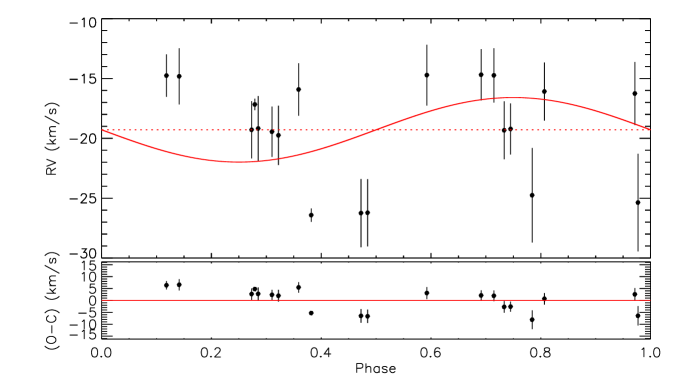
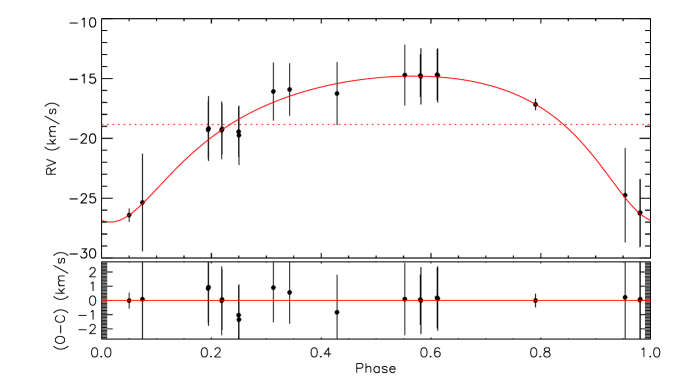
The amplitude of the radial velocity variations of about 10 km/s is much more than the radial velocity errors which supports the clear radial velocity conclusion. These results allow us to confirm that the star HD 176843 is a possible binary star which first has been proposed by [26]. Unfortunately, our attempts to connect these variations with the period of 1.d8268 proposed by[31] as an orbital period did not give the reasonable result.Radial velocity measurements phased on the period of 1.8268 days for HD 176843 are also presented in Figure 5. The careful check of the spectra for double lines was negative. We could not see any lines which are split (see Fig.4). This may lead us to conclude that the star is SB1. Furthermore, we also combined our radial velocity data with the ones obtained by [36] and [37] to derive plausible orbital parameters. Cross-correlation technique was used to determine the value of rvsini by means of the adopted spectra from [37]. For the analysis, the rvfit code [38] was applied to the radial velocity data (see Table 2) and we therefore listed the resulting parameters in Table 3. According to our calculations, these variations with the period of 34.d14 would be suggested as a possible orbital period which did give a more reasonable result than previously suggested by [31].Best theoretical fit to radial velocity values on the period of 34.14 days for HD 176843 are also plotted and presented in Figure 6.
| Date | HJD 245+ | Phase | RV[km/s] | RVerr[km/s] |
|---|---|---|---|---|
| 17.05.2011 | 5696.66520 | 0.071 | -26.72 | 0.56 |
| 19.09.2011 | 5824.35360 | 0.811 | -17.17 | 0.48 |
| 21.07.2016 | 7591.44155 | 0.570 | -14.72 | 2.54 |
| 22.07.2016 | 7592.40175 | 0.598 | -14.76 | 1.77 |
| 22.07.2016 | 7592.44421 | 0.599 | -14.82 | 2.35 |
| 23.07.2016 | 7593.44898 | 0.629 | -14.69 | 2.14 |
| 23.07.2016 | 7593.49145 | 0.630 | -14.74 | 2.27 |
| 16.08.2016 | 7617.40795 | 0.331 | -16.09 | 2.43 |
| 17.08.2016 | 7618.41679 | 0.360 | -15.92 | 2.19 |
| 20.08.2016 | 7621.36269 | 0.446 | -16.26 | 2.64 |
| 15.09.2016 | 7647.48922 | 0.212 | -19.29 | 2.39 |
| 15.09.2016 | 7647.51099 | 0.212 | -19.18 | 2.71 |
| 16.09.2016 | 7648.32971 | 0.236 | -19.33 | 2.42 |
| 16.09.2016 | 7648.35104 | 0.237 | -19.22 | 2.13 |
| 17.09.2016 | 7649.38379 | 0.267 | -19.45 | 2.10 |
| 17.09.2016 | 7649.40526 | 0.268 | -19.75 | 2.48 |
| 12.07.2017 | 7947.44836 | 0.998 | -26.25 | 2.85 |
| 12.07.2017 | 7947.47042 | 0.998 | -26.22 | 2.81 |
| 29.11.2017 | 8087.20700 | 0.091 | -25.37 | 4.08 |
| 07.03.2018 | 8185.50199 | 0.970 | -24.76 | 3.95 |

| Parameter | Value | Error |
|---|---|---|
| (day) | 34.14 | 0.02 |
| (HJD) | 2455694.2532 | 0.7052 |
| 6.1 | 0.3 | |
| -18.8 | 0.2 | |
| 2.66 | 0.2 | |
| 0.0006 | 0.0001 | |
| e | 0.37 | 0.05 |
| (deg) | 165 | 6 |
5 Conclusions
We present the results of a new study aimed to identify the variability of the marginal Am star HD 176843 observed by the Kepler satellite. Kepler photometry and ground–based spectroscopy are used to investigate light variations of the star. We analyzed the Kepler data to determine the possible pulsational behaviour of HD 176843. Frequencies were extracted from the LC data by using the software package SigSpeC [29]. Our results are in a good agreement with previous analyses of the LC Kepler data reported by [31] and we confirm that the light curve of HD 176843 is dominated by three modes with frequencies =0.1145, =0.0162 and =0.1078 d-1.
In order to search for a possible binarity effect on the light curve of HD 176843, we also perform the analysis of the Kepler data covering all the quarters taken in LC mode. For this purpose, all pulsational frequencies from the data except 0.5474 d-1 and its harmonics (1.094 d-1 and 1.642 d-1) were pre-whitened to test any light variation previously suggested by [31]. Unfortunately, no significant change was derived from the residuals as shown in Figure 3.
Spectroscopic observations of HD 176843 were obtained in 2016 and 2017 with ESPERO echelle spectrograph on the 2 m RCC telescope of the Bulgarian National Astronomical Observatory – Rozhen. Spectroscopic data analysis indicate that the star HD 176843 clearly shows radial velocity variations and this can be interpreted as due to binarity as suggested by [26]. Alas, these changes in radial velocity of HD 176843 could not be attributed to the orbital period of 1.d8268 proposed by [31] (Figure 5). Also, our second attempt with additional radial velocity values and the adopted spectra [37] would suggest a new orbital period of 34.d14 for these variations in the star HD 176843 (Figure 6). It should be noted that no split lines were observed in the spectra (Figure 4) and it therefore seems that there is a probability of a SB1 case. Additionally, we tried to derive orbital parameters using our radial velocity measurements and two more measurements published previously by [36] and [37] (corresponding to the first two RV’s values in Table 2).
Acknowledgments
The authors acknowledge the whole Kepler team for providing the unprecedented data sets that make these results possible. CU acknowledges financial support from the University of South Africa (UNISA) and the South African National Research Foundation (NRF), Grant No: 87635. This paper includes data collected by the Kepler mission. Funding for the Kepler mission is provided by the NASA Science Mission directorate. IS, II, MN acknowledge for the partial support of the projects DN 08-1/2016 and DN 18/13-12.12.2017. MN acknowledges for the partial support of the project DFNP-103/11.05.2016.
References
- Titus& Morgan [1940] Titus J., Morgan W. W., 1940, ApJ, 92, 256.
- Roman et al. [1948] Roman N. G., Morgan W. W., Eggen O. J., 1948, ApJ, 107, 107.
- Slettebak [1954] Slettebak, A., 1954, ApJ, 119, 146.
- Slettebak [1955] Slettebak, A., 1955, ApJ, 121, 653.
- Breger [1970] Breger M., 1970, ApJ, 162, 597.
- Baglin et al. [1973] Baglin, A., Breger, M., Chevalier, C., Hauck, B., Le Contel, J. M.; Sareyan, J. P., Valtier, J. C., 1973, A&A 23, 221.
- Kurtz [1976] Kurtz, D.W. ApJS, 32, 651.
- Aerts et al. [2010] Aerts C., Christensen-Dalsgaard J., Kurtz D. W., 2010, Asteroseismology, Springer.
- Walker et al. [2003] Walker G., et al., 2003, PASP, 115, 1023.
- Baglin et al. [2006] Baglin A. et al., 2006, cosp, 36, 3749.
- Borucki et al. [2010] Borucki W.J.et al.,2010,Sci, 327, 977.
- Grigahcène et al. [2010] Grigahcène A., 2010, ApJ, 713, L192.
- Smalley et al. [2011] Smalley B., et al., 2011, A&A, 535, A3.
- Smalley et al. [2017] Smalley et al., 2017, MNRAS, 465, Issue 3, p.2662-2670.
- Catanzaro & Balona [2012] Catanzaro G., Balona L. A., 2012, MNRAS, 421, 1222.
- Turcotte et al. [2000] Turcotte S., Richer J., Michaud G., Christensen-Dalsgaard J., 2000, A&A, 360, 603.
- Smalley et al. [2014] Smalley et al., 2014, A&A, 564, A69.
- Zhao et al. [2012] Zhao G., Zhao Y.-H., Chu Y.-Q., Jing Y.-P., Deng L.-C., 2012, Research in Astronomy and Astrophysics, 12, 723.
- Hou [2015] Hou W., et al., 2015, MNRAS, 449, 1401.
- Abt [1967] Abt H. A.,1967in Magnetic and Related Stars, Cameron R. C., ed., p. 173.
- Carquillat & Prieur [2007] Carquillat J. M., Prieur J. L.2007, MNRAS, 380, 1064.
- Abt & Moyd [1973] Abt, H. A.; Moyd, K. I., ApJ, 182, 809.
- Wolff [1983] Wolff S. C., 1983, The A-type stars: problems and perspectives, NASA SP-463
- Stateva et al. [2012] Stateva, I., Iliev I. Kh.,Budaj, J., 2012, MNRAS, 420, 1207.
- Floquet [1975] Floquet M.,1975, A&AS, 21, 25.
- [26] Uytterhoeven, K., et al., 2011, A&A, 534, A125.
- Koch et al. [2010] Koch, D. G. et al., 2010, ApJ, 713, 79.
- Still & Barclay [2012] Still M., Barclay T., 2012, ascl.soft, 8004.
- Reegen [2007] Reegen P., 2007, A&A, 467, 1353.
- Breger et al. [2011] Breger M., et al., 2011, MNRAS, 414, 1721.
-
Balona et al. [2015]
Balona L.A., Catanzaro G., Abedigamba O.P.,Ripepi V., Smalley B., 2015,
MNRAS 448, 1378. - Hubeny, Lanz & Jeffery [1994] Hubeny I., Lanz T., Jeffery C.S., 1994, in Jeffery C.S., eds, Newsletter on Analysis of Astronomical Spectra, No.20, CCP7 St. Andrews Univ., St. Andrews, p.30.
- Kurucz [1996] Kurucz R.L., 1996, IAU Symp.176: Stellar surface structure, 176, 523.
- Soubiran et al. [2013] Soubiran C., Jasniewicz G., Chemin L., Crifo F., Udry S., Hestroffer D.,Katz D., 2013, A&A 552, 64.
- Famaey [2005] Famaey B., Jorissen A., Luri X., Mayor M., Udry S.; Dejonghe H., Turon C., 2005, A&A 430, 165
- Catanzaro, G. and Ripepi, V. [2014] Catanzaro, G. and Ripepi, V., 2014, MNRAS 441, 1669–1680.
- Niemczura et al. [2015] Niemczura, E. et al., 2015 MNRAS 450, 2764–2783.
- Iglesias-Marzoa et al. [2015] Iglesias-Marzoa, R., López-Morales, M., Arévalo-Morales, M.J.,The rvfit Code: A Detailed Adaptive Simulated Annealing Code for Fitting Binaries and Exoplanets Radial Velocities, PASP, 127, 567.