The anomalously low (sub)millimeter spectral indices of some protoplanetary disks may be explained by dust self-scattering
Abstract
Previous (sub)millimeter observations have found that the spectral indices of dust emission from some young stellar objects are lower than that of the black body emission in the Rayleigh-Jeans limit (i.e., 2.0). In particular, the recent Atacama Large Millimeter Array observations have spatially resolved that the innermost regions of the protoplanetary disks TW Hya and HD 163296 present anomalously low (i.e., 2.0) millimeter spectral indices. In some previous works, such anomalously low millimeter spectral indices were considered unphysical and were attributed to measurement errors. The present work clarifies that if the albedo is high and is increasing with frequency, it is possible to reproduce such anomalously low spectral indices when the emission source is optically thick. In addition, to yield lower than 2.0 spectral index at (sub)millimeter bands, the required dust maximum grain size is on the order of 10-100 µm, which is well-consistent with the previously derived values based on multi-wavelength dust polarimetric observations. In light of this, measuring Stokes I spectral index may also serve as an auxiliary approach for assessing whether the observed dust polarization is mainly due to dust scattering or is due to the aligned dust grains.
1 Introduction
To approximate interstellar dust emission, the so called modified black body formulation has been widely applied (for a review see Hildebrand 1983)
where is the observed flux at frequency , is the solid angle of the emission region, is the Planck function at dust temperature and frequency , and is the optical depth of dust. The dust optical depth is further expressed as the product of the dust mass absorption opacity () and dust mass surface density (). Since dust grains cannot emit or absorb efficiently at wavelengths which are much longer than their size, at (sub)millimeter bands, is proportional to , where is known as the dust opacity spectral index. The value of is 2 in the diffuse interstellar medium (ISM) around the solar neighborhood. With the presence of dust that has grown larger, the value of can become as low as 0.0. In the Rayleigh-Jeans limit, the observed (sub)millimeter spectral index () is related to by .
Some previous (sub)millimeter observations of protoplanetary disks have reported 2.5. By assuming that the dust scattering opacity () is negligible, they argued that 0.5 and suggested that millimeter-sized dust grains may already present in those disks (e.g., Beckwith & Sargent, 1991; Carrasco-González et al., 2016, and references therein). However, lately some observations reported anomalously low (sub)millimeter spectral indices (2.0), which are inconsistent with the aforementioned formulation of interstellar dust emission (e.g., Class 0/I objects: Jørgensen et al. 2007; Miotello et al. 2014; Li et al. 2017; Liu et al. 2018b; Agurto-Gangas et al. 2019; protoplanetary disks: Tsukagoshi et al. 2016; Liu et al. 2017; Huang et al. 2018; Dent et al. 2019). Due to the significant numbers of such reports, some of which were carried out by teams which possess authority on the technical ground (e.g., Dent et al., 2019), it is hard to attribute all of them to data calibration errors or imaging artifacts. Another related paradox is that recent, multi-wavelength polarimetric observations of dust scattering (for more details of this mechanism see Kataoka et al., 2015; Yang et al., 2017) mostly concluded that the maximum grain sizes are 50-150 m, and are not yet fully reconciled with those earlier suggestions of millimeter-sized grains based on analyzing spectral indices (see Kataoka et al., 2016a, b; Stephens et al., 2017; Bacciotti et al., 2018; Hull et al., 2018).
Based on radiative transfer models, Li et al. (2017) and Galván-Madrid et al. (2018) have argued that when dust grains are small (1 mm), the anomalously low values can be explained by the presence of foreground obscured hot dust. Otherwise, low values of may be explained by a component of free-free emission (e.g. Liu et al., 2017). Li et al. (2017) and Galván-Madrid et al. (2018) found that applying foreground obscured hot dust better explains the (sub)millimeter spectral energy distributions (SEDs) of some Class 0/I young stellar objects (YSOs) observed on 100-1000 AU scales.
Our present understanding, however, is that dust in Class II protoplanetary disks is predominantly heated by protostellar irradiation. Therefore, dust around the disk surface is likely hotter than that at the disk midplane. If this is indeed the case, then the explanation of foreground obscured hot dust cannot be applied to the Class II protoplanetary disks which are observed in face-on projection. On the other hand, time monitoring observations (e.g., Galván-Madrid et al., 2014; Liu et al., 2014) have shown that the free-free and/or synchrotron emission from Class II protoplanetary disks are rarely bright enough to be able to confuse the measurements of dust emission at (sub)millimeter bands. In light of these, it is particularly puzzling that the low values of ( 2.0) have been spatially resolved in the inner 10 AU radii of the approximately face-on, low-luminosity protoplanetary disk TW Hya (initially reported by Tsukagoshi et al. 2016, and was reproduced by Huang et al. 2018 with independent measurements), and from HD 163296 (Dent et al., 2019).
Based on simplified radiative transfer models, the work presented here argues that if we take scattering opacity into consideration, it is possible to reproduce the anomalously low values at (sub)millimeter bands from an isothermal, high optical depth dust emission source with 0.1 mm. The analysis will be compared specifically to Atacama Large Millimeter Array (ALMA) observations of the Class II protoplanetary disk, TW Hya (60 pc; Gaia Collaboration et al., 2016, 2018). Thanks to its approximately face-on projection (for more information of this target source see Qi et al., 2004; Andrews et al., 2016, and references therein), it may be sufficient to consider the analytic solution of radiative transfer equation for a thin slab, without requiring full three-dimensional Monte Carlo radiative transfer modeling. Therefore, the analysis can be based on fewer free parameters and the results would remain robust and comprehensive. In addition, there is less concern about the confusion of free-free emission thanks to the low bolometric luminosity and low protostellar mass of TW Hya.
The observational data used in this work are briefly introduced in Section 2.1 while more details are given in Appendix A. The analysis of the SEDs is provided in Section 2.2. Section 3 discusses the general implication of this work to other observational case studies, while our conclusion is nearly identical to the Abstract.
 |
 |
 |
2 Data Analysis
2.1 Millimeter spectral index from TW Hya
The ALMA Band 4 (145 GHz) and Band 6 (233 GHz) data taken from project 2015.A.00005.S (PI: Takashi Tsukagoshi), and the ALMA Band 6 data taken from project 2013.1.00114.S (PI: Karin Öberg)111Note that Tsukagoshi et al. (2016) referred to project 2012.1.00422.S instead of 2013.1.00114.S, which was likely a typo since 2012.1.00422.S did not carry out Band 6 observations. were used for the present work. These two bands are ideal for the present science purpose due to the sufficiently high dust optical depths, and and because both weavelengths can be approximated by the Rayleigh-Jeans limit. That the SED analysis could become degenerate when mixing non-Reyleigh-Jeans and Rayleigh-Jeans components is a concern. More details about how the data calibration was reproduced are given in Appendix A.
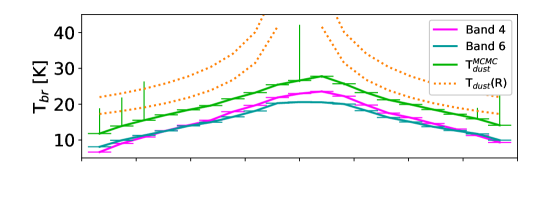
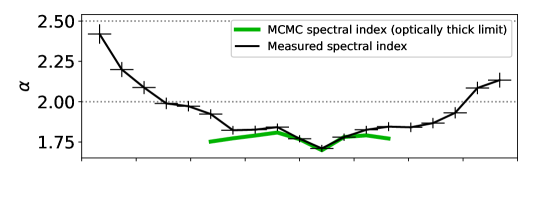
Top and middle panels of Figure 1 present the dust brightness temperature and spectral index () taken from a thin slice along the major axis (P.A.=155∘, see Qi et al. 2004; Andrews et al. 2012) of TW Hya. The peak value detected in this work is lower than that in Tsukagoshi et al. (2016), which is likely due to the poorer angular resolution adopted in this work. In addition, this work did not perform azimuthal averaging to avoid smearing the weakly resolved azimuthal asymmetry at the innermost ring (see Figure 1 of Tsukagoshi et al. 2016; an also see Roberge et al. 2005 for a related claim on large spatial scales). Beyond these minor deviations, the results presented in Figure 1 largely agree with what was presented in Tsukagoshi et al. (2016). The anomalously low (i.e., 2.0) values were reproduced in the inner 10 AU radii.
 |
|
|
|
|
|
2.2 Estimating maximum grain sizes based on fitting spectral index
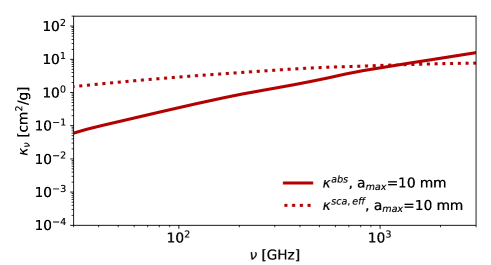
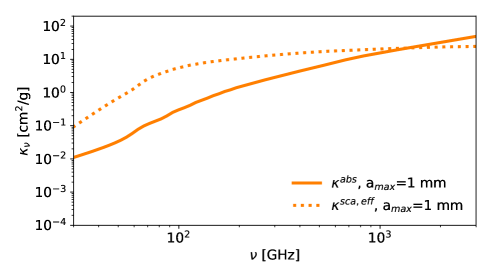
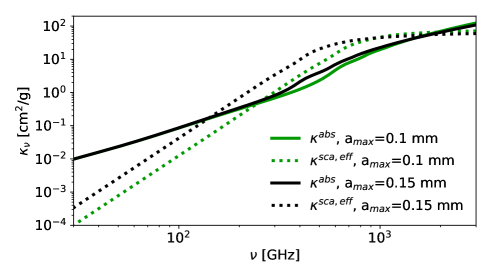
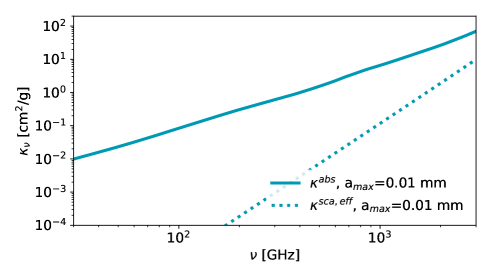
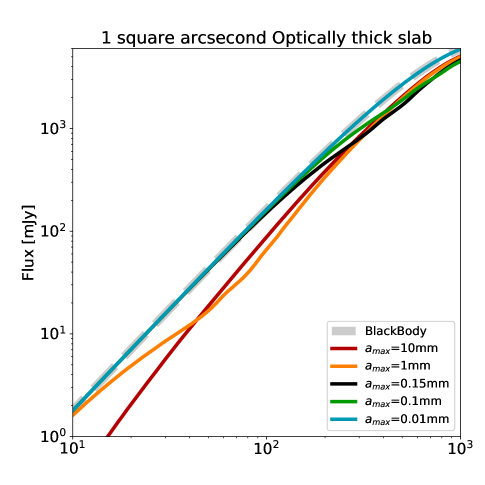
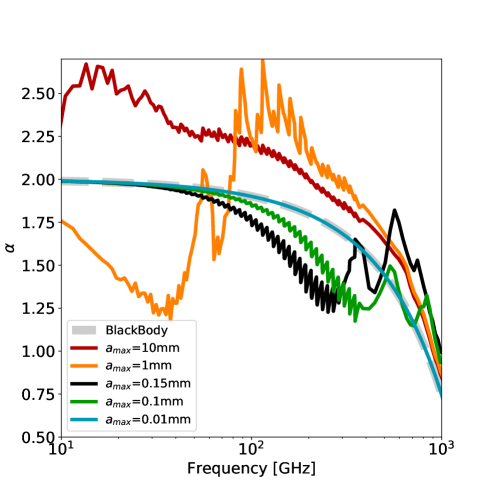
This work adopted the default DSHARP dust optical constants published in Birnstiel et al. (2018), which appears qualitatively similar to what was presented in the independent work of Kataoka et al. (2015). The ice-free dust opacity was not considered in this work since the detected dust brightness temperature is well below the typically assumed sublimation temperature for water ice (100-200 K). The size averaged dust absorption () and effective scattering () opacities were evaluated based on an assumption of spherical compact grains, a power-law grain size distribution with a power-law index 3.5, a minimum grain size 10-4 mm and a maximum grain size , the Mie theory and the Henyey-Greenstein scattering approximation. Figure 2 shows the examples and for =0.01, 0.1, 0.15, 1.0, and 10 mm, respectively. From this figure, we can see that dust scattering is negligible when is 0.01 mm. In addition, at long wavelength has steeper slope than . When is close to 0.1 mm, becomes comparable with , and the curve of has an intersection with the curve of at the steep slope tail of (e.g., at 1 mm wavelengths). Therefore, around this intersection, there is a range of wavelength where the albedo is not negligible and is rapidly decreasing with wavelength. This feature moves to centimeter wavelengths when 1 mm. As a consequence of a higher fraction of dust emission scattering off at shorter wavelengths, at wavelengths close to the aforementioned - intersection the of an optically thick isothermal dust slab will increase with wavelength (c.f. Figure 9 of Birnstiel et al. 2018). Figure 3 shows examples of the (sub)millimeter SEDs for various values of , evaluated based on the analytic radiative transfer solution for such optically thick, isothermal (25 K), geometrically thin dust slab in face-on projection, which was introduced in Birnstiel et al. (2018). They are compared with the ordinary black body SED which has =2.0 in the Rayleigh-Jeans limit. Here we can clearly see that when dust scattering is taken into account, and when 0.1 mm, the anomalously low values of 2.0 are reproduced at millimeter wavelengths, manifesting as a flatter SED than that of the ordinary black body. The feature of anomalously low shifts to centimeter wavelengths when 1 mm.
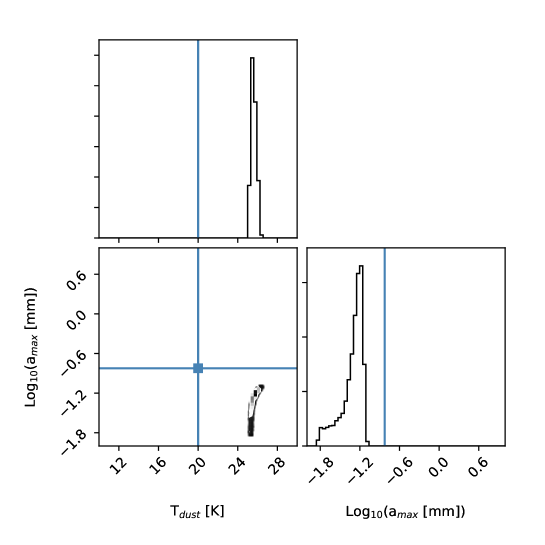
Markov chain Monte Carlo (MCMC) fittings to the profiles of TW Hya (Figure 1) were carried out to examine what values are indicated by the optically thick (1), isothermal and face-on thin dust slab model adopted here. In this case, MCMC is easier to implement than other fitting methods since every iteration of fittings needs to re-evaluate dust opacities based on the advanced value. The MCMC fittings were initialized with 100 walkers at the mean initial positions of [20 K, 0.1 mm]. The walkers were iterated with 500 steps assuming flat priors; in the end, the results from the first 100 steps were discarded. These fittings achieved good convergence in the offset range of [-10, 10] AU except at the central location (i.e., offset0 AU). Figure 4 shows the corner plot produced from the MCMC fittings at the 4.1 AU offset as an example of the convergence. The derived profiles of and from the MCMC fittings are presented in the top and bottom panels of Figure 1; the inferred values from the MCMC fittings are presented in the middle panel of Figure 1 but only for the offset range where the fittings converged well. Following Tsukagoshi et al. (2016), the top panel of Figure 1 also presents the =22 [K](R/10 [AU])-0.4 and 28 [K](R/10 [AU])-0.4 midplane dust temperature profile models suggested from Andrews et al. (2012, 2016), where denotes the radius. Note that the evaluation of these models did not consider dust scattering with the potentially radially varying .
Results from the MCMC fittings show radially decreasing , which is everywhere higher than the observed at Bands 4 and 6 but yet appear reasonable. Values of the derived radially decrease from 100 m to 20 m.
The dominant errors of the derived and are systematic, which were induced by the uncertainties of and . They depend on the dust composition and the exact form of grain size distribution (e.g. Sierra et al., 2017; Soon et al., 2017), which are beyond the scope of the present work and are not quantitatively assessed. In addition, the MCMC fittings have poor convergence outside of the offset range of [-10, 10] AU and at the central location. These poor convergences can be understood, since outside of the offset range of [-10, 10] AU, the observed is becoming higher than 2.0, and that the optically thick assumption may not be valid at Band 4 (also see Figure 3 of Tsukagoshi et al. 2016). In addition, TW Hya presents a low density cavity around the central location (Figure 6; see also Andrews et al. 2016). The measured at the central location at 0′′.085 resolution was, therefore, subject to significant beam dilution. This led to degenerate fitting results of MCMC, which nevertheless reflect that the actual should be higher than the beam diluted measurements.
Why can the application of the geometrically thin dust slab solution of Birnstiel et al. (2018) be self-consistently a good approximation? Does scattering of the warm dust emission from the central part of the disk in turn steepen the spectral index? We argue that the geometrically thin dust slab solution is indeed a good approximation for the case of TW Hya since the derived temperature variations in the region of our interests (e.g., 0-10 AU radii) is not large. This is partly because TW Hya does not have a hot inner disk which is luminous at (sub)millimeter bands. Instead, the (sub)millimeter images of TW Hya present an inner cavity. When the observed temperature variations and temperature gradients are not huge, and when the disk is geometrically thin, it is possible break down the global radiative transfer solution to a quasi-local problem. In the case of a small temperature gradient, we can consider the temperature of the thin slab to be locally uniform. The adjacent disk components which are emitting at very different temperatures would have rather large spatial separations from the local component of interest, will see the local component at an asymptotically small solid angle, and hence cannot contribute to significant scattered light flux.
To verify these arguments, we have carried out simple three dimensional radiative transfer simulations using the RADMC-3D code222http://www.ita.uni-heidelberg.de/ dullemond/software/radmc-3d/, and compared the results from simulations with and without switching on dust scattering. In our RADMC-3D models, the radial gas column density () profile was assumed to be
| (1) |
where is the projected radius on the disk midplane. The gas volume density () was estimated based on
| (2) |
where is the vertical offset from the disk midplane, and is the characteristic disk scale height which we assumed as
| (3) |
We truncated the column density profile interior to the 1 AU radius to mimic the presence of a inner cavity in TW Hya; our simulation covered a up to 20 AU radius. We assumed a constant 0.01 dust-to-gas mass ratio, and assumed a constant 0.1 mm. Our dust density model is therefore a geometrically thin disk with modestly small flaring, which is very optically thick in the inner 110 AU region and becomes optically thinner at outer radii. Examining the geometrically thin assumption requires intensive simulations of dust grain growth and dust vertical settling, which is by itself a developing research field and is well beyond the scope of the present paper. We assumed the dust temperature to be
| (4) |
where is the azimuthal angle. Our simulations assumed similar temperature gradients to what was actually observed from TW Hya but a higher absolute temperature scale. This was because our main purpose is to test whether or not including dust scattering can indeed lead to the anomalously low values. Using higher dust temperatures can avoid producing low values due to non-Rayleigh-Jeans effects. In addition, instead of evaluating dust temperature based on radiative transfer, we used the assumed radial temperature profile. Physically, this was because on the spatial scales of our interests, how dust can be heated due to viscous dissipation is not yet certain. In addition, to simulate anisotropic dust scattering in the optically very thick limit, we need to use full three-dimensional grids with rather small grid sizes, which makes the precise temperature evaluation computationally expensive and unfeasible for us. On the other hand, we do not want the simulations with and without dust scattering to converge to different temperature profiles, which will in turn confuse the discussion about the effects of dust scattering on .
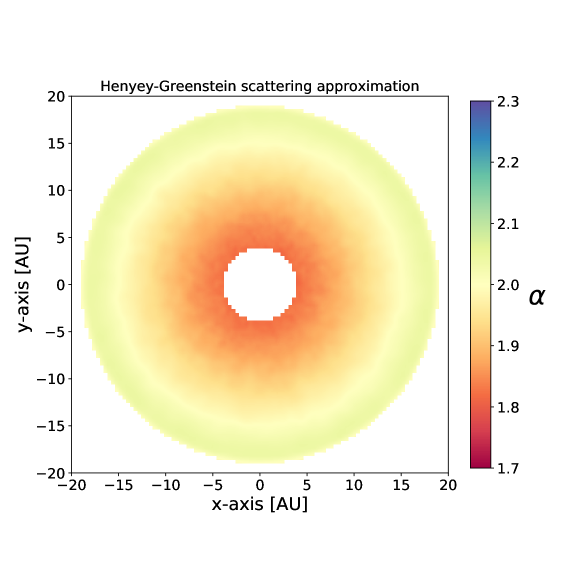
The spatial grids of our simulations were defined in spherical coordinates with uniform intervals of polar angle, azimuthal angle, and logged radius. Using the RADMC-3D code, we derived the pole-on view of the disk at 232.990 GHz and 144.988 GHz. The simulated images have some numerical errors inward of the 3 AU radius due to the very rapid changes of dust volume density with the radius and polar angle, which can lead to 0.02 errors of the derived spectral indices. Therefore, we masked the inner 3.2 AU radius in the simulated images. Figure 5 shows the derived distributions from these simulations in the cases with and without switching on scattering. Indeed, in the case without switching on scattering, converges to 2.0 in the innermost, high optical depth region; when scattering was switched on, can converge to values lower than 2.0, which supports our arguments about the appropriateness of applying the analytic thin slab solution.
3 Discussion

|
|
Tsukagoshi et al. (2016) reported that has a value 3.7 at the 22 AU gap where the dust emission is relatively optically thin. This result is consistent with 0.1 mm (see Figure 4 of Birnstiel et al., 2018), and can be reconciled with the derived by the present work at smaller radii without requiring a rapid spatial variation of . Tsukagoshi et al. (2016) suggested a shortage of millimeter size grains in the 22 AU gap. With the present work, it is also not clear where the millimeter size grains are presented inwards of the 22 AU gap. Physically, even in the case that grown dust can efficiently form in regions inwards of the 22 AU gap, whether or not we can detect the dust that has grown to these with the presented observations remain questionable. For example, the simulations of Vorobyov et al. (2018) have shown that under certain physical conditions, dust that has grown to larger sizes can have rapid radial migration and can be trapped in regions which have too-small areas to be probed by observations. The observations may also preferentially detect small dust grains at the scattering surface, due to the vertical settling of large dust grains (e.g., Yang et al., 2017; Hull et al., 2018; Dent et al., 2019).
The values derived in the present work (Figure 1) have no tension with those derived from the previous (sub)millimeter polarimetric observations (50-150 m; Kataoka et al., 2016a, b; Hull et al., 2018). In this sense, the presented values and dust polarization in HD 163296 (Dent et al., 2019) may be independent indicators of 10-100 m maximum grain sizes. In fact, resolving at multiple wavelengths may serve as a cheap (in terms of observing time) auxiliary method to help assess whether or not the observed dust linear polarization at a specific wavelength is dominated by dust scattering.
On the other hand, assuming that is still smaller in Class 0/I YSOs than in Class II protoplanetary disks, the previously observed dust linear polarization from Class 0/I YSOs may be preferably explained by aligned dust grains, which was supported by the highly consistent polarization percentages and position angles over broad ranges of wavelengths (e.g., Liu et al., 2016; Alves et al., 2018; Liu et al., 2018a; Sadavoy et al., 2018). The hypothesis of small values was also independently supported by astrochemical studies (Harada et al., 2017).
Finally, we note that when albedo is high, the observed dust brightness temperature can be considerably lower than the actual (or expected) dust temperature even when the dust optical depth is much higher than 1 (Birnstiel et al., 2018). When fitting the millimeter SED with a program that does not take scattering opacity into account, the fittings may be driven to conclude optically thin dust with significant grain growth, which can, in turn, lead to an underestimate of the total mass of solids.
References
- Agurto-Gangas et al. (2019) Agurto-Gangas, C., Pineda, J. E., Szucs, L., et al. 2019, arXiv e-prints, arXiv:1901.05021 [astro-ph.SR]
- Alves et al. (2018) Alves, F. O., Girart, J. M., Padovani, M., et al. 2018, A&A, 616, A56
- Andrews et al. (2012) Andrews, S. M., Wilner, D. J., Hughes, A. M., et al. 2012, ApJ, 744, 162
- Andrews et al. (2016) Andrews, S. M., Wilner, D. J., Zhu, Z., et al. 2016, ApJ, 820, L40
- Bacciotti et al. (2018) Bacciotti, F., Girart, J. M., Padovani, M., et al. 2018, ApJ, 865, L12
- Beckwith & Sargent (1991) Beckwith, S. V. W., & Sargent, A. I. 1991, ApJ, 381, 250
- Birnstiel et al. (2018) Birnstiel, T., Dullemond, C. P., Zhu, Z., et al. 2018, ApJ, 869, L45
- Carrasco-González et al. (2016) Carrasco-González, C., Henning, T., Chandler, C. J., et al. 2016, ApJ, 821, L16
- Dent et al. (2019) Dent, W. R. F., Pinte, C., Cortes, P. C., et al. 2019, MNRAS, 482, L29
- Foreman-Mackey et al. (2013) Foreman-Mackey, D., Hogg, D. W., Lang, D., & Goodman, J. 2013, PASP, 125, 306
- Gaia Collaboration et al. (2016) Gaia Collaboration, Brown, A. G. A., Vallenari, A., et al. 2016, A&A, 595, A2
- Gaia Collaboration et al. (2018) —. 2018, A&A, 616, A1
- Galván-Madrid et al. (2014) Galván-Madrid, R., Liu, H. B., Manara, C. F., et al. 2014, A&A, 570, L9
- Galván-Madrid et al. (2018) Galván-Madrid, R., Liu, H. B., Izquierdo, A. F., et al. 2018, ApJ, 868, 39
- Harada et al. (2017) Harada, N., Hasegawa, Y., Aikawa, Y., et al. 2017, ApJ, 837, 78
- Hildebrand (1983) Hildebrand, R. H. 1983, QJRAS, 24, 267
- Huang et al. (2018) Huang, J., Andrews, S. M., Cleeves, L. I., et al. 2018, ApJ, 852, 122
- Hull et al. (2018) Hull, C. L. H., Yang, H., Li, Z.-Y., et al. 2018, ApJ, 860, 82
- Jørgensen et al. (2007) Jørgensen, J. K., Bourke, T. L., Myers, P. C., et al. 2007, ApJ, 659, 479
- Kataoka et al. (2016a) Kataoka, A., Muto, T., Momose, M., Tsukagoshi, T., & Dullemond, C. P. 2016a, ApJ, 820, 54
- Kataoka et al. (2015) Kataoka, A., Muto, T., Momose, M., et al. 2015, ApJ, 809, 78
- Kataoka et al. (2016b) Kataoka, A., Tsukagoshi, T., Momose, M., et al. 2016b, ApJ, 831, L12
- Li et al. (2017) Li, J. I., Liu, H. B., Hasegawa, Y., & Hirano, N. 2017, ApJ, 840, 72
- Liu et al. (2018a) Liu, H. B., Hasegawa, Y., Ching, T.-C., et al. 2018a, A&A, 617, A3
- Liu et al. (2014) Liu, H. B., Galván-Madrid, R., Forbrich, J., et al. 2014, ApJ, 780, 155
- Liu et al. (2016) Liu, H. B., Lai, S.-P., Hasegawa, Y., et al. 2016, ApJ, 821, 41
- Liu et al. (2017) Liu, H. B., Vorobyov, E. I., Dong, R., et al. 2017, A&A, 602, A19
- Liu et al. (2018b) Liu, H. B., Dunham, M. M., Pascucci, I., et al. 2018b, A&A, 612, A54
- McMullin et al. (2007) McMullin, J. P., Waters, B., Schiebel, D., Young, W., & Golap, K. 2007, adass, 376, 127
- Miotello et al. (2014) Miotello, A., Testi, L., Lodato, G., et al. 2014, A&A, 567, A32
- Qi et al. (2004) Qi, C., Ho, P. T. P., Wilner, D. J., et al. 2004, ApJ, 616, L11
- Roberge et al. (2005) Roberge, A., Weinberger, A. J., & Malumuth, E. M. 2005, ApJ, 622, 1171
- Sadavoy et al. (2018) Sadavoy, S. I., Myers, P. C., Stephens, I. W., et al. 2018, ApJ, 869, 115
- Sierra et al. (2017) Sierra, A., Lizano, S., & Barge, P. 2017, ApJ, 850, 115
- Soon et al. (2017) Soon, K.-L., Hanawa, T., Muto, T., Tsukagoshi, T., & Momose, M. 2017, PASJ, 69, 34
- Stephens et al. (2017) Stephens, I. W., Yang, H., Li, Z.-Y., et al. 2017, ApJ, 851, 55
- Tsukagoshi et al. (2016) Tsukagoshi, T., Nomura, H., Muto, T., et al. 2016, ApJ, 829, L35
- Van Der Walt et al. (2011) Van Der Walt, S., Colbert, S. C., & Varoquaux, G. 2011, ArXiv e-prints, arXiv:1102.1523 [cs.MS]
- Vorobyov et al. (2018) Vorobyov, E. I., Akimkin, V., Stoyanovskaya, O., Pavlyuchenkov, Y., & Liu, H. B. 2018, A&A, 614, A98
- Yang et al. (2017) Yang, H., Li, Z.-Y., Looney, L. W., Girart, J. M., & Stephens, I. W. 2017, MNRAS, 472, 373
Appendix A Reproducing ALMA measurements
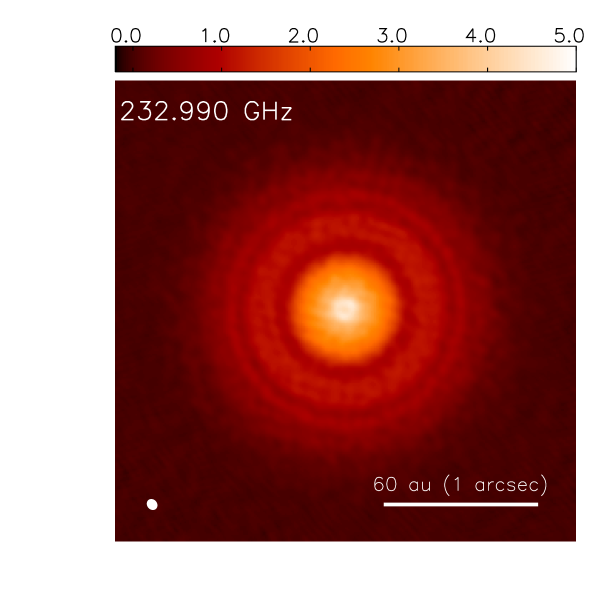
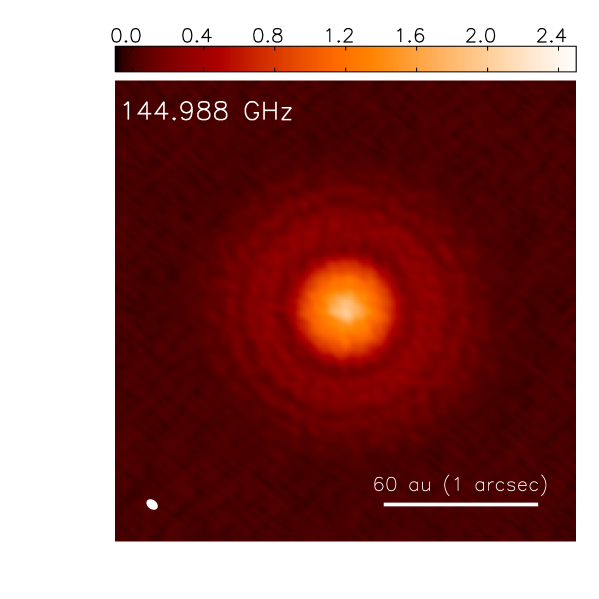
The archival ALMA Band 4 and 6 data were re-calibrated and phase self-calibrated following the strategy outlined in Section 2 of Tsukagoshi et al. (2016), using the CASA software package v5.4.0 (McMullin et al., 2007). The continuum data were derived using the CASA-uvcontsub task. The Band 4 and Band 6 continuum data were imaged separately, using the multi-frequency synthesis (MFS) method. Unlike Tsukagoshi et al. (2016), this work employed nterm=1 in MFS and did not employ multiscale clean, to avoid the systematic flux errors induced by spectral index errors and by non-local imaging artifacts. The Band 6 image achieved a 0′′.0750′′.064 synthesized beam and a 23 Jy beam-1 root-mean-square (RMS) noise level; the Band 4 image achieved a 0′′.0810′′.058 synthesized beam and a 14 Jy beam-1 RMS noise level. The final images achieved are presented in Figure 6. Afterward, these images were smoothed to have 0′′.085 (5.1 AU) circular beams before the analysis in this work.
|
|