Nitrogen Contamination Causes High Field Q-Slope (HFQS)
in Buffered Chemical Polished SRF Cavities
Abstract
Buffered Chemical Polishing (BCP) was the most conventional polishing method for superconducting radio frequency (SRF) Niobium (Nb) cavity surface preparation before the discovery of Electropolishing (EP), which is superior to BCP in high gradient performance. The High Field Q-slope (HFQS) is perfectly eliminated by taking the low temperature bake (LTB) post EP, which guarantees high gradient performance in EP’ed cavities. The mechanism of the HFQS is well understood for EP’ed cavities. On the other hand, there is no common consensus on the HFQS with BCP, since even BCP with LTB does not always resolve the HFQS. BCP is much easier to apply and still an important preparation technology for very complicated SRF structures like low beta cavities. Therefore, overcoming the issue of HFQS with BCP is highly beneficial to the SRF community. This paper mines a large number of available data sets on BCP’ed cavity performance with fine grain, large grain, and even single crystal niobium materials under different experimental settings. We found that all existing explanations for HFQS with BCP are inconsistent with some experimental results, and propounded nitrogen contamination as a new model. We checked that nitrogen contamination agrees with all existing data and nicely explains unresolved phenomena. Combining these evidence, we deduce that nitrogen contamination is the cause of HFQS in BCP.
- PACS numbers
-
29.20.–c, 74.25.–q, 74.25.Nf
pacs:
Valid PACS appear hereI Introduction
HFQS is a phenomenon where Q0 (unloaded Q) performance of the SRF cavity begins to exponentially drop with increasing gradient around 15 - 25 MV/m due to heating at RF high magnetic field region (equator area) on the SRF surface Saito (2003a); Visentin (2005), and it finally limits the acceleration gradient to around 30 MV/m. It happens to all cavities that adopt EP or BCP as surface processing method. HFQS seriously degrades the SRF cavity high gradient performance, thus limiting the final energy of the accelerated particles.
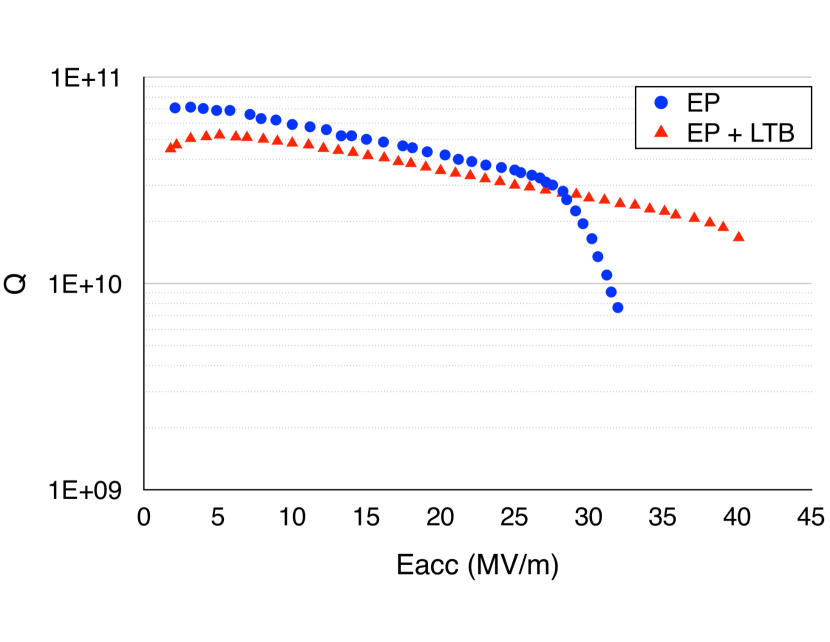
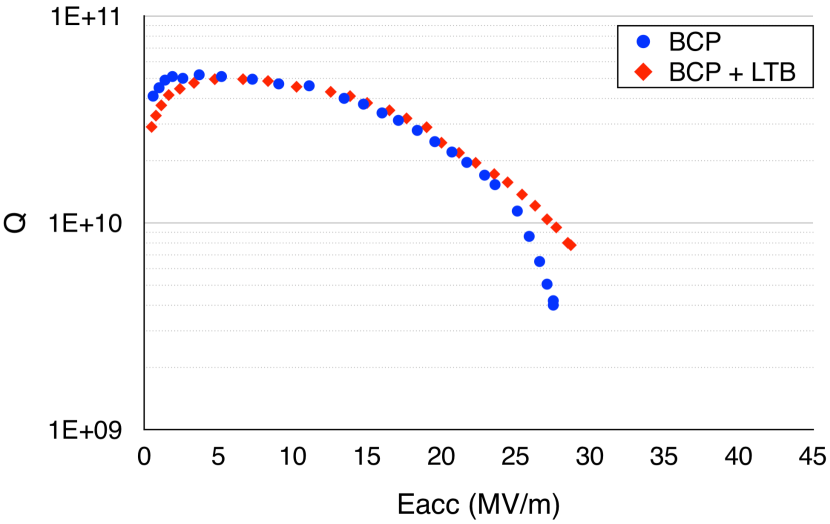
This problem was later neglected after the international linear collider (ILC) chose EP, which was developed in 1985 for KEK TRISTAN 508 MHz 5-cell SRF cavities Saito (1989), as their baseline preparation method, because EP’ed cavities can completely recover from HFQS via 120 bake for 48 hours Saito (2003a). Fig. 1 shows the Q0 vs Eacc (accelerating gradient) of an EP’ed cavity before and after the LTB. However, BCP’ed cavities still suffer from HFQS even after the LTB (see Fig. 2 ).
There is an interesting history behind the LTB for EP’ed cavities. The superiority of EP over BCP with high gradient performance was discovered in 1996 at KEK Saito et al. (1998). They called the high field limitation with BCP’ed cavities as “European headache” (nowadays called HFQS) because only European SRF institutes were using BCP and having this problem.
KEK’s preparation recipe included the LTB post EP. Its purpose was to improve high vacuum quality to evaporate absorbed water on the SRF surface. They did not yet recognize the important role of LTB for the high gradient cavity performance at that time. KEK transferred their EP method to DESY in 1998, but the first EP’ed cavity at DESY still suffered from HFQS. They revisited the KEK recipe and noticed they were missing the baking process. They applied the bake and finally got high gradient cavity performance Lilje et al. (1999). Since then very intensive study started with HFQS in many SRF institutes in the world.
A lot of models for the HFQS exists: thermal feedback Saito and P.Kneisel (1999), Oxygen contamination Saito et al. (1999); Ciovati (2015); Visentin (2005); Safa (2001), field enhancement at grain boundary steps (or macro surface roughness, in this paper we are mostly talking about this roughness) Knobloch et al. (1999), field enhancement induced by surface roughness in the grain (or micro surface roughness) Xu et al. (2012), interface tunneling exchange Halbritter (2003), Hydrogen trapping Romanenko et al. (2011), and flux trapping Benvenuti et al. (1997). A good summary is shown in the reference Padamsee (2009). Among these models, the Oxygen contamination model can sufficiently explain HFQS in the LTB effect with EP’ed cavities Visentin (2005); however, it cannot explain why LTB fails to totally remove the HFQS for BCP’ed cavities. A fully consistent model of HFQS with BCP’ed cavities does not exist even now.
HFQS study with BCP’ed cavities in early 2000’s was for fine grain niobium cavities. Nowadays, many BCP’ed cavity performance information is available for large grain and even single crystal niobium cavities. This paper will mine both the past data with fine grain cavity, as well as studies on large grain and single crystal niobium cavities, in order to develop and prove a new model which can consistently explain the BCP’ed cavity HFQS.
II Data Mining
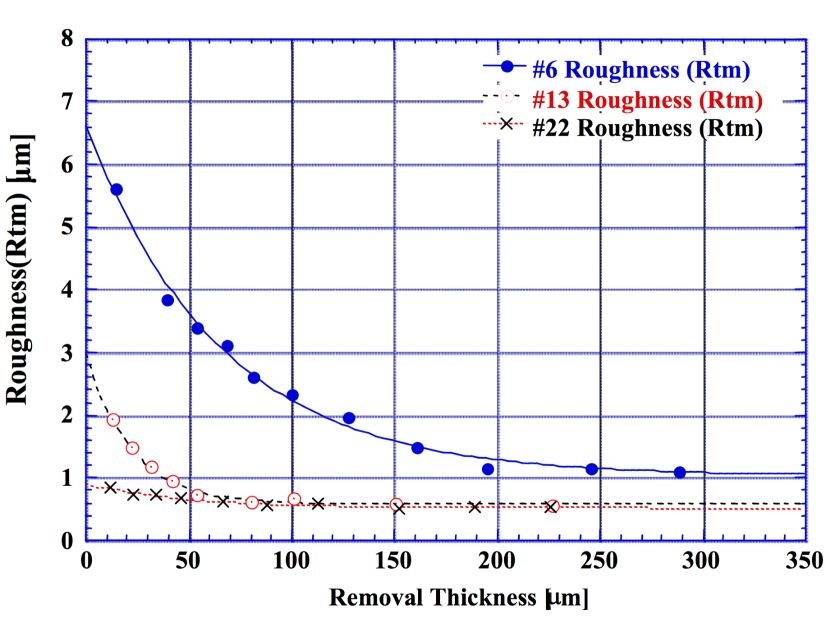
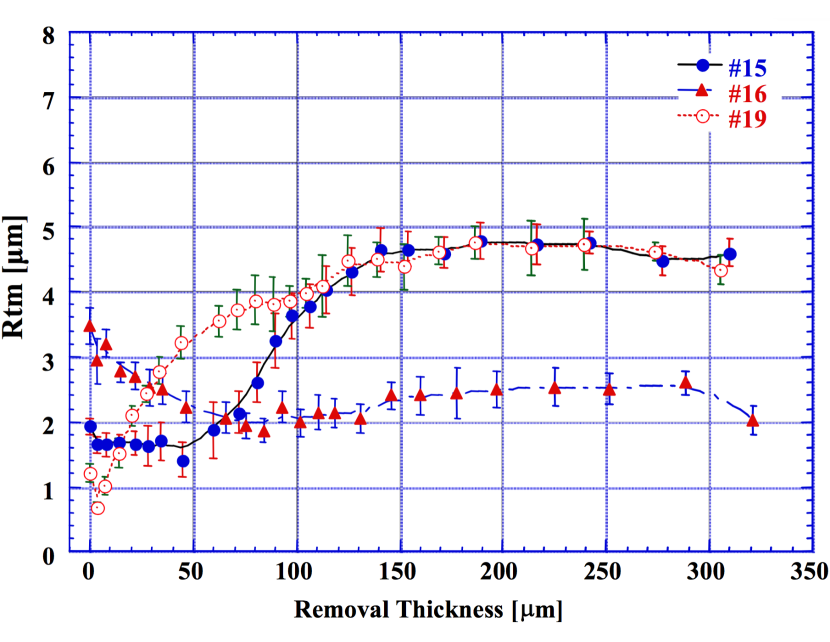
As mentioned above, in the early 2000’s HFQS studies with BCP’ed cavities were mostly for fine grain niobium cavities. Discussion of the results centered around the topography of niobium surface treated by BCP, as a natural consequence the effects of surface roughness (Rtm, height difference between 3rd highest peak to 3rd lowest minimum), grain boundaries, defect and dislocation were the main concerns. Fig. 3 and 4 show the polishing characteristics of EP and BCP respectively Saito (2003b). EP makes the surface smoother exponentially with increased material removal, while BCP makes the surface smooth in the early stage but gradually rougher with increased material removal due to the preferential etching at grain boundary areas, and the roughness saturates around 2 - 5 m depending on grain size of the niobium material. The experiments in early 2000’s established the following facts:
-
1.
BCP’ed cavity HFQS is not sufficiently improved by the LTB, the Q-drop is somehow mitigated but the gradient limit sees little improvement (Fig. 2).
-
2.
Sometimes the Q-drop is eliminated by the LTB but the field limitation still does not change, unlike EP.
-
3.
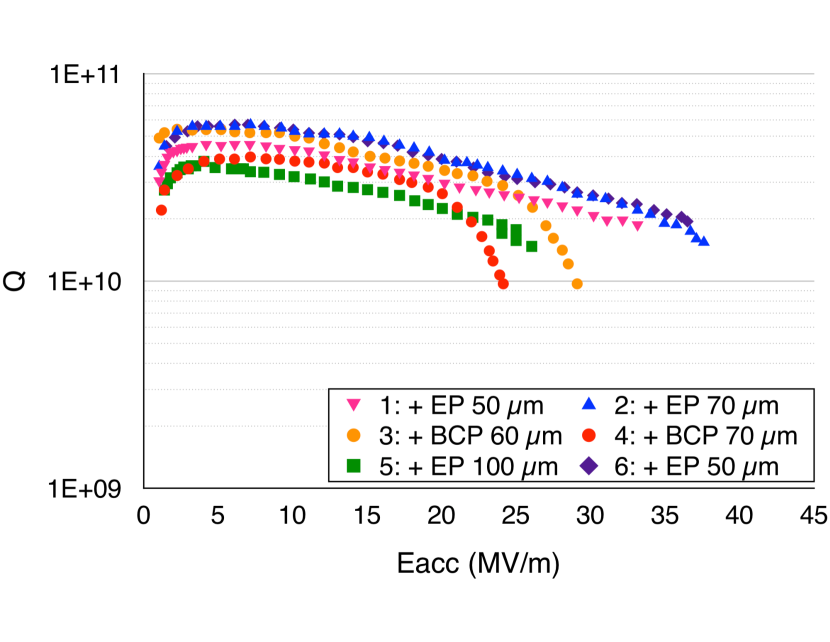
BCP after EP lowers the onset field of the HFQS. Successive BCP makes the HFQS (Fig. 5) worse.
-
4.
The degraded HFQS is perfectly recovered by EP with a rather heavy material removal (150 m, see Fig. 5). The degradation of BCP HFQS might be explained by the RF field enhancement on the rougher surface.
These experimental facts seem to support the field enhanced model on the rough surface Xu et al. (2012) or grain boundary steps Knobloch et al. (1999). However, more detailed analysis does not support these models for BCP HFQS as shown below.
II.1 Reanalysis of multiple BCP post EP with fine grain cavity
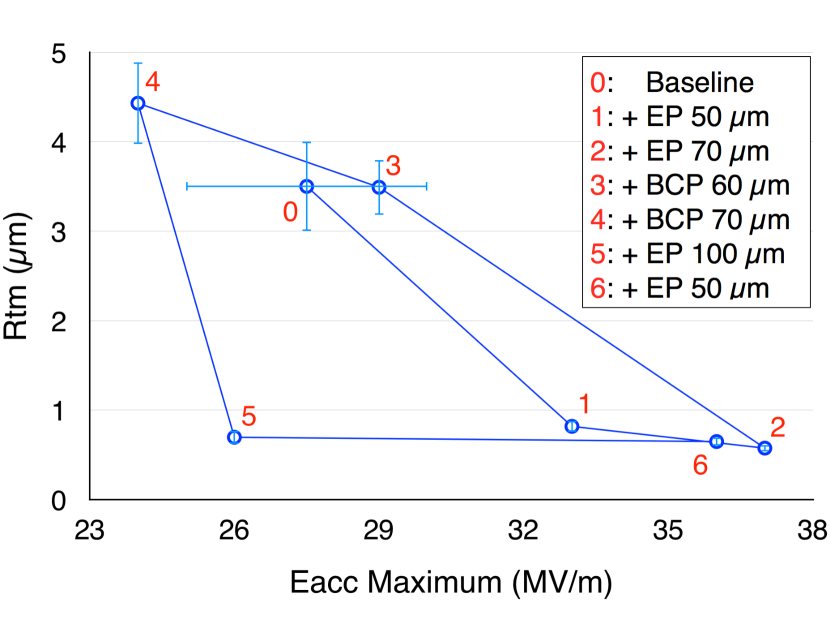
The cavity inner surface roughness in the experiments of Fig. 5 can be estimated from the surface polishing characteristics in Fig. 3 and 4. Table I shows the results. The calculation assumed initial surface roughness is 3.5 m. Fig. 6 also shows the surface roughness vs. the limiting field in the experiment. It has a hysteresis: the EP 100 m at step 5 should improve the roughness to less than 1 m for most assumption of the initial roughness, which is enough to reach a high gradient 30 MV/m but in reality the gradient is still limited 30 MV/m.
It is very clear that from step 4 to 5, the roughness improves a lot by EP, while the maximum field does not; from step 5 to 6, the roughness doesn’t change much while the maximum gradient increases from 26 MV/m to about 36 MV/m. This fact suggests there is something in addition to surface roughness that is causing BCP’ed cavity HQFS.
Getting a little ahead, the improvement from step 5 to step 6 can be explained if the cause of HFQS is nitrogen contamination by the nitric acid in the BCP acid, as will be shown later in detail. The contamination was accumulating (especially through grain boundaries) during multiple BCP, and 100 m EP in step 5 is not enough to remove them all.
| Process | Rtm (m) | Uncertainty (m) |
|---|---|---|
| Baseline | 3.50 | 0.50 |
| + EP 50 m + baking | 0.82 | 0.06 |
| + EP 70 m + baking | 0.57 | 0.04 |
| + BCP 60 m + baking | 3.49 | 0.31 |
| + BCP 70 m + baking | 4.43 | 0.46 |
| + EP 100 m + baking | 0.70 | 0.07 |
| + EP 50 m + baking | 0.65 | 0.05 |
II.2 HFQS of BCP’ed large grain cavity
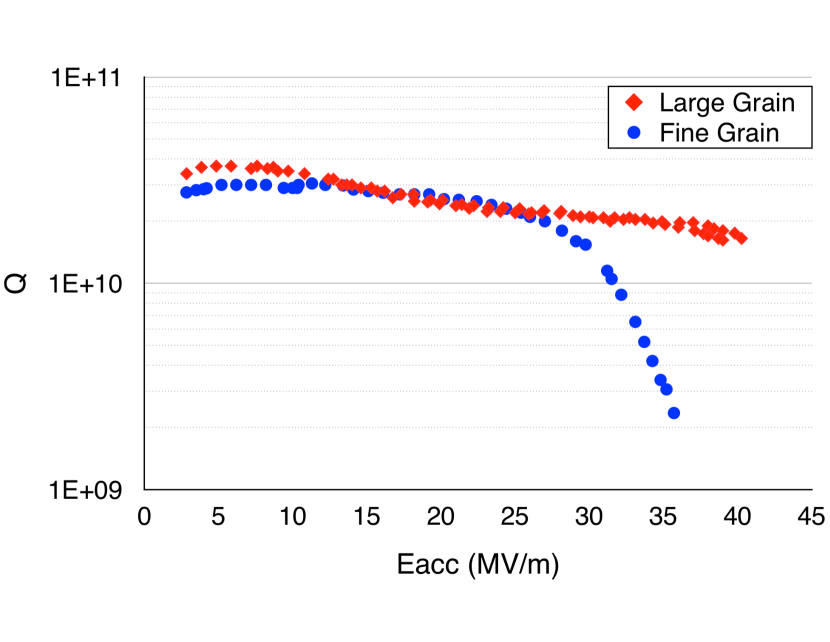
BCP has preferential etching on grain boundary steps. During the BCP process, roughness in the grain is getting lower while the gain boundary step difference is getting larger. The grain size of fine grain cavities is 50 m Padamsee et al. (2008). Surface roughness is usually measured by a needle scanning a 0.8 mm width, so the measured surface roughness with fine grain Nb materials combines topography in the grain and on grain boundary step.
To date large grain sheets are available by directly slicing large grain Nb ingot. The grain size is on several cm scale. The measured BCP finishing surface roughness is 0.1 m, it is very smooth (lower than EP 0.5 m) and even mirror-like. Measurements of large grain surface roughness count the roughness in the grain only, because the grain size is beyond measurement range. Considering the BCP property, the large grain smoothness is mostly due to the fact that there is much less grain boundaries, while the roughness in the grain doesn’t change much.
Fig. 7 shows a comparison of the cavity performance between BCP fine grain and large grain cavities Zong et al. (2009). The onset of BCP HFQS is pushed up to 40 MV/m, higher than that of fine grain cavities. This experiment shows less grain boundary steps give much better performance, or more grain boundary steps give worse performance, thus indicating the grain boundary is responsible for the BCP HQFS. The surface roughness in the grain (micro roughness) is ruled out as a cause of BCP HFQS by this experimental result.
II.3 BCP after EP with large grain cavity
DESY investigated the BCP impact post EP for large grain cavity Singer (2007a). Fig. 8 shows the result. BCP (50 m removal) degrades remarkably the high gradient performance, and is similar to the BCP fine grain cavities.
II.4 Multiple BCP with large grain cavity
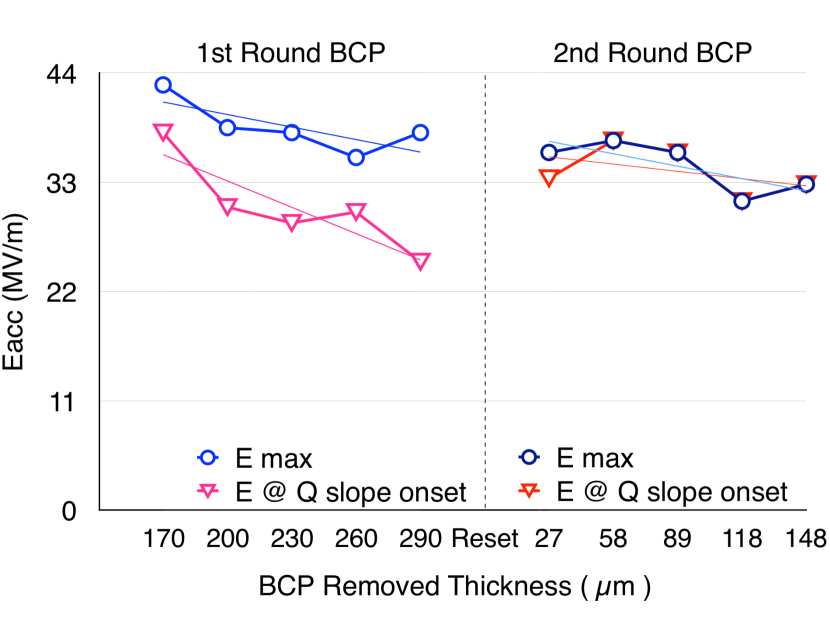
KEK investigated the impact of successive BCP on large grain cavity Furuta (2010). A 1.3 GHz Ichiro shape cavity was mechanically polished inside ( 80m by the centrifugal barrel polishing (CBP)). Note that Ichiro cavity shape has a smaller Bp/Eacc ratio (3.56 mT/[MV/m]) compared to the ILC shape (Bp/Eacc = 4.26 mT/[MV/m]). After 750 for 3 hrs hydrogen degas annealing, a bulk etching of 160 m took place using vertical BCP (V-BCP, conventional BCP in most institutes). The tight loop test took place in total 5 times removing 30 m each time by V-BCP (first cycle). In these test the LTB is applied post V-BCP for all measurement. The result is shown in Fig. 9. The decreasing of Eacc onset of HFQS is observed with increased V-BCP material removal. In the second cycle, the surface topography was reset by CBP, then the tight loop test was repeated by H-BCP. The original experimental goal was to validate that the horizontal BCP (H-BCP) performance is better than normal V-BCP due to more uniform material removal. Again the degradation of onset HFQS happened for each extra 30 m BCP, the average of the Eacc onset of HFQS (red line) increased compare to the 1st cycle (pink line), but Eacc,max average (dark blue line) is lower than the 1st cycle (blue line). The conclusion from these results is that resetting surface roughness doesn’t work to improve the HFQS for Eacc,max, which suggests lowering the (macro) surface roughness doesn’t sufficiently increase the BCP maximum gradient.
Temperature map result for a large grain cavity also shows that there is no preferential heating on the grain boundary area Eremeev and Padamsee (2006), where the high roughness region is mainly located.
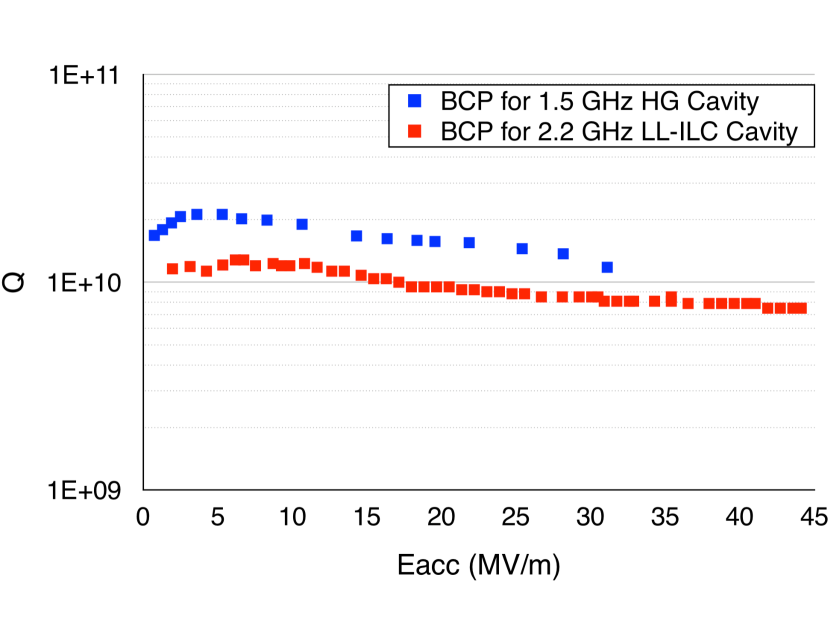
II.5 BCP with single crystal cavity
Single crystal cavity can completely rule out concern of the topographic issue with BCP HFQS, which has no grain boundary and can attain 0.1 m scale very smooth surface even by BCP. To date single crystal niobium sheets are available via directly slicing the ingot with very large grain at 15 - 30 cm scale. Cavities are assembled by electron beam welding (EBW), however it does not produce any grains if the crystal orientation is arranged with the two half cells Saito (2017b). So we can fabricate the entire interior cavity surface with a single crystal. P. Kneisel fabricated a 2.2 GHz single crystal Low Loss-ILC shape cavity cutting out single crystal sheets from the large gain ingot (CBMM material), treated it with BCP plus baking and investigated the performance Kneisel et al. (2005a). The result is shown in Fig. 10 red curve. We found that combining BCP and LTB for single crystal cavity, the HFQS disappeared like normal EP cavities, while the maximum gradient is still limited. The LTB eliminates the HFQS but field gradient still limited 45 MV/m (160 mT) and did not reach the fundamental field limit ( 180 mT) unlike EP’ed cavities. This provides direct evidence to rule out the topography as a major cause of BCP HFQS.
A nearly single crystal 1.5 GHz High Gradient shape cavity shows similar conclusion. This cavity was fabricated with a Nb ingot that has a 20 cm diameter grain in the center and several small grains 1 cm. It is treated with BCP plus LTB , with very smooth surface on most part of the cavity. The field limit is 143 mT as shown in Fig. 10 blue curve.
These evidence shows that BCP cannot reach the fundamental field limit like EP and suggests there is still something else limiting the gradient in BCP.
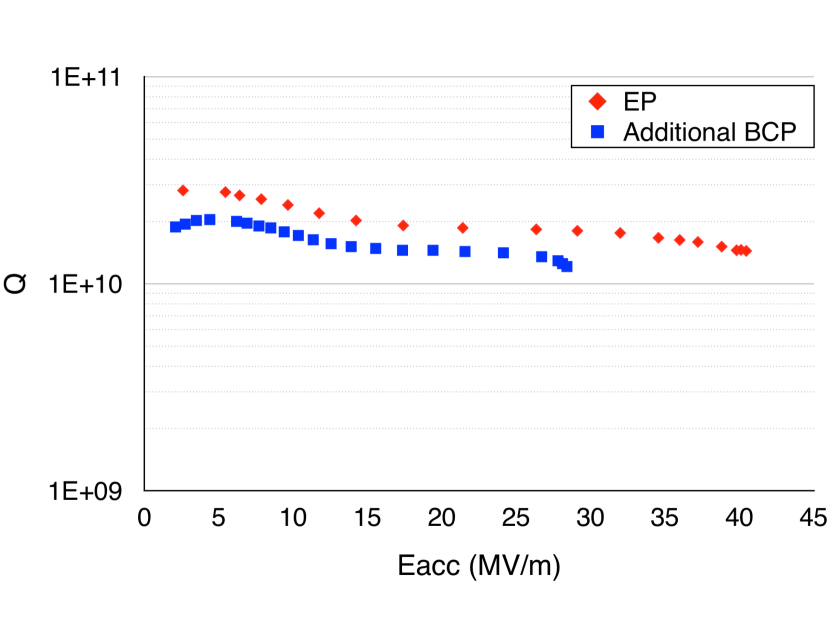
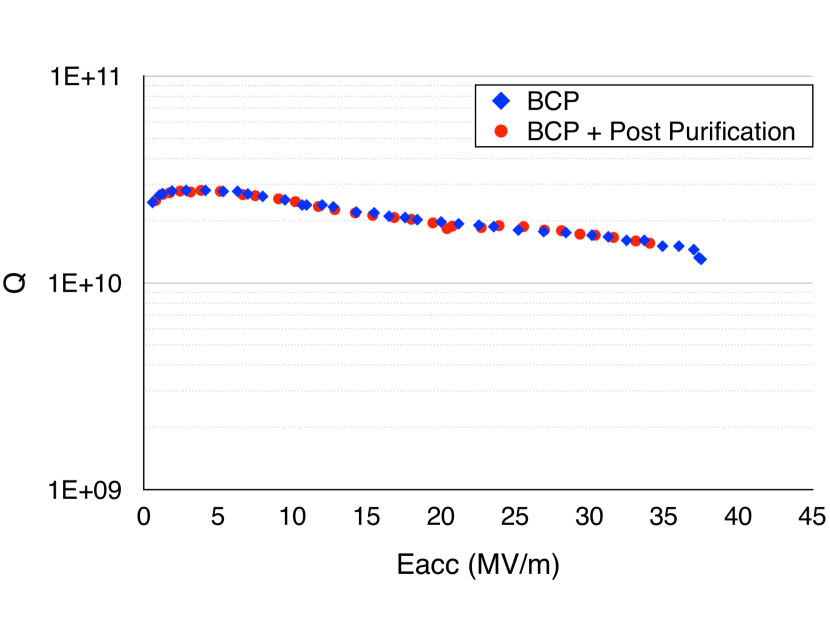
The same experiment took place for 1.3 GHz ILC type single cell cavity fabricated at DESY Singer (2007b). The single crystal sheets were produced by Heraeus. Fig. 11 blue curve shows the result of BCP (112 m and 120 bake for 6 hours). Q curve is very flat up to the gradient limit. The gradient is limited by 37.5 MV/m ( 160 mT) which is close but still below the fundamental limit 180 mT.
One important fact is that this performance is worse than the DESY large grain TESLA shape cavity treated with EP in Fig. 8. This goes against the common understanding: single crystal cavity, even treated with BCP, has very smooth surface and better thermal conductivity, so it should have better performance than large grain cavity. This indicates the surface roughness itself cannot explain all the performance degradation.
Post-purification was also tested for this cavity. The result is shown in Fig. 11 red curve. After the post-purification the cavity was BCP’ed and took 120 bake for 12 hrs. This process does not improve the field limit. The performance failed to improve even with reduced stress or improved dislocation on the SRF surface by post-purification. This also suggests BCP still contains other issues.
III Nitrogen Contamination
By the above data mining, we can conclude that the topographic character of the SRF surface produced by the BCP polishing feature isn’t the only cause of the HFQS with BCP’ed cavities. Therefore, we need to look for other causes.
This paper focuses on finding why BCP can’t get enough improvement as EP from LTB, so we may only focus on the differences between those two methods. As shown in Table II, EP and BCP difference: roughness (discussed before and rule out) and potential contamination (H, O, C, and S for EP; H, O, C, N and P for BCP). F from HF is proved not harmful for cavity performance, and P in phosphoric acid has never been reported to react with Nb. Then the only contamination difference is N and S. S problems were discussed in several papers and solved, therefore N becomes the only potential contamination that causes worse performance in BCP.
| EP | BCP | |
|---|---|---|
| Rz (m) | 0.5 | 2 |
| Grain Boundary | ||
| Prefer Etching | No | Yes |
| Contamination | H, F, O, C, S | H, F, O, C, N, P |
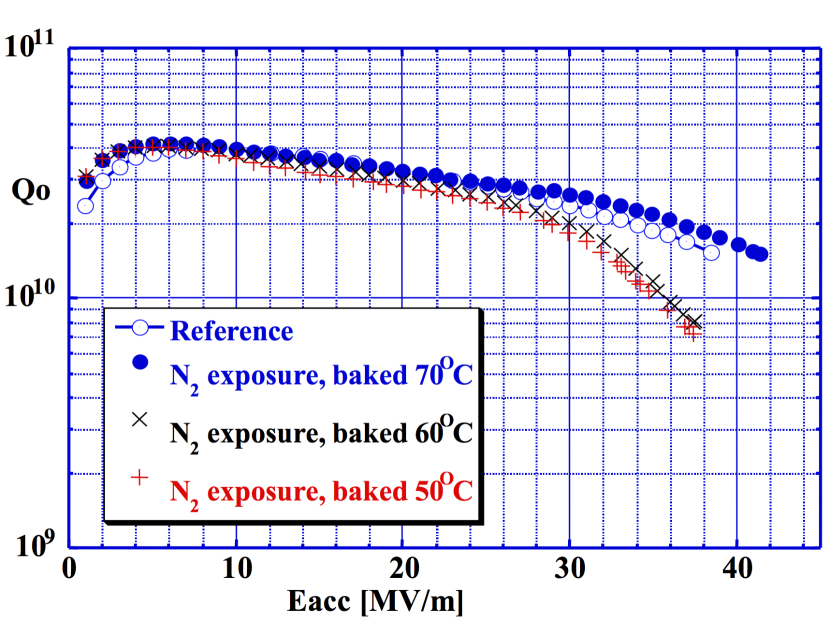
Our first attention to the nitrogen contamination was the gas exposure test on the fresh SRF surface just after vertical test, without vacuum break before the gas exposure Saito (2017c). We found that usually argon gas exposure has no performance degradation but pure nitrogen gas exposure produces a remarkable Q degradation as shown in Fig. 12. In this case, the low temperature (70 ) bake even lower than 120 seems an effective cure. We also notice that a similar experiment shows the opposite result: exposing Nb cavity to nitrogen gas for three days has no degradation observed in their case Kitamura et al. (1999).
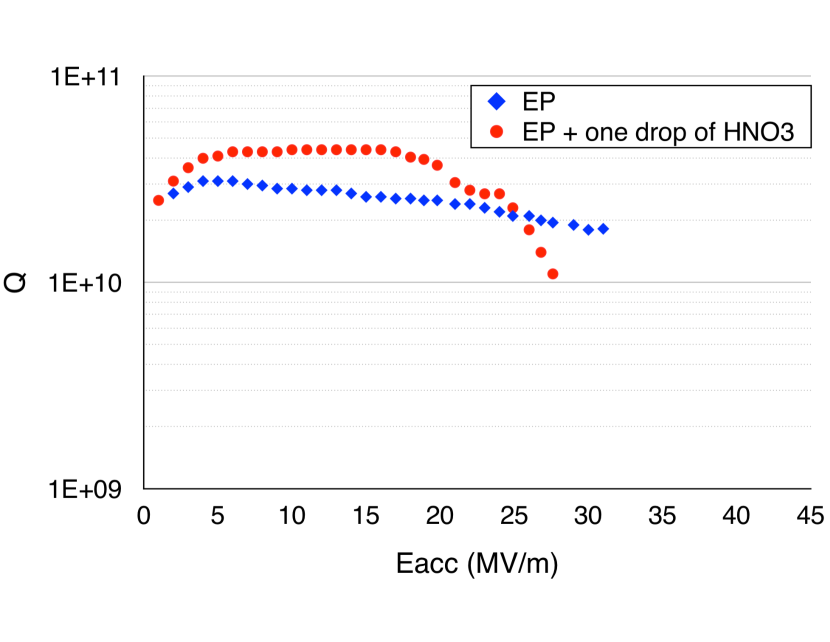
Our hypothesis that nitrogen contamination produces the HFQS is first corroborated by the experimental results summarized in Fig. 13. This experiment was originally done for development of hydrogen-free EP Higuchi (2002). Adding nitric acid of (61% w/w) 1500 ppm into the EP acid (48% HF: 93% H2SO4 = 1: 10 V/V) was very effective to prevent hydrogen doping during EP. However, unlike the normal EP case, the HFQS still exists even after baking. The only difference between these two processes is the small amount of the nitric acid, so that we think the N contamination gives this degrading of the cavity field limit.
The second decisive evidence is in the nitrogen doping study. FNAL has successfully developed the nitrogen doping method to increase Q of SRF Nb cavities Grassellino et al. (2013). They put nitrogen gas into the vacuum furnace at 800 - 900 vacuum annealing to contaminate the surface. They proved that only the interstitial nitrogen in the niobium contributes to enhance the Q because it shortens the mean free path. During the doping process, niobium-nitride metal phase (NbxNy) is also generated on the top surface. This has to be removed by several microns of electropolishing, otherwise remarkable field limit happens. Later, low temperature ( 120) nitrogen infusion was developed Grassellino et al. (2017). The cavities treated with this method have much higher maximum gradient, in the mean time niobium nitride doesn’t exist, this further indicates nitrogen contamination will lower the gradient.
Thirdly, KEK experiment with stepwise BCP and reset (Fig. 9) indicates that, if the HFQS is attributed to N contamination, the CBP before second experiment cycle only resets the roughness, but does not remove all the contamination, or BCP after CBP already produced deeper N contamination, and this explains the degradation of the E max.
Finally, the KEK experiment with multiple EP followed by BCP and then more EP (Fig. 5) also agree with this assumption. After the step 5, 100 m EP removal for Nb is sufficient for recover the roughness to less than 1 m, however, it is not enough to remove the contamination in the deep site, so the maximum gradient is limited to only 26 MV/m.
While after the step 6, even though the roughness does not change much, it removes 50 m more Nb which contains most N contamination. Therefore, the Eacc,max increased a lot, and is close to the original result 37 MV/m.
IV GENERATION OF NITROGEN CONTAMINATION AND OBSERVATION
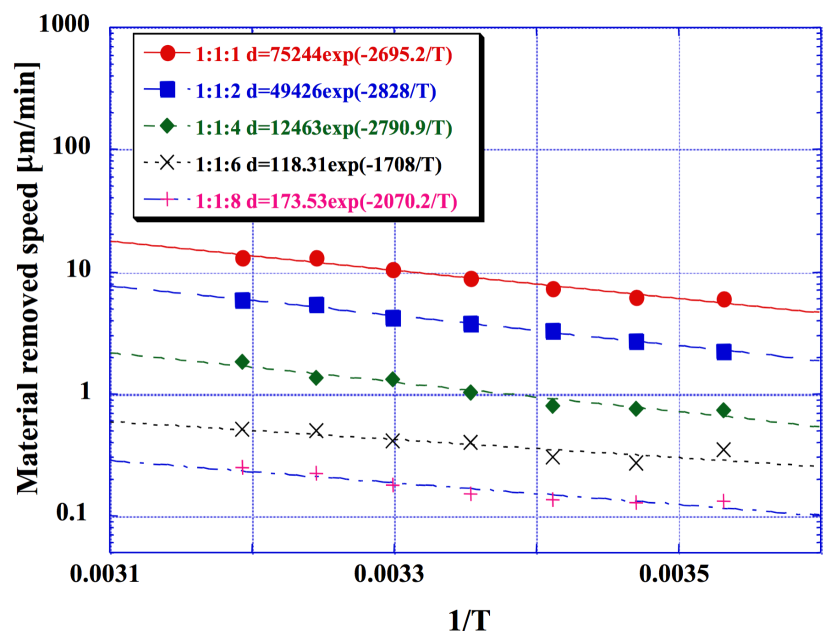
During nitrogen doping, NbxNy starts to generate at temperature 400 (Palczewski et al. (2016), is 673 K, corresponds to 0.058 eV). NbxNy, which has a very low thermal conductivity (1/10 of Nb at low temperature), is harmful for cavity performance, and could be the reason for low Eacc and HFQS. While the low temperature (120 ) infusion doesn’t form NbxNy so this can produce high gradient and high Q cavity performance Grassellino (2017). We can then assume that if NbxNy can be generated on Nb surface on BCP, it can cause HFQS. The reaction energy of BCP is estimated by measuring the temperature dependence of the polishing rate Saito (2017d). The result is shown in Fig. 14. The results are well fit by Arrhenius equation:
| (1) |
The constant value of 2695.2 for the BCP acid composition HF: HNO3: H3PO4 = 1: 1: 1 (V/V) corresponds to 0.232 eV ( 2419 ). NbxNy can form (but with very low probability reaction) by the nitric acid reacting with niobium in such an energy. Actually JLAB has observed nitrogen by SIMS on BCP’ed niobium sample Tuggle et al. (2016). Nitrogen element mostly stays on the surface 0.05 m. On the other hand, FNAL showed that interstitial nitrogen and NbxNy phase lie at different depths on niobium top surface. NbxNy mostly resides on the surface within 2 m Romanenko (2014). These indicate the niobium contamination on Nb top surface by BCP is in NbxNy phase.
V Conclusion
HFQS with BCP’ed cavities is not perfectly removed by the LTB unlike EP’ed cavities. There is no common consensus on the mechanism of the HFQS in BCP’ed cavities to date. We mined past data on fine grain, large grain and single crystal cavities to show inconsistencies in previous explanations, and developed a new model for the root cause of the BCP HFQS. This model says that the nitrogen contamination especially niobium nitride phase (NbxNy) is the root cause of the HFQS BCP’ed cavities. The niobium-nitride phase is generated by reaction between niobium and the nitrogen from the decomposed nitric acid in the BCP reaction. Nitrogen in niobium-nitride phase does not move by the LTB, thus the HFQS is not recovered by the LTB. Not only does the nitrogen contamination model agree with all experimental data sets, it also offers coherent explanations for previously unresolved phenomena in circumstances including: (1) applying multiple BCP post EP (Fig. 5 and Fig. 6); (2) adding HNO3 to EP (Fig. 13); and (3) maximum field of BCP single crystal cavities ( Fig. 10 and Fig. 11) lower than EP large grain cavity ( Fig. 8 ). These results provide very strong evidence to prove that our model is correct.
VI acknowledgement
The authors are grateful to fellow colleagues in the SRF community, especially the KEK SRF group, whose numerous experiments on BCP and EP made our investigation possible, with special thanks to Bernard Visentin (CEA-Saclay), Peter Kneisel (JLAB) and Waldemar Singer (DESY) for allowing the authors to use their figures. We would also like to express our gratitude to Yoshishige Yamazaki (FRIB) and Steven Lund (FRIB) for many fruitful discussions and kind suggestions.
Work supported by the U.S. Department of Energy Office of Science under Cooperative Agreement DE-SC0000661; by the U.S. National Science Foundation under Grant PHY-1102511; by the State of Michigan; and by Michigan State University.
References
- Saito (2003a) K. Saito, in Proceedings of 11th Workshop on RF Superconductivity, THWG1 (Travemünde, 2003).
- Visentin (2005) B. Visentin, in Proceedings of the Workshop on Pushing the Limits of RF Superconductivity (CEA-Saclay, 2005) pp. 94–105.
- Saito (1989) K. Saito, in Proceedings of the Fourth Workshop on RF Superconductivity, srf89g18 (KEK, Tsukuba, Japan, 1989).
- Saito et al. (1998) K. Saito, S. Noguchi, M. Ono, H. Inoue, T. Fujino, E. Kako, and T. Shishido, Part. Accel. 60, 193 (1998).
- Lilje et al. (1999) L. Lilje, D. Reschke, P. Schmuser, D. Bloess, E. Haebel, E. Chiaveri, J. Tessier, H. Safa, and J. Charrier, in KEK PROCEEDINGS (1999) pp. P–025.
- Saito and P.Kneisel (1999) K. Saito and P.Kneisel, in Proceedings of the 1999 Workshop on RF Superconductivity, tup031 (La Fonda Hotel, Santa Fe, New Mexico, USA, 1999).
- Saito et al. (1999) K. Saito, E. Kako, T. Shishido, S. Noguchi, M. Ono, and Y. Yamazaki, in Proceedings of the 1999 Workshop on RF Superconductivity, tup030 (La Fonda Hotel, Santa Fe, New Mexico, USA, 1999).
- Ciovati (2015) G. Ciovati, in Proceedings of the 12th International Workshop on RF Superconductivity, tua03 (Ithaca, New York, USA).
- Safa (2001) H. Safa, in The 10th Workshop on RF Superconductivity, ma008 (Tsukuba, Japan, 2001).
- Knobloch et al. (1999) J. Knobloch, R. L. Geng, M. Liepey, and H. Padamsee, in Proceedings of the 1999 Workshop on RF Superconductivity, tua004 (Santa Fe, New Mexico, USA, 1999).
- Xu et al. (2012) C. Xu, M. J. Kelley, and C. E. Reece, in Proceedings of IPAC2012, WEEPPB011 (New Orleans, Louisiana, USA, 2012).
- Halbritter (2003) J. Halbritter, in Proceedings of the 11th Workshop on RF Superconductivity, mop44 (Lübeck/Travemünder, Germany).
- Romanenko et al. (2011) A. Romanenko, G. Wu, L. D. Cooley, and G. Ciovati, in Proceedings of SRF2011, THPO008 (Chicago, 2011).
- Benvenuti et al. (1997) C. Benvenuti, S. Calatroni, I. Campisi, P. Darriulat, C. Durand, M. Peck, R. Russo, and A.-M. Valente, in Proceedings of the 1997 Workshop on RF Superconductivity, srf97b05 (Abano Terme (Padova), Italy, 1997).
- Padamsee (2009) H. Padamsee, “High-field q-slope and quench field,” in RF Superconductivity: Science, Technology, and Applications (WILEY-VCH Verlag GmbH & Co. KGaA, 2009) Chap. 5, p. 129.
- Saito (2003b) K. Saito, in Proceedings of the 11th Workshop on RF Superconductivity, thp15 (Lübeck/Travemünder, Germany, 2003).
- Saito (2017a) K. Saito, “Ion accelerator technology lecture notes 17 slide 39,” (2017a), clean Technologies for SRF Cavities, Hydrogen Cure, and High gradient.
- Padamsee et al. (2008) H. Padamsee, J. Knobloch, and T. Hays, “Cavity fabrication and preparation,” in RF Superconductivity for Accelerators (WILEY-VCH Verlag GmbH & Co. KGaA, 2008) Chap. 6, p. 108.
- Zong et al. (2009) Z. G. Zong, J. Gao, J. Zhai, Q. J. Xu, L. Liu, L. Zhang, K. Saito, and F. Furuta, in Proceedings of PAC09, TU4PBC03 (Vancouver, BC, Canada, 2009).
- Singer (2007a) W. Singer, in TTC Meeting at FNAL (Chicago, 2007).
- Furuta (2010) F. Furuta, in Proceedings of IPAC’10, WEPE004 (Kyoto, Japan, 2010).
- Eremeev and Padamsee (2006) G. Eremeev and H. Padamsee, in Proceedings of EPAC 2006, MOPCH176 (Edinburgh, Scotland, 2006).
- Saito (2017b) K. Saito, “Ion accelerator technology lecture notes,” (2017b), srf Surface Preparation Technologies.
- Kneisel et al. (2005a) P. Kneisel, G. Myneni, G. Ciovati, J. Sekutowicz, and T. Carneiro, in Proceedings of 2005 Particle Accelerator Conference, TPPT076 (Knoxville, Tennessee, 2005).
- Kneisel et al. (2005b) P. Kneisel, G. Myneni, G. Ciovati, J. Sekutowicz, and T. Carneiro, in Proceedings of the 12th International Workshop on RF Superconductivity, mop09 (Ithaca, New York, USA, 2005).
- Singer (2007b) W. Singer, in TTC Meeting at FNAL (Chicago, 2007).
- Myneni (2007) G. R. Myneni, in TTC Meeting at FNAL (Chicago, 2007).
- Saito (2017c) K. Saito, “Ion accelerator technology lecture notes,” (2017c), performance degradation-free coldmass assembly and advanced cavity fabrication technologies for cost reduction.
- Kitamura et al. (1999) H. Kitamura, Y. Kijima, Y. Murai, K. Saito, E. Kako, T. Shishido, M. Ono, and S. Noguchi, in Proceedings of the 1999 Workshop on RF Superconductivity, tup034 (La Fonda Hotel, Santa Fe, New Mexico, USA, 1999).
- Higuchi (2002) T. Higuchi, DEVELOPMENT OF HYDROGEN-FREE EP AND HYDROGEN ABSORPTION PHENOMENA, Ph.D. thesis, The Graduate University for Advanced Studies (2002).
- Grassellino et al. (2013) A. Grassellino, A. Romanenko, D. Sergatskov, O. Melnychuk, Y. , Trenikhina, A. Crawford, A. Rowe, M. , Wong, T. Khabiboulline, and F. Barkov, Superconductor Science and Technology 26, 102001 (2013).
- Grassellino et al. (2017) A. Grassellino, A. Romanenko, Y. Trenikhina, M. Checchin, M. Martinello, O. Melnychuk, S. Chandrasekaran, D. Sergatskov, S. Posen, A. Crawford, et al., Superconductor Science and Technology 30, 094004 (2017).
- Saito et al. (1997) K. Saito, H. Inoue, E. Kako, T. Fujino, S. Noguchi, M. Ono, and T. Shishido, in Proceedings of the 1997 Workshop on RF Superconductivity, srf97d02 (Abano Terme (Padova), Italy, 1997).
- Higuchi (2003) T. Higuchi, in Proceedings of the 11th Workshop on RF Superconductivity, weo15 (Lübeck/Travemünder, Germany, 2003).
- Palczewski et al. (2016) A. D. Palczewski, C. E. Reece, M. Kelley, and J. Tuggle, in Proceedings of LINAC2016, THOP02 (East Lansing, MI, USA, 2016).
- Grassellino (2017) A. Grassellino, in IPAC 2017 (Copenhagen, 2017).
- Saito (2017d) K. Saito, “Ion accelerator technology lecture notes,” (2017d), srf Surface Preparation Technologies.
- Tuggle et al. (2016) J. Tuggle, A. Palczewski, C. Reece, F. Stevie, and M. Kelley, in Proceedings of LINAC2016 (East Lansing, MI, USA, 2016).
- Romanenko (2014) A. Romanenko, in Proceedings of LINAC2014, TUIOC02 (Geneva, Switzerland, 2014).
- Saito (2003c) K. Saito, in Proceedings of the 2003 Particle Accelerator Conference, Vol. 1 (IEEE, 2003) pp. 462–466.