Temporal correlation between the optical and -ray flux variations in the blazar 3C 454.3
Abstract
Blazars show optical and -ray flux variations that are generally correlated, although there are exceptions. Here we present anomalous behaviour seen in the blazar 3C 454.3 based on an analysis of quasi-simultaneous data at optical, UV, X-ray and -ray energies, spanning about 9 years from August 2008 to February 2017. We have identified four time intervals (epochs), A, B, D and E, when the source showed large-amplitude optical flares. In epochs A and B the optical and -ray flares are correlated, while in D and E corresponding flares in -rays are weak or absent. In epoch B the degree of optical polarization strongly correlates with changes in optical flux during a short-duration optical flare superimposed on one of long duration. In epoch E the optical flux and degree of polarization are anti-correlated during both the rising and declining phases of the optical flare. We carried out broad-band spectral energy distribution (SED) modeling of the source for the flaring epochs A,B, D and E, and a quiescent epoch, C. Our SED modeling indicates that optical flares with absent or weak corresponding -ray flares in epochs D and E could arise from changes in a combination of parameters, such as the bulk Lorentz factor, magnetic field and electron energy density, or be due to changes in the location of the -ray emitting regions.
keywords:
galaxies: active - galaxies: nuclei - galaxies:jets - quasars:individual: 3C454.3 - -rays:galaxies - X-rays:galaxies1 Introduction
Blazars are a peculiar class of active galactic nuclei (AGN) that have their relativistic jets pointed close to the line of sight to the observer with angle 10 (Antonucci, 1993; Urry & Padovani, 1995). They are classified as flat spectrum radio quasars (FSRQs) and BL Lacerate (BL Lac) objects based on the strength of the emission lines in their optical/infrared (IR) spectrum. Both classes of objects emit radiation over the entire accessible electromagnetic spectrum from low energy radio to high energy -rays. As blazars are aligned close to the observer, the emission is highly Doppler boosted causing them to appear as bright sources in the extra-galactic sky. They dominate the extragalactic -ray sky first hinted by the Energetic Gammma-ray Experiment Telescope (EGRET) observations on board the Compton Gamma-Ray Observatory (CGRO; Hartman et al. 1999) and now made apparent by the Large Area Telescope (LAT) onboard the Fermi Gamma-ray space telescope (Atwood et al., 2009). The broad band spectra of blazars is dominated by emission from the jet with weak or absent emission lines from the broad line region (BLR). One of the defining characteristics of blazars is that they show flux variations (Wagner & Witzel, 1995) over a wide range of wavelengths on timescales ranging from months to days and minutes. In addition to flux variations they also show large optical and radio polarization as well as optical polarization variability. In the radio band they have flat spectra with the radio spectral index () 0.5 (. The broad band spectral energy distribution (SED) of blazars is characterized by a two hump structure, one peaking at low energies in the optical/IR/X-ray region and the other one peaking at high energies in the X-ray/MeV region (Fossati et al., 1998; Mao et al., 2016). In the one-zone leptonic emission models, the low energy hump is due to synchroton emission processes and the high energy hump is due to inverse Compton (IC) emission processes (Abdo et al., 2010b). The seed photons for the IC process can be either internal to the jet (synchroton self Compton or SSC; Konigl 1981; Marscher & Gear 1985; Ghisellini & Maraschi 1989 ) or external to the jet (external Compton or EC; Begelman et al. 1987). In the case of EC, the seed photons can be from the disk (Dermer & Schlickeiser, 1993; Boettcher et al., 1997), the BLR (Ghisellini & Madau, 1996; Sikora et al., 1994) and the torus(Błażejowski et al., 2000; Ghisellini & Tavecchio, 2008). Though leptonic models are found to fit the observed SED of majority of blazars, for some blazars, their SEDs are also well fit by either hadronic (Mücke et al., 2003; Böttcher et al., 2013) or lepto-hadronic models (Diltz & Böttcher, 2016; Paliya et al., 2016). In the hadronic scenario, the -ray emission is due to synchroton radiation from extremely relativisitic protons (Mücke et al., 2003) or the cascade process resulting from proton-proton or proton-photon interactions (Mannheim, 1993). Even during different brightness/flaring states of a source, a single emission model is not able to fit the broad band SED at all times. For example in the source 3C 279, while the flare during March - April 2014 is well fit by leptonic model (Paliya et al., 2015b), the flare in 2013 December with a hard -ray spectrum is well described by lepto-hadronic processes (Paliya et al., 2016). Thus, the recent availability of multiwavelength data coupled with studies of sources at different active states indicate that we still do not have a clear understanding of the physical processes happening close to the central regions of blazars.
An alternative to the SED modeling approach to constrain the emission models in blazars is though multiband flux monitoring observations. In the leptonic scenario of emission from the jets of blazars (Böttcher, 2007), a close correlation between the optical and -ray flux variations is expected. However, in the hadronic scenario of emission from blazars (Mücke & Protheroe, 2001), optical and -ray flux variations may not be correlated. Thus, optical and -ray flux variability observations could constrain the leptonic v/s hadronic emission model of blazar jets. Recent observations made with the Fermi Gamma-ray space telescope (Atwood et al., 2009) coupled with observations in the optical and infrared wavelengths indicate that in majority of the blazars studied for flux variations, -ray flares are closely associated with flares detected at the optical wavelengths with or without lag (Bonning et al., 2009; Chatterjee et al., 2012; Liao et al., 2014; Carnerero et al., 2015). However the availability of good time resolution of optical and -ray lightcurves has led to the identification of isolated flaring events in optical and -rays termed as ”orphan” flares. Both orphan -ray flares (prominent flare in GeV band -rays with no corresponding flare in the optical band) and orphan optical flares (flaring event in the optical band with no counterpart in the -ray band) are now known in blazars. As of today, optical flares with no corresponding -ray flares, are known in PKS 0208-5122 (Chatterjee et al., 2013a) and S4 1849+67 (Cohen et al., 2014) and -ray flares with no corresponding optical flares, are known in PKS 2142-75 (Dutka et al., 2013), PKS 1510-089 (MacDonald et al., 2015) PKS 0454-234 (Cohen et al., 2014) and 3C 454.3 (Vercellone et al., 2011). We are carrying out a systematic analysis of the multiwavelength variability characteristics of a sample of blazars to (i) identify anomalous flux variability behavior in blazars and (ii) constrain the physical processes happening in the central regions of blazars using flux variability and broadband SED modeling. Here, we present our results on the brightest source in our sample 3C 454.3.
3C 454.3 is a FSRQ at a redshift = 0.859. It was detected first as a bright and variable -ray source by EGRET onboard CGRO (Hartman et al., 1993). It has been studied extensively utilizing data over a large range of wavelengths that include, optical, X-ray and -ray energies (Bonning et al., 2009, 2012; Ackermann et al., 2010; Kushwaha et al., 2017). 3C 454.3 was found in a highly active state in the -ray band by AGILE (Vercellone et al., 2010, 2009) in 2007. In 2010 November the highest flare was detected at E¿100 MeV with the LAT instrument, having a flux value of about 6.6 ph (Abdo et al., 2011). According to Shah et al. (2017) X-ray and -ray emission from 3C 454.3 cannot be explained by single emission mechanism and to study the high energy observations one needs to consider both EC and SSC emission processes. We present here our results on the multiwavelength analysis carried out on the blazar 3C 454.3 using data that spans about 9 years from 2008 August to 2017 February with the prime motivation to find possible correlation between optical and -ray flux variations and subsequently constrain the emission processes in its central region. In section 2, we present the data used in this work. The analysis are described in Section 3, followed by the results and discussion in Section 4. The results are summarized in Section 5.
2 Multi-wavelength data and reduction
We used all the publicly available multi-wavelength flux monitoring data in -rays, X-rays, optical, UV and IR bands that span about 9 years covering the period 2008 August to 2017 February. We also used optical polarimetric data that were available during the above period.
2.1 -ray data
For -rays, we used the data from the LAT instrument on-board Fermi. The Fermi-LAT is a pair-conversion telescope sensitive to -ray energies from 20 MeV to more than 300 GeV (Atwood et al., 2009). Fermi normally operates in scanning mode and covers the entire sky once every3 hr. We used all data for 3C 454.3 collected for the period Aug 2008 to Feb 2017 (MJD: 54500 -57800; 110 months) and analysed using the Fermi Science Tool version v10r0p5 with appropriate selections and cuts recommended for the scientific analysis of PASS8 data *** http://fermi.gsfc.nasa.gov/ssc/data/analysis/documentation/. The photon-like events categorized as ’evclass=128, evtype=3’ with energies 0.1E300 GeV -rays within a circular region of interest (ROI) of 15∘ centered on the source and with zenith angle 90∘ were extracted. The appropriate good time intervals were then generated by using the recommended criteria ”(DATAQUAL ¿ 0)&&(LATCONFIG==1)”. The likely effects of cuts and selections, as well as the presence of other sources in the ROI, were incorporated by generating exposure map on the ROI and an additional annulus of 15∘ around it with the third LAT catalogue (3FGL - gllpscv16.fit; Acero et al. 2015). We used the latest isotropic model, ”isoP8R2SOURCEV6v06” and the Galactic diffuse emission model ”glliemv06” . To evaluate the significance of detection, we used the maximum-likelihood (ML) ratio test defined as TS = 2 log(L), where L is the likelihood function between models with and without a -ray point source at the position of 3C 454.3 (Paliya et al., 2015a). We considered the source as detected if TS 9, which corresponds to a 3 detection (Mattox et al., 1996). We generated the source light curve with a time binning of 1 day. For bins with TS 9, the source was considered undetected. We arrived at a -ray light curve containing 2394 confirmed measurements. All the errors associated with Fermi-LAT points are the 1 statistical uncertainties.
2.2 X-ray data
For X-rays covering the energy range of 0.3 10 keV, we used the data from the X-ray Telescope (XRT; Burrows et al. 2005) onboard the Swift satellite (Gehrels et al., 2004) taken from the archives at HEASARC †††https://heasarc.gsfc.nasa.gov/docs/archive.html. The data collected during the period 2008 August - 2017 February were analyzed with default parameter settings following the procedures given by the instrument team. For light curve analysis, data collected using both window timing (WT) and photon counting (PC) modes were used, however, for spectral analysis only data collected from PC mode were used. The collected XRT data were processed with the xrtpipeline task using the latest CALDB files available with version HEASOFT-6.21.We used the standard grade selection 0-12. The calibrated and cleaned events files were summed to generate energy spectra. The source spectra were extracted from a circular region of radii 50”, whereas, the background spectra were selected from the region of radii 55”. We combined the exposure map using the tool XIMAGE and ancillary response files created with xrtmkarf. We used an absorbed simple power law model with the Galactic neutral hydrogen column density of =6.5 from Kalberla et al. (2005) to perform the fitting within XSPEC (Arnaud, 1996). We obtained 128 and 191 X-ray flux measurements at 0.3 - 10 keV in WT and PC mode respectively.
2.3 UV-Optical-NIR Data
For UV and optical we used the data from the Swift-UV-Optical telescope (UVOT). We integrated Swift-UVOT data using the task uvotimsum. Source counts were extracted from a 5” circular region centered at the target and background region was extracted from a larger area of 10” from a nearby source free region. The magnitude of 3C 454.3 was extracted using the task uvotsource. The magnitudes were not corrected for Galactic reddening. The estimated magnitudes were then converted to flux units using the zero points given in Breeveld et al. (2011). In addition to UVOT, optical data were also taken from SMARTS ‡‡‡http://www.astro.yale.edu/smarts/glast/home.php (Small and Moderate Aperture Research Telescope System) as well as the Steward Observatory §§§http://james.as.arizona.edu/psmith/Fermi. Similarly near-infrared (NIR) data in J and K bands were taken from observations carried out using the ANDICAM instrument on the SMARTS 1.3 m telescope as part of a blazar monitoring campaign, supporting the Fermi multiwavelength AGN science. The details of the instrument and the data reduction procedures can be found in Bonning et al. (2012).
2.4 Optical polarization data
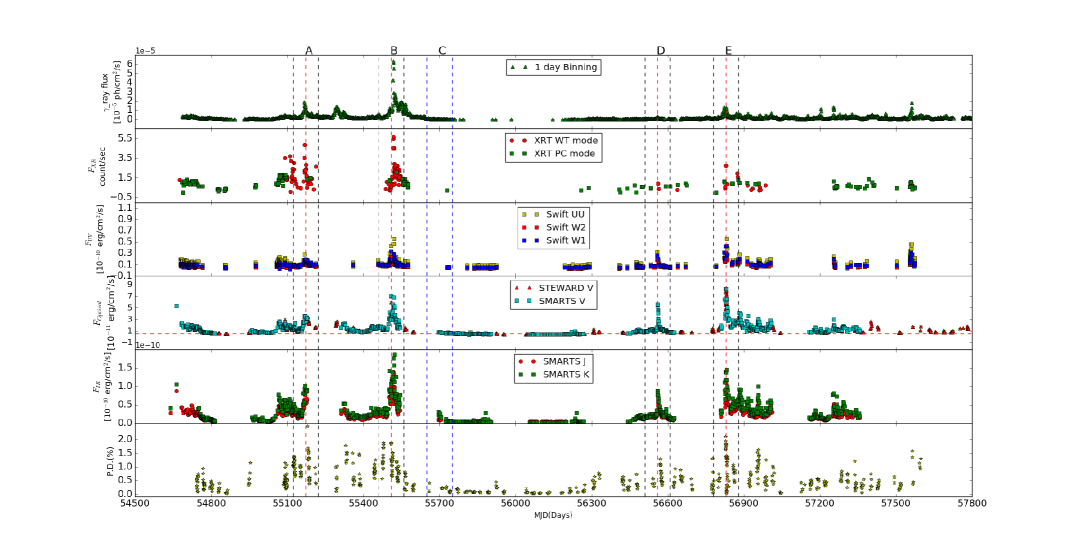
Optical polarization data in the V-band were taken from Steward Observatory of the University of Arizona. Details of the data and its reduction based on spectropolarimetric observations can be found in Smith et al. (2009). The polarization data available from Steward observatory and covering the period 2008 August to 2017 February consisted of 644 measurements. The optical polarization data along with flux measurements in other wavebands are shown in Fig. 1.
3 Analysis
| MJD | Calender date | Mean Flux | ||||
|---|---|---|---|---|---|---|
| ID | Start | End | Start | End | Opt. | |
| A | 55122 | 55222 | 18-10-2009 | 26-01-2010 | 4.97 | 1.76 |
| B | 55460 | 55560 | 21-09-2010 | 30-12-2010 | 11.7 | 2.81 |
| C | 55650 | 55750 | 30-03-2011 | 08-07-2011 | 0.54 | 0.68 |
| D | 56510 | 56610 | 06-08-2013 | 14-11-2013 | 0.99 | 1.67 |
| E | 56780 | 56880 | 03-05-2014 | 11-08-2014 | 3.75 | 3.23 |
3.1 Multi-wavelength light curves
The multi-wavelength light curves that include -ray, X-ray, UV, optical and IR along with the polarization measurements from 2008 August to 2017 February (MJD: 54500-57800) are shown in Fig 1. From Fig 1 it is evident that 3C 454.3 has gone through both quiescent and active phases during the period MJD 54500 57800. During this period, we identified four time intervals during which large optical flares were seen. They are denoted by epochs A,B,D and E and cover the period MJD 55122-55222 (Epoch A), MJD 55460-55560 (Epoch B), MJD 56510-56610 (Epoch D) and MJD 56780-56880 (Epoch E). The above four intervals were chosen such that (i) there is a gradual increase of the optical brightness at least by 0.5 mag from the quiescent level (ii) there is a corresponding declining branch from the peak back to the quiescent level and (iii) the rising and decaying phase (both inclusive) lasts for more than 50 days. The peak of the flares are shown as a vertical dashed red line in Fig. 1. On either side of the red lines are two black vertical lines, having a total duration of 100 days. We also identified a time interval denoted as Epoch C and covering the period MJD 55650-55750, where the source was at its quiescent state in IR-optical-UV-Xrays and -rays. This quiescent period for a duration of 100 days is indicated by two vertical blue lines in Fig. 1. The details of the five epochs that were identified for further analysis along with their mean optical and -ray flux levels are given in Table 1. Detailed analysis of each of these five epochs are given in the following sub-sections.
3.1.1 Epoch A (MJD 55122 - 55222)
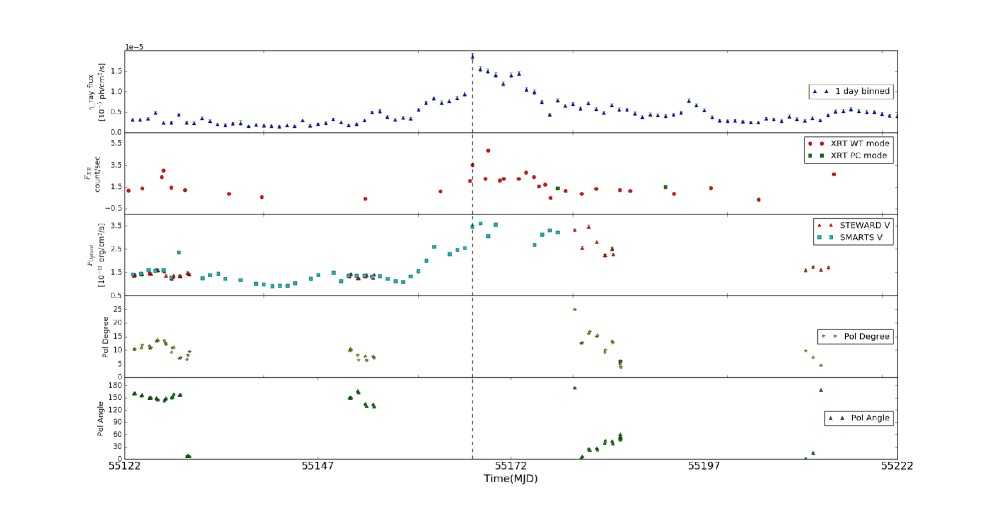
An inspection of Fig 1. indicates that there is a close correlation between IR, optical, UV, X-rays and -rays. Optical polarization data though sparse during this period was not available during the peak of the flare making it impossible to comment on the nature of the optical polarization during the peak of the -ray flare. The multiband light curves covering for a duration of 100 days centered of the peak of epoch A, along with the polarization measurements when available are given in Fig. 2.
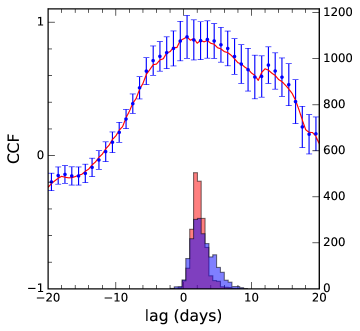
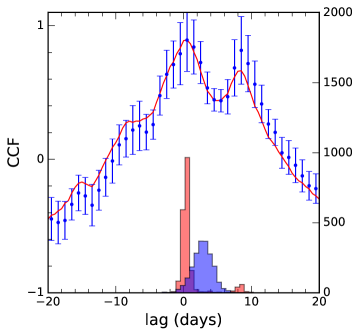
To check for the presence of any correlation between optical and -ray flux variations we cross-correlated the optical and -ray light curves using the discrete correlation (DCF) technique of Edelson & Krolik (1988) and the interpolated cross-correlation function (ICCF) technique of Gaskell & Sparke (1986); Gaskell & Peterson (1987) . The errors in both DCF and ICCF were obtained by carrying out a Monte Carlo analysis that involves both flux randomization and random subset selection following the procedures outlined in Peterson et al. (2004) . The results of the cross correlation functions analysis are shown Fig.3 both for ICCF and DCF. The lag was determined by the centroid of the cross-correlation function which includes all points within 80% of the peak of the cross-correlation function. We found a lag of 2.2 days with the -ray leading the optical flux variations. This is similar to the lag of about 4 days found between the -ray and optical band by Gaur et al. (2012) on analysis of the data for the time period 2009 November - 2009 December. However, Gupta et al. (2017) found that the optical and -rays are correlated with zero lag during the period MJD 55150 - 55200 which is within the range analysed here. During the same period, Gupta et al. (2017) found that during the declining phase of the -ray flare, the degree of optical polarization increased, showing a clear signature of anti correlation between -ray flux variation and optical polarization.
3.1.2 Epoch B (MJD 55460 - 55560)
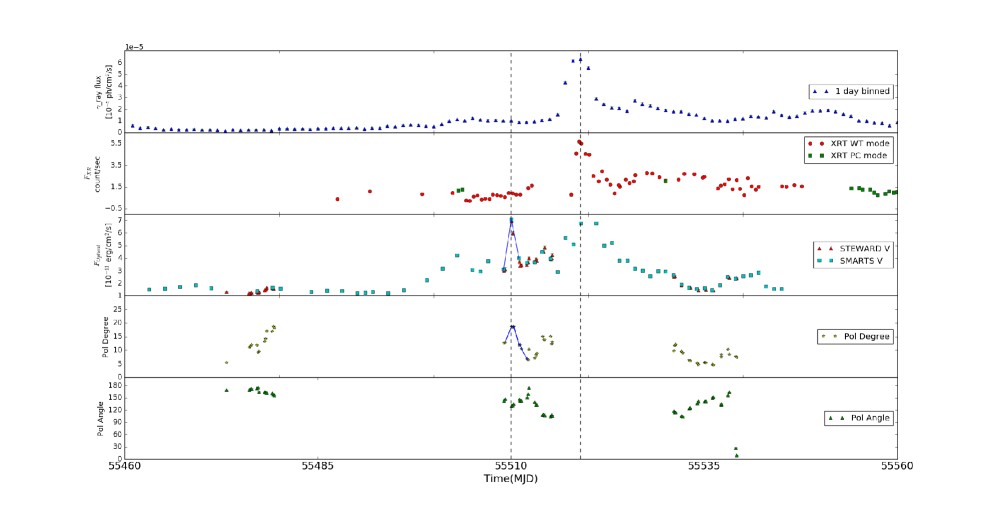
During this period, the peak of the optical flare is about two times larger than the peak of the optical brightness at epoch A. The -ray brightness too peaked at nearly the same time of the optical flare. During this epoch, visual inspection indicates close correlation between -ray, X-ray, UV optical and IR flux variations. During this period a short duration intense flare in the optical was observed superimposed on the large optical flare at around MJD 55510. This particular short duration optical flare has no corresponding -ray flare (Fig. 4) and is thus a case of an optical flare with no corresponding -ray counterpart. At the epoch of this short duration optical flare, there is also enhanced optical polarization, pointing to a strong correlation between optical flux and polarization variations. At this time, enhanced flux levels were also seen in UV and X-ray bands. This remarkable short duration intense optical flare with no corresponding flare in the gamma-band was also noticed by Vercellone et al. (2011). According to Vercellone et al. (2011) this optical flare showed a sharp rise and decay in 48 hours. At the same time, 20% rise was seen in the X-ray with no change at other wavelengths. During the duration of the large optical flare with the peak at MJD 55519, data on the degree of optical polarization is missing to make any statement on the correlation or anti-correlation between optical flux and polarization variations. DCF and ICCF analysis between optical and -ray flux variations, shown in Fig. 5 indicate that the time delay between optical and -ray flux variations is 0.8. Thus, during this major optical flare in epoch B, the optical and -ray flux variations are correlated with zero lag.
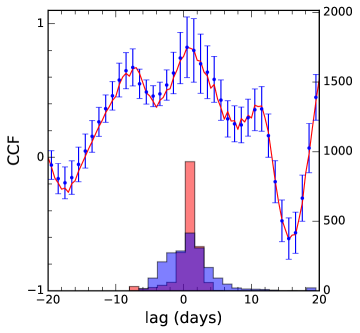
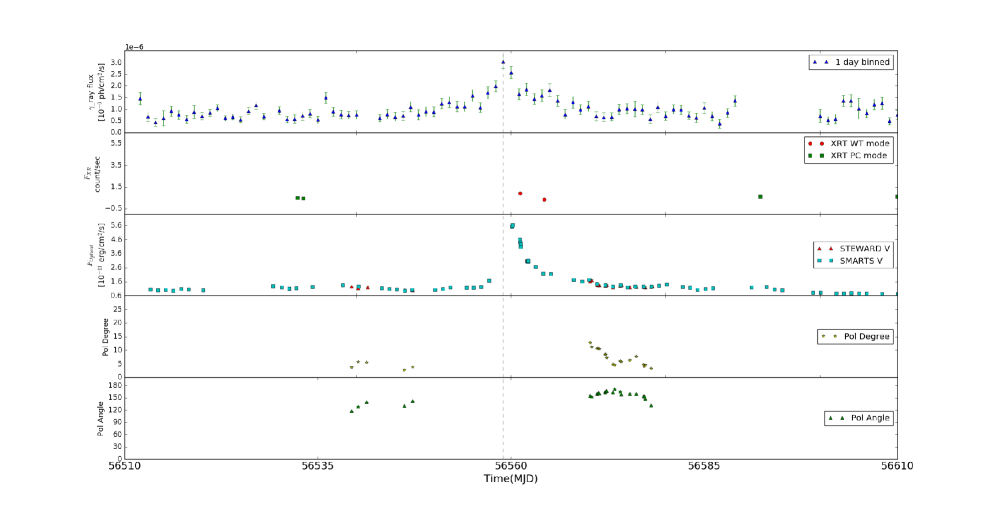
3.1.3 Epoch D (MJD 56510 - 56610)
The optical flux during this epoch has nearly the same amplitude as the optical flare at epoch B. Considering the correlation between optical and -ray flux variations during both epochs A and B, it is natural to expect the -ray flare at epoch D to have similar brightness to that of epoch B. However, the source was barely detected in the -ray band during this period. This is an indication of an optical flare with no/weak corresponding -ray flare (Fig. 6). Correlation analysis between the optical and -ray light curves during this epoch gives a time delay of 1.0 days. This shows that the optical and the very weak -ray variations are correlated with 1 day lag. The results of the cross-correlation function analysis are shown in Fig. 7. Polarizaion data was not available during the period of the flare and therefore the correlation if any between optical flux and polarization variations could not be ascertained.
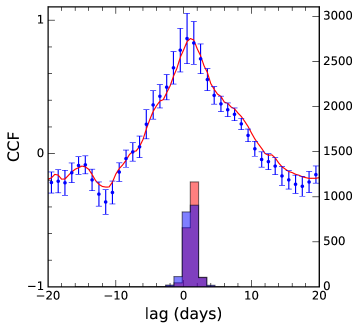
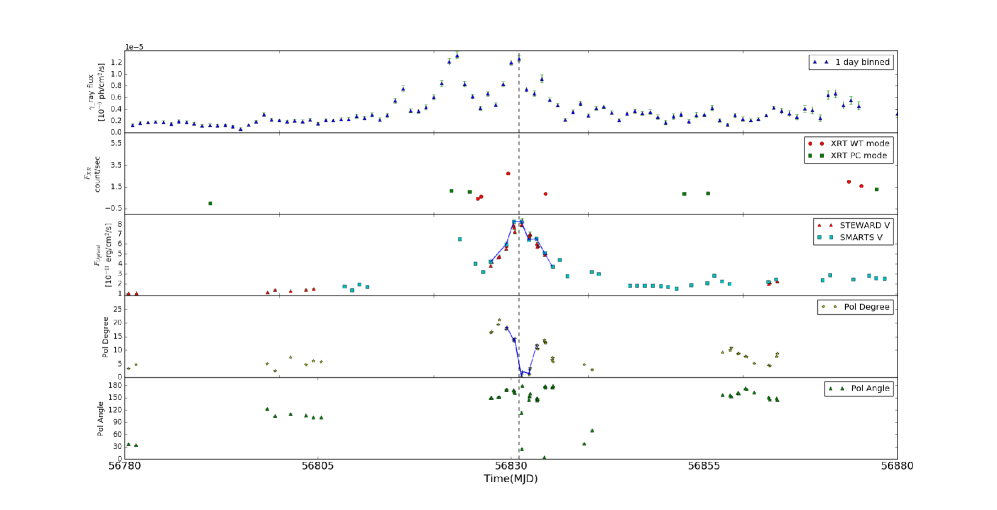
3.1.4 Epoch E (MJD 56780 - 56880)
During this epoch the optical flare has a peak brightness similar to that of the optical flare at epoch B, but the source has minor -ray flare during this epoch. This same period was also independently analyzed by (Kushwaha et al., 2017) for correlation between -ray and optical flux variations. They find no lag between optical and -ray flux variations during the period overlapping the duration of epoch E. Our Correlation analysis between the optical and -ray light curves during this epoch gives a time delay of 0.3 days.Correlation analysis for this epoch shown in figure 9. We noticed an interesting feature by careful examination of the optical total flux and polarization variations shown in Fig 8. The degree of optical polarization is anticorrelated with the optical flare both during the rising phase and the decaying phase of the flare. Though such anti-correlations between optical flux and polarization variations were known before in the blazar BL Lac (Gaur et al., 2014) and 3C 454.3 (Gupta et al., 2017), we noticed anticorrelation between optical flux and polarization variations both during the rising part of the flare as well as the decaying part of the flare.
3.2 Spectral variations
To check for any spectral variation in the optical/IR bands, we looked for variation in the V-J band colour against the V-band brightness. This colour variation was analyzed for the epochs A, B, D and E. During epoch A and B, the source showed a ”redder when brighter (RWB)” behavior. During epochs E, a bluer when brighter behavior was observed. During epoch D, we observed a complex behavior. Upto a V-band brightness of around 15 mag, the source showed a ”bluer when brighter” behavior, but for optical brightness fainter than 15.0 mag, a ”redder when brighter” behavior was observed. The colour magnitude diagram for all the four epochs are shown in Fig. 10. The spectral variations shown by the source is thus complex. From studies on the optical-IR colour-magnitude diagram, it is known that FSRQs in general show a RWB trend, which is attributed to them having luminous accretion disk (Bonning et al., 2012; Gu et al., 2006). The observed optical emission is a combination of thermal blue emission from the accretion disk and non-thermal red emission from the jet. As the source gets brighter, the non-thermal emission has a more dominant contribution to the total flux giving rise to the RWB behavior (Bonning et al., 2012). During epochs A and B, there is a trend of the object to become RWB, irrespective of its optical brightness. The optical flares dominated by synchrotron emission processes during A and B have corresponding -ray flares that are produced by EC processes. However, during epochs D and E, the colour variations were found to depend on the optical brightness. During the epochs when this complex spectral behavior was noticed, the source showed optical/IR flare with no or weak corresponding flare in the -ray band. The source showed a much larger amplitude of variability in the optical/IR bands, while in the -ray band it was either faint or below the detection limit of Fermi. This definitely points to some complex physical changes and could be due to a combination of changes in the bulk Lorentz factor, electron energy density and magnetic field as seen from our SED modeling of the multiband data.
3.3 -ray spectra
The shape of the -ray spectrum can provide evidence on the intrinsic distribution of electrons involved in the -ray emission processes that might involve acceleration and cooling processes. For all the five intervals identified above, we generated the -ray spectra and fitted them with two models, namely a simple power law (PL) model and a log parabola (LP) model. The PL model has the form
| (1) |
where is normalization of the energy spectrum and = 300MeV, which is constant for all SEDs.
The LP model is defined as below following Nolan et al. (2012)
| (2) |
here, dN/dE is the number of photons cm-2 s-1 MeV-1, is photon index at , is the curvature index, E is the -ray photon energy, N∘ and E∘ are the normalization and scaling factor of the energy spectrum respectively.
We used Maximum Likelihood estimator gtlike for spectral analysis likelihood ratio test (Mattox et al., 1996) to check the PL model (null hypothesis) against the LP model(alternative hypothesis). = 2(log - log ) was also calculated (Nolan et al., 2012). The presence of a significant curvature was tested by setting the condition ¿ 16. Gamma-ray spectrum for these five epochs are shown in Figure 11 and the results of the -ray spectral analysis are shown in Table 2. On all the five epochs the -ray spectra is well fit with a LP model.
3.4 Spectral energy distribution modeling
To characterize the nature of the source during epochs A, B, C, D and E, we constructed the broad band spectral energy distribution. For UV, optical and IR, all data points over the 100 day period in each of the epochs were averaged filter wise to get one data point for each filter. However, for X-ray and -rays, all the available data over the 100 day period in each of the epochs was used to construct their average spectra. All the generated SEDs were modeled using the one zone leptonic model of Sahayanathan & Godambe (2012). In this model, the emission region is assumed to be a spherical blob of size filled with non-thermal electrons following a broken power law distribution
| (5) |
where, is the electron Lorentz factor and, and are the low and high energy power-law indices with the Lorentz factor corresponding to the break energy. The emission region is permeated with a tangled magnetic field and move down the jet with a bulk Lorentz factor . The broadband SEDs are modelled using synchrotron, SSC and EC emission mechanisms. This model was added as a local model in XSPEC (Arnaud, 1996) and the source parameters were obtained through minimization (Sahayanathan et al., 2018). The observed spectrum is mainly governed by free parameters with of them governing the electron distribution namely, , , and the electron energy density . The rest of the parameters are, , , , jet viewing angle , the temperature of the external thermal photon field and the fraction of the external photons taking part in the EC process, . To account for the model related uncertainties, we added 12% systematic error evenly over the entire data. For SED model fits, corrections due to galactic absorption were applied to the IR, optical¶¶¶http://ned.ipac.caltech.edu, UV (Raiteri et al., 2011) and X-ray data points.
To investigate the difference in the flaring behavior of the source during various epochs, the SED fitting methodology was carried out in the following manner: First, the typical value of the source parameters governing the observed broadband emission from 3C 454.3 was attained by fitting the quiescent state C. Limited information available through optical, X-ray and -ray observations did not let us to constrain all the parameters. The information that could be obtained from the observed SEDs were the high energy and low energy spectral indices, synchrotron flux at optical, SSC flux at X-ray and EC flux at -ray energies. Consistently we chose five parameters namely, , , , and to be free and froze the rest of the parameters. Details of the parameters are given in Table3. The values of , and were chosen to be , and respectively. The other parameters have , , . The adopted size of the -ray emitting region has been found from gravitational microlensing effect that ranges from cm (Vovk & Neronov, 2016). The resultant best fit parameters for the epoch C are given in Table 3 and the model SED with the observed one is shown in Figure12 and Fig. 13.
The fitting procedure was repeated for the epochs A, B and D with the choice of free parameters similar to the case of epoch C. For epochs A and B, where optical and -ray flare are correlated, we found the main difference is seen in the enhancement of the bulk Lorentz factor and a marginal decrease in the magnetic field. For epoch A, the increase in bulk Lorentz factor is relatively less; however, this is also associated with an increase in electron energy density. On the other hand, for epoch D with an isolated orphan optical flare, we found the SED can be reproduced with an increase in the bulk Lorentz factor and magnetic field and decrease in electron energy density relative to the quiescent epoch C. For epoch E, where a major flare is observed in optical compared to the ray,we found the SED cannot be reproduced satisfactorily with the parameters similar to epoch C rather it demands a large emission region size with low Lorentz factor. Hence the emission region during this epoch may be at large jet scale where the jet cross section is significantly larger. During all the epochs, we also observed the variations in the high and low energy particle power-law indices and this can also manifest the flux variations observed at these energies. Our modeling also shows that the observed broad band SED over all the epochs can be well described by the leptonic scenario (Fig. 12 and Fig. 13).
| PL | LP | |||||||||
|---|---|---|---|---|---|---|---|---|---|---|
| Epochs | Flux | TS | Log L | Flux | TS | Log L | TScurve | |||
| A | -2.340.01 | 5.680.06 | 87024.8 | 138177.8 | 1.910.03 | 0.15 0.01 | 4.930.07 | 79568.2 | 137962.7 | 430.1 |
| B | -2.330.01 | 13.30.08 | 278585.0 | 80508.1 | 2.210.00 | 0.09 0.00 | 12.790.12 | 283811.0 | 80238.2 | 539.8 |
| C | -2.420.03 | 0.570.02 | 3422.6 | 151787.4 | 1.970.10 | 0.24 0.04 | 0.470.03 | 3392.8 | 151756.9 | 61.0 |
| D | -2.250.02 | 1.030.03 | 9890.6 | 142338.0 | 2.040.04 | 0.14 0.02 | 0.880.03 | 9768.6 | 142299.7 | 76.6 |
| E | -2.140.00 | 4.420.00 | 66161.9 | 146140.9 | 1.530.00 | 0.15 0.00 | 3.710.03 | 62145.3 | 145896.2 | 489.4 |
| Parameters | Epoch A | Epoch B | Epoch C | Epoch D | Epoch E |
|---|---|---|---|---|---|
| Bulk Lorentz Factor factor | 11.790.82 | 16.630.96 | 7.300.30 | 11.881.07 | 5.000.71 |
| Low energy particle index | 1.470.16 | 1.340.13 | 1.560.09 | 1.980.15 | 1.370.11 |
| High energy particle index | 3.640.11 | 3.930.09 | 3.120.11 | 3.490.15 | 3.140.08 |
| Electron Energy Density (cm | 5.151.08 | 2.050.36 | 3.620.32 | 1.150.24 | 0.040.01 |
| Magnetic Field (Gauss) | 1.770.11 | 1.780.09 | 2.820.16 | 4.010.23 | 0.730.03 |
| Chi-square/dof | 1.0 | 1.0 | 0.84 | 1.30 | 1.07 |
4 Results and discussion
4.1 -ray spectra
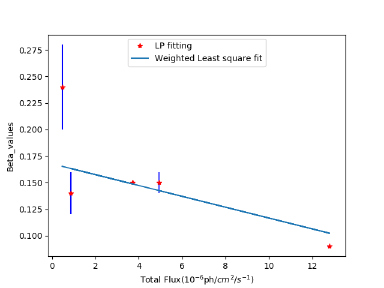
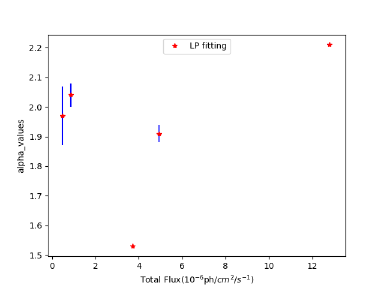
The gamma-ray spectra of 3C 454.3 in all the five epochs considered here that includes, both the active and quiescent phases are well described by the LP model. Such curved -ray spectrum is generally seen in FSRQs (Abdo et al., 2010a). In the third catalog of AGN detected by Fermi LAT, the spectrum of 3C 454.3 is well described by a power law with exponential cut-off model (Ackermann et al., 2015). Such an observed curved -ray spectrum could be due to the electrons giving rise to the emission having a curved energy distribution (Dermer et al., 2015). Alternatively, the curved -ray spectrum is a manifestation of the attenuation of high energy -rays through photon-photon pair production (Coogan et al., 2016). The parameter in the LP model is a measure of the slope of the -ray spectrum with a small value of indicating a harder -ray spectrum. The curvature parameter gives a measure of the presence of cut-off in the spectrum at high energies with a large value of indicating a sharper cut-off. Therefore, investigation of any changes in the values of and parameters during the five epochs can point to changes in the -ray spectral shape. A change in the -ray spectral parameters during a flaring state could point to change in the position of the -ray emitting region. The variation of the and against flux during the five epochs studied here is shown in Fig. 14. No trend on the variation of with flux was seen during the five epochs considered here. However, a plot of with flux (Fig. 14) shows a clear trend of a decrease in the curvature parameter with increasing flux. Linear least square fit to the data gives = (-0.0050.009)+(0.1680.029) with a correlation coefficient of -0.77. Clearly the value of is high and low at the lowest and the highest flux levels among the five epochs analyzed here. Such a trend is also seen by Ackermann et al. (2015) on analysis of the FSRQs in the third catalog of AGN detected by Fermi (3LAC). The changes in the -ray spectral shape during different brightness states of 3C 454.3 could point to the emission site located at different regions during different brightness states, however, other explanations could not be ruled out. Studies on the flares of 3C 454.3 in December 2009 and November 2010, that falls in the epochs A and B studied here concluded that the -ray emission regions were located close to the central black hole (Jorstad et al., 2012; Isler et al., 2013).
4.2 Connection between optical and GeV flux variations
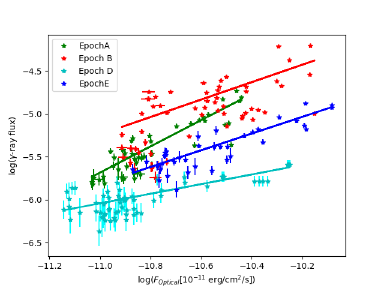
In a majority of the multi-wavelength monitoring observations of blazars, close correlations between the flux variations in different bands were noticed (Bonning et al., 2009). This was explained on the co-spatiality of the emission regions emitting in different bands and the correlated optical and GeV flux variations can be understood in the standard leptonic emission processes according to which the same relativistic electrons produce optical and -ray emission via synchrotron and IC processes.. However, there are a handful of blazars where the emission in the optical and GeV -ray bands are found not to be correlated (Chatterjee et al., 2013a; Cohen et al., 2014; Dutka et al., 2013; MacDonald et al., 2015). During the 9 years of monitoring data analyzed here we found four flaring epochs in the optical, namely A,B, D and E. During epochs A and B, the optical flare is accompanied by a -flare, while at the other two epochs D and E, though the optical flares have amplitudes similar to that of epochs A and B, the -rays during epochs D and E were either weak or undetected. This is clearly seen in Fig. 15 where the logarithm of -ray flux is plotted against the logarithm of optical flux. The results of the linear least squares fit carried out between the gamma-ray flux and optical flux in the V-band during those four epochs yielded the following relations given in Equations 4-7 for epochs A, B, D and E respectively. The results of the fit are given in Table 4.
| (6) |
| (7) |
| (8) |
| (9) |
The above equations clearly indicate that when the source showed optical flares during epochs D and E, the -ray emission is weak. Thus during these two epochs there is a clear case of optical flares with weak/no-corresponding -ray counterparts. Also during epoch B, prior to the large optical flare with a counterpart in the gamma-ray band, a short duration and intense optical flare was found around MJD 55510, without a -ray counterpart also only noticed by Vercellone et al. (2011). According to Vercellone et al. (2011) such a lack of a simultaneous -ray at MJD 55510, could be due to either enhancement of the magnetic field, or attenuation by - production or lack of external seed photons. However, based on arguments from modeling Vercellone et al. (2011) indicate that the complex behaviour seen during epoch B could be due to changes in the external photon field. However, according to Vittorini et al. (2014) the anomalous flux variability patterns between optical and -ray can be due to inverse compton scattering or process happening as the jet collides onto mirror cloud situated at parsec scales. Thus the variability shown by 3C 454.3 in different energy bands is complex. To have an insight into this anomalous variability behavior we fitted the broad band SED of the source in all the five epochs using simple one zone leptonic emission models. During epochs A and B, where the optical and -ray flux variations are correlated, there is enhancement in the bulk Lorentz factor relative to the quiescent epoch C. During epoch D, we found an enhancement of the magnetic field related to the quiescent state C, which could explain the high optical flare accompanied by a very weak -ray flare. Such a change in magnetic field could also produce enhanced optical polarization and X-ray flux. But, the non-availability of optical polarization and X-ray flux measurements during epoch D, preclude us to make a firm conclusion on the enhancement of the magnetic field as the cause for the occurrence of optical flare with weak -ray flare during epoch D, however, is the most favorable scenario. In epoch E,where there is an optical flare with a weak -ray counterpart our SED modeling indicates decrease in electron energy density, magnetic field and bulk Lorentz factor and also the emission region could be located at a region farther than the emission region of other epochs. We therefore conclude that the observations of optical flare with weak/no corresponding -ray flare during epochs D and E, could be due to one or a combination of parameters such as the bulk Lorentz factor, magnetic field and electron energy density or due to changes in the locations of the -ray emitting regions. 3C 454.3 is fourth blazar known to have shown the anomalous variability behavior of optical flares with no -counterparts. The other sources where such behavior were noticed are PKS 0208-512 (Chatterjee et al., 2013a), S4 1849+67 (Cohen et al., 2014) and 3C 279 (Patiño-Álvarez et al., 2018). A possible cause for optical flux variations without -ray counterparts could be attributed to hadronic processes (Mücke & Protheroe, 2001), however based on our SED analysis, we conclude that the leptonic model is also capable of explaining the emission from 3C 454.3 during all the epochs.
4.3 Correlation between optical flux and polarization
During Epoch B, there is one short term optical flare at around 55510 MJD. During this period there is no -ray flare. This intense short duration optical flare without any -ray counterpart was also reported by Vercellone et al. (2011). Such an increased optical flare without any -ray counterpart can be due to magnetic field enhancement. In this scenario an increase in magnetic field will lead to increased optical flare (from synchrotron process) and no increased -ray emission as the -ray emission from inverse compton process is independent of magnetic field (Vercellone et al., 2011; Chatterjee et al., 2013b). Alternatively, the lack of a -ray flare coinciding with an optical flare at around 55510 MJD could be due to the attenuation of -ray via pair production or lack of external photon field Vercellone et al. (2011). Polarization observations can play a key role in arriving at a possible scenario for the anomalous flare seen at MJD 55510. During this time sparse polarization observations were available to make any analysis on the correlation between flux and polarization variations possible. Degree of polarization seems to be positively correlated with the optical flux change (Fig. 4) with the increase in the degree of polarization coinciding with the optical flare. Near simultaneous polarization observations were also available for epoch E. During this epoch, we have sufficient photometric observations to study the correlation between the degree of polarization and flux changes. The degree of polarization is found to be anti-correlated to the flux changes in the optical V-band, both during the rising phase as well as the declining phase of the optical flare evident in Fig.8. Such, anti-correlation between degree of optical polarization and total flux is known before in the BL Lacertae object BL Lac (Gaur et al., 2014) and the FSRQ 3C 454.3 (Gupta et al., 2017), Such anti-correlation between flux and degree of polarization could be explained in a two component model, consisting of a slowing varying component and a variable components with different polarization directions.
| Epoch | Slope | Intercept | Correlation coefficient |
|---|---|---|---|
| A | 1.5280.112 | 11.1281.190 | 0.880 |
| B | 1.0170.144 | 5.9451.506 | 0.680 |
| D | 0.5610.048 | 0.1320.510 | 0.742 |
| E | 0.9740.068 | 4.9010.706 | 0.860 |
5 Summary
We present our analysis of the multiband light curves of the FSRQ 3C 454.3 that include -rays, X-rays, UV, optical and IR spanning about 9 years from 2008 August to 2017 February. The results are summarized below:
-
1.
Between the period 2008 August to 2017 February, 3C 454.3 showed large amplitude optical/IR flares during four epochs identified in this work as A, B, D and E. During epoch A, the optical flare has a counterpart in the -ray region. Cross correlation analysis indicated that the optical and -ray flux variations are closely correlated with a lag of 2.5 days with the optical lagging the -ray emission, pointing to difference in their emission regions. During epoch B, too, the optical flare has a corresponding -ray flare. From cross-correlation analysis we found that the flux variations in both the optical and -band are correlated with almost zero lag, pointing to co-spatiality of both the emission regions. During epochs D and E, though optical flare has similar magnitude to that of the flare at epochs A and B, the source is weak in the -ray band. Our analysis thus points to the detection of optical flare with no -ray counterpart in 3C 454.3. The only other sources where such behaviour were observed are PKS 0208512 (Chatterjee et al., 2013a), S4 1849+67 (Cohen et al., 2014) and 3C 279 (Patiño-Álvarez et al., 2018).
-
2.
Broad band SED modeling, using one zone leptonic emission model was carried out on the four flaring epochs A,B,D and E along with a quiescent epoch C for comparison. Relative to the quiescent state C, during the active state A and B, there is enhancement of the bulk Lorentz factor, which could explain the correlated optical and -ray flux variations. The observations of optical flare with weak/no -ray counterpart during epochs D and E, could be due to a combination of parameters such as the bulk Lorentz factor, magnetic field and electron energy density or changes in the location of the -ray emitting region.
-
3.
The available polarization observations during the period analysed here showed complex correlation to the optical flux changes. During a short term optical flare (apart from the main flare) during epoch B, the degree of optical polarization was found to be correlated to the optical flux changes. However, during the flare at epoch E, the degree of optical polarization is anti-correlated to the optical V-band brightness both during the rising and falling part of the flare.
-
4.
The source showed a complex colour (V-J)-magnitude (V) variability. During the epochs A and B, when optical and - ray variations are correlated, the source showed a RWB behaviour. For epoch D, the source showed a RWB trend for V-band brightness fainter than 15 mag, while for V-band magnitude brighter than 15 mag, it showed a BWB behaviour. For epoch E, when there is an optical flare with no -ray counterpart, the source showed a BWB trend.
-
5.
The -ray spectra during all the five epochs were well described by a LP model. The curvature parameter that provides an indication of the cut-off present in the spectrum is found to be lowest at the highest flux level and highest at the lowest flux level among the five epochs analyzed here.
Acknowledgements
We thank the anonymous referee for his/her critical comments that helped to improve the manuscript. This research has made use of data, software and web tools of High Energy Astrophysics Science Archive Research center (HEASARC), maintained by NASA’s Goddard Space Flight Center. SMARTS observations of LAT-monitored blazars are supported by Yale University and Fermi GI grant NNX 12AP15G. J.C.I. has received support from NASA-Harriet Jenkins Pre-doctoral Fellowship Program, NSF Graduate Research Fellowship Program (DGE-0644492), and the National Research Council’s Ford Foundation Disserta- tion Fellowship. C.D.B., M.M.B, and the SMARTS 1.3 m and 1.5 m observing queue also receive support from NSF grant AST-0707627. We are grateful for photometry and polarimetry from Paul Smith’s monitoring program at the Steward Observatory, which is supported by Fermi Guest Investigator grants NNX08AW56G, NNX09AU10G, and NNX12AO93G.
References
- Abdo et al. (2010a) Abdo A. A., et al., 2010a, ApJ, 710, 1271
- Abdo et al. (2010b) Abdo A. A., et al., 2010b, ApJ, 716, 30
- Abdo et al. (2011) Abdo A. A., et al., 2011, ApJ, 733, L26
- Acero et al. (2015) Acero F., et al., 2015, ApJS, 218, 23
- Ackermann et al. (2010) Ackermann M., et al., 2010, ApJ, 721, 1383
- Ackermann et al. (2015) Ackermann M., et al., 2015, ApJ, 810, 14
- Antonucci (1993) Antonucci R., 1993, ARA&A, 31, 473
- Arnaud (1996) Arnaud K. A., 1996, in Jacoby G. H., Barnes J., eds, Astronomical Society of the Pacific Conference Series Vol. 101, Astronomical Data Analysis Software and Systems V. p. 17
- Atwood et al. (2009) Atwood W. B., et al., 2009, ApJ, 697, 1071
- Begelman et al. (1987) Begelman M. C., et al., 1987, ApJ, 322, 650
- Błażejowski et al. (2000) Błażejowski M., Sikora M., Moderski R., Madejski G. M., 2000, ApJ, 545, 107
- Boettcher et al. (1997) Boettcher M., Mause H., Schlickeiser R., 1997, A&A, 324, 395
- Bonning et al. (2009) Bonning E. W., et al., 2009, ApJ, 697, L81
- Bonning et al. (2012) Bonning E., et al., 2012, ApJ, 756, 13
- Böttcher (2007) Böttcher M., 2007, Ap&SS, 309, 95
- Böttcher et al. (2013) Böttcher M., Reimer A., Sweeney K., Prakash A., 2013, ApJ, 768, 54
- Breeveld et al. (2011) Breeveld A. A., Landsman W., Holland S. T., Roming P., Kuin N. P. M., Page M. J., 2011, in McEnery J. E., Racusin J. L., Gehrels N., eds, American Institute of Physics Conference Series Vol. 1358, American Institute of Physics Conference Series. pp 373–376 (arXiv:1102.4717), doi:10.1063/1.3621807
- Burrows et al. (2005) Burrows D. N., et al., 2005, Space Sci. Rev., 120, 165
- Carnerero et al. (2015) Carnerero M. I., et al., 2015, MNRAS, 450, 2677
- Chatterjee et al. (2012) Chatterjee R., et al., 2012, ApJ, 749, 191
- Chatterjee et al. (2013a) Chatterjee R., et al., 2013a, ApJ, 763, L11
- Chatterjee et al. (2013b) Chatterjee R., Nalewajko K., Myers A. D., 2013b, ApJ, 771, L25
- Cohen et al. (2014) Cohen D. P., Romani R. W., Filippenko A. V., Cenko S. B., Lott B., Zheng W., Li W., 2014, ApJ, 797, 137
- Coogan et al. (2016) Coogan R. T., Brown A. M., Chadwick P. M., 2016, MNRAS, 458, 354
- Dermer & Schlickeiser (1993) Dermer C. D., Schlickeiser R., 1993, ApJ, 416, 458
- Dermer et al. (2015) Dermer C. D., Yan D., Zhang L., Finke J. D., Lott B., 2015, ApJ, 809, 174
- Diltz & Böttcher (2016) Diltz C., Böttcher M., 2016, ApJ, 826, 54
- Dutka et al. (2013) Dutka M. S., et al., 2013, ApJ, 779, 174
- Edelson & Krolik (1988) Edelson R. A., Krolik J. H., 1988, ApJ, 333, 646
- Fossati et al. (1998) Fossati G., Maraschi L., Celotti A., Comastri A., Ghisellini G., 1998, MNRAS, 299, 433
- Gaskell & Peterson (1987) Gaskell C. M., Peterson B. M., 1987, ApJS, 65, 1
- Gaskell & Sparke (1986) Gaskell C. M., Sparke L. S., 1986, ApJ, 305, 175
- Gaur et al. (2012) Gaur H., Gupta A. C., Wiita P. J., 2012, AJ, 143, 23
- Gaur et al. (2014) Gaur H., Gupta A. C., Wiita P. J., Uemura M., Itoh R., Sasada M., 2014, ApJ, 781, L4
- Gehrels et al. (2004) Gehrels N., et al., 2004, ApJ, 611, 1005
- Ghisellini & Madau (1996) Ghisellini G., Madau P., 1996, MNRAS, 280, 67
- Ghisellini & Maraschi (1989) Ghisellini G., Maraschi L., 1989, ApJ, 340, 181
- Ghisellini & Tavecchio (2008) Ghisellini G., Tavecchio F., 2008, MNRAS, 387, 1669
- Gu et al. (2006) Gu M. F., Lee C.-U., Pak S., Yim H. S., Fletcher A. B., 2006, A&A, 450, 39
- Gupta et al. (2017) Gupta A. C., et al., 2017, MNRAS, 472, 788
- Hartman et al. (1993) Hartman R. C., et al., 1993, ApJ, 407, L41
- Hartman et al. (1999) Hartman R. C., et al., 1999, ApJS, 123, 79
- Isler et al. (2013) Isler J. C., et al., 2013, ApJ, 779, 100
- Jorstad et al. (2012) Jorstad S. G., et al., 2012, preprint, (arXiv:1205.0520)
- Kalberla et al. (2005) Kalberla P. M. W., Burton W. B., Hartmann D., Arnal E. M., Bajaja E., Morras R., Pöppel W. G. L., 2005, A&A, 440, 775
- Konigl (1981) Konigl A., 1981, ApJ, 243, 700
- Kushwaha et al. (2017) Kushwaha P., Gupta A. C., Misra R., Singh K. P., 2017, MNRAS, 464, 2046
- Liao et al. (2014) Liao N. H., Bai J. M., Liu H. T., Weng S. S., Chen L., Li F., 2014, ApJ, 783, 83
- MacDonald et al. (2015) MacDonald N. R., Marscher A. P., Jorstad S. G., Joshi M., 2015, ApJ, 804, 111
- Mannheim (1993) Mannheim K., 1993, A&A, 269, 67
- Mao et al. (2016) Mao P., Urry C. M., Massaro F., Paggi A., Cauteruccio J., Künzel S. R., 2016, ApJS, 224, 26
- Marscher & Gear (1985) Marscher A. P., Gear W. K., 1985, ApJ, 298, 114
- Mattox et al. (1996) Mattox J. R., et al., 1996, ApJ, 461, 396
- Mücke & Protheroe (2001) Mücke A., Protheroe R. J., 2001, Astroparticle Physics, 15, 121
- Mücke et al. (2003) Mücke A., Protheroe R. J., Engel R., Rachen J. P., Stanev T., 2003, Astroparticle Physics, 18, 593
- Nolan et al. (2012) Nolan P. L., et al., 2012, ApJS, 199, 31
- Paliya et al. (2015a) Paliya V. S., Stalin C. S., Ravikumar C. D., 2015a, AJ, 149, 41
- Paliya et al. (2015b) Paliya V. S., Sahayanathan S., Stalin C. S., 2015b, ApJ, 803, 15
- Paliya et al. (2016) Paliya V. S., Diltz C., Böttcher M., Stalin C. S., Buckley D., 2016, ApJ, 817, 61
- Patiño-Álvarez et al. (2018) Patiño-Álvarez V. M., et al., 2018, MNRAS, 479, 2037
- Peterson et al. (2004) Peterson B. M., et al., 2004, ApJ, 613, 682
- Raiteri et al. (2011) Raiteri C. M., et al., 2011, A&A, 534, A87
- Sahayanathan & Godambe (2012) Sahayanathan S., Godambe S., 2012, MNRAS, 419, 1660
- Sahayanathan et al. (2018) Sahayanathan S., Sinha A., Misra R., 2018, Research in Astronomy and Astrophysics, 18, 035
- Shah et al. (2017) Shah Z., Sahayanathan S., Mankuzhiyil N., Kushwaha P., Misra R., Iqbal N., 2017, MNRAS, 470, 3283
- Sikora et al. (1994) Sikora M., Begelman M. C., Rees M. J., 1994, ApJ, 421, 153
- Smith et al. (2009) Smith P. S., Montiel E., Rightley S., Turner J., Schmidt G. D., Jannuzi B. T., 2009, preprint, (arXiv:0912.3621)
- Urry & Padovani (1995) Urry C. M., Padovani P., 1995, PASP, 107, 803
- Vercellone et al. (2009) Vercellone S., et al., 2009, ApJ, 690, 1018
- Vercellone et al. (2010) Vercellone S., et al., 2010, ApJ, 712, 405
- Vercellone et al. (2011) Vercellone S., et al., 2011, ApJ, 736, L38
- Vittorini et al. (2014) Vittorini V., Tavani M., Cavaliere A., Striani E., Vercellone S., 2014, ApJ, 793, 98
- Vovk & Neronov (2016) Vovk I., Neronov A., 2016, A&A, 586, A150
- Wagner & Witzel (1995) Wagner S. J., Witzel A., 1995, ARA&A, 33, 163