Early deafness leads to re-shaping of global functional connectivity beyond the auditory cortex
Abstract
Early sensory deprivation such as blindness or deafness shapes brain development in multiple ways. While it is established that deprived brain areas start to be engaged in the processing of stimuli from the remaining modalities and in high-level cognitive tasks, some reports have also suggested the possibility of structural and functional changes in non-deprived brain areas. We compared resting-state functional network organization of the brain in early-deaf adults and hearing controls by examining global network segregation and integration. Relative to hearing controls, deaf adults exhibited an altered modular organization, with regions of the salience network coupled with the fronto-parietal network. They showed weaker connections between auditory and somatomotor regions, stronger coupling between the fronto-parietal network and several other large-scale networks (visual, memory, cingulo-opercular and somatomotor), and an enlargement of the default mode network. Their overall functional segregation of brain networks was also lower. Our findings suggest that brain plasticity in deaf adults is not limited to changes in auditory cortex but additionally alters the coupling between other large-scale networks. These widespread functional connectivity changes may provide a mechanism for the superior behavioral performance of the deaf in visual and attentional tasks.
Keywords: brain plasticity, deafness, functional connectivity, graph theory, resting-state fMRI.
INTRODUCTION
The lack of input from one sensory modality profoundly impacts brain development (Rauschecker et al.,, 1995; Bavelier and Neville,, 2002; Merabet and Pascual-Leone,, 2010). First, a large body of data shows that the deprived brain regions become involved in the processing of stimuli from remaining modalities. Following deafness, the auditory cortex becomes involved in tactile (Lessard et al.,, 1998; Karns et al.,, 2012; Auer Jr et al.,, 2007) and visual (Petitto et al.,, 2000; Finney et al.,, 2001, 2003; Dewey and Hartley,, 2015; Bola et al.,, 2017; Scott et al.,, 2014) processing, while following blindness the visual cortex becomes involved in tactile (Held et al.,, 1996; Sadato et al.,, 1998) and auditory (Alho et al.,, 1993; Kujala et al.,, 1997; Lessard et al.,, 1998; Kujala et al.,, 2005) processing. Second, sensory deprived areas can also become engaged in higher-level cognitive tasks such as sign language processing (Nishimura et al.,, 1999; MacSweeney et al.,, 2002; Sadato et al.,, 2004), speechreading (MacSweeney et al.,, 2001; Capek et al.,, 2008), visual attention (Bavelier et al.,, 2001) and visuo-spatial working memory (Ding et al.,, 2015) in the deaf and speech processing (Röder et al.,, 2002; Burton et al.,, 2002; Burton,, 2003; Amedi et al.,, 2003; Burton et al.,, 2006; Bedny et al.,, 2015), syntax processing (Bedny et al.,, 2015; Lane et al.,, 2015; Bedny,, 2017), mathematical thinking (Kanjlia et al.,, 2016) and verbal memory (Amedi et al.,, 2003) in the blind. This functional reorganization has been associated with anatomical changes in sensory deprived areas (Emmorey et al.,, 2003; Jiang et al.,, 2009).
Alterations in the brain structure and function of blind or deaf individuals are not restricted to sensory deprived areas. In the blind, besides a volume reduction in the visual cortex, several studies have reported an enlarged auditory cortex (Elbert et al.,, 2002), hippocampus (Fortin et al.,, 2008) and frontal brain areas (Leporé et al.,, 2009). In the deaf, researchers found an increased volume of the frontal areas (Leporé et al.,, 2010) and of the insula (Allen et al.,, 2008). Moreover, deaf individuals showed an increased recruitment of multimodal parietal and occipital areas during performance of attention tasks (Neville and Lawson,, 1987; Bavelier et al.,, 2000, 2001; Armstrong et al.,, 2002; Finney et al.,, 2003), and an increased recruitment of the insula, anterior cingulate and thalamus during verbal memory tasks (Bavelier et al.,, 2008). As the presented evidence suggests, changes caused by deprivation of sensory input are not limited to the corresponding domain-specific cortices, e.g. the primary auditory cortex in deafness. However, the possible impact of these changes on whole-brain network organization has not received adequate attention.
Resting-state fMRI (rsfMRI) offers a solution to investigate whole-brain functional network organization with no explicit task requirements (Van Den Heuvel and Pol,, 2010). Using rsfMRI data, one can estimate functional connectivity (FC) between different brain areas by measuring the temporal dependence of the low-frequency ( 0.1 Hz) MRI signal fluctuations among them (Friston et al.,, 1993; Biswal et al.,, 1995). Studies on early-blind subjects reported both enhancement and attenuation of functional connections. In the blind, FC enhancement was found between the visual and language networks (Liu et al.,, 2007; Bedny et al.,, 2011) and between the visual cortex and regions associated with memory and cognitive control (Burton et al.,, 2014); weakened connections were found mostly between the visual and somatosensory networks, and between the motor and auditory networks (Liu et al.,, 2007). Studies on deaf individuals found an increased FC of the right auditory cortex (superior temporal gyrus, STG) with key nodes of the salience network such as the anterior insula and the dorsal anterior cingulate cortex (dACC) (Ding et al.,, 2016). Increased resting-state FC was also reported between the right superior parietal gyrus (rSPG) and the right insula, and between the middle temporal gyrus and the posterior cingulate gyrus (Li et al.,, 2016); this indicates that changes in connectivity can occur beyond the deprived auditory cortex.
Graph theoretical measures of rsfMRI functional connectivity provide an effective way to describe and understand the organizational features of brain networks in health, disease and throughout development (He and Evans,, 2010). To the best of our knowledge, only one study so far has used graph theory measures on rsfMRI data in early-deaf adults (Li et al.,, 2016). In the whole brain analysis, Li and colleagues reported hub regions in the frontal and parietal cortices in the deaf but not in the control group. However, the authors did not examine network integration or modular organization, measures commonly applied to characterize plasticity during development (Chen and Deem,, 2015) and following brain injury (Nakamura et al.,, 2009). Brain network integration can be interpreted as the overall efficiency in exchanging information, whereas modular organization describes the propagation and processing of local information. Thus, the question of the level of integration and segregation of functional networks in early-deaf adults remains unanswered.
The goal of the present study was to examine differences between the whole-brain functional networks of early-deaf and hearing adults. We sought to compare whole-brain connectivity patterns between these two groups, focusing on differences in the strength of functional association between individual brain regions as well as graph measures of the segregation and integration of the entire network (Sporns,, 2013; Van Den Heuvel and Pol,, 2010). We hypothesized that deaf adults have increased integration of multiple cortical areas. Specifically, we expected to find differences in the connection strength beyond the auditory network.
METHOD
Participants
Twenty-five early-deaf subjects (15 females; Mage = 27.8 5.2; range 19-37 years) and 29 hearing subjects (16 females; Mage = 27.2 4.7; range 19-37 years) participated in the study. All subjects were right-handed with normal or corrected to normal vision and no neurological or psychiatric diseases. Four deaf subjects and eight hearing subjects were excluded from further analyses due to excessive motion (more than 10% of outlier scans identified by a scrubbing procedure; see Data Processing section) or image acquisition errors. After exclusion, the deaf group consisted of 21 subjects (14 females; Mage = 26.6 4.8; range 19-37 years) and hearing group of 21 subjects (14 females; Mage = 26.6 5.2; range 19-37 years). The groups did not differ in age, sex or years of education. The etiology of deafness was either genetic (hereditary deafness) or pregnancy-related (maternal disease or drug side effects). The mean hearing loss was 100.2 dB (range 70–120 dB) for the left ear and 101.4 dB (60–120 dB) for the right ear. All subjects had some experience with hearing aids (currently or in the past) but did not rely on them on a daily basis. All subjects were proficient users of Polish Sign Language (polski język migowy, PJM, a natural visual-gestural language used by the deaf community in Poland; see Table S1 for details). Written informed consent was obtained from each participant. During the study, deaf subjects were assisted by a PJM interpreter. The research project was approved by the Committee for Research Ethics of the Institute of Psychology of Jagiellonian University, in accordance with the Declaration of Helsinki.
Data acquisition
Neuroimaging data were collected using Siemens MAGNETOM Tim Trio 3T scanner with a 32-channel head coil (Erlangen, Germany). Resting-state functional images covering the whole brain were acquired with a gradient-echo planar imaging (EPI) sequence (33 axial slices in interleaved ascending order; repetition time (TR) = 2190 ms; echo time (TE) = 30 ms, flip angle = 90∘; field of view (FOV) = 192; matrix size = 64 64; slice thickness = 3.6 mm; voxel size = 3 3 3.6 mm). During the 10-minute resting-state run, 282 volumes were obtained for each subject. Participants were instructed to relax and focus on the fixation point displayed on the screen. Communication with deaf subjects in the scanner was provided in PJM via webcam video. High-resolution T1-weighted images were acquired using a magnetization-prepared rapid acquisition gradient echo (MPRAGE) sequence (176 slices; TR = 2530 ms; TE = 3.32; flip angle = 7∘; FOV = 256; voxel size = 1 1 1 mm).
Data processing
Neuroimaging data were preprocessed using the SPM12 toolbox (Wellcome Department of Imaging Neuroscience, Institute of Neurology, London, UK) running on MATLAB 8.3 (R2014a) (Mathworks, Natick, MA). First, resting-state functional images were corrected for acquisition time (slice-timing) and spatially realigned to the mean image using rigid body registration. Next, outlier scans with a mean signal higher than 3 SD and frame-displacement (FD) higher than 0.5 mm were identified using the Artifact Detection Toolbox (ART; \urlhttp://www.nitrc.org/projects/artifact_detect/). Only subjects with less than 10% of outlier scans detected were included in the subsequent analysis. There was no significant difference between the deaf and the control group in the mean motion ((39.85) = -0.37; = 0.71) and the number of outlier scans detected ((31.93) = -0.62; = 0.54).
Then, the structural image was coregistered to the first functional volume and functional images, gray matter, white matter (WM), and cerebrospinal fluid were normalized to the MNI space (voxel size: 2 2 2 mm) using a unified normalization-segmentation algorithm (Ashburner and Friston,, 2005).
Further data processing for the purpose of functional connectivity analysis was performed using the CONN Functional Connectivity Toolbox v. 17.f (Whitfield-Gabrieli and Nieto-Castanon,, 2012) (\urlhttp://www.nitrc.org/projects/conn/). The anatomical component correction (aCompCor) strategy was used to estimate and remove physiological noise (Behzadi et al.,, 2007). The principal components of the subject-specific WM, cerebrospinal fluid, as well as outlier scans detected by the ART procedure and the six rigid-body motion parameters (and their first level temporal derivatives) were removed in covariate regression analysis (Whitfield-Gabrieli and Nieto-Castanon,, 2012). Finally, the resting-state time series were filtered using a 0.008–0.09 Hz band-pass filter to remove the effect of high-frequency noise and low-frequency drift.
Network construction
A brain parcellation containing 264 regions of interests (ROIs) provided by functional neuroimaging data meta-analysis (Power et al.,, 2011) was selected to construct correlation matrices for the purpose of the whole-brain network analysis. This brain parcellation was extensively validated on other datasets and was used to divide the 264 ROIs into 13 large-scale networks (LSNs) (Power et al.,, 2011; Cole et al.,, 2014). Each ROI was modeled as a 10 mm diameter sphere centered around the coordinates listed by Power et al. (Power et al.,, 2011). Six ROIs (four cerebellar ROIs and two ROIs covering the inferior temporal gyrus) were excluded from analysis due to incomplete coverage of the brain in some participants. Denoised functional time series were extracted from the remaining ROIs and Pearson’s correlation coefficients were calculated for each pair of regions. This resulted in one 258 258 correlation matrix for each participant. Finally, Fisher’s transformation was used to normalize Pearson’s correlation coefficients into z-scores.
Edge-wise comparisons
We aimed to identify functional connections for which the connection strength was either increased or decreased in the deaf group in comparison to the control group. We used a mass univariate approach by independently testing each of the m = 33153 functional connections for difference in connectivity strength between deaf and control subjects with a two-tailed t-test. Then, we estimated associated p-values and corrected with false discovery rate (FDR), using bootstrap method with Nper = 10000 permutations (Genovese et al.,, 2002).
Whole-brain graph measures
In order to determine if functional brain networks exhibit different topological properties in hearing versus deaf subjects, for each participant we created a weighted, undirected graph by proportionally thresholding the functional connectivity matrix to retain the top 10-25% functional connections (with a step of 5%). Here we present the results for the remaining 25% of connections. As graph metrics depend on network cost (sum of connection strengths) (Rubinov and Sporns,, 2011), we normalized them – on a subject level – against a set of randomly rewired null networks (Maslov and Sneppen,, 2002). Specifically, for each functional network we created 100 null networks with preserved size and degree distribution, and random topology. Then, to estimate null distributions of network metrics we calculated them for respective set of null networks. Finally, we normalized each functional network metric by dividing it by the mean value of the corresponding null distribution. We focused on two widely used graph metrics of network segregation and integration: modularity and global efficiency. All graph measures were calculated using the Brain Connectivity Toolbox (Rubinov and Sporns,, 2010).
The modularity of a network quantifies the extent to which it can be divided into modules. Informally, module is densely interconnected set of nodes sparsely connected with the rest of the network (Newman,, 2006). For a weighted network, modularity is calculated by maximizing the modularity quality function:
where is a weighted connection strength between nodes and , is the cost of the network , is the strength of a node, and is the Kronecker delta that equals 1 when nodes i and j belong to the same community and 0 otherwise. To find the community structure by maximizing , we ran the Louvain algorithm (Blondel et al.,, 2008) 100 times per network, and considered the division that yielded the highest modularity value.
Global efficiency enabled us to quantify a network integration by measuring the length of shortest paths between pairs of network nodes. In a weighted network the shortest path can be calculated as the path with a smallest sum of inverse weights, since the stronger connections are intuitively associated with more efficient communication. Formally, weighted global efficiency is given by:
where is shortest weighted path length between and .
To test whether graph metrics differ between deaf and hearing groups we used the non-parametric Wilcoxon rank sum test (Wilcoxon,, 1945).
Large-scale brain networks
To assess more general differences of the large-scale brain systems between hearing and deaf participants we examined the modular structure of the functional networks in both groups. For each group, we created a single representative network by averaging connection strengths across subjects. To eliminate insignificant connections in each group-averaged connection matrix we calculated the significance of the connection strength against zero. Assessed p-values were corrected using the false discovery rate (FDR) method for both groups separately (Genovese et al.,, 2002). Connections that survived thresholding, i.e. those with p 0.05, were retained in the group-averaged connection matrix. Next, to establish a representative modular structure, we ran the Louvain algorithm 1,000 times for both group-averaged networks and considered runs that produced divisions with the highest modularity value. Finally, we compared the modular structure in the deaf and hearing group with the large-scale network division revealed by resting-state meta-analysis (Power et al.,, 2011; Cole et al.,, 2014).
In order to quantify our findings, we calculated the overlap coefficient between empirically found modules and well-known large-scale brain systems. Overlap coefficient is a measure of similarity between two overlapping sets. Here, as sets we consider subsets of nodes grouped together in large-scale module. Formally, for two sets A and B overlap coefficient is given as
where denotes the number of elements of the set. Note that the overlap coefficient equals one for every pair of sets that or .
RESULTS
Edge-wise whole-brain differences between the deaf and hearing
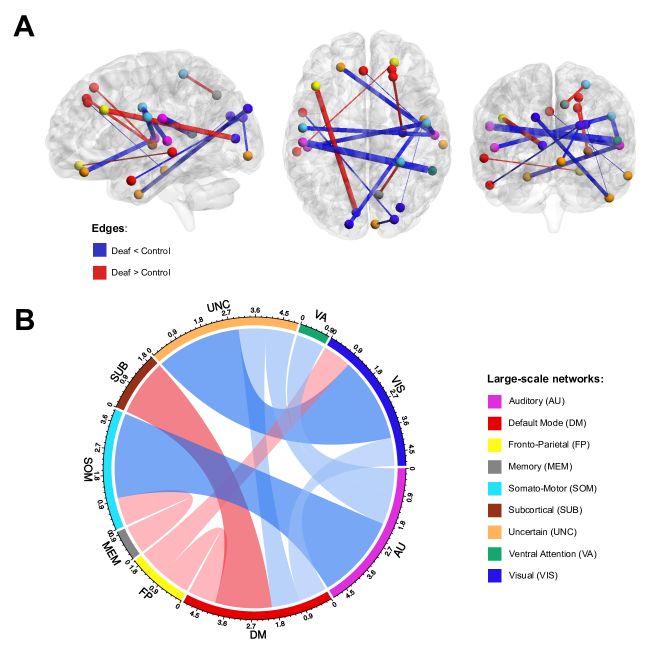
We compared the strength of all pairwise functional connections (edges) between 258 ROIs in the deaf versus the control group. These comparisons revealed 10 weaker and 5 stronger connections in early-deaf adults (Fig. 1, FDR corrected 0.05). Weaker connections in the deaf relative to the controls were found mostly between the auditory and somatomotor networks, as well as between the visual network and regions not assigned to any large-scale networks. Interestingly, stronger connections in the deaf were found between regions beyond the auditory network. These included two enhanced connections between the default mode network and the subcortical network. Enhanced connections were also found between the fronto-parietal and default-mode networks, between the fronto-parietal and visual networks and between the memory and somatomotor networks (see Fig. 1b for edge counts after large-scale network assignment).
Differences in whole-brain graph measures
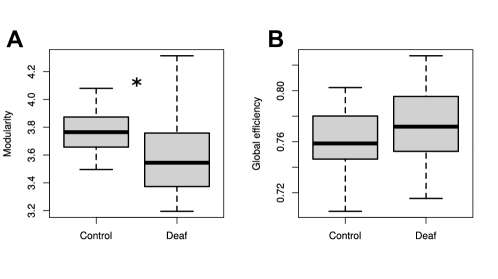
Functional brain network topology is believed to support an optimal balance between functional segregation and integration enabling complex network dynamics (Tononi et al.,, 1994). These two network features can be captured using two graph theory measures: modularity index for segregation (Newman,, 2006) and global efficiency for integration (Latora and Marchiori,, 2001). Here, we tested whether these measures differ between deaf and hearing subjects (Fig. S1). Analysis performed on brain graphs parcellated with 258 functional ROIs revealed significant differences in network modularity ( = -2.36; = 0.019, Wilcoxon rank sum test, see Methods) between the two groups. Whole-brain modularity was lower in deaf participants (=3.50; () = 0.31) than in hearing participants ( = 3.65; () = 0.14 Wilcoxon rank sum test). A significant difference in modularity was also observed for functional networks constructed for all threshold values ( 0.05). The difference in functional network integration measured as global efficiency ( = 1.26; = 0.21, Wilcoxon rank sum test) was not significant. Taken together, these results imply that functional brain networks in early-deaf adults are less segregated than those in hearing adults.
Group-average modular organization
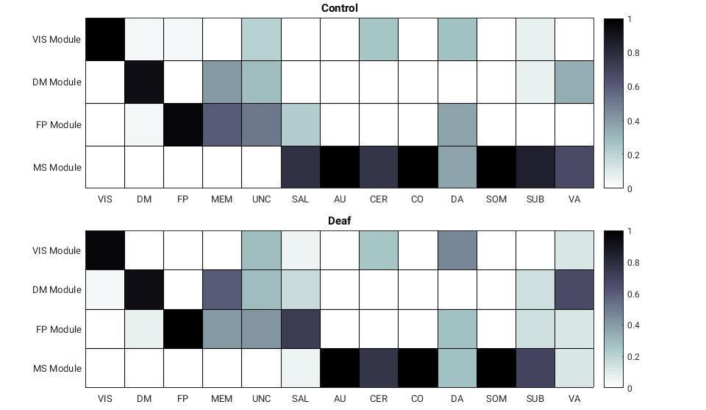
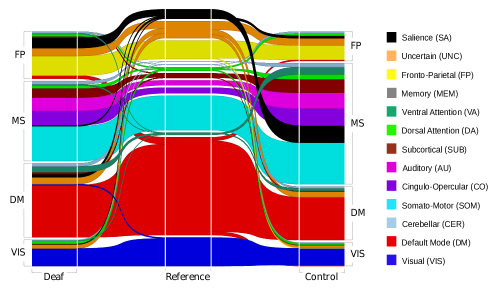
In the analysis that followed we assessed the modular division of the group-averaged networks using a data-driven approach(Blondel et al.,, 2008) (see Methods). We found that for both groups this approach returned a connectivity structure arranged into four large-scale functional modules (Fig. 3, Fig. S1): the fronto-parietal (FP) module, the multi-system (MS) the default mode module (DM) and the visual module (VIS). In both groups we then analyzed the overlap of these four modules with 13 well-known large-scale networks (LSNs) that were defined a priori based on meta-analyses (Power et al.,, 2011; Cole et al.,, 2014)) (Fig. 3) by calculating an overlap coefficient between the data-driven modules and all 13 LSNs. In this analysis, an overlap coefficient of 100% means that a given network (for example, the somatomotor network) is completely included in a given module (for example, the multi-system module). The first module, the fronto-parietal module, consisted mostly of regions from the fronto-parietal network (overlap in the deaf group (, ) = 100%; overlap in the control group (, ) = 96%). This module had a significantly different composition in the deaf as compared to the control group. In the deaf, the salience network was associated almost exclusively with the fronto-parietal network within the fronto-parietal module (overlap in the deaf group (, ) = 72.2%). In the hearing group, however, the fronto-parietal module made only a small contribution to the salience network nodes (overlap in the control group (, ) = 22.2%), which turned out to be predominantly associated with the multisystem module (Fig. 3, black). The second module (referred to here as the multi-system module) was the largest and most diverse module ( = 78; = 99). In the control group, it was composed of the somatomotor, salience, auditory, cingulo-opercular, ventral-attention, subcortical and cerebellum nodes (overlap > 66%). In the deaf group, however, this module did not include the salience and ventral-attention networks (overlap(, ) = 5.5%; overlap (, ) = 11.1%) which were associated with other modules, i.e. the salience network with the fronto-parietal module, and the ventral attentional network with the default mode module. The third module, the default mode module, had a very high overlap with the default mode network (overlap in the deaf group (, ) = 93%, overlap in the control group (, ) = 93%). It consisted of 75 nodes in the deaf group and 66 nodes in the control group. The default mode module was larger in the deaf group as a result of large contribution from the ventral-attention (overlap the deaf group (,) = 66.7%) and memory network nodes (overlap in the deaf group (,) = 60%), which, as mentioned previously, in the hearing group were mostly part of the multi-system module. The last module, the visual module, was the most consistent in both groups (overlap(, ) = 88.6%; = 44; = 45). In both groups it was composed primarily from visual network nodes. In agreement with the previous modularity analysis, we also found that the group-averaged functional network was less modular in the deaf group than in the hearing group ( = 0.4571; = 0.4748).
DISCUSSION
In this study we investigated the whole-brain functional organization differences between early-deaf and hearing adults. Deaf adults exhibited weaker connection strengths, especially between the auditory and the somatomotor networks. Besides changes in the functional connectivity of auditory regions, we also found pronounced connectivity differences between regions located outside of the auditory system. These differences included a stronger functional connectivity between the fronto-parietal network and other large-scale networks (salience, visual, memory, cingulo-opercular and somatomotor, default mode) and between the default mode and the subcortical network in deaf adults. Using graph theoretical measures, we showed that deaf adults had a less segregated (modular) network. We also found different modular organization of functional networks in deaf subjects. Differences were pronounced for the salience and ventral-attention systems: in the control group they were part of a multi-system module, but in the deaf they were coupled with the fronto-parietal and default-mode modules. These results suggest that compensatory brain plasticity in sensory loss is a combination of changes in the sensory-deprived brain areas themselves and changes beyond this in non-deprived brain areas.
Reduced functional connectivity between auditory and somatomotor areas
In the deaf, we observed reduced functional connectivity between auditory and somatomotor areas (Fig. 1). Previous results showed cross-modal plasticity of the auditory cortex and its engagement in tactile (Auer Jr et al.,, 2007; Levänen et al.,, 1998; Karns et al.,, 2012) and visual processing (Petitto et al.,, 2000; Finney et al.,, 2001, 2003; Scott et al.,, 2014; Dewey and Hartley,, 2015; Bola et al.,, 2017). One may intuitively expect that this cross-modal plasticity could be expressed in enhanced functional connections between the auditory and somatomotor networks. However, functional connectivity results are not always consistent with results of task-based fMRI studies, and these two approaches might reveal different properties of brain organization (Gratton et al.,, 2016; Khambhati et al.,, 2017). While task-related activations of the auditory cortex in deaf individuals or the visual cortex in blind individuals during tactile processing were consistently found in previous studies (Levänen et al.,, 1998; Karns et al.,, 2012; Held et al.,, 1996; Sadato et al.,, 1998; Auer Jr et al.,, 2007), none of the existing functional connectivity studies have reported increased connectivity between the somatomotor cortex and sensorially deprived areas in deaf or blind individuals (Liu et al.,, 2007; Burton et al.,, 2014; Ding et al.,, 2016; Li et al.,, 2016). Moreover, some studies have demonstrated that blind individuals have weakened functional connections between the visual and somatosensory and motor networks, which is strongly consistent with our results on deaf individuals (Liu et al.,, 2007). Recent evidence revealed a very similar effect of weakened connectivity between somatomotor and deprived auditory cortices in deaf cats (Butler et al.,, 2018). Liu and colleagues (Liu et al.,, 2007) interpreted their finding of weakened connectivity between sensory deprived areas and the somatomotor network in terms of general loss hypothesis (Pascual-Leone et al.,, 2005). According to this hypothesis, the functional organization of the sensory deprived brain may be generally disrupted because of the lack of sensory input. However, many studies on early sensory deprivation do not support this notion (Bavelier and Neville,, 2002; Merabet et al.,, 2005) (Théoret et al.,, 2004; Pascual-Leone et al.,, 2005). Here, we propose a different explanation for our findings in terms of the neural efficiency hypothesis (Neubauer and Fink,, 2009). According to this hypothesis, less engagement of certain brain areas during task processing may indicate that the task is performed more automatically, with less energy consumption. In the context of functional connectivity, learning a new skill can be associated with a reduced connectivity between areas associated with the trained domain (Kelly and Castellanos,, 2014; Bassett et al.,, 2015; Yoo et al.,, 2013; Wang et al.,, 2016). For example, Yoo et al.(Yoo et al.,, 2013) reported decreased functional connectivity between the parietal cortex and the motor system after 8 weeks of practicing using chopsticks with a non-dominant hand. Bassett et al. (Bassett et al.,, 2015) found that training of a visuomotor task is associated with reduced connectivity between the visual and motor networks, suggesting that these systems are autonomous in relation to task automatization. Also, Wang et al. (Wang et al.,, 2016) reported reduced functional connectivity of the somatomotor system in world-class gymnasts. In the case of deaf individuals, the trained skill may be related to the use of sign language to communicate and to superior tactile processing. Taken together, the reduced functional connectivity between the auditory and somatomotor areas in early-deaf adults may be linked to more efficient, automated sensorimotor processing rather than a general loss of connectivity.
Increased fronto-parietal connectivity in deafness
Besides the connectivity decreases outlined above, deaf subjects exhibited strengthened interconnections, notably with the frontoparietal system. Edge-wise analysis revealed an increased coupling between the fronto-parietal network and visual areas (Fig. 1). This coupling might support the higher need for visual attention resources in the deaf. While deaf subjects consistently outperform hearing subjects in several visual tasks (Scott et al.,, 2014; Dewey and Hartley,, 2015) this occurs almost exclusively under conditions of high attentional load (Heimler et al.,, 2017). We speculate that enhanced connectivity between the sensory and fronto-parietal networks may provide the neural basis for visual compensation mechanisms. The altered functional role of the fronto-parietal system and the enhanced visual–fronto-parietal interconnections may constitute the neural basis for the congenitally deaf’s superior performance in both sensory attention and visual working memory.
Decreased modularity of functional networks in deafness
Modularity of whole-brain functional networks was lower in deaf subjects compared to hearing controls, thus indicating disrupted boundaries between functionally specialized systems following early deafness (Fig. S1). Our findings provide the first evidence of an altered modular organization of functional networks in sensory deprived subjects. Several studies reported disrupted modular organization associated with healthy aging (Song et al.,, 2012; Geerligs et al.,, 2014), adolescence (Fair et al.,, 2009), childhood-onset schizophrenia (Alexander-Bloch et al.,, 2010) and autism spectrum disorder (Rudie et al.,, 2013). Other studies reported increased modularity in patients with major depressive disorder (Ye et al.,, 2015) or attention-deficit/hyperactivity disorder (Lin et al.,, 2014). Here, for the first time we show that sensory deprivation may reduce modularity at the global brain network level. These results suggest that sensory deprivation can lead to a blurring of the lines between specialized brain subsystems, while network integration (measured as global efficiency) remaining at the same level as in normally developing individuals.
Coupling of salience and fronto-parietal networks in deafness
Our study found that that the salience network was associated with the fronto-parietal network in the deaf group, but not in the control group. Consistently with our results, in congenitally and early blind subjects the salience network has previously been shown to exhibit stronger resting-state functional connectivity with fronto-parietal regions than in the sighted population (Wang et al.,, 2014). The effect revealed in our study may thus be a general consequence of early sensory deprivation.
The salience network is responsible for identifying behaviorally important stimuli, forwarding them to the executive functions network, and mediating higher order cognitive processes (Seeley et al.,, 2007). Its functional association with fronto-parietal structures plays a role in working memory processing. Activity of the salience network is gradually enhanced with increased working memory load, and this enhancement correlates positively with working memory task performance (Liang et al.,, 2015). It can be therefore inferred that its strengthened association with the fronto-parietal module in deafness reflects the enhanced working memory abilities reported in early sensory deprivation.
In line with this interpretation, task-based studies reveal the specifically important role the salience network can play in deafness for working-memory-related functions. When compared with the hearing, deaf subjects recruit the salience network more strongly for short-term verbal memory tasks (Bavelier et al.,, 2008) and exhibit stronger functional connectivity between salience and auditory structures when processing a visual working memory task (Ding et al.,, 2016). Additionally, deaf subjects have increased gray and white matter within the salience network (Allen et al.,, 2008), and this structural reinforcement has been suggested to contribute to sign language processing (Kassubek et al.,, 2004).
Altered connectivity of default mode network in deafness
Our results show differences in the default mode network (DMN) connectivity in the deaf. Whole-brain network analysis revealed that in the deaf the DMN has strengthened connections with the subcortical network and the fronto-parietal network, and a weakened connection with the visual system (Fig. 1). Moreover, we found that the default mode module in the deaf includes the ventral attention system. In the hearing, in contrast, the ventral attention system is coupled with the multi-system module (Fig. 3).
The exact role of the DMN is debatable. Some studies provide evidence that it is associated with internally directed cognitive processing such as mind-wandering or autobiographical memory (Buckner et al.,, 2008). The DMN is also often referred to as a task-negative network due to its anticorrelation with networks related to attentional processing (Fox et al.,, 2005). However, a new wave of research provides evidence for an integrative role of the DMN which may be crucial for higher cognitive functions (Vatansever et al.,, 2015; Margulies et al.,, 2016; Finc et al.,, 2017)). In line with this research, stronger connectivity between the DMN and the subcortical and fronto-parietal networks may suggest that the DMN is engaged in network integration that is necessary to compensate for sensory deficits.
The ventral attention system is typically recruited by infrequent or unexpected events that are behaviorally relevant, and has been implicated in stimulus-driven, involuntary attentional control (Corbetta and Shulman,, 2002). Therefore, it is plausible that its closer association with the DMN in the deaf corresponds to an easier and faster transition between resting state and the action in response to the unexpected input. The ability to shift quickly from rest to action seems to be particularly adaptive in an environment lacking auditory input, as one must deal with a constrained field of view and higher latency in response time for vision.
Compensatory mechanisms lead deaf people to outperform hearing individuals in certain visual tasks, especially when the location or the exact time of the onset of the stimulus is unknown (Bavelier et al.,, 2006), or when the stimulus appears outside the central visual field. The lack of auditory signal is compensated for in the deaf by enhanced peripheral visual attention (Lore and Song,, 1991; Neville and Lawson,, 1987; Stevens and Neville,, 2006). These effects make deaf subjects more distractible by peripheral visual input (Proksch and Bavelier,, 2002), which may enable them to detect unexpected stimulus more quickly and respond to unpredicted cues in sign language. On the more general level, deaf subjects manifest consistently lower response time to visual input across a variety of visual tasks (Pavani and Bottari,, 2012). The enhanced coupling between resting-state DMN and the ventral attention system in the deaf could thus reflect their general higher reactivity to visual stimuli in deafness as well as more specific capacities in visual attention.
Overall, our results show substantial differences in the functional brain network organization between early-deaf and hearing adults. We have shown that deaf adults have reduced coupling between the auditory and the visual cortex. However, we also found multiple differences in functional connectivity beyond the auditory network, including the fronto-parietal, default-mode and salience networks. These results suggest that changes in brain connections related to sensory deprivation are not limited to the deprived cortices, but manifest themselves in altered connectivity across the entire brain network.
Acknowledgements
Study supported by National Science Centre grants no 2015/19/B/HS6/01256 and 2016/21/B/HS6/03703 to M. S., P. M. and P. R. were supported under the National Programme for the Development of Humanities of the Polish Ministry of Science and Higher Education (0111/NPRH3/H12/82/2014). K. F. was supported by National Science Centre (2017/24/T/HS6/00105) and and Foundation for Polish Science, Poland (START 23.2018). The study was conducted with the aid of CePT research infrastructure purchased with funds from the European Regional Development Fund as part of the Innovative Economy Operational Programme, 2007–2013. We thank Karolina Dukała for administrative assistance, and Michael Timberlake for language editing.
Author contributions statement
K.B. and K.F. analyzed data; K.B., K.F, M.Z., and M.S. wrote manuscript; Ł.B., M.Z., and M.S. designed research and Ł.B., M.Z., P.M., K.J., A.M., P.R., and M.S. performed research; W.D. reviewed manuscript.
Additional information
Data availability
The datasets generated and analysed during the current study are available from the corresponding author on request.
Competing interests
The authors declare no competing interests.
References
- Alexander-Bloch et al., (2010) Alexander-Bloch, A. F., Gogtay, N., Meunier, D., Birn, R., Clasen, L., Lalonde, F., Lenroot, R., Giedd, J., and Bullmore, E. T. (2010). Disrupted modularity and local connectivity of brain functional networks in childhood-onset schizophrenia. Frontiers in Systems Neuroscience, 4:147.
- Alho et al., (1993) Alho, K., Kujala, T., Paavilainen, P., Summala, H., and Näätänen, R. (1993). Auditory processing in visual brain areas of the early blind: evidence from event-related potentials. Electroencephalography and Clinical Neurophysiology, 86(6):418–427.
- Allen et al., (2008) Allen, J. S., Emmorey, K., Bruss, J., and Damasio, H. (2008). Morphology of the insula in relation to hearing status and sign language experience. Journal of Neuroscience, 28(46):11900–11905.
- Amedi et al., (2003) Amedi, A., Raz, N., Pianka, P., Malach, R., and Zohary, E. (2003). Early ‘visual’cortex activation correlates with superior verbal memory performance in the blind. Nature Neuroscience, 6(7):758.
- Armstrong et al., (2002) Armstrong, B. A., Neville, H. J., Hillyard, S. A., and Mitchell, T. V. (2002). Auditory deprivation affects processing of motion, but not color. Cognitive Brain Research, 14(3):422–434.
- Ashburner and Friston, (2005) Ashburner, J. and Friston, K. J. (2005). Unified segmentation. NeuroImage, 26(3):839–851.
- Auer Jr et al., (2007) Auer Jr, E. T., Bernstein, L. E., Sungkarat, W., and Singh, M. (2007). Vibrotactile activation of the auditory cortices in deaf versus hearing adults. Neuroreport, 18(7):645.
- Bassett et al., (2015) Bassett, D. S., Yang, M., Wymbs, N. F., and Grafton, S. T. (2015). Learning-induced autonomy of sensorimotor systems. Nature Neuroscience, 18(5):744.
- Bavelier et al., (2001) Bavelier, D., Brozinsky, C., Tomann, A., Mitchell, T., Neville, H., and Liu, G. (2001). Impact of early deafness and early exposure to sign language on the cerebral organization for motion processing. Journal of Neuroscience, 21(22):8931–8942.
- Bavelier et al., (2006) Bavelier, D., Dye, M. W., and Hauser, P. C. (2006). Do deaf individuals see better? Trends in Cognitive Sciences, 10(11):512–518.
- Bavelier and Neville, (2002) Bavelier, D. and Neville, H. J. (2002). Cross-modal plasticity: where and how? Nature Reviews Neuroscience, 3(6):443.
- Bavelier et al., (2008) Bavelier, D., Newport, E. L., Hall, M., Supalla, T., and Boutla, M. (2008). Ordered short-term memory differs in signers and speakers: Implications for models of short-term memory. Cognition, 107(2):433–459.
- Bavelier et al., (2000) Bavelier, D., Tomann, A., Hutton, C., Mitchell, T., Corina, D., Liu, G., and Neville, H. (2000). Visual attention to the periphery is enhanced in congenitally deaf individuals. Journal of Neuroscience, 20(17):RC931–6.
- Bedny, (2017) Bedny, M. (2017). Evidence from blindness for a cognitively pluripotent cortex. Trends in Cognitive Sciences, 21(9):637–648.
- Bedny et al., (2011) Bedny, M., Pascual-Leone, A., Dodell-Feder, D., Fedorenko, E., and Saxe, R. (2011). Language processing in the occipital cortex of congenitally blind adults. Proceedings of the National Academy of Sciences, 108(11):4429–4434.
- Bedny et al., (2015) Bedny, M., Richardson, H., and Saxe, R. (2015). “visual” cortex responds to spoken language in blind children. Journal of Neuroscience, 35(33):11674–11681.
- Behzadi et al., (2007) Behzadi, Y., Restom, K., Liau, J., and Liu, T. T. (2007). A component based noise correction method (compcor) for bold and perfusion based fmri. NeuroImage, 37(1):90–101.
- Biswal et al., (1995) Biswal, B., Zerrin Yetkin, F., Haughton, V. M., and Hyde, J. S. (1995). Functional connectivity in the motor cortex of resting human brain using echo-planar mri. Magnetic Resonance in Medicine, 34(4):537–541.
- Blondel et al., (2008) Blondel, V. D., Guillaume, J.-L., Lambiotte, R., and Lefebvre, E. (2008). Fast unfolding of communities in large networks. Journal of Statistical Mechanics: Theory and Experiment, 2008(10):P10008.
- Bola et al., (2017) Bola, Ł., Zimmermann, M., Mostowski, P., Jednoróg, K., Marchewka, A., Rutkowski, P., and Szwed, M. (2017). Task-specific reorganization of the auditory cortex in deaf humans. Proceedings of the National Academy of Sciences, 114(4):E600–E609.
- Buckner et al., (2008) Buckner, R. L., Andrews-Hanna, J. R., and Schacter, D. L. (2008). The brain’s default network. Annals of the New York Academy of Sciences, 1124(1):1–38.
- Burton, (2003) Burton, H. (2003). Visual cortex activity in early and late blind people. Journal of Neuroscience, 23(10):4005–4011.
- Burton et al., (2006) Burton, H., McLaren, D., and Sinclair, R. (2006). Reading embossed capital letters: an fmri study in blind and sighted individuals. Human Brain Mapping, 27(4):325–339.
- Burton et al., (2002) Burton, H., Snyder, A. Z., Conturo, T. E., Akbudak, E., Ollinger, J. M., and Raichle, M. E. (2002). Adaptive changes in early and late blind: a fmri study of braille reading. Journal of Neurophysiology, 87(1):589–607.
- Burton et al., (2014) Burton, H., Snyder, A. Z., and Raichle, M. E. (2014). Resting state functional connectivity in early blind humans. Frontiers in Systems Neuroscience, 8:51.
- Butler et al., (2018) Butler, B. E., de la Rua, A., Ward-Able, T., and Lomber, S. G. (2018). Cortical and thalamic connectivity to the second auditory cortex of the cat is resilient to the onset of deafness. Brain Structure and Function, 223(2):819–835.
- Capek et al., (2008) Capek, C. M., MacSweeney, M., Woll, B., Waters, D., McGuire, P. K., David, A. S., Brammer, M. J., and Campbell, R. (2008). Cortical circuits for silent speechreading in deaf and hearing people. Neuropsychologia, 46(5):1233–1241.
- Chen and Deem, (2015) Chen, M. and Deem, M. W. (2015). Development of modularity in the neural activity of children’s brains. Physical biology, 12(1):016009.
- Cole et al., (2014) Cole, M. W., Bassett, D. S., Power, J. D., Braver, T. S., and Petersen, S. E. (2014). Intrinsic and task-evoked network architectures of the human brain. Neuron, 83(1):238–251.
- Corbetta and Shulman, (2002) Corbetta, M. and Shulman, G. L. (2002). Control of goal-directed and stimulus-driven attention in the brain. Nature reviews neuroscience, 3(3):201.
- Dewey and Hartley, (2015) Dewey, R. S. and Hartley, D. E. (2015). Cortical cross-modal plasticity following deafness measured using functional near-infrared spectroscopy. Hearing Research, 325:55 – 63.
- Ding et al., (2016) Ding, H., Ming, D., Wan, B., Li, Q., Qin, W., and Yu, C. (2016). Enhanced spontaneous functional connectivity of the superior temporal gyrus in early deafness. Scientific Reports, 6:23239.
- Ding et al., (2015) Ding, H., Qin, W., Liang, M., Ming, D., Wan, B., Li, Q., and Yu, C. (2015). Cross-modal activation of auditory regions during visuo-spatial working memory in early deafness. Brain, 138(9):2750–2765.
- Elbert et al., (2002) Elbert, T., Sterr, A., Rockstroh, B., Pantev, C., Müller, M. M., and Taub, E. (2002). Expansion of the tonotopic area in the auditory cortex of the blind. Journal of Neuroscience, 22(22):9941–9944.
- Emmorey et al., (2003) Emmorey, K., Allen, J. S., Bruss, J., Schenker, N., and Damasio, H. (2003). A morphometric analysis of auditory brain regions in congenitally deaf adults. Proceedings of the National Academy of Sciences, 100(17):10049–10054.
- Fair et al., (2009) Fair, D. A., Cohen, A. L., Power, J. D., Dosenbach, N. U., Church, J. A., Miezin, F. M., Schlaggar, B. L., and Petersen, S. E. (2009). Functional brain networks develop from a “local to distributed” organization. PLoS Computational Biology, 5(5):e1000381.
- Finc et al., (2017) Finc, K., Bonna, K., Lewandowska, M., Wolak, T., Nikadon, J., Dreszer, J., Duch, W., and Kühn, S. (2017). Transition of the functional brain network related to increasing cognitive demands. Human brain mapping, 38(7):3659–3674.
- Finney et al., (2003) Finney, E. M., Clementz, B. A., Hickok, G., and Dobkins, K. R. (2003). Visual stimuli activate auditory cortex in deaf subjects: evidence from meg. Neuroreport, 14(11):1425–1427.
- Finney et al., (2001) Finney, E. M., Fine, I., and Dobkins, K. R. (2001). Visual stimuli activate auditory cortex in the deaf. Nature Neuroscience, 4(12):1171.
- Fortin et al., (2008) Fortin, M., Voss, P., Lord, C., Lassonde, M., Pruessner, J., Saint-Amour, D., Rainville, C., and Lepore, F. (2008). Wayfinding in the blind: larger hippocampal volume and supranormal spatial navigation. Brain, 131(11):2995–3005.
- Fox et al., (2005) Fox, M. D., Snyder, A. Z., Vincent, J. L., Corbetta, M., Van Essen, D. C., and Raichle, M. E. (2005). The human brain is intrinsically organized into dynamic, anticorrelated functional networks. Proceedings of the National Academy of Sciences, 102(27):9673–9678.
- Friston et al., (1993) Friston, K., Frith, C., Liddle, P., and Frackowiak, R. (1993). Functional connectivity: the principal-component analysis of large (pet) data sets. Journal of Cerebral Blood Flow & Metabolism, 13(1):5–14.
- Geerligs et al., (2014) Geerligs, L., Renken, R. J., Saliasi, E., Maurits, N. M., and Lorist, M. M. (2014). A brain-wide study of age-related changes in functional connectivity. Cerebral Cortex, 25(7):1987–1999.
- Genovese et al., (2002) Genovese, C. R., Lazar, N. A., and Nichols, T. (2002). Thresholding of statistical maps in functional neuroimaging using the false discovery rate. NeuroImage, 15(4):870–878.
- Gratton et al., (2016) Gratton, C., Laumann, T. O., Gordon, E. M., Adeyemo, B., and Petersen, S. E. (2016). Evidence for two independent factors that modify brain networks to meet task goals. Cell reports, 17(5):1276–1288.
- He and Evans, (2010) He, Y. and Evans, A. (2010). Graph theoretical modeling of brain connectivity. Current Opinion in Neurology, 23(4):341–350.
- Heimler et al., (2017) Heimler, B., Baruffaldi, F., Bonmassar, C., Venturini, M., and Pavani, F. (2017). Multisensory interference in early deaf adults. The Journal of Deaf Studies and Deaf Education, 22(4):422–433.
- Held et al., (1996) Held, R., Freedman, S., and Harris, C. (1996). Activation of the primary visual cortex by braille reading in blind subjects. Nature, 380:11.
- Jiang et al., (2009) Jiang, J., Zhu, W., Shi, F., Liu, Y., Li, J., Qin, W., Li, K., Yu, C., and Jiang, T. (2009). Thick visual cortex in the early blind. Journal of Neuroscience, 29(7):2205–2211.
- Kanjlia et al., (2016) Kanjlia, S., Lane, C., Feigenson, L., and Bedny, M. (2016). Absence of visual experience modifies the neural basis of numerical thinking. Proceedings of the National Academy of Sciences, 113(40):11172–11177.
- Karns et al., (2012) Karns, C. M., Dow, M. W., and Neville, H. J. (2012). Altered cross-modal processing in the primary auditory cortex of congenitally deaf adults: a visual-somatosensory fmri study with a double-flash illusion. Journal of Neuroscience, 32(28):9626–9638.
- Kassubek et al., (2004) Kassubek, J., Hickok, G., and Erhard, P. (2004). Involvement of classical anterior and posterior language areas in sign language production, as investigated by 4 t functional magnetic resonance imaging. Neuroscience letters, 364(3):168–172.
- Kelly and Castellanos, (2014) Kelly, C. and Castellanos, F. X. (2014). Strengthening connections: functional connectivity and brain plasticity. Neuropsychology Review, 24(1):63–76.
- Khambhati et al., (2017) Khambhati, A. N., Sizemore, A. E., Betzel, R. F., and Bassett, D. S. (2017). Modeling and interpreting mesoscale network dynamics. NeuroImage.
- Kujala et al., (1997) Kujala, T., Lehtokoski, A., Alho, K., Kekoni, J., and Näätänen, R. (1997). Faster reaction times in the blind than sighted during bimodal divided attention. Acta psychologica, 96(1-2):75–82.
- Kujala et al., (2005) Kujala, T., Palva, M. J., Salonen, O., Alku, P., Huotilainen, M., Järvinen, A., and Näätänen, R. (2005). The role of blind humans’ visual cortex in auditory change detection. Neuroscience Letters, 379(2):127–131.
- Lane et al., (2015) Lane, C., Kanjlia, S., Omaki, A., and Bedny, M. (2015). “visual” cortex of congenitally blind adults responds to syntactic movement. Journal of Neuroscience, 35(37):12859–12868.
- Latora and Marchiori, (2001) Latora, V. and Marchiori, M. (2001). Efficient behavior of small-world networks. Physical review letters, 87(19):198701.
- Leporé et al., (2009) Leporé, N., Shi, Y., Lepore, F., Fortin, M., Voss, P., Chou, Y.-Y., Lord, C., Lassonde, M., Dinov, I. D., Toga, A. W., et al. (2009). Pattern of hippocampal shape and volume differences in blind subjects. NeuroImage, 46(4):949–957.
- Leporé et al., (2010) Leporé, N., Voss, P., Lepore, F., Chou, Y.-Y., Fortin, M., Gougoux, F., Lee, A. D., Brun, C., Lassonde, M., Madsen, S. K., et al. (2010). Brain structure changes visualized in early-and late-onset blind subjects. NeuroImage, 49(1):134–140.
- Lessard et al., (1998) Lessard, N., Paré, M., Lepore, F., and Lassonde, M. (1998). Early-blind human subjects localize sound sources better than sighted subjects. Nature, 395(6699):278.
- Levänen et al., (1998) Levänen, S., Jousmäki, V., and Hari, R. (1998). Vibration-induced auditory-cortex activation in a congenitally deaf adult. Current Biology, 8(15):869–872.
- Li et al., (2016) Li, W., Li, J., Wang, J., Zhou, P., Wang, Z., Xian, J., and He, H. (2016). Functional reorganizations of brain network in prelingually deaf adolescents. Neural Plasticity, 2016.
- Liang et al., (2015) Liang, X., Zou, Q., He, Y., and Yang, Y. (2015). Topologically reorganized connectivity architecture of default-mode, executive-control, and salience networks across working memory task loads. Cerebral Cortex, 26(4):1501–1511.
- Lin et al., (2014) Lin, P., Sun, J., Yu, G., Wu, Y., Yang, Y., Liang, M., and Liu, X. (2014). Global and local brain network reorganization in attention-deficit/hyperactivity disorder. Brain Imaging and Behavior, 8(4):558–569.
- Liu et al., (2007) Liu, Y., Yu, C., Liang, M., Li, J., Tian, L., Zhou, Y., Qin, W., Li, K., and Jiang, T. (2007). Whole brain functional connectivity in the early blind. Brain, 130(8):2085–2096.
- Lore and Song, (1991) Lore, W. H. and Song, S. (1991). Central and peripheral visual processing in hearing and nonhearing individuals. Bulletin of the Psychonomic Society, 29(5):437–440.
- MacSweeney et al., (2002) MacSweeney, M., Calvert, G. A., Campbell, R., McGuire, P. K., David, A. S., Williams, S. C., Woll, B., and Brammer, M. J. (2002). Speechreading circuits in people born deaf. Neuropsychologia, 40(7):801–807.
- MacSweeney et al., (2001) MacSweeney, M., Campbell, R., Calvert, G. A., McGuire, P. K., David, A. S., Suckling, J., Andrew, C., Woll, B., and Brammer, M. J. (2001). Dispersed activation in the left temporal cortex for speech-reading in congenitally deaf people. Proceedings of the Royal Society of London B: Biological Sciences, 268(1466):451–457.
- Margulies et al., (2016) Margulies, K. B., Hernandez, A. F., Redfield, M. M., Givertz, M. M., Oliveira, G. H., Cole, R., Mann, D. L., Whellan, D. J., Kiernan, M. S., Felker, G. M., et al. (2016). Effects of liraglutide on clinical stability among patients with advanced heart failure and reduced ejection fraction: a randomized clinical trial. Jama, 316(5):500–508.
- Maslov and Sneppen, (2002) Maslov, S. and Sneppen, K. (2002). Specificity and stability in topology of protein networks. Science, 296(5569):910–913.
- Merabet and Pascual-Leone, (2010) Merabet, L. B. and Pascual-Leone, A. (2010). Neural reorganization following sensory loss: the opportunity of change. Nature Reviews Neuroscience, 11(1):44.
- Merabet et al., (2005) Merabet, L. B., Rizzo, J. F., Amedi, A., Somers, D. C., and Pascual-Leone, A. (2005). What blindness can tell us about seeing again: merging neuroplasticity and neuroprostheses. Nature Reviews Neuroscience, 6(1):71.
- Nakamura et al., (2009) Nakamura, T., Hillary, F. G., and Biswal, B. B. (2009). Resting network plasticity following brain injury. PloS One, 4(12):e8220.
- Neubauer and Fink, (2009) Neubauer, A. C. and Fink, A. (2009). Intelligence and neural efficiency. Neuroscience & Biobehavioral Reviews, 33(7):1004–1023.
- Neville and Lawson, (1987) Neville, H. J. and Lawson, D. (1987). Attention to central and peripheral visual space in a movement detection task: An event-related potential and behavioral study. i. normal hearing adults. Brain Research, 405(2):253–267.
- Newman, (2006) Newman, M. E. (2006). Modularity and community structure in networks. Proceedings of the National Academy of Sciences, 103(23):8577–8582.
- Nishimura et al., (1999) Nishimura, H., Hashikawa, K., Doi, K., Iwaki, T., Watanabe, Y., Kusuoka, H., Nishimura, T., and Kubo, T. (1999). Sign language ‘heard’in the auditory cortex. Nature, 397(6715):116.
- Pascual-Leone et al., (2005) Pascual-Leone, A., Amedi, A., Fregni, F., and Merabet, L. B. (2005). The plastic human brain cortex. Annu. Rev. Neurosci., 28:377–401.
- Pavani and Bottari, (2012) Pavani, F. and Bottari, D. (2012). Visual abilities in individuals with profound deafness a critical review. The Neural Bases of Multisensory Processes.
- Petitto et al., (2000) Petitto, L. A., Zatorre, R. J., Gauna, K., Nikelski, E. J., Dostie, D., and Evans, A. C. (2000). Speech-like cerebral activity in profoundly deaf people processing signed languages: implications for the neural basis of human language. Proceedings of the National Academy of Sciences, 97(25):13961–13966.
- Power et al., (2011) Power, J. D., Cohen, A. L., Nelson, S. M., Wig, G. S., Barnes, K. A., Church, J. A., Vogel, A. C., Laumann, T. O., Miezin, F. M., Schlaggar, B. L., et al. (2011). Functional network organization of the human brain. Neuron, 72(4):665–678.
- Proksch and Bavelier, (2002) Proksch, J. and Bavelier, D. (2002). Changes in the spatial distribution of visual attention after early deafness. Journal of Cognitive Neuroscience, 14(5):687–701.
- Rauschecker et al., (1995) Rauschecker, J. P., Tian, B., and Hauser, M. (1995). Processing of complex sounds in the macaque nonprimary auditory cortex. Science, 268(5207):111–114.
- Röder et al., (2002) Röder, B., Stock, O., Bien, S., Neville, H., and Rösler, F. (2002). Speech processing activates visual cortex in congenitally blind humans. European Journal of Neuroscience, 16(5):930–936.
- Rubinov and Sporns, (2010) Rubinov, M. and Sporns, O. (2010). Complex network measures of brain connectivity: uses and interpretations. NeuroImage, 52(3):1059–1069.
- Rubinov and Sporns, (2011) Rubinov, M. and Sporns, O. (2011). Weight-conserving characterization of complex functional brain networks. NeuroImage, 56(4):2068–2079.
- Rudie et al., (2013) Rudie, J. D., Brown, J., Beck-Pancer, D., Hernandez, L., Dennis, E., Thompson, P., Bookheimer, S., and Dapretto, M. (2013). Altered functional and structural brain network organization in autism. NeuroImage: clinical, 2:79–94.
- Sadato et al., (1998) Sadato, N., Pascual-Leone, A., Grafman, J., Deiber, M.-P., Ibanez, V., and Hallett, M. (1998). Neural networks for braille reading by the blind. Brain: a Journal of Neurology, 121(7):1213–1229.
- Sadato et al., (2004) Sadato, N., Yamada, H., Okada, T., Yoshida, M., Hasegawa, T., Matsuki, K.-I., Yonekura, Y., and Itoh, H. (2004). Age-dependent plasticity in the superior temporal sulcus in deaf humans: a functional mri study. BMC neuroscience, 5(1):56.
- Scott et al., (2014) Scott, G. D., Karns, C. M., Dow, M. W., Stevens, C., and Neville, H. J. (2014). Enhanced peripheral visual processing in congenitally deaf humans is supported by multiple brain regions, including primary auditory cortex. Frontiers in Human Neuroscience, 8:177.
- Seeley et al., (2007) Seeley, W. W., Menon, V., Schatzberg, A. F., Keller, J., Glover, G. H., Kenna, H., Reiss, A. L., and Greicius, M. D. (2007). Dissociable intrinsic connectivity networks for salience processing and executive control. Journal of Neuroscience, 27(9):2349–2356.
- Song et al., (2012) Song, J., Desphande, A. S., Meier, T. B., Tudorascu, D. L., Vergun, S., Nair, V. A., Biswal, B. B., Meyerand, M. E., Birn, R. M., Bellec, P., et al. (2012). Age-related differences in test-retest reliability in resting-state brain functional connectivity. PLoS One, 7(12):e49847.
- Sporns, (2013) Sporns, O. (2013). Network attributes for segregation and integration in the human brain. Current Opinion in Neurobiology, 23(2):162–171.
- Stevens and Neville, (2006) Stevens, C. and Neville, H. (2006). Neuroplasticity as a double-edged sword: Deaf enhancements and dyslexic deficits in motion processing. Journal of Cognitive Neuroscience, 18(5):701–714.
- Théoret et al., (2004) Théoret, H., Merabet, L., and Pascual-Leone, A. (2004). Behavioral and neuroplastic changes in the blind: evidence for functionally relevant cross-modal interactions. Journal of Physiology-Paris, 98(1-3):221–233.
- Tononi et al., (1994) Tononi, G., Sporns, O., and Edelman, G. M. (1994). A measure for brain complexity: relating functional segregation and integration in the nervous system. Proceedings of the National Academy of Sciences, 91(11):5033–5037.
- Van Den Heuvel and Pol, (2010) Van Den Heuvel, M. P. and Pol, H. E. H. (2010). Exploring the brain network: a review on resting-state fmri functional connectivity. European neuropsychopharmacology, 20(8):519–534.
- Vatansever et al., (2015) Vatansever, D., Menon, D. K., Manktelow, A. E., Sahakian, B. J., and Stamatakis, E. A. (2015). Default mode dynamics for global functional integration. Journal of Neuroscience, 35(46):15254–15262.
- Wang et al., (2014) Wang, D., Qin, W., Liu, Y., Zhang, Y., Jiang, T., and Yu, C. (2014). Altered resting-state network connectivity in congenital blind. Human brain mapping, 35(6):2573–2581.
- Wang et al., (2016) Wang, J., Lu, M., Fan, Y., Wen, X., Zhang, R., Wang, B., Ma, Q., Song, Z., He, Y., Wang, J., et al. (2016). Exploring brain functional plasticity in world class gymnasts: a network analysis. Brain Structure and Function, 221(7):3503–3519.
- Whitfield-Gabrieli and Nieto-Castanon, (2012) Whitfield-Gabrieli, S. and Nieto-Castanon, A. (2012). Conn: a functional connectivity toolbox for correlated and anticorrelated brain networks. Brain Connectivity, 2(3):125–141.
- Wilcoxon, (1945) Wilcoxon, F. (1945). Individual comparisons by ranking methods. Biometrics Bulletin, 1(6):80–83.
- Ye et al., (2015) Ye, M., Yang, T., Qing, P., Lei, X., Qiu, J., and Liu, G. (2015). Changes of functional brain networks in major depressive disorder: a graph theoretical analysis of resting-state fmri. PloS One, 10(9):e0133775.
- Yoo et al., (2013) Yoo, K., Sohn, W. S., and Jeong, Y. (2013). Tool-use practice induces changes in intrinsic functional connectivity of parietal areas. Frontiers in Human Neuroscience, 7:49.
SUPPLEMENTARY INFORMATION
Table S1. Characteristics of deaf participants.
| SubID | Sex | Age | Cause of deafness | Hearing loss (left ear/right ear/mean) | Hearing aid use | How well the subject understands speech with hearing aid | Native language (oral/sign) | Languages primarily used at the moment of the experiment |
| Sub01 | F | 30 | Hereditary deafness | 110/90/100 dB | Uses currently | Moderately | Sign | Sign |
| Sub02 | M | 27 | Maternal disease/ drug side effect | 120/90/105 dB | Used in the past | Moderately | Sign | Sign |
| Sub04 | M | 23 | Hereditary deafness | avg: 120 dB, profound | Uses currently | Moderately | Sign | Sign & oral |
| Sub05 | M | 27 | Hereditary deafness | avg: 90-119 dB, severe | Used in the past | Poorly | Sign | Sign |
| Sub06 | M | 27 | Hereditary deafness | avg: 90-119 dB, severe | Used in the past | Poorly | Oral | Sign & oral |
| Sub07 | F | 27 | Hereditary deafness | avg: 120 dB or more, profound | Used in the past | Poorly | Oral | Sign & oral |
| Sub08 | F | 27 | Hereditary deafness | avg: 90-119 dB, severe | Used in the past | Poorly | Sign | Sign |
| Sub09 | M | 27 | Hereditary deafness | 120/120/120 dB | Used in the past | Poorly | Sign | Sign |
| Sub10 | F | 32 | Hereditary deafness | 89/80/85 dB | Uses currently | Moderately | Sign | Sign & oral |
| Sub14 | F | 32 | Maternal disease/ drug side effect | 105/115/110 dB | Uses currently | Moderately | Oral | Sign & oral |
| Sub17 | F | 19 | Hereditary deafness | 95/100/98 dB | Uses currently | Moderately | Sign | Sign & oral |
| Sub18 | M | 27 | Hereditary deafness | 94/107/101 dB | Used in the past | Poorly | Sign | Sign |
| Sub19 | F | 30 | Hereditary deafness | 90/90/90 dB | Used in the past | Poorly | Sign | Sign & oral |
| Sub20 | F | 25 | Hereditary deafness | 70/60/65 dB | Uses currently | Well | Sign | Sign |
| Sub21 | F | 37 | Maternal disease/ drug side effect | 110/110/110 dB | Used in the past | Poorly | Oral | Sign |
| Sub22 | F | 20 | Hereditary deafness | 113/115/114 dB | Used in the past | Poorly | Oral | Sign & oral |
| Sub23 | M | 19 | Hereditary deafness | 90/110/100 dB | Uses currently | Well | Sign | Sign & oral |
| Sub24 | F | 19 | Hereditary deafness | 94/103/99 dB | Uses currently | Very well | Sign | Sign & oral |
| Sub28 | F | 30 | Hereditary deafness | 78/92/85 dB | Uses currently | Poorly | Sign | Sign & oral |
| Sub29 | F | 23 | Maternal disease/ drugs side effect | 102/120/111 dB | Uses currently | Moderately | Oral | Sign & oral |
| Sub31 | F | 30 | Maternal disease/ drug side effect | 100/120/110 dB | Uses currently | Well | Oral | Sign & oral |