Isostructural Mott Transition in 2D honeycomb antiferromagnet V0.9PS3
Abstract
We present the observation of an isostructural Mott insulator-metal transition in van-der-Waals honeycomb antiferromagnet V0.9PS3 through high-pressure x-ray diffraction and transport measurements. The MPX3 family of magnetic van-der-Waals materials (M denotes a first row transition metal and X either S or Se) are currently the subject of broad and intense attention, but the vanadium compounds have until this point not been studied beyond their basic properties. We observe insulating variable-range-hopping type resistivity in V0.9PS3, with a gradual increase in effective dimensionality with increasing pressure, followed by a transition to a metallic resistivity temperature dependence between 112 and 124 kbar. The metallic state additionally shows a low-temperature upturn we tentatively attribute to the Kondo Effect. A gradual structural distortion is seen between 26-80 kbar, but no structural change at higher pressures corresponding to the insulator-metal transition. We conclude that the insulator-metal transition occurs in the absence of any distortions to the lattice - an isostructural Mott transition in a new class of two-dimensional material, and in strong contrast to the behavior of the other MPX3 compounds.
Layered two-dimensional van-der-Waals materials are currently the subject of broad and detailed research (Ajayan et al., 2016). In particular, the addition of magnetism into such systems leads to many interesting fundamental questions and opportunities for device applications (Park, 2016; Samarth, 2017; Zhou et al., 2016; Burch et al., 2018), and the ability to select or tune electronic and transport properties in these materials would be a powerful tool indeed for the fabricators of a new generation of nanoscale devices. One particular family of materials enjoying a sudden surge of interest is that of MPX3, where M denotes a first row transition metal and X either S or Se. First synthesized by Klingen in 1969 (Klingen et al., 1968, 1970, 1973), initial interest in these materials beyond their basic characterization was for application as battery materials - see Grasso and Silipigni (Grasso and Silipigni, 2002) for a review. In more recent years they have been studied in detail as excellent examples of two-dimensional magnetic systems - these materials all share very similar structures, but spin states, magnetic ordering, magnetic anisotropy and critical behavior change with the transition metal (Kurosawa et al., 1983; Okuda et al., 1986; Wildes et al., 1994, 1998; Rule et al., 2007; Wildes et al., 2007, 2012, 2015, 2017; Lançon et al., 2016). MPX3 form a layered honeycomb lattice of the metal ions (Brec et al., 1979; Ouvrard et al., 1985a, b; Brec, 1986) with monoclinic space group and interplanar forces solely through a van-der-Waals interaction between the surrounding P2S6 clusters. They can be easily mechanically exfoliated as with graphene and have been shown to maintain their magnetic ordering down to monolayer thickness (Lee et al., 2016; Kuo et al., 2016). These materials are all insulating - they exhibit an exponentially increasing resistivity with decreasing temperature - and can be understood as p-type semiconductors (Grasso and Silipigni, 2002) and as Mott insulators (Haines et al., 2018). Recent works have demonstrated Mott insulator-metal transitions in MnPS3 and FePS3 (Wang et al., 2016; Tsurubayashi et al., 2018; Haines et al., 2018) and additionally superconductivity in FePSe3 (Wang et al., 2018). The tuning of clean and controllable materials like these from an antiferromagnetic Mott insulating state into a metallic, or indeed superconducting, state is of great interest for fundamental magnetism and Mott physics. Moreover, this same physics forms the foundation for our understanding of the underlying phase diagram and mechanisms for systems like the cuprate superconductors.
VPS3, or more generally V1-xPS3 with the level of vanadium deficiency, is a member of the family that has received very little attention, despite hosting great potential for interesting study. It has the smallest band gap of these insulating materials at around 0.25 eV (Brec and Rouxel, 1980; Ouvrard et al., 1985b; Ichimura and Sano, 1991), and by far the lowest resistivity (on the order of cm) at room temperature. This can additionally be tuned over an order of magnitude by altering the level of vanadium deficiency (Ichimura and Sano, 1991). Theoretical band structure calculations for the whole material family, including VPS3 are given in Chittari et.al. (Chittari et al., 2016), showing a band gap and insulating/semiconducting behavior, but such calculations on these materials are challenging and historically often contradict with experiment. V1-xPS3 is antiferromagnetic (Ouvrard et al., 1985b), with a Néel temperature of around 62 K but little is known about its magnetic structure and behavior. As the metal ion in MPX3 must take the charge M2+, the vanadium deficiency in V1-xPS3 can be explained as due to valence mixing on the vanadium site between V2+ and V3+ states. It is this valence mixing that Ichimura and Sano (Ichimura and Sano, 1991) argue to be responsible for the comparatively high conductivity in this material - but the resulting high degrees of local electronic disorder and vacancies can be expected to have a large effect on the transport and scattering properties.
Results
Crystal structure
a) b)
c) d)
e) f)
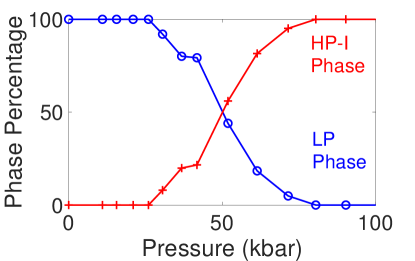
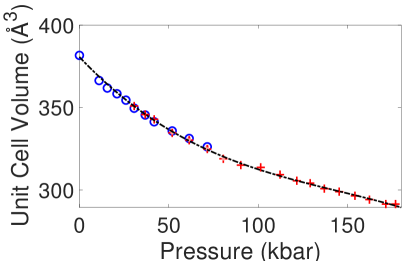
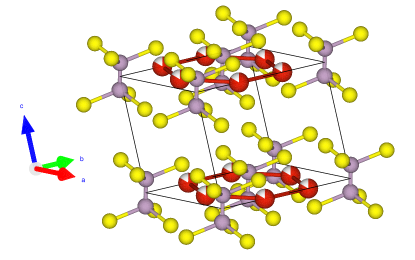
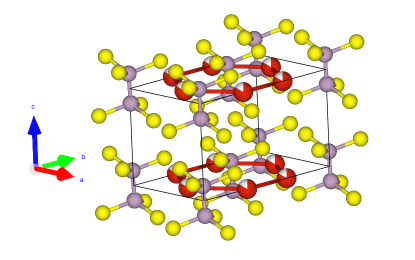
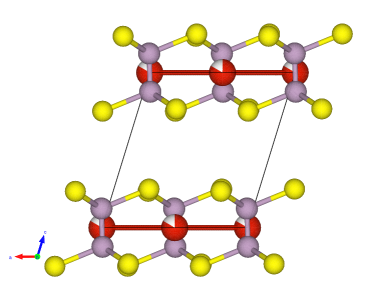
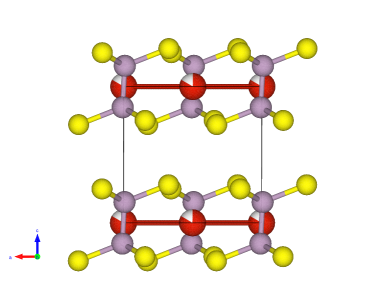
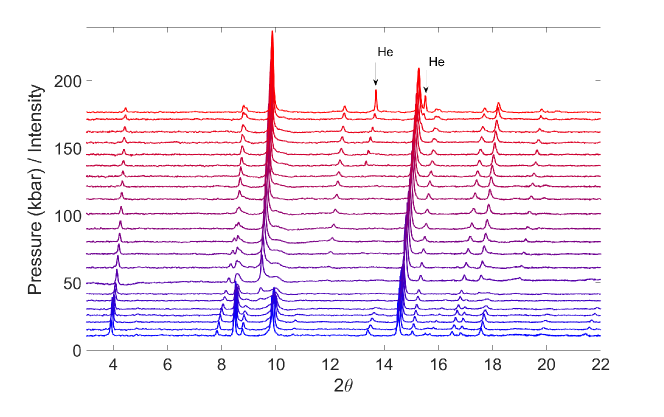
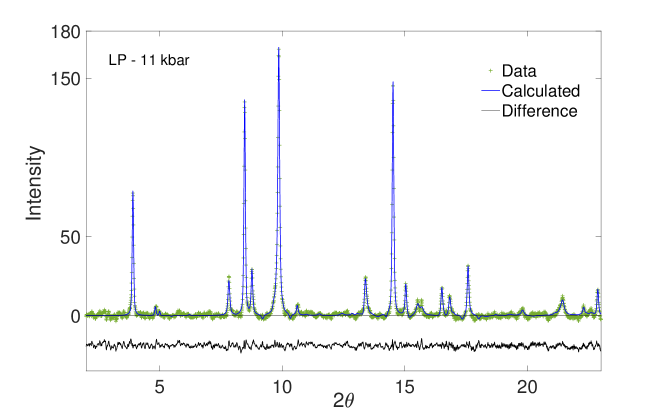
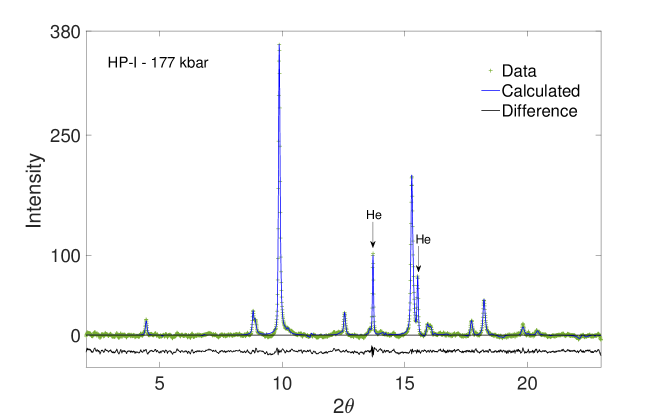
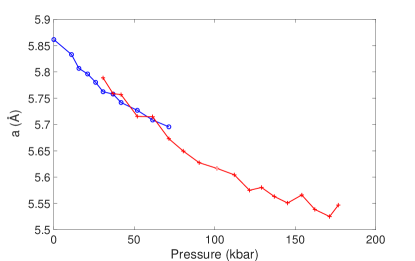
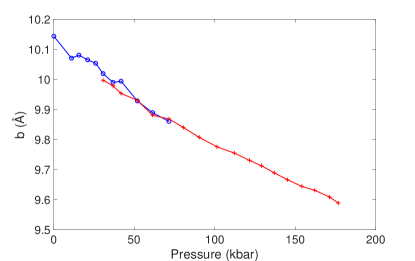
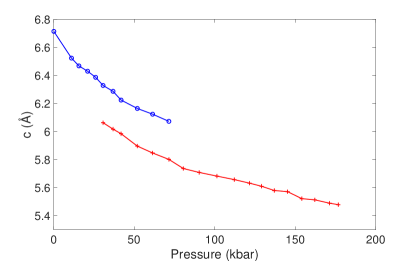
High-pressure powder x-ray diffraction patterns were taken at room temperature up to 177 kbar. Besides an expected decreasing unit volume as the sample is pressurized, no changes in the diffraction patterns from the ambient pressure patterns, and hence the structure described by Ouvrard et.al. (Ouvrard et al., 1985b), were observed up to 26 kbar. From 26 to 80 kbar however, a gradual transition to an alternative high-pressure structure was observed (see Fig. 1). This new phase (we will denote the ambient and low pressure structural phase LP and this high-pressure phase HP-I) can be attributed to the same structure seen in FePS3 at intermediate pressures and designated HP-I by Haines et.al. (Haines et al., 2018). The layers of V0.9PS3 shift relative to each other in a sliding motion of along the -axis such that the S atoms become arranged in a hexagonal close packing layout between the layers, resulting in the monoclinic unit cell’s angle shifting from a value of 107° in the LP to a value close to 90° (90.13° at 177 kbar) in the HP-I structure. In this structure the P atoms are slightly distorted along the -axis ( coordinate value of 0.0074 at 177 kbar) of the unit cell, and this distortion results in the same C2/m symmetry in the HP-I structure. In the absence of the distortion of P atoms, HP-I would have a trigonal symmetry, but certain peak shapes can not be adequately fitted in refinements made with this space group so we conclude that it remains monoclinic. As there is no symmetry or even volume change associated with this LP - HP-I phase transition, it is consistent to observe it to occur so gradually over a large pressure range, in both FePS3 and now V0.9PS3. Integrated x-ray diffraction patterns, Rietveld refinements and relevant parameters are shown in the Supplementary Material, SM at the end of this manuscript.
There are no sudden or discontinuous changes in the cell volume accompanying this shift; the lattice spacing changes as its orientation is altered, but this does not reflect a change in the inter-layer spacing. The HP-I to HP-II first-order structural transition observed in FePS3 (Haines et al., 2018) and linked there with the metallization, was not observed in V0.9PS3. In fact, no transitions or distortions of the HP-I phase were observed up to the maximum pressure measured - 177 kbar.
Resistivity and insulator-metal transition
a)
b)
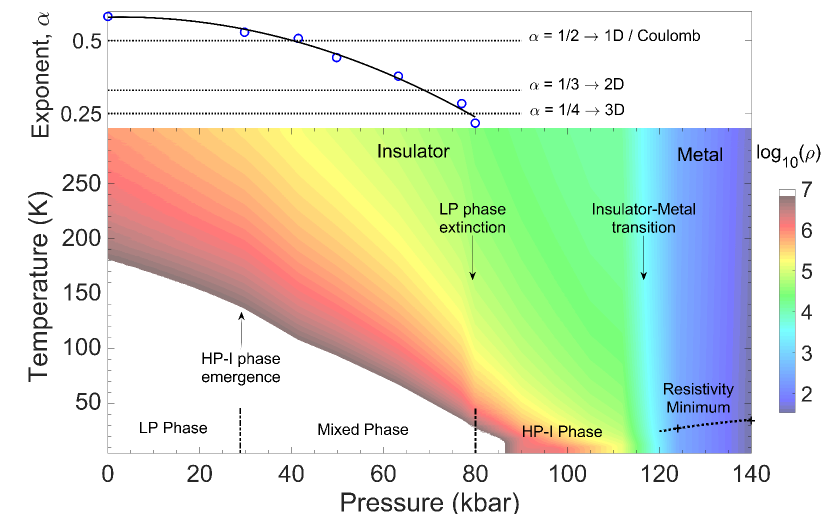
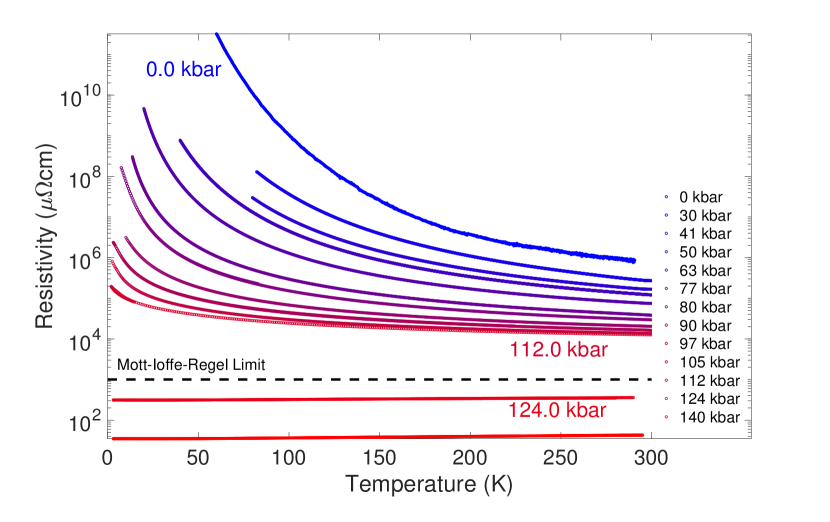
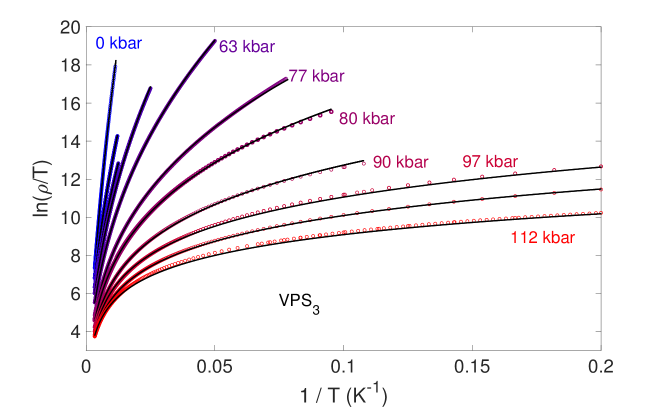
The temperature dependence of the resistivity of a single crystal of V0.9PS3 is shown in Fig. 2.a for pressures ranging from ambient up to 140 kbar. The ambient pressure resistivity (cm) and an energy gap fitted from an Arrhenius form (0.2 eV) are consistent with values previously reported (Ichimura and Sano, 1991) for V0.78PS3 and VPS3 - these are substantially lower than all other members of the MPS3 family. As pressure is increased, the overall magnitude of the resistivity is dramatically and continuously reduced, and the curves become shallower, suggesting a reduction of the effective band gap. Between 112 kbar and 124 kbar the resistivity switches from an increasing trend with decreasing temperature to a decreasing trend - the insulator-metal transition. An order-of magnitude estimate of the Mott-Ioffe-Regel limit (Mott, 1990), following the treatment of Kurosaki et.al. (Kurosaki et al., 2005), is superimposed and falls between the insulating and metallic resistivity curves as expected. Besides the crossover from insulating to metallic behavior, there appear to be no sudden changes or transitions in the temperature dependence of the resistivity as pressure is increased - the evolution of the curves is smooth and continuous. As discussed in the previous section, there is a structural distortion from the LP to HP-I structure over the range 26-80 kbar, but no structural changes at pressures above this - the insulator-metal transition observed in the resistivity is not accompanied by any structural changes. An isostructural Mott transition such as this is a very rare phenomenon, particularly in van-der-Waals materials. Previous examples include specific transition-metal-dichalcogenide systems (Nayak et al., 2014, 2015), but an equivalent kink in lattice parameter pressure dependence to that seen in these cases was not observed here in V0.9PS3 - there is no signature of the transition in the structure at all.
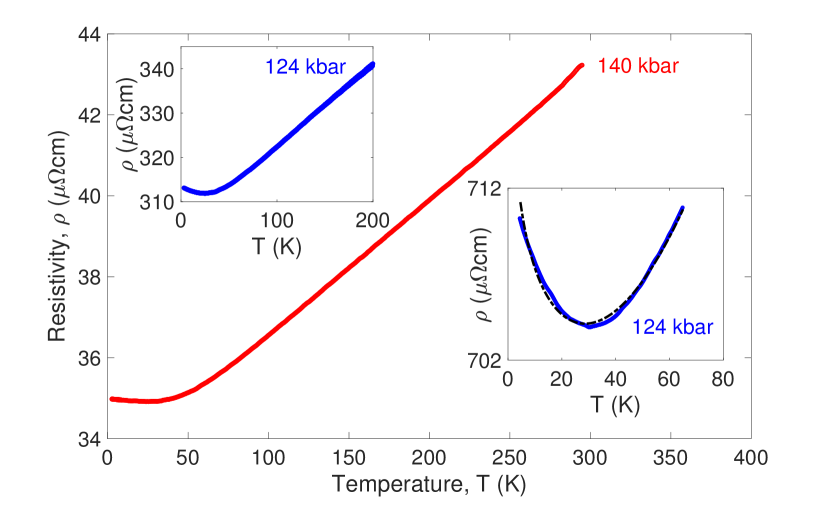
The resistivity in the high-pressure metallic state is replotted in detail in Fig. 2.b. The resistivity shows a linear temperature dependence down to around 70 K, and then exhibits a flattening off and upturn below 40 K. The residual resistance ratio is very low at around 1.2, as one would expect for a highly disordered system like V0.9PS3. As the lower inset shows, the upturn in the low temperature data can be described by the Kondo effect (Kondo, 1964), but alternative forms of localization could also be responsible for this feature.
Interestingly, and in contrast to the case of other MPX3 materials such as FePS3 (Haines et al., 2018), the resistivity cannot be well described by a simple Arrhenius-type insulating temperature dependence - see supplementary material. The data were found to be best described by a generalized variable-range-hopping (VRH) (Mott, 1969; Hill, 1976; Mott, 1990) expression for highly locally disordered systems . The inclusion of a prefactor in the exponential resistivity of an insulator is a common method to describe the thermal dependence of scatterers in the system - we find a -linear prefactor (Keuls et al., 1997) to best fit the data. The exponent is given by with the effective dimensionality of the system; is a characteristic temperature or energy scale of the electron hopping process.
Fig. 3 plots the resistivity against pressure and temperature, showing the full phase diagram of V0.9PS3. The insulator-metal transition is clearly visible as the point where resistivity no longer increases with decreasing temperature. The end point of the LP-HP-I mixed structural phase where the LP phase fraction goes to zero is accompanied by a visible kink in the resistivity curves at 80 kbar. The upper panel gives the pressure dependence of the VRH exponent , with dotted lines showing the values expected for 1D, 2D and 3D systems of , and . A strong pressure dependence of this exponent is observed, with continuously decreasing in value as pressure is increased and the insulator-metal transition approached - the fits lose validity at pressures close to the transition. The characteristic temperature is also continuously suppressed (see supplementary material) as electron overlap is increased. As the application of pressure narrows the van-der-Waals gap between the crystal planes and increases hopping and tunneling between them, we can reasonably expect a gradual crossover from 2D to 3D conduction mechanisms. The greater overlap and correlation of vanadium sites across the crystal planes in HP-I, as well as the important P2S6-cluster conduction pathways will also bear a role. However the apparent one dimensional hopping at low pressures is less easily explained. One explanation could be one-dimensional ‘chains’ of conduction percolating through the lattice, with the continuous planes seen in other MPX3 materials broken up by the vanadium vacancies and valence mixing. Dimerization of the vanadium-vanadium bonds due to the vacancies could again contribute to this picture. Another possibility is that the system is exhibiting so-called Efros-Shklovskii variable-range-hopping (ES-VRH) (Efros and Shklovskii, 1975; Li et al., 2017; Rosenbaum, 1991) which takes the same form as the standard Mott VRH but with an exponent of 0.5, independent of dimensionality. ES-VRH results from the inclusion of electron-electron interactions and the development of a Coulomb gap at the Fermi level below a temperature characteristic of this gap.
Discussion
We have demonstrated a continuous transition from insulating to metallic states in 2D antiferromagnet V0.9PS3. No change in the crystal lattice was observed in the vicinity of the transition, in contrast to previous results on FePS3 and MnPS3 where the insulator-metal transition is accompanied by a dramatic first order structural phase transition: a collapse of the inter-planar spacing. Mott’s original and simplest explanation of the Mott transition (Mott, 1990) involves the gradual closing of the split metallic bands as the strength of electron hopping is increased, an eventual touching of the bands causing the metallization. This mechanism, rather than a structural change, appears to match the observed behavior in V0.9PS3.
V0.9PS3 does, however, undergo a structural transition or distortion - over the wide pressure range 26 to 80 kbar a new structural phase emerges attributed to a sliding motion of the crystal planes. This brings the axis to approximately perpendicular to the planes, and hence the honeycombs of vanadium ions are no longer offset between planes. This is then consistent with an increase in hopping dimensionality. The sulfur atoms enter a hexagonal close packed configuration, and this HP-I structure is very close to possessing a trigonal symmetry - a slight distortion in the phosphorus positions results in it belonging to the same monoclinic space group as the LP structure. This transition, common to all MPX3 so far measured, occurs well below the metallization pressure. Accompanying this distortion is a continuous increase in the effective dimensionality in the variable-range-hopping expression found to fit the transport data. V0.9PS3 forms a unique case - unlike other MPX3 materials its resistivity follows a variable-range-hopping rather than an Arrhenius form, and unlike archetypal 3D VRH-metal transitions (Pollak and Shklovskii, 1991), such as in doped silicon, the metallization process cannot be mapped onto a simple scaling relation. In such cases, the data follow the same functional form, but is continuously suppressed to zero - this is not the case here as the functional form of the resistivity is constantly and smoothly altered, in addition to , as the effective dimensionality of the electronic transport increases. The evolution of the VRH exponent from 1D to 2D-like can be potentially understood as originating from ES-VRH hopping, due to the formation of a Coulomb gap. As pressure and hence and inter-site hopping is increased, the Coulomb gap is suppressed and Mott VRH hopping discovered. This is then subsequently tuned to fully 3D hopping and metallization. The lattice remains 2D throughout, whereas the transport properties are continuously tuned between regimes, resulting in eventual metallization. This is a novel mechanism fundamentally in contrast to previous results, particularly in other members of this material’s family, and the resistivity behavior close to metallization does not fit any conventional forms and is yet to be explained.
A metallic temperature dependence of the resistivity was observed at pressures above 112 kbar, with a low-temperature upturn potentially due to the Kondo Effect. The dilute magnetic impurities of which the Kondo Effect is a signature we can tentatively attribute to the vanadium deficiency and disordered valence mixing on the vanadium sites. As the system is known to be highly locally disordered however, alternative, more exotic, forms of localization could be responsible for this effect.
As the Mott transition is isostructural, it is likely to be second order and could potentially be tuned to a quantum critical point. We can also suspect from magnetotransport data that the metallization also involves a transition from antiferromagnetic order to paramagnetism, as is the case in vanadium oxides (Pergament et al., 2013). If this is found to be the case via further experiments, it would open the interesting possibility of a spin liquid phase of exotic nature near the critical point due to the honeycomb lattice, perhaps through a Kitaev interaction. And, of course, an extremely challenging but exciting experiment would be to examine the insulator-metal transition in monolayer, truly two-dimensional, VPS3. There additionally exists potential for the formation of a dimerized valence-bond-solid state (Affleck et al., 1987) at high pressure. The spin V2+ positioned on a honeycomb lattice with antiferromagnetic order is a candidate for such a state, and our observations, paired with the changes in magnetic moment seen in the iron compounds at metallization (Wang et al., 2018), consistent with its formation.
VPS3 has, until now, not been studied beyond its basic properties, while many other members of the MPX3 family are enjoying wide attention for their potential in two-dimensional physics and technological applications. We have demonstrated that this material has many intriguing opportunities and puzzles for further work, and have demonstrated an isostructural Mott transition in a new class of 2D van-der-Waals material for the first time. The insulator-metal transition and the overall transport mechanisms contrast strongly to the behavior observed in other members of this family - more work is required to ascertain exactly why. The lack of an accompanying structural change suggests that the transport properties of V0.9PS3 can be much more easily and responsively switched than in other van-der-Waals materials, whether by chemical doping, thin film strain or electrostatic gating. This and the material’s small and highly tunable band gap show great promise for future device applications based on van-der-Waals materials.
Methods
Single crystals of V0.9PS3 were grown via a chemical vapor transport method in a two-zone tube furnace at temperatures of 600°C and 350°C for 1 month using 0.1 g of TeCl4 flux for 1 g of reactants. Prior to the reaction, the quartz tubes used were cleaned and dried, loaded with V (99.5%), P (99.99%) and S (99.98%) powders under an argon atmosphere, then evacuated to mbar with an oil diffusion pump before sealing. The crystals form with a vanadium deficiency, due to its natural tendency to V3+ valence (the transition metal in MPX3 is M2+ ), so a 20% excess of vanadium powder was added to the reactant mixture to attempt to mitigate this. Additionally, it is worth noting that these reactions will form V2S3 or VS2 at higher temperatures so it is desirable to keep the hot zone temperature as low as possible for the reaction (Klingen gives the solid-state reaction temperatures for MPX3 (Klingen et al., 1973)) while allowing sufficient heat for the flux to function. Crystals were characterized by powder and single-crystal diffraction for phase purity and by EDX for stoichiometry. The samples used in this study had stoichiometry of V0.9PS3, with an uncertainty of on the 0.9 vanadium fraction.
The pressure evolution of the crystal structure was found from powder x-ray diffraction carried out at room temperature on the I15 beamline at the Diamond Light Source. The powder sample used was ground under an argon atmosphere (to prevent water uptake) and in liquid nitrogen to attempt to mitigate the effects of preferred orientation. Helium was used as the pressure-transmitting medium and the shift in fluorescence wavelength of ruby spheres placed inside the high pressure region was used as the pressure calibrant (Mao et al., 1986). An x-ray energy of 29.2 KeV (λ = 0.4246 Å) was used to collect the diffraction patterns. A MAR345 2D detector with pixel size 100x100 m was used to record the diffraction patterns with 120 s exposure times and a 24° rocking of the sample. The data were initially processed using Dawn (Filik et al., 2017) (with a LaB6 calibration), the subsequent Rietveld refinements were calculated using the GSAS-II software package (Toby and Dreele, 2013) and the structures visualized in VESTA (Momma and Izumi, 2011). For the structural refinements, a spherical harmonics model for the observed peak heights was used to take into account the strong (and pressure-dependent) effects of preferred orientation.
Resistivity measurements were performed on single crystals using a Keithley 2410 Source Meter with a fixed supplied current of 0.01 A at ambient pressure, and for high pressures using the internal resistance bridge of the PPMS (Quantum Design) cryostat used for temperature control. To prepare the samples for these measurements, they were first mechanically cleaved to expose clean surfaces and a 50 nm layer of gold was then sputtered onto the surface to form contact pads via a foil mask. Gold wires were then bonded to these using Dupont 6838 silver epoxy, cured at 180°C for one hour.
A diamond anvil cell (Dunstan and Spain, 1989; Spain and Dunstan, 1989) with 1 mm anvil culets and heat-treated Be-Cu gasket was used for the high-pressure resistivity measurements. Glycerol was used as the pressure medium and ruby was used to determine the pressure as with the x-ray study. Estimated pressure uncertainties are kbar.
Acknowledgements.
This work was carried out with the support of the Diamond Light Source and we acknowledge the provision of beamtime at I15 under proposal number NT21368. The authors would like to thank P.A.C. Brown, S.E. Dutton, I.Hwang D. Jarvis and Y. Noda for their generous help and discussions. We would also like to acknowledge support from Jesus College of the University of Cambridge, IHT KAZATOMPROM and the CHT Uzbekistan programme. The work was carried out with financial support from the Ministry of Education and Science of the Russian Federation in the framework of Increase Competitiveness Program of NUST MISiS (№ К2-2017-024). This work was supported by the Institute for Basic Science (IBS) in Korea (Grant No. IBS-R009-G1).References
- Ajayan et al. (2016) \BibitemOpen\bibfieldauthor P. Ajayan, P. Kim, and K. Banerjee, \bibfieldjournal Physics Today 69, 38 (2016)\BibitemShutNoStop
- Park (2016) \BibitemOpen\bibfieldauthor J.-G. Park, \bibfieldjournal J. Phys.: Condens. Matter 28, 301001 (2016)\BibitemShutNoStop
- Samarth (2017) \BibitemOpen\bibfieldauthor N. Samarth, \bibfieldjournal Nature 546, 216 (2017)\BibitemShutNoStop
- Zhou et al. (2016) \BibitemOpen\bibfieldauthor Y. Zhou, H. Lu, X. Zu, and F. Gao, \bibfieldjournal Scientific Reports 6 (2016), 10.1038/srep19407\BibitemShutNoStop
- Burch et al. (2018) \BibitemOpen\bibfieldauthor K. S. Burch, D. Mandrus, and J.-G. Park, \bibfieldjournal Nature 563, 47 (2018)\BibitemShutNoStop
- Klingen et al. (1968) \BibitemOpen\bibfieldauthor W. Klingen, G. Eulenberger, and H. Hahn, \bibfieldjournal Die Naturwissenschaften 55, 229 (1968)\BibitemShutNoStop
- Klingen et al. (1970) \BibitemOpen\bibfieldauthor W. Klingen, G. Eulenberger, and H. Hahn, \bibfieldjournal Naturwissenschaften 57, 88 (1970)\BibitemShutNoStop
- Klingen et al. (1973) \BibitemOpen\bibfieldauthor W. Klingen, R. Ott, and H. Hahn, \bibfieldjournal Zeitschrift für anorganische und allgemeine Chemie 396, 271 (1973)\BibitemShutNoStop
- Grasso and Silipigni (2002) \BibitemOpen\bibfieldauthor V. Grasso and L. Silipigni, \bibfieldjournal Rivista Del Nuovo Cimento 25, 2002 (2002)\BibitemShutNoStop
- Kurosawa et al. (1983) \BibitemOpen\bibfieldauthor K. Kurosawa, S. Saito, and Y. Yamaguchi, \bibfieldjournal Journal of the Physical Society of Japan 52, 3919 (1983)\BibitemShutNoStop
- Okuda et al. (1986) \BibitemOpen\bibfieldauthor K. Okuda, K. Kurosawa, S. Saito, M. Honda, Z. Yu, and M. Date, \bibfieldjournal J. Phys. Soc. Jpn. 55, 4456 (1986)\BibitemShutNoStop
- Wildes et al. (1994) \BibitemOpen\bibfieldauthor A. Wildes, S. Kennedy, and T. Hicks, \bibfieldjournal J. Phys.: Condens. Matter 6, L335 (1994)\BibitemShutNoStop
- Wildes et al. (1998) \BibitemOpen\bibfieldauthor A. Wildes, B. Roessli, B. Lebech, and K. Godfrey, \bibfieldjournal J. Phys.: Condens. Matter 10, 6417 (1998)\BibitemShutNoStop
- Rule et al. (2007) \BibitemOpen\bibfieldauthor K. Rule, G. McIntyre, S. Kennedy, and T. Hicks, \bibfieldjournal Phys. Rev. B 76, 134402 (2007)\BibitemShutNoStop
- Wildes et al. (2007) \BibitemOpen\bibfieldauthor A. Wildes, H. Rønnow, B. Roessli, M. Harris, and K. Godfrey, \bibfieldjournal Journal of Magnetism and Magnetic Materials 310, 1221 (2007)\BibitemShutNoStop
- Wildes et al. (2012) \BibitemOpen\bibfieldauthor A. Wildes, K. Rule, R. Bewley, M. Enderle, and T. Hicks, \bibfieldjournal J. Phys.: Condens. Matter 24, 416004 (2012)\BibitemShutNoStop
- Wildes et al. (2015) \BibitemOpen\bibfieldauthor A. Wildes, V. Simonet, E. Ressouche, G. McIntyre, M. Avdeev, E. Suard, S. Kimber, D. Lançon, G. Pepe, B. Moubaraki, and et al., \bibfieldjournal Physical Review B 92 (2015), 10.1103/physrevb.92.224408\BibitemShutNoStop
- Wildes et al. (2017) \BibitemOpen\bibfieldauthor A. Wildes, V. Simonet, E. Ressouche, R. Ballou, and G. McIntyre, \bibfieldjournal J. Phys.: Condens. Matter 29, 455801 (2017)\BibitemShutNoStop
- Lançon et al. (2016) \BibitemOpen\bibfieldauthor D. Lançon, H. Walker, E. Ressouche, B. Ouladdiaf, K. Rule, G. McIntyre, T. Hicks, H. Rønnow, and A. Wildes, \bibfieldjournal Physical Review B 94 (2016), 10.1103/physrevb.94.214407\BibitemShutNoStop
- Brec et al. (1979) \BibitemOpen\bibfieldauthor R. Brec, D. M. Schleich, G. Ouvrard, A. Louisy, and J. Rouxel, \bibfieldjournal Inorganic Chemistry 18, 1814 (1979)\BibitemShutNoStop
- Ouvrard et al. (1985a) \BibitemOpen\bibfieldauthor G. Ouvrard, R. Brec, and J. Rouxel, \bibfieldjournal Materials Research Bulletin 20, 1181 (1985a)\BibitemShutNoStop
- Ouvrard et al. (1985b) \BibitemOpen\bibfieldauthor G. Ouvrard, R. Fréour, R. Brec, and J. Rouxel, \bibfieldjournal Materials Research Bulletin 20, 1053 (1985b)\BibitemShutNoStop
- Brec (1986) \BibitemOpen\bibfieldauthor R. Brec, \bibfieldjournal Solid State Ionics 22, 3 (1986)\BibitemShutNoStop
- Lee et al. (2016) \BibitemOpen\bibfieldauthor J. Lee, S. Lee, J. Ryoo, S. Kang, T. Kim, P. Kim, C. Park, J. Park, and H. Cheong, \bibfieldjournal Nano Letters 16, 7433 (2016)\BibitemShutNoStop
- Kuo et al. (2016) \BibitemOpen\bibfieldauthor C. Kuo, M. Neumann, K. Balamurugan, H. Park, S. Kang, H. Shiu, J. Kang, B. Hong, M. Han, T. Noh, and J.-G. Park, \bibfieldjournal Scientific Reports 6, 20904 (2016)\BibitemShutNoStop
- Haines et al. (2018) \BibitemOpen\bibfieldauthor C. Haines, M. Coak, A. Wildes, G. Lampronti, C. Liu, P. Nahai-Williamson, H. Hamidov, D. Daisenberger, and S. Saxena, \bibfieldjournal Physical Review Letters 121 (2018), 10.1103/physrevlett.121.266801\BibitemShutNoStop
- Wang et al. (2016) \BibitemOpen\bibfieldauthor Y. Wang, Z. Zhou, T. Wen, Y. Zhou, N. Li, F. Han, Y. Xiao, P. Chow, J. Sun, M. Pravica, A. L. Cornelius, W. Yang, and Y. Zhao, \bibfieldjournal Journal of the American Chemical Society 138, 15751 (2016)\BibitemShutNoStop
- Tsurubayashi et al. (2018) \BibitemOpen\bibfieldauthor M. Tsurubayashi, K. Kodama, M. Kano, K. Ishigaki, Y. Uwatoko, T. Watanabe, K. Takase, and Y. Takano, \bibfieldjournal AIP Advances 8, 101307 (2018)\BibitemShutNoStop
- Wang et al. (2018) \BibitemOpen\bibfieldauthor Y. Wang, J. Ying, Z. Zhou, J. Sun, T. Wen, Y. Zhou, N. Li, Q. Zhang, F. Han, Y. Xiao, P. Chow, W. Yang, V. V. Struzhkin, Y. Zhao, and H. kwang Mao, \bibfieldjournal Nature Communications 9 (2018), 10.1038/s41467-018-04326-1\BibitemShutNoStop
- Brec and Rouxel (1980) \BibitemOpen\bibfieldauthor R. Brec and J. Rouxel, New Ways to Save Energy (Springer, 1980) pp. 620–630\BibitemShutNoStop
- Ichimura and Sano (1991) \BibitemOpen\bibfieldauthor K. Ichimura and M. Sano, \bibfieldjournal Synthetic Metals 45, 203 (1991)\BibitemShutNoStop
- Chittari et al. (2016) \BibitemOpen\bibfieldauthor B. Chittari, Y. Park, D. Lee, M. Han, A. MacDonald, E. Hwang, and J. Jung, \bibfieldjournal Phys.Rev.B 94, 184428 (2016)\BibitemShutNoStop
- Mott (1990) \BibitemOpen\bibfieldauthor N. Mott, Metal-Insulator Transitions (Taylor and Francis, London, 1990)\BibitemShutNoStop
- Kurosaki et al. (2005) \BibitemOpen\bibfieldauthor Y. Kurosaki, Y. Shimizu, K. Miyagawa, K. Kanoda, and G. Saito, \bibfieldjournal Physical Review Letters 95 (2005), 10.1103/physrevlett.95.177001\BibitemShutNoStop
- Nayak et al. (2014) \BibitemOpen\bibfieldauthor A. Nayak, S. Bhattacharyya, J. Zhu, J. Liu, X. Wu, T. Pandey, C. Jin, A. Singh, D. Akinwande, and J.-F. Lin, \bibfieldjournal Nature Communications 5 (2014), 10.1038/ncomms4731\BibitemShutNoStop
- Nayak et al. (2015) \BibitemOpen\bibfieldauthor A. Nayak, Z. Yuan, B. Cao, J. Liu, J. Wu, S. Moran, T. Li, D. Akinwande, C. Jin, and J.-F. Lin, \bibfieldjournal ACS Nano 9, 9117 (2015)\BibitemShutNoStop
- Kondo (1964) \BibitemOpen\bibfieldauthor J. Kondo, \bibfieldjournal Progress of Theoretical Physics 32, 37 (1964)\BibitemShutNoStop
- Mott (1969) \BibitemOpen\bibfieldauthor N. Mott, in Festkörper Probleme IX (Elsevier, 1969) pp. 22–45\BibitemShutNoStop
- Hill (1976) \BibitemOpen\bibfieldauthor R. Hill, \bibfieldjournal Physica Status Solidi (a) 34, 601 (1976)\BibitemShutNoStop
- Keuls et al. (1997) \BibitemOpen\bibfieldauthor F. V. Keuls, X. Hu, H. Jiang, and A. Dahm, \bibfieldjournal Physical Review B 56, 1161 (1997)\BibitemShutNoStop
- Efros and Shklovskii (1975) \BibitemOpen\bibfieldauthor A. Efros and B. Shklovskii, \bibfieldjournal Journal of Physics C: Solid State Physics 8, L49 (1975)\BibitemShutNoStop
- Li et al. (2017) \BibitemOpen\bibfieldauthor Z. Li, L. Peng, J. Zhang, J. Li, Y. Zeng, Y. Luo, Z. Zhan, L. Meng, M. Zhou, and W. Wu, \bibfieldjournal Semiconductor Science and Technology 32, 035010 (2017)\BibitemShutNoStop
- Rosenbaum (1991) \BibitemOpen\bibfieldauthor R. Rosenbaum, \bibfieldjournal Physical Review B 44, 3599 (1991)\BibitemShutNoStop
- Pollak and Shklovskii (1991) \BibitemOpen\bibfieldauthor M. Pollak and B. Shklovskii, Hopping transport in solids (Elsevier, 1991)\BibitemShutNoStop
- Pergament et al. (2013) \BibitemOpen\bibfieldauthor A. Pergament, G. Stefanovich, N. Kuldin, and A. Velichko, \bibfieldjournal ISRN Condensed Matter Physics 2013, 1 (2013)\BibitemShutNoStop
- Affleck et al. (1987) \BibitemOpen\bibfieldauthor I. Affleck, T. Kennedy, E. Lieb, and H. Tasaki, \bibfieldjournal Phys. Rev. Lett (1987)\BibitemShutNoStop
- Mao et al. (1986) \BibitemOpen\bibfieldauthor H. Mao, J. Xu, and P. Bell, \bibfieldjournal Journal of Geophysical Research 91, 4673 (1986)\BibitemShutNoStop
- Filik et al. (2017) \BibitemOpen\bibfieldauthor J. Filik, A. Ashton, P. Chang, P. Chater, S. Day, M. Drakopoulos, M. Gerring, M. Hart, O. Magdysyuk, S. Michalik, A. Smith, C. Tang, N. Terrill, M. Wharmby, and H. Wilhelm, \bibfieldjournal Journal of Applied Crystallography 50, 959 (2017)\BibitemShutNoStop
- Toby and Dreele (2013) \BibitemOpen\bibfieldauthor B. Toby and R. V. Dreele, \bibfieldjournal Journal of Applied Crystallography 46, 544 (2013)\BibitemShutNoStop
- Momma and Izumi (2011) \BibitemOpen\bibfieldauthor K. Momma and F. Izumi, \bibfieldjournal J Appl Cryst 44, 1272 (2011)\BibitemShutNoStop
- Dunstan and Spain (1989) \BibitemOpen\bibfieldauthor D. Dunstan and I. Spain, \bibfieldjournal J. Phys. E: Sci. Instrum. 22, 913 (1989)\BibitemShutNoStop
- Spain and Dunstan (1989) \BibitemOpen\bibfieldauthor I. Spain and D. Dunstan, \bibfieldjournal J. Phys. E: Sci. Instrum. 22, 923 (1989)\BibitemShutNoStop
- Mao et al. (1988) \BibitemOpen\bibfieldauthor H. Mao, R. Hemley, Y. Wu, A. Jephcoat, L. Finger, C. Zha, and W. Bassett, \bibfieldjournal Physical Review Letters 60, 2649 (1988)\BibitemShutNoStop
Supplementary Material
| LP (11 kbar) | C2/m | = 7% | = 9% | = 3.01 | GOF = 4% |
|---|---|---|---|---|---|
| = 5.8436(15) Å | = 10.0876(8) Å | = 6.5237(18) Å | β = 107.098(5) ° | V = 367.56(6) Å3 | ρ = 3.060(1) g.cm-3 |
| Occ | |||||
| V(4g) | 0 | 0.331(1) | 0 | 0.86(4) | 0.079(4) |
| P(4i) | 0.043(4) | 0 | 0.122(3) | 1 | 0.091(6) |
| S(4i) | 0.758(2) | 0 | 0.249(4) | 1 | 0.071(6) |
| S(8j) | 0.260(2) | 0.1738(7) | 0.234(2) | 1 | 0.070(3) |
| HP-I (177 kbar) | C2/m | = 7% | = 10% | = 3.56 | GOF = 4% |
|---|---|---|---|---|---|
| = 5.5469(3) Å | = 9.5892(6) Å | = 5.4788(9) Å | β = 90.136(8) ° | V = 291.42(7) Å3 | ρ = 3.813(1) g.cm-3 |
| Occ | |||||
| V(4g) | 0 | 0.3431(4) | 0 | 0.86(4) | 0.090(3) |
| P(4i) | 0.0076(7) | 0 | 0.8492(20) | 1 | 0.061(3) |
| S(4i) | 0.3257(11) | 0 | 0.7214(7) | 1 | 0.025(4) |
| S(8j) | 0.8441(3) | 0.1649(3) | 0.7510(5) | 1 | 0.039(3) |
a)
b)
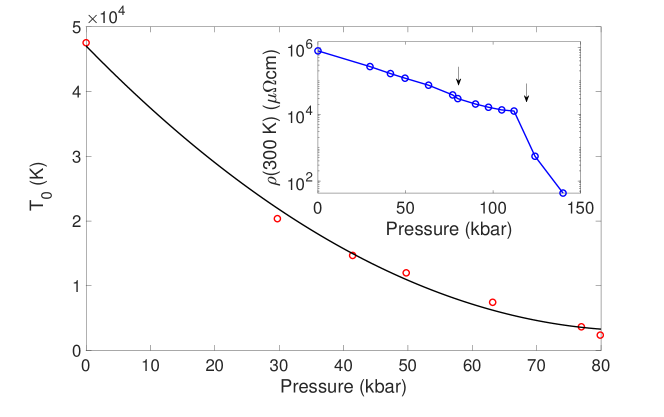
Unlike in other MPX3 materials such as FePS3 (Haines et al., 2018), the resistivity cannot be well described by a simple Arrhenius-type insulating temperature dependence - Fig. 8.a illustrates this by plotting against - the resulting plots are far from straight lines and can be fitted with a simple power law dependence. The simpler form against for an equivalent plot gives an extremely similar result and is the standard test for Arrhenius resistivity. Fig. 8.b shows the extracted characteristic temperature and the room temperature resistivity. If the data follows variable-range-hopping expression , plotting against as in Fig. 8.a then yields an expression and so the exponent can easily be found from a non-linear least-squares fit. Such fits are shown overlayed onto the data curves - good fits are seen up to pressures around 80 kbar, but then the quality of fits starts to decrease as the data move away from the VRH form, particularly at lower temperatures, as the insulator-metal transition is approached.
As the transition is approached, the characteristic temperature is continuously suppressed - again, no clear abrupt changes - until the VRH expression breaks down in the close proximity of metallization above 80 kbar. As electron overlap is increased by pressure, the hopping energies are gradually decreasing. The decrease in the room-temperature resistivity - a metric which is of course independent of any fitting methodology - is once again smooth and continuous, except for the insulator-metal transition at 112-124 kbar and a slight kink or change of slope around 80 kbar. 80 kbar corresponds to the maximum pressure of the LP - HP-I structural crossover, so a change in can be expected here as phase ratios are no longer changing and affecting the resistivity.