Inverse pressure-induced Mott transition in TiPO4
Abstract
TiPO4 shows interesting structural and magnetic properties as temperature and pressure are varied, such as a spin-Peierls phase transition and the development of incommensurate modulations of the lattice. Recently, high pressure experiments for TiPO4 reported two new structural phases appearing at high pressures, the so-called phases IV and V [M. Bykov et al., Angew. Chem. Int. Ed. 55, 15053]. The latter was shown to include the first example of 5-fold O-coordinated P-atoms in an inorganic phosphate compound. In this work we characterize the electronic structure and other physical properties of these new phases by means of ab-initio calculations, and investigate the structural transition. We find that the appearance of phases IV and V coincides with a collapse of the Mott insulating gap and quenching of magnetism in phase III as pressure is applied. Remarkably, our calculations show that in the high pressure phase V, these features reappear, leading to an antiferromagnetic Mott insulating phase, with robust local moments.
I Introduction
Modern advances in experimental high-pressure techniques have lead to numerous discoveries of new phenomena and previously unknown phases of materials Dubrovinsky et al. (2015); Bykov et al. (2018); Troyan et al. (2016). Recently, experiments based on synchrotron x-ray diffraction in diamond anvil cells Bykov et al. found two new high-pressure phases of TiPO4. One of these new phases, phase V, showed the first experimental confirmation of 5-fold O-coordinated P-atoms in an inorganic phosphate compound.
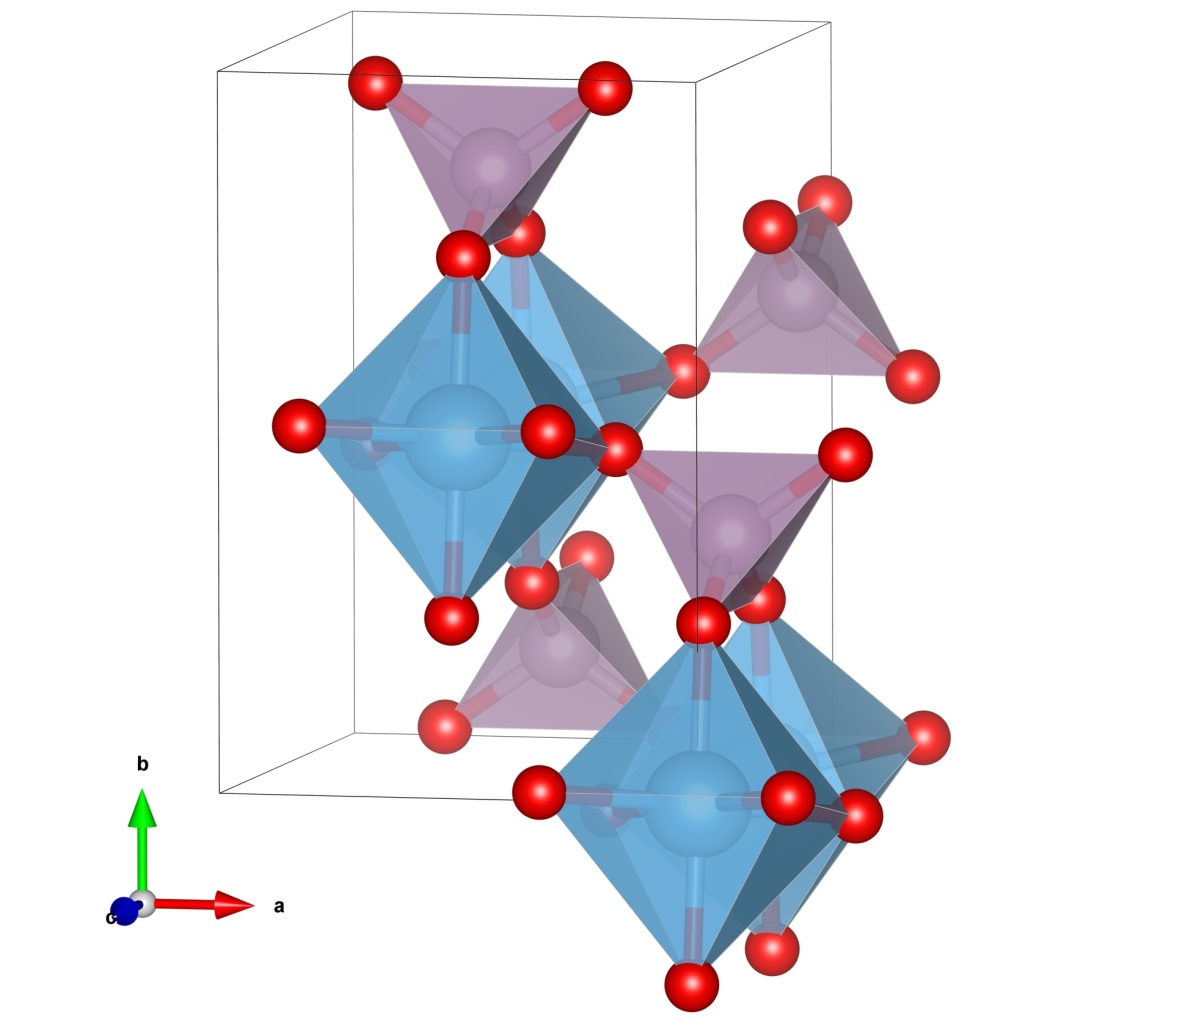
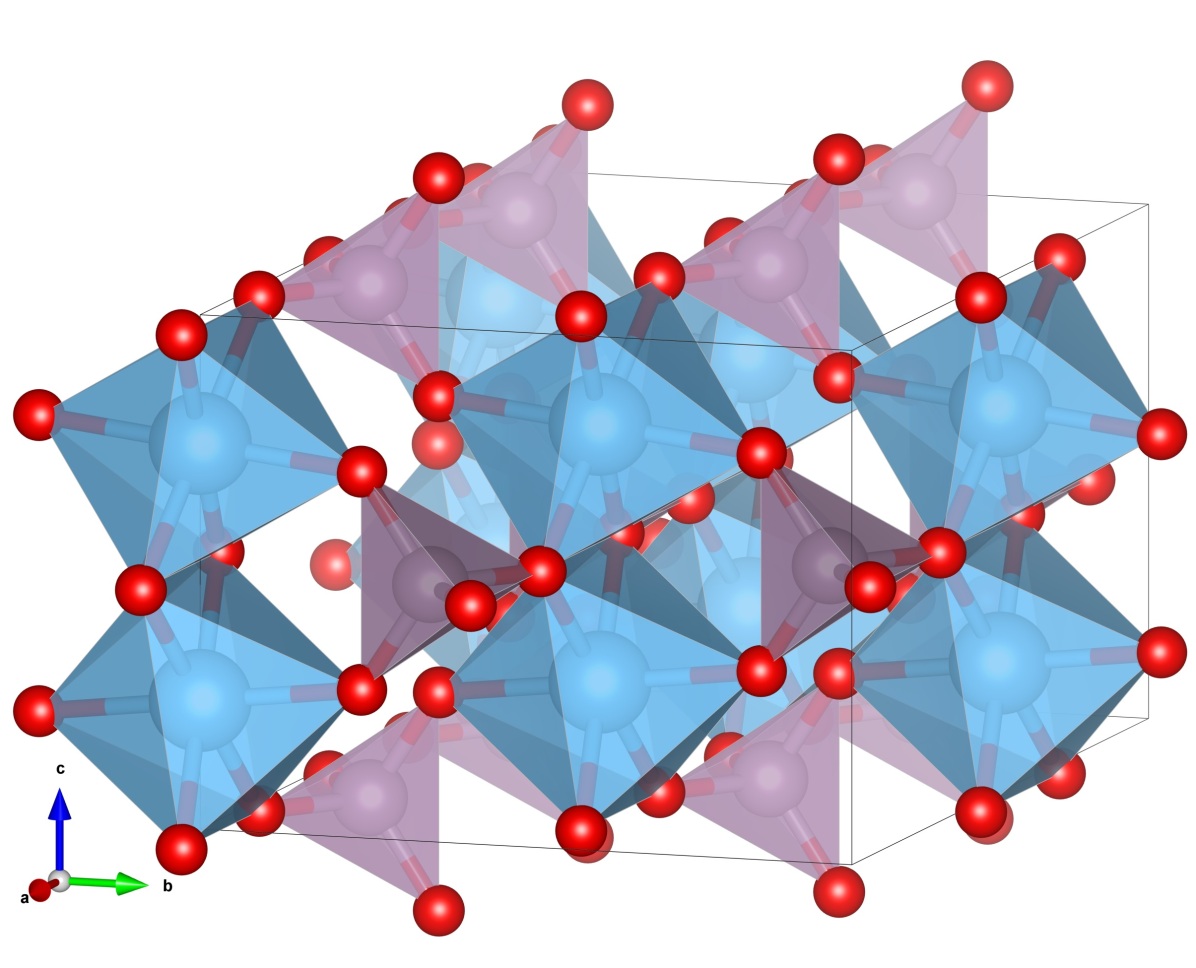
At ambient conditions, TiPO4 crystallizes in the orthorhombic CrVO4-structure (space group ) which features TiO6 and PO4 polyhedra (Fig. 1(a)), and is referred to as phase IBykov et al. . The edge-sharing TiO6 octahedra form quasi-one-dimensional (1D) magnetic chains along the c-axis. By means of nuclear magnetic resonance measurements in combination with ab-initio calculations, magnetic coupling along these chains has been determined to be antiferromagnetic (AFM)Law et al. (2011). TiPO4 has attracted attention as being one of only a few inorganic materials undergoing a spin-Peierls (SP) transition with a particularly high critical temperature of K Law et al. (2011); Wulferding et al. (2013); Bykov et al. (2013), which can be compared to K in CuGeO3, and 34 K in NaV2O5Hase et al. (1993); Isobe and Ueda (1996). The temperature of the SP transition in TiPO4 appears to be sensitive to the applied pressure. Ambient temperature compression to 4.5 GPa leads to an incommensurately modulated structure (phase II), that is seen upon cooling below 111 K at ambient pressure. The commensurate spin-Peierls phase III (Fig. 1(b)) becomes stabilized at 7.3 GPaBykov et al. at room temperature.
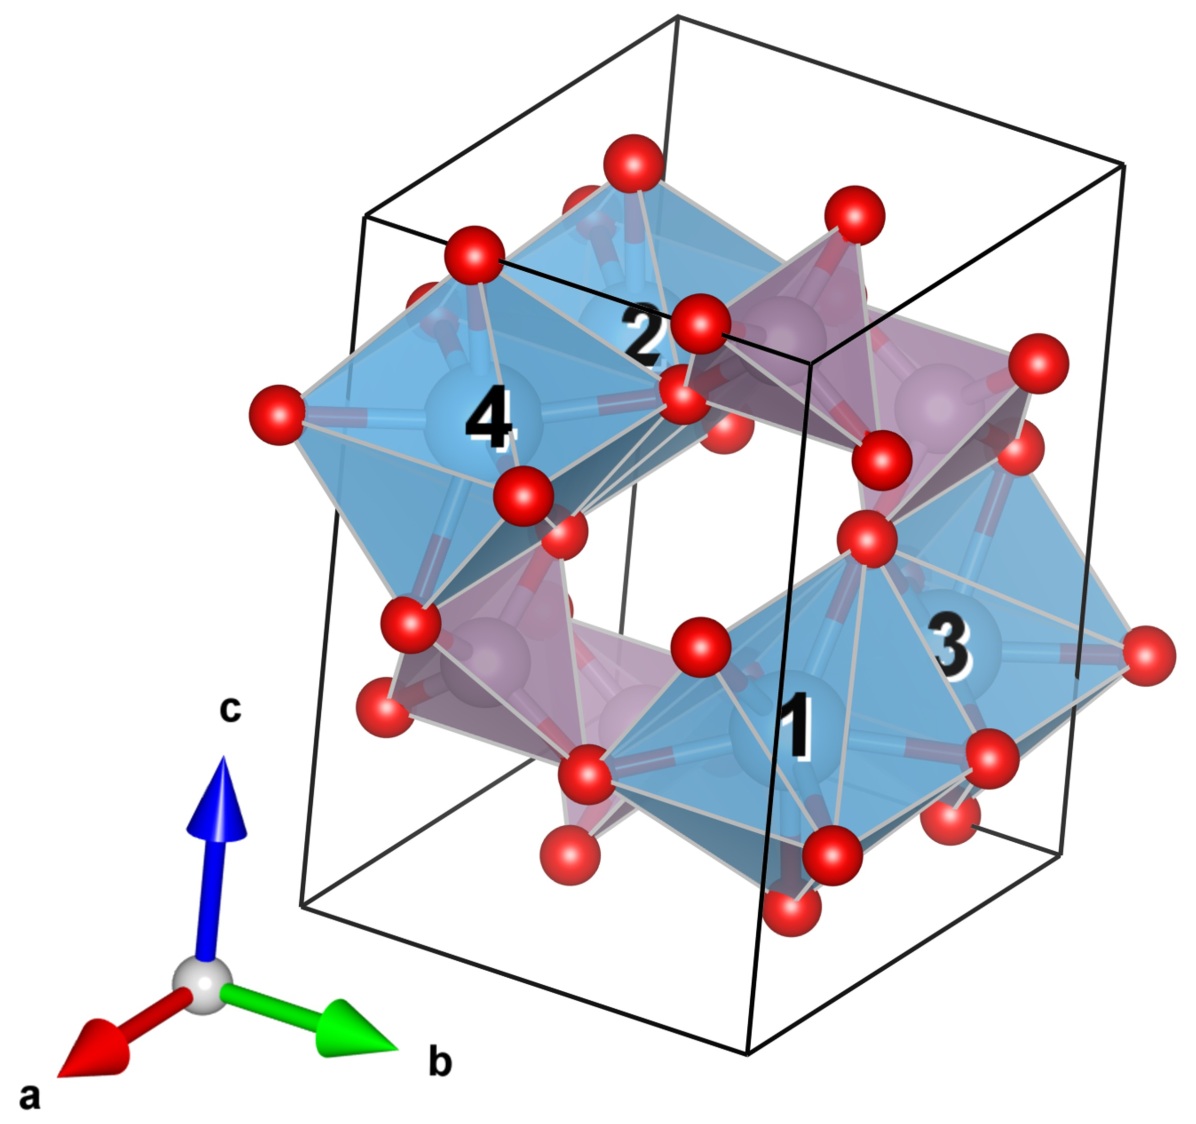
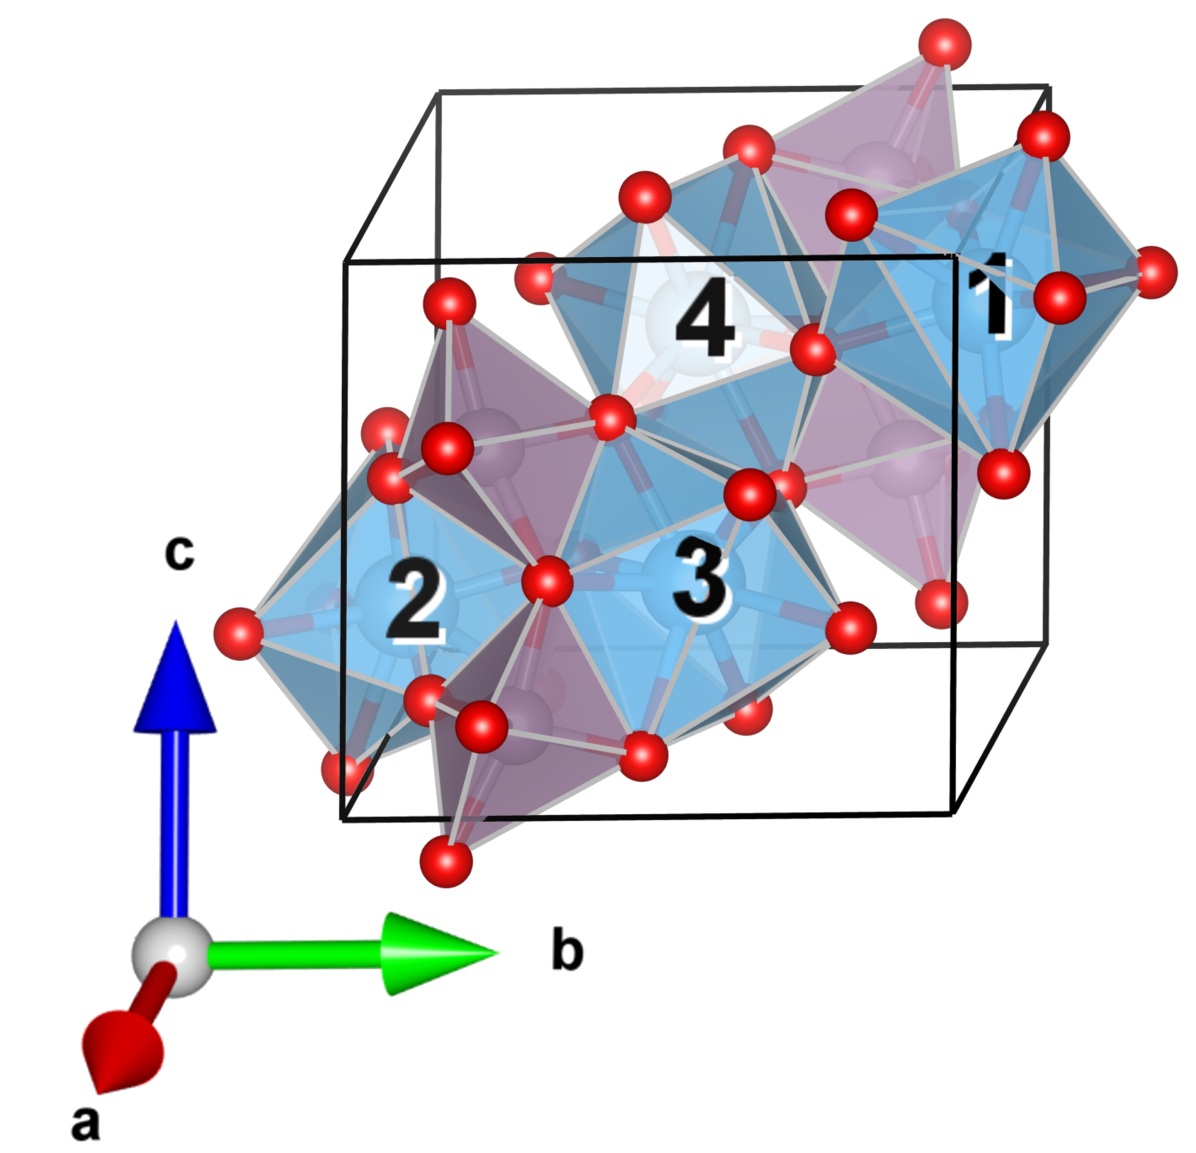
Phase III can be regarded as a fourfold superstructure of phase I, and features the same TiO6 and PO4 polyhedra. However, above 46 GPa, the diffraction pattern has been reported to change drastically, revealing a structural transition into two coexisting phases, called IV and V (Figs. 1(c) and 1(d))Bykov et al. . Phase IV is similar to phase III but with a denser hexagonal packing of the O-atoms. This means that the TiO6 octahedra become highly distorted, leading to TiO7 capped trigonal prisms while the PO4 tetrahedra are retained. Phase V has monoclinic P symmetry, with interlinked TiO7 and the unprecedented PO5 polyhedra.
Little is known about these high-pressure phases, due to the difficulties associated with conducting in-situ measurements in diamond-anvil cells. In this work, we investigate the electronic structure of the novel high pressure phases of TiPO4. In particular, we focus on the relative stability of phases IV and V, as well as orbital and magnetic ordering, and demonstrate the exciting Mott physics that occurs in highly compressed TiPO4. Our experiments reveal that upon compression the band gap in phase III shrinks, as indicated by a reddening of the color of the samples. At the transition to phases IV and V the sample contains a mix of phases IV and V, and its color turns black. Ab-initio calculations show that the gap is indeed closed in phases III and IV at high pressure. However, phase V features a sizeable Mott gap and magnetic moments.
II Experimental details
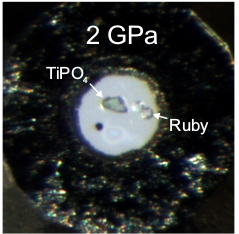
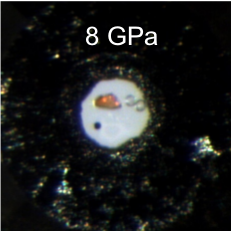
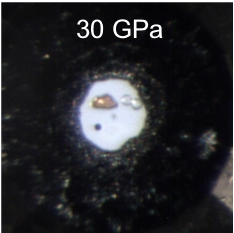
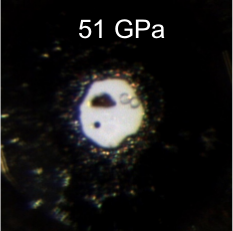
A single crystal of TiPO4 from the same synthetic batch that was used for the high-pressure studies in Ref. 4 was placed inside a sample chamber in a BX90 diamond anvil cell. Neon was used as a pressure-transmitting medium, while a small chip of ruby was used as a pressure standardMao et al. (1986). The sample was compressed in a few steps up to 51 GPa to track the color change of the crystal upon compression.
III Computational details
Calculations were performed using the projector augmented wave Blöchl (1994); Kresse and Joubert (1999) (PAW) method implementation in the Vienna Ab-initio Simulations Package Kresse and Furthmüller (1996a, b) (VASP). For the antiferromagnetic calculations we employed a plane wave energy cut-off of 520 eV. The calculations employed the local density approximationPerdew and Zunger (1981) (LDA) with an added on-site effective interaction parameter, U (LDA + U) as parametrized by Dudarev et al.Dudarev et al. (1998) Calculations of phase I employed a k-point mesh of 10x8x10 k-points using the Monkhorst-Pack schemeMonkhorst and Pack (1976), with a total of 200 k-points in the irreducible Brillouin zone. For phase III we employed a k-point mesh of 5x7x11 k-points, resulting in a total of 112 k-points in the irreducible Brillouin zone. For the structural optimization of phases IV and V we employed k-point meshes of 12x10x8 and 7x4x5, resulting in 240 and 70 k-points in the respective irreducible Brillouin zones. For the calculations of the electronic structure of phase V a refined k-point mesh of 9x7x5, giving 158 k-points in the irreducible Brillouin zone, was used.
Calculated energies and volumes were fitted to the third order Birch-Murnaghan equation of state (EOS)Birch (1947). We chose the value U eV because it adequately reproduces the experimental equation of state, as demonstrated below, as well as the quite complex pressure dependence of the crystal structure parameters of phase III, as will be presented elsewhere.
IV Results
Fig. 2 shows the change in color of the TiPO4 crystal on compression in a diamond anvil cell. Upon phase transformation to phase III, the color of the crystal changes from green (Fig. 2(a)) to orange (Figs. 2(b), 2(c)), while the transition to phases IV and V results in the sample turning black.
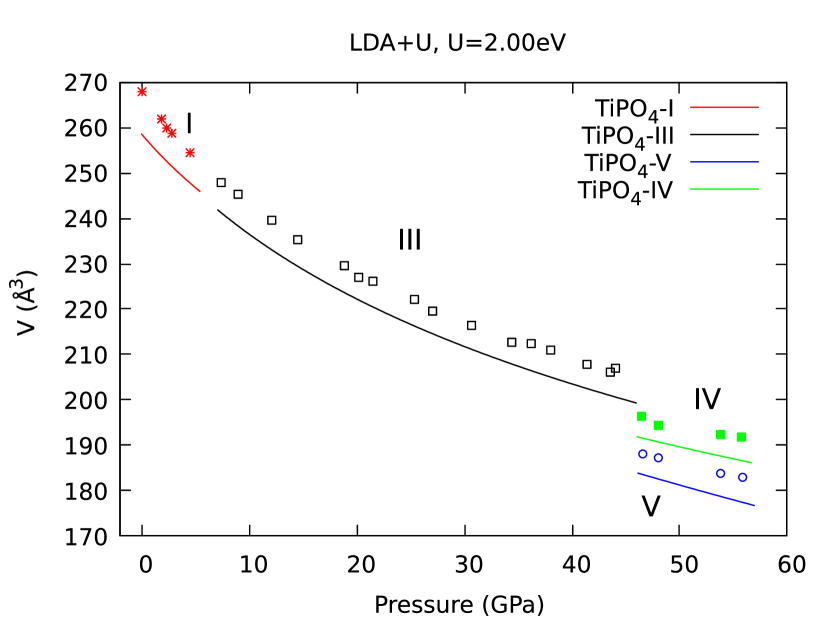
In Fig. 3 we show the obtained volume-pressure relation for phases I, III, IV and V. Phase I was set up in the same AFM configuration used in earlier calculationsLópez-Moreno and Errandonea (2012). We considered phase III in the AFM configuration suggested by experiments Bykov et al. . For phases IV and V we compare the calculated enthalpy, , for four different magnetic configurations; ferromagnetic , as well as three antiferromagnetic configurations, , and (the order of Ti atoms is shown in Fig. 1). For phase IV, all configurations lie within 2 meV/atom from each other, with the AFM configuration having the lowest enthalpy. In phase V, the difference in enthalpy is at most 4 meV/atom, with the AFM configuration being the lowest. The difference in enthalpy is very small compared to typical thermal energy at room temperature ( meV). This means that at room temperature, phases IV and V are most likely in a paramagnetic state with disordered local moments.
There is a pressure-independent underestimation of the theoretical unit cell volume of about 4% compared to experiments. However, the overall behaviour of the EOS is very well reproduced. Our results for agree well with previous results obtained for phase I using the PBE functional, without on site interaction U López-Moreno and Errandonea (2012), however we obtain a lower value of . This should be seen in the light that our calculations do not include thermal effects and that the PBE functional fails to reproduce an insulating ground state for phase III. The transition from phase III to phases IV and V includes a decrease in the unit cell volume. In Table 1 we summarize the equilibrium parameters obtained from the EOS fits for the different phases. Note that for phase IV and V there is a decrease in equilibrium volume and a significant increase in bulk modulus. Comparing phases III and V, there is a twofold increase of for the high pressure phase.
| V0 (Å3) | B0 (GPa) | B | |
| Phase I | 258.56 | 92 | 6.5 |
| Phase III | 258.79 | 87 | 5.4 |
| ExperimentBykov et al. (phases I, II and III) | 267.86 | 72 | 6.5 |
| Phase IV | 236.46 | 133.11 | 4.8 |
| Phase V | 225.95 | 179 | 2.4 |
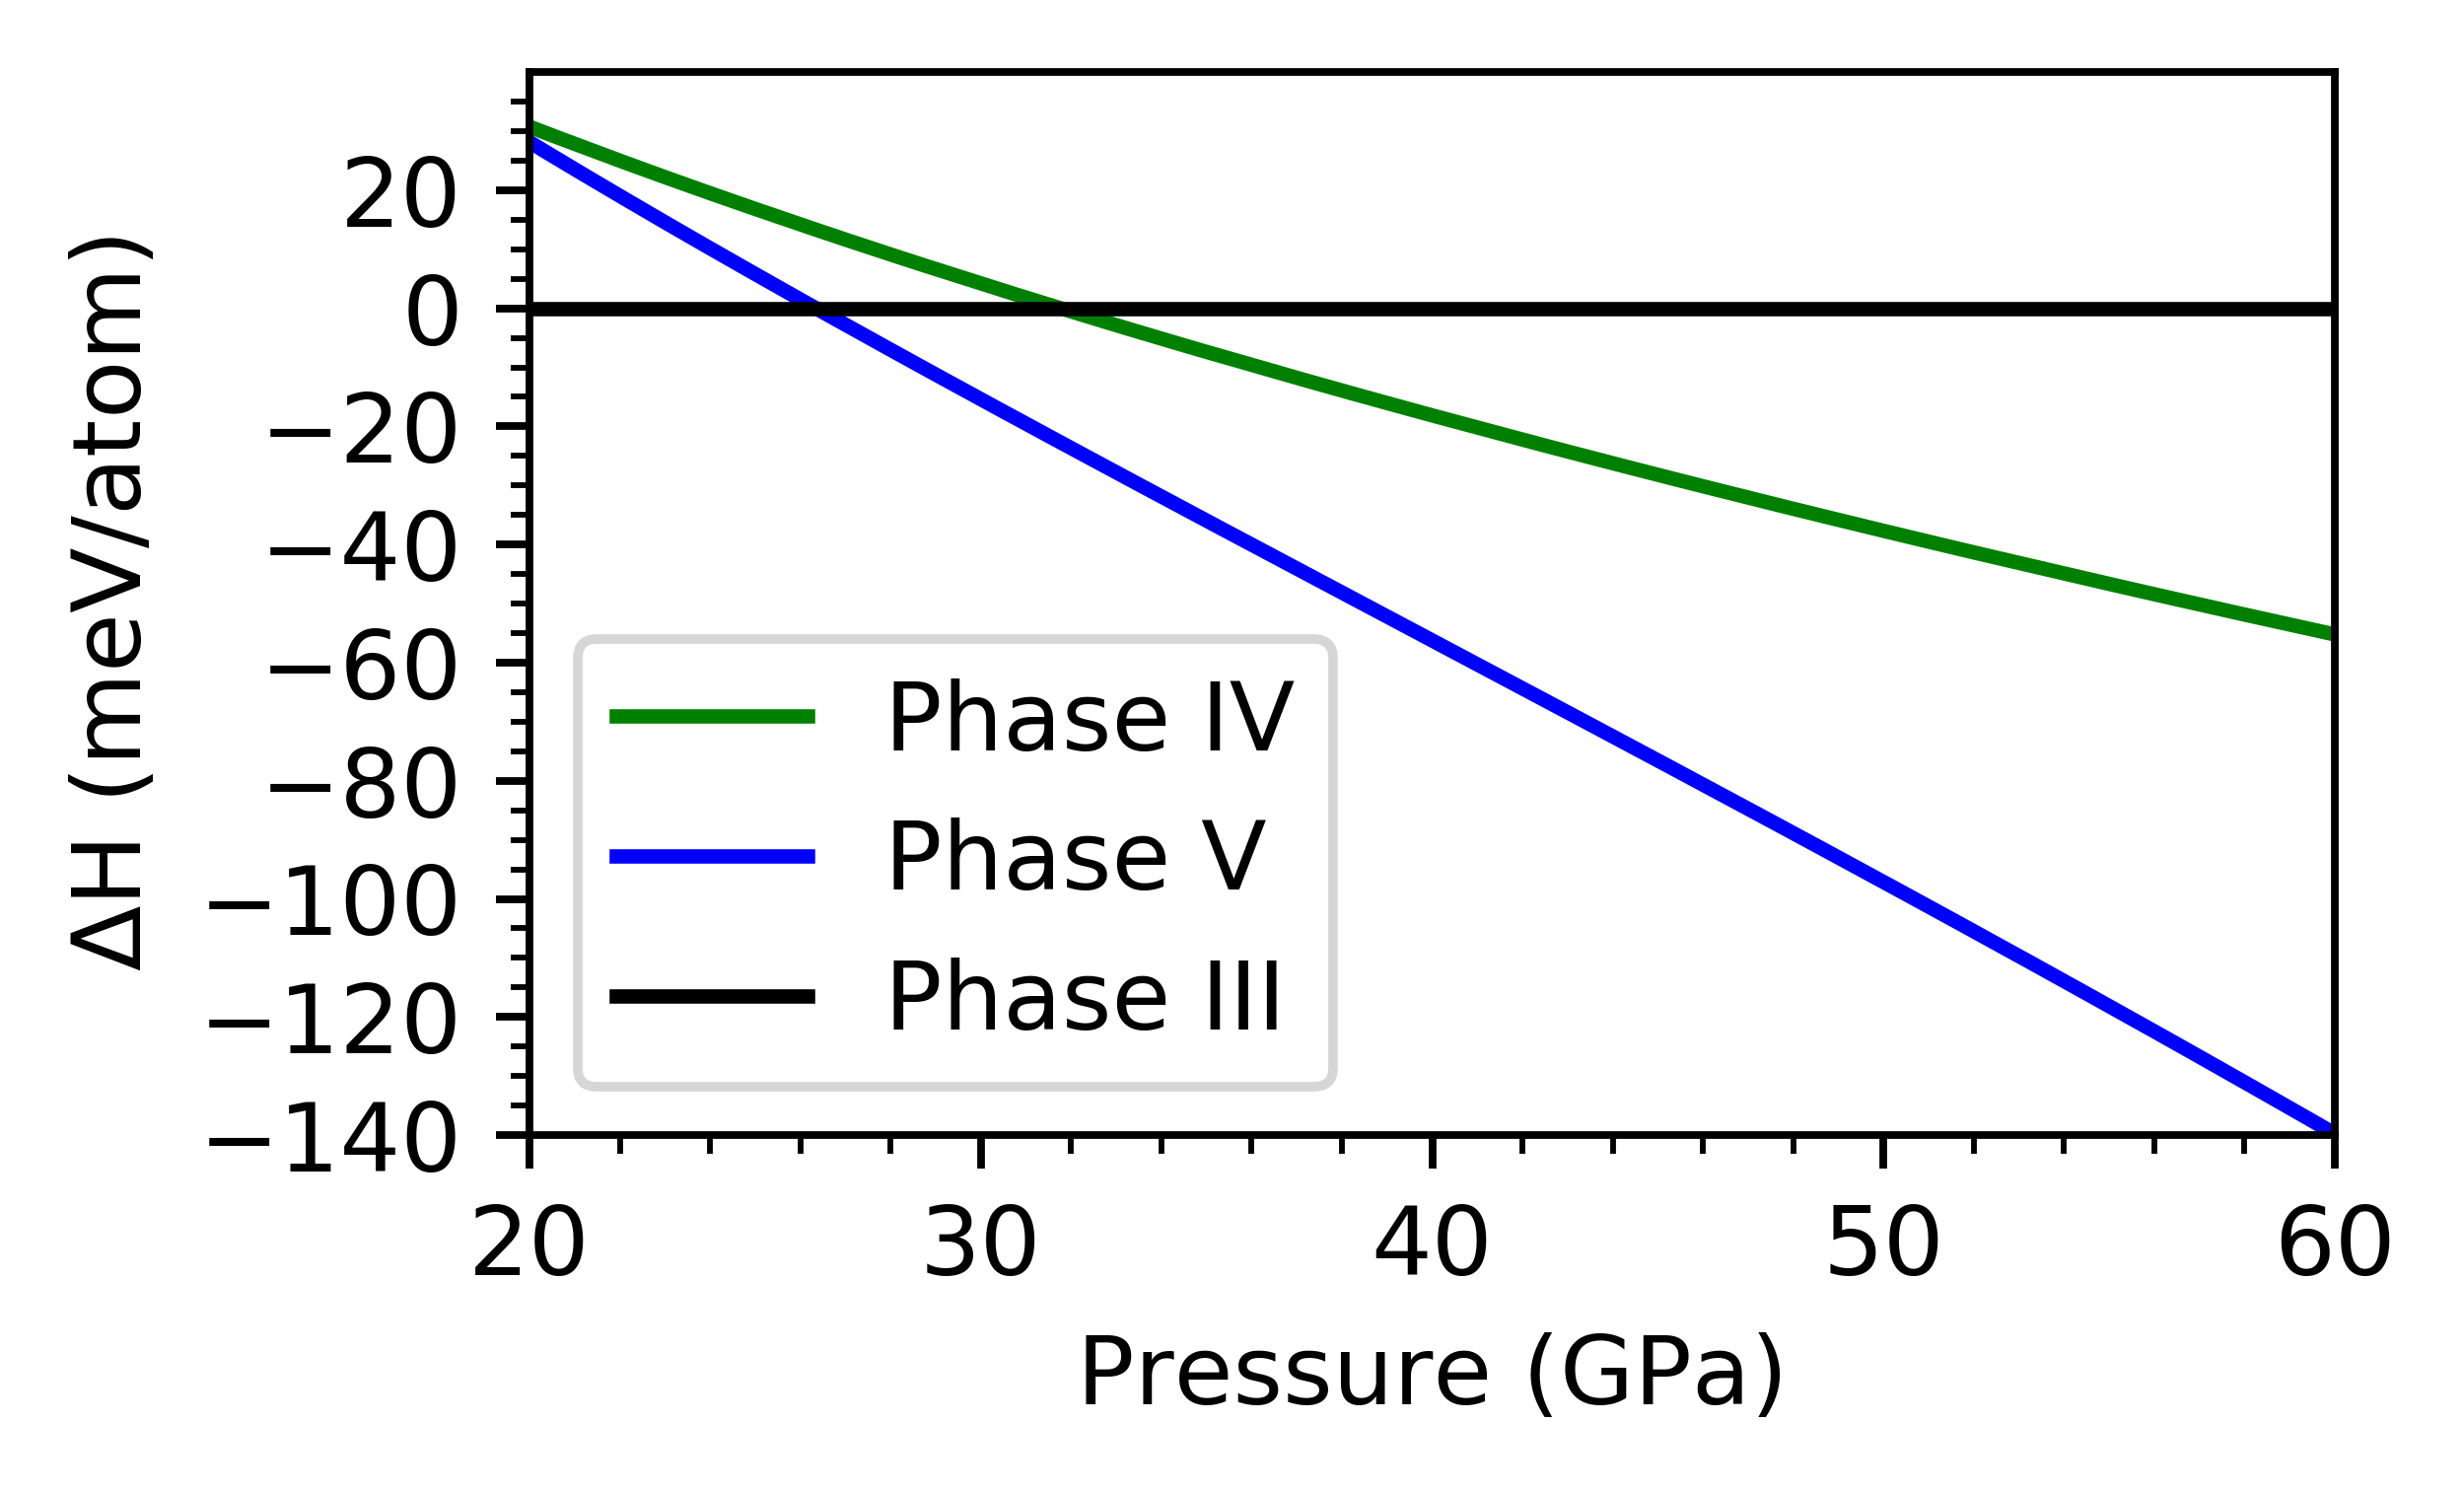
In Fig. 4 we show the enthalpies of phases IV and V relative to phase III. We see that phase V becomes favorable over phase III at around 25 GPa, and phase IV becomes favorable over phase III at around 33 GPa. In (room temperature) experiments these two phases have been reported to appear at around 45 GPa. The underestimation of the transition pressure is expected, due to the systematic underestimation of the volume in the EOS (the pressure is thus too low at each volume). As outlined in Ref. 4 the transition from phase III to phase IV involves only small changes to the crystal structure, whereas the transition from phase III to V involves substantial rearrangement. Interestingly, phase V is lower in enthalpy than phase IV in the entire pressure range. Thus it appears that phase V is the thermodynamically stable phase at high pressures, while phase IV is kinetically stable, which explains the coexistence of the two structures in the high-pressure experimentBykov et al. . Phase IV maintains the alternating Ti-Ti distances along the a-direction observed in the SP phase IIIBykov et al. .
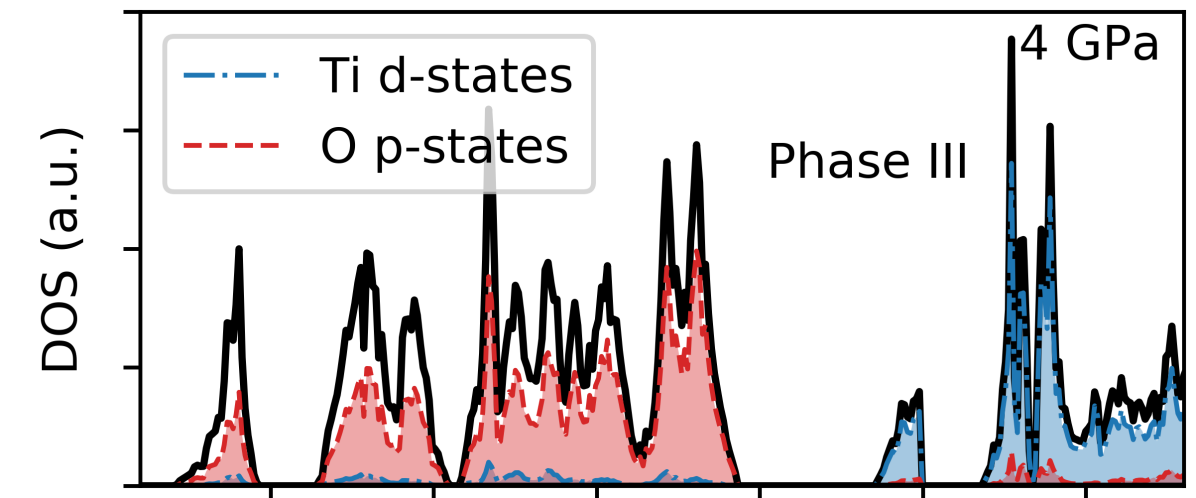
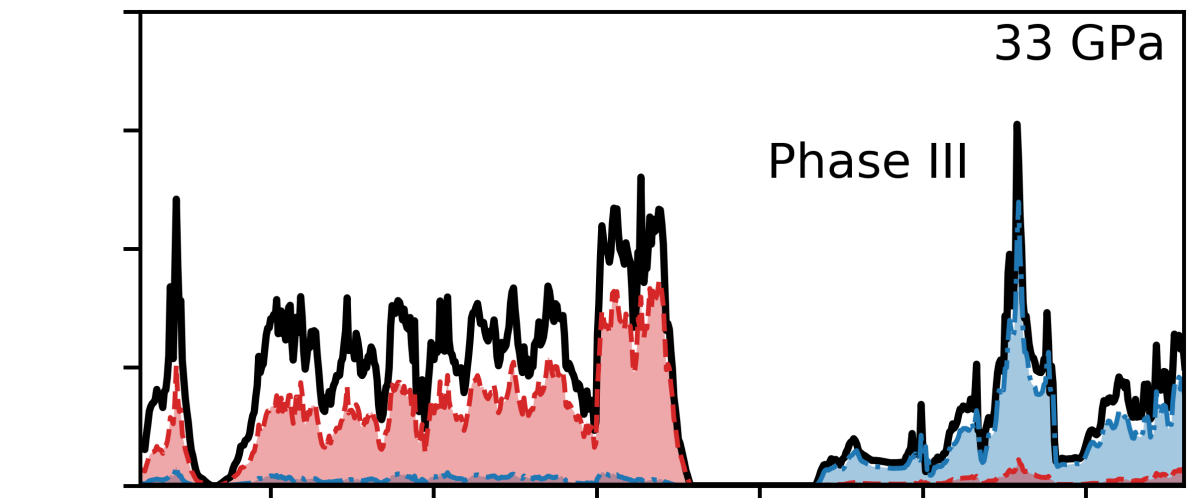
Phase III is stable for a large range of pressures. Figure 5(a) shows its calculated density of states (DOS) at 4 GPa. A band gap between the occupied and unoccupied states is clearly visible. This is in line with experimental observations (Fig. 2) that the samples are transparent at this pressure. As pressure is increased the gap at the Fermi level shrinks, also in agreement with experiment. In Fig. 5(b) we see that at a pressure around 33 GPa the gap in phase III is completely closed. This pressure is lower than the experimental pressure at which samples lose their transparency. However, it is the same pressure at which phases IV and V become energetically favorable in calculations. Although calculations underestimate the transition pressure we conclude that, in agreement with experiment, the closing of the gap and the structural transition from phase III to phases IV and V coincide.
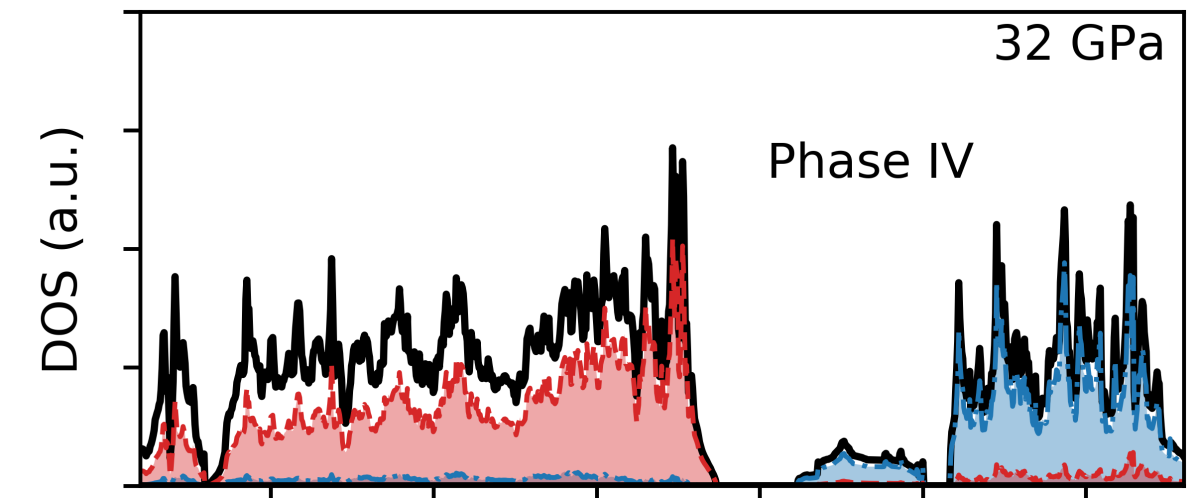
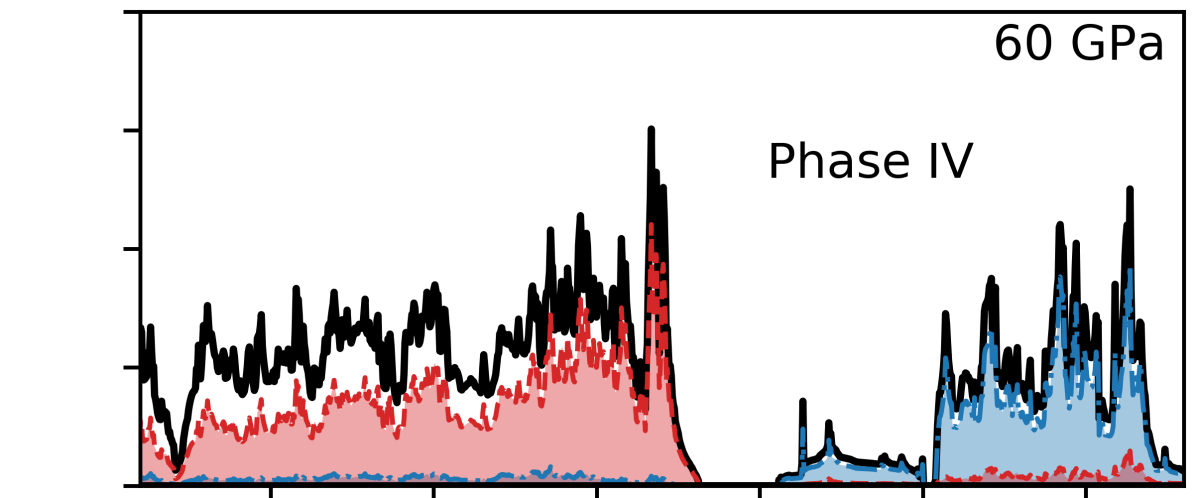
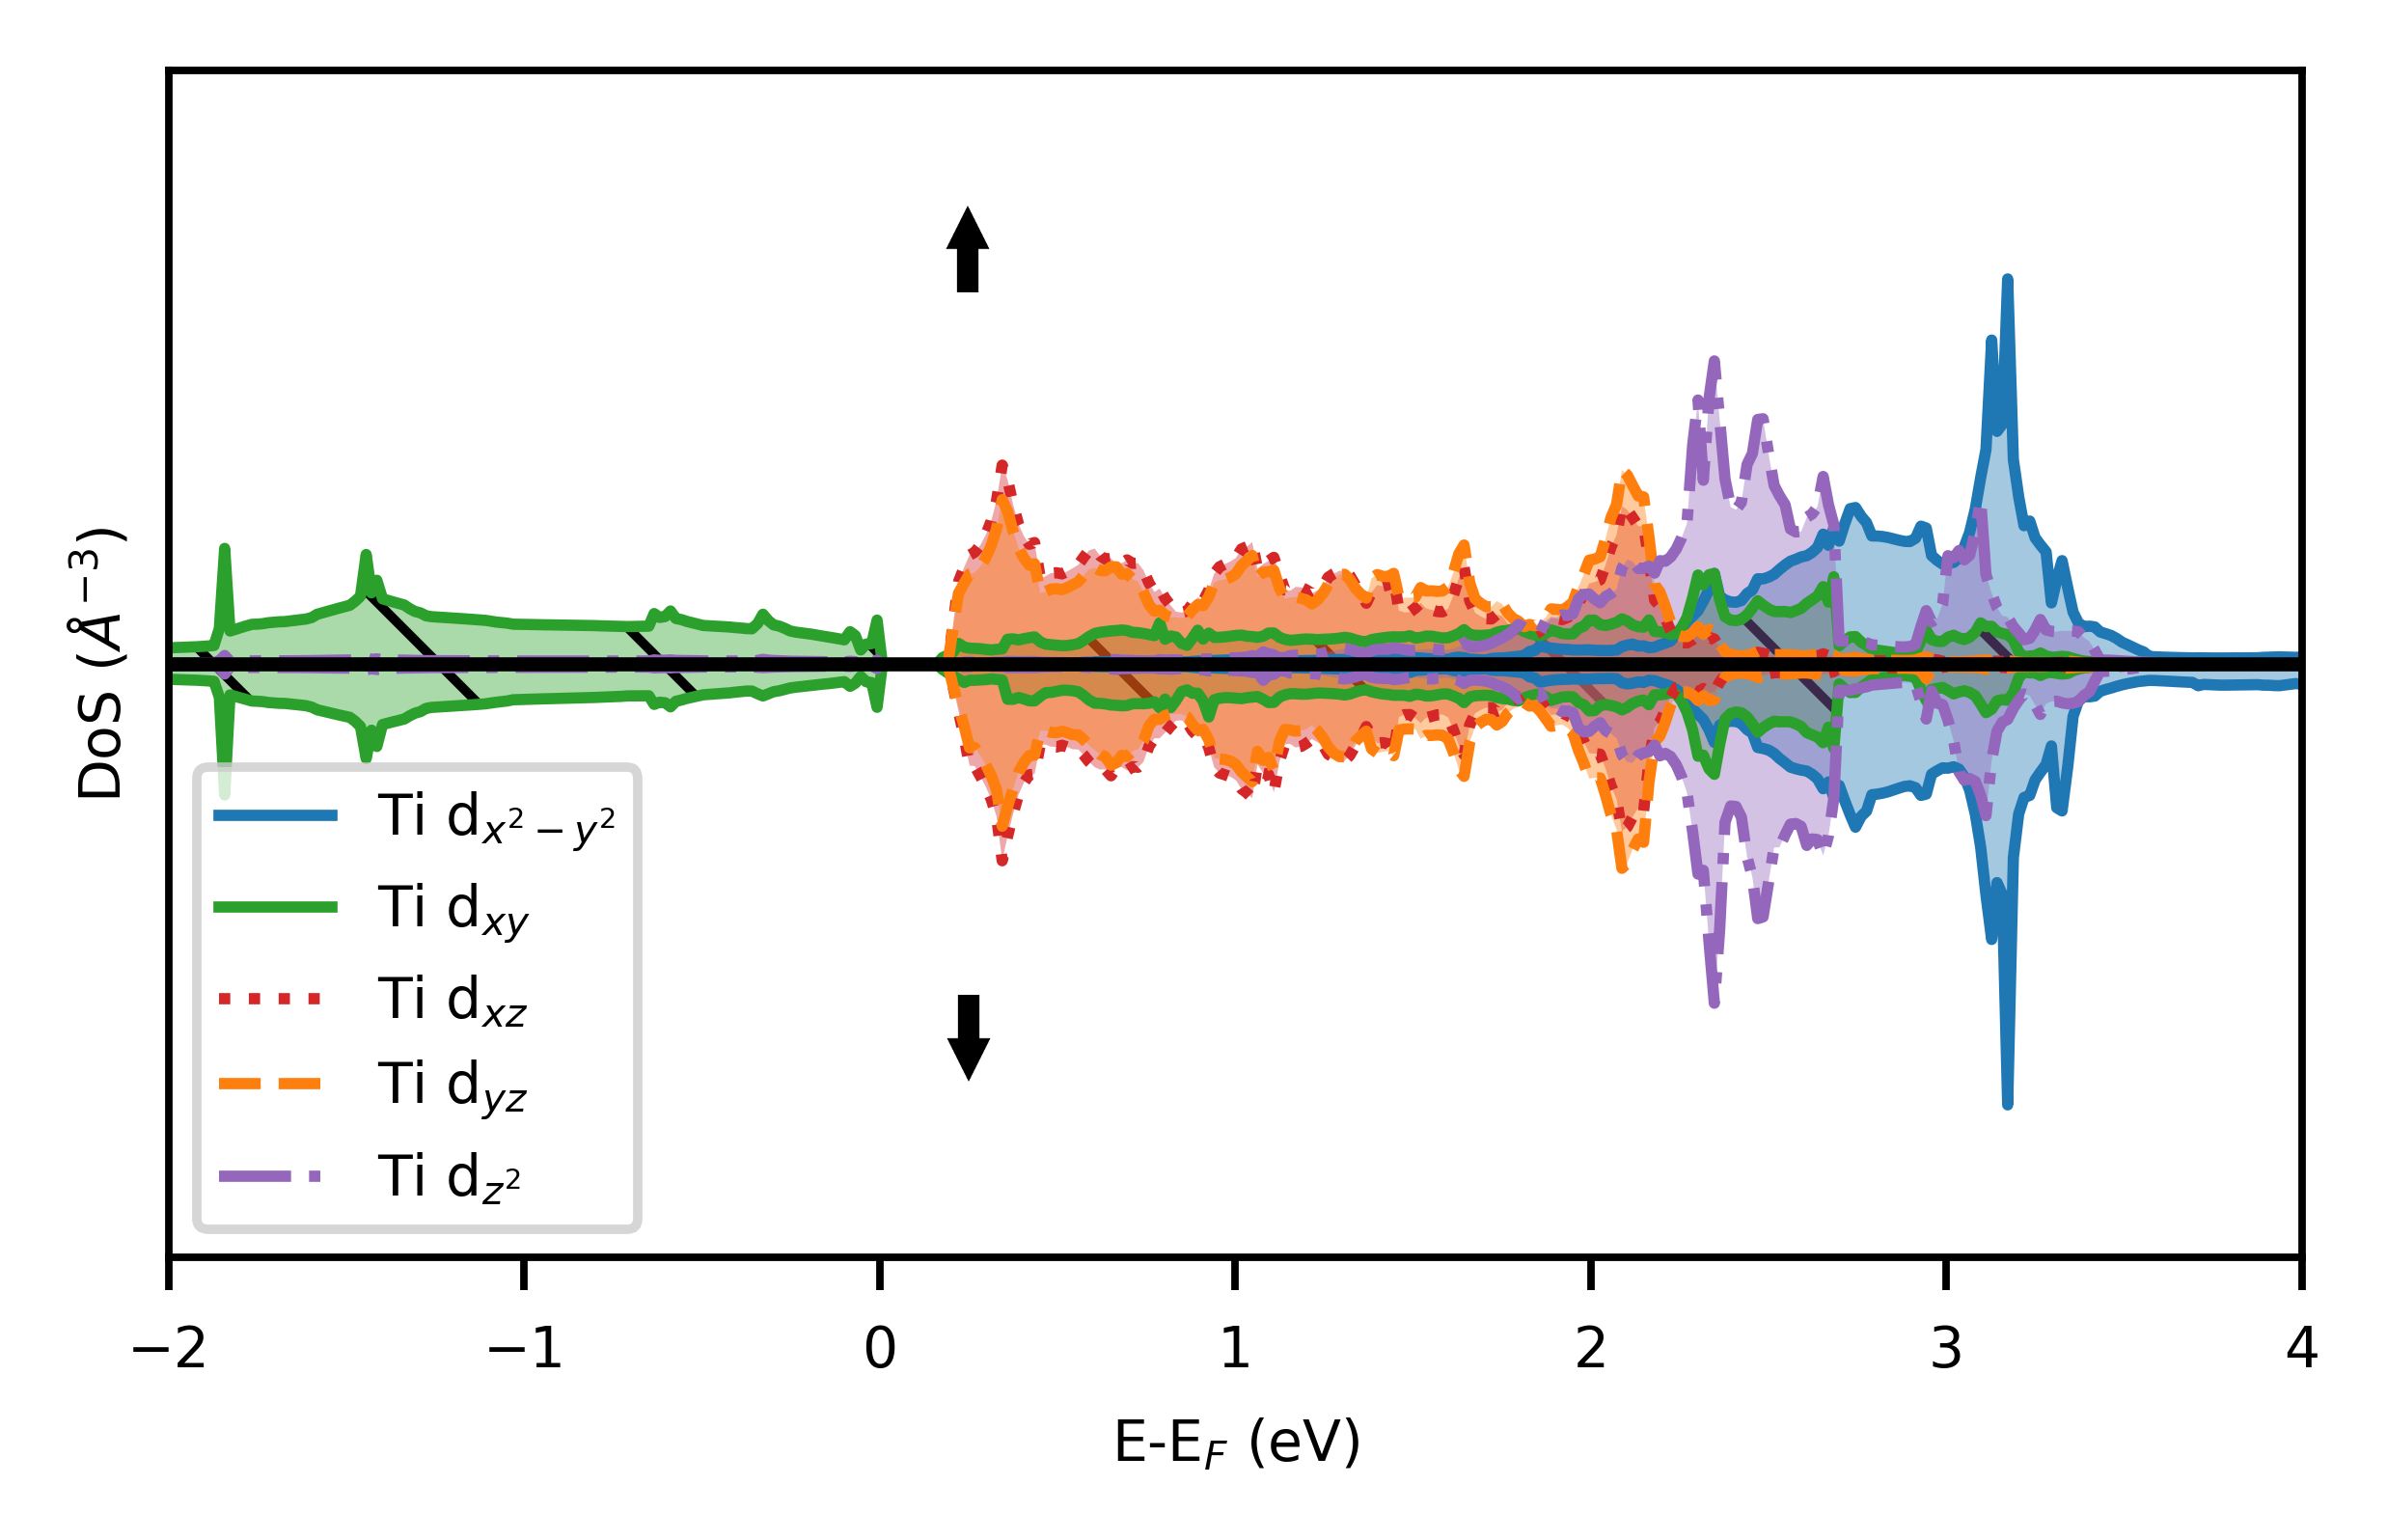
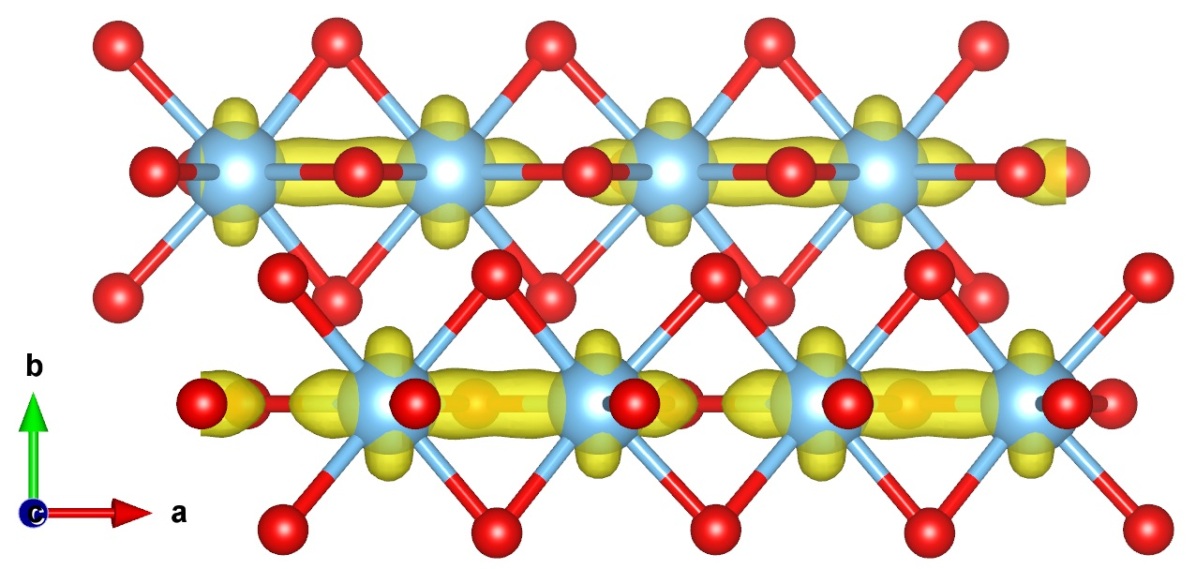
In Fig. 5(c) we show the calculated DOS for TiPO4 phase IV at a pressure of 32 GPa. A very small band gap of eV is visible. The low-binding energy part of the spectrum is of mainly Ti-d character, corresponding to a singly occupied dxy orbital, as shown in Fig. 6. This is separated from a high-binding part of filled O-p states. In Fig. 7 we show the occupied d-orbitals plotted in real space. There is a clear overlap of bonding orbitals in Ti-chains along the a-direction, indicating direct exchange coupling. Note the separation of charge between Ti-pairs, due to the alternating Ti-Ti distances. In Fig. 5(d) we show the calculated DOS of phase IV at a pressure of 60 GPa. The band gap has been reduced to eV. Indeed, the samples are seen in experiments to be dark (Fig. 2(d)).
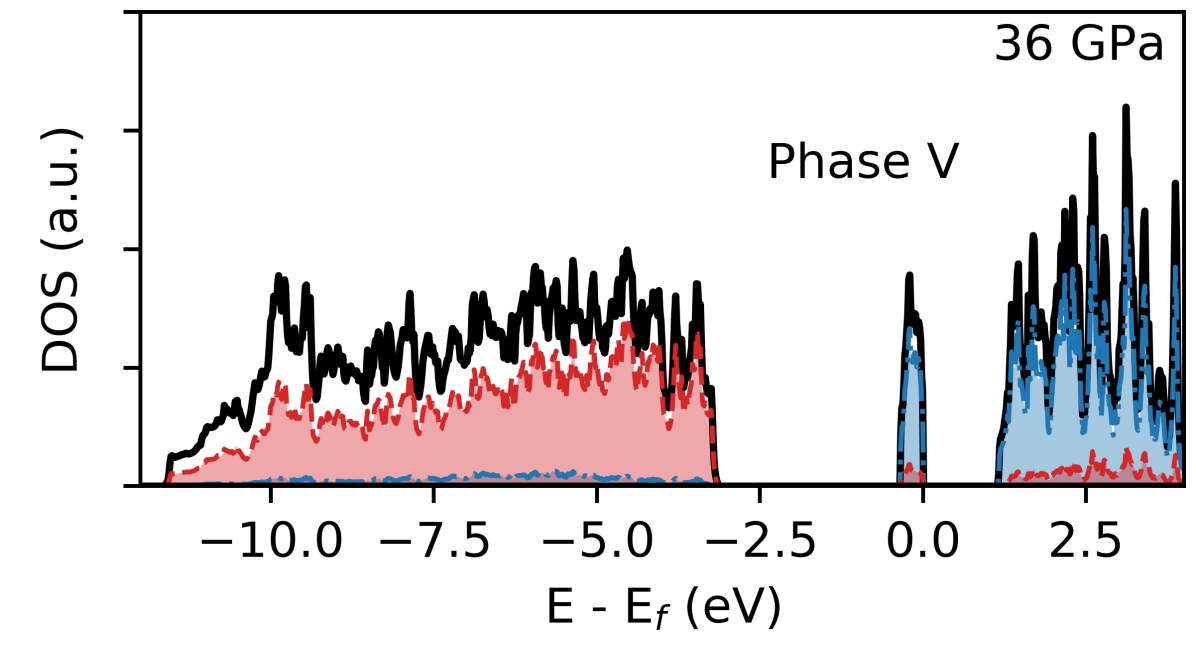
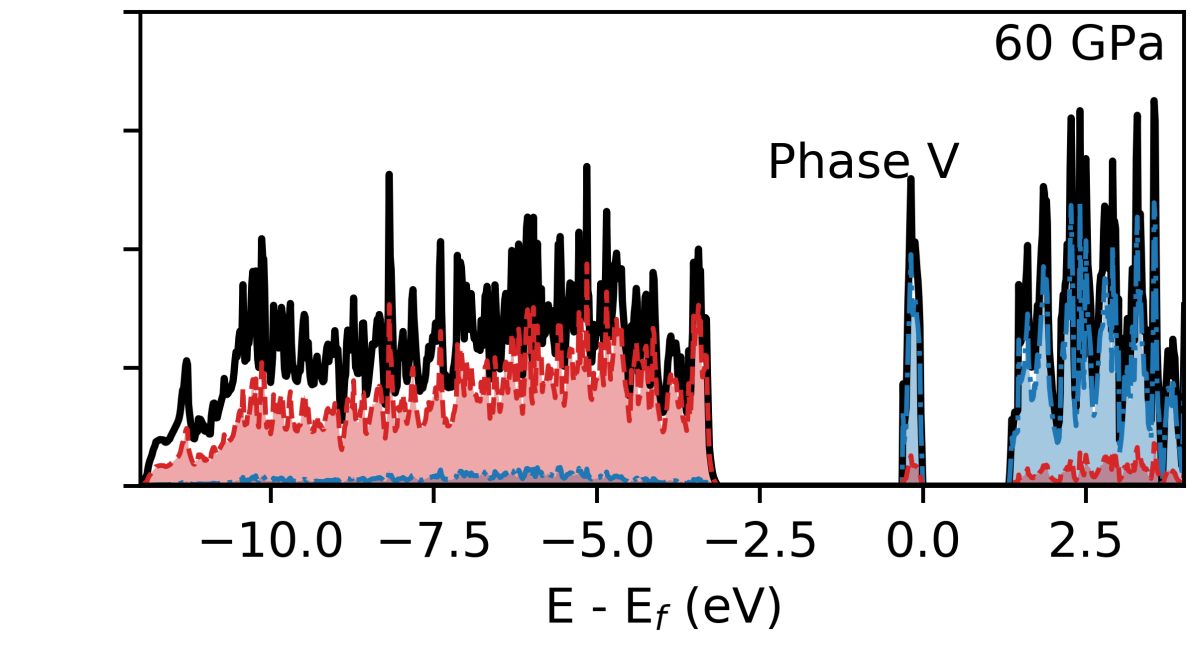
In Fig. 5(e) the calculated DOS for phase V at a pressure of 36 GPa is shown. The DOS for phase V at 58 GPa is shown Fig. 5(f). A very narrow, singly occupied, d-level is separated from a high binding energy manifold. A wide insulating gap separates the occupied and unoccupied d-orbitals. Experimentally the samples seem to be darker, almost black. It should be noted that the sample contains a mixture of phase IV and V at this point, and our calculations indicate that the gap in phase IV should be very small, making phase IV appear black. Phase V has in contrast a larger gap and should thus be transparent. In the sample the black phase IV is likely obscuring the transparent phase V.
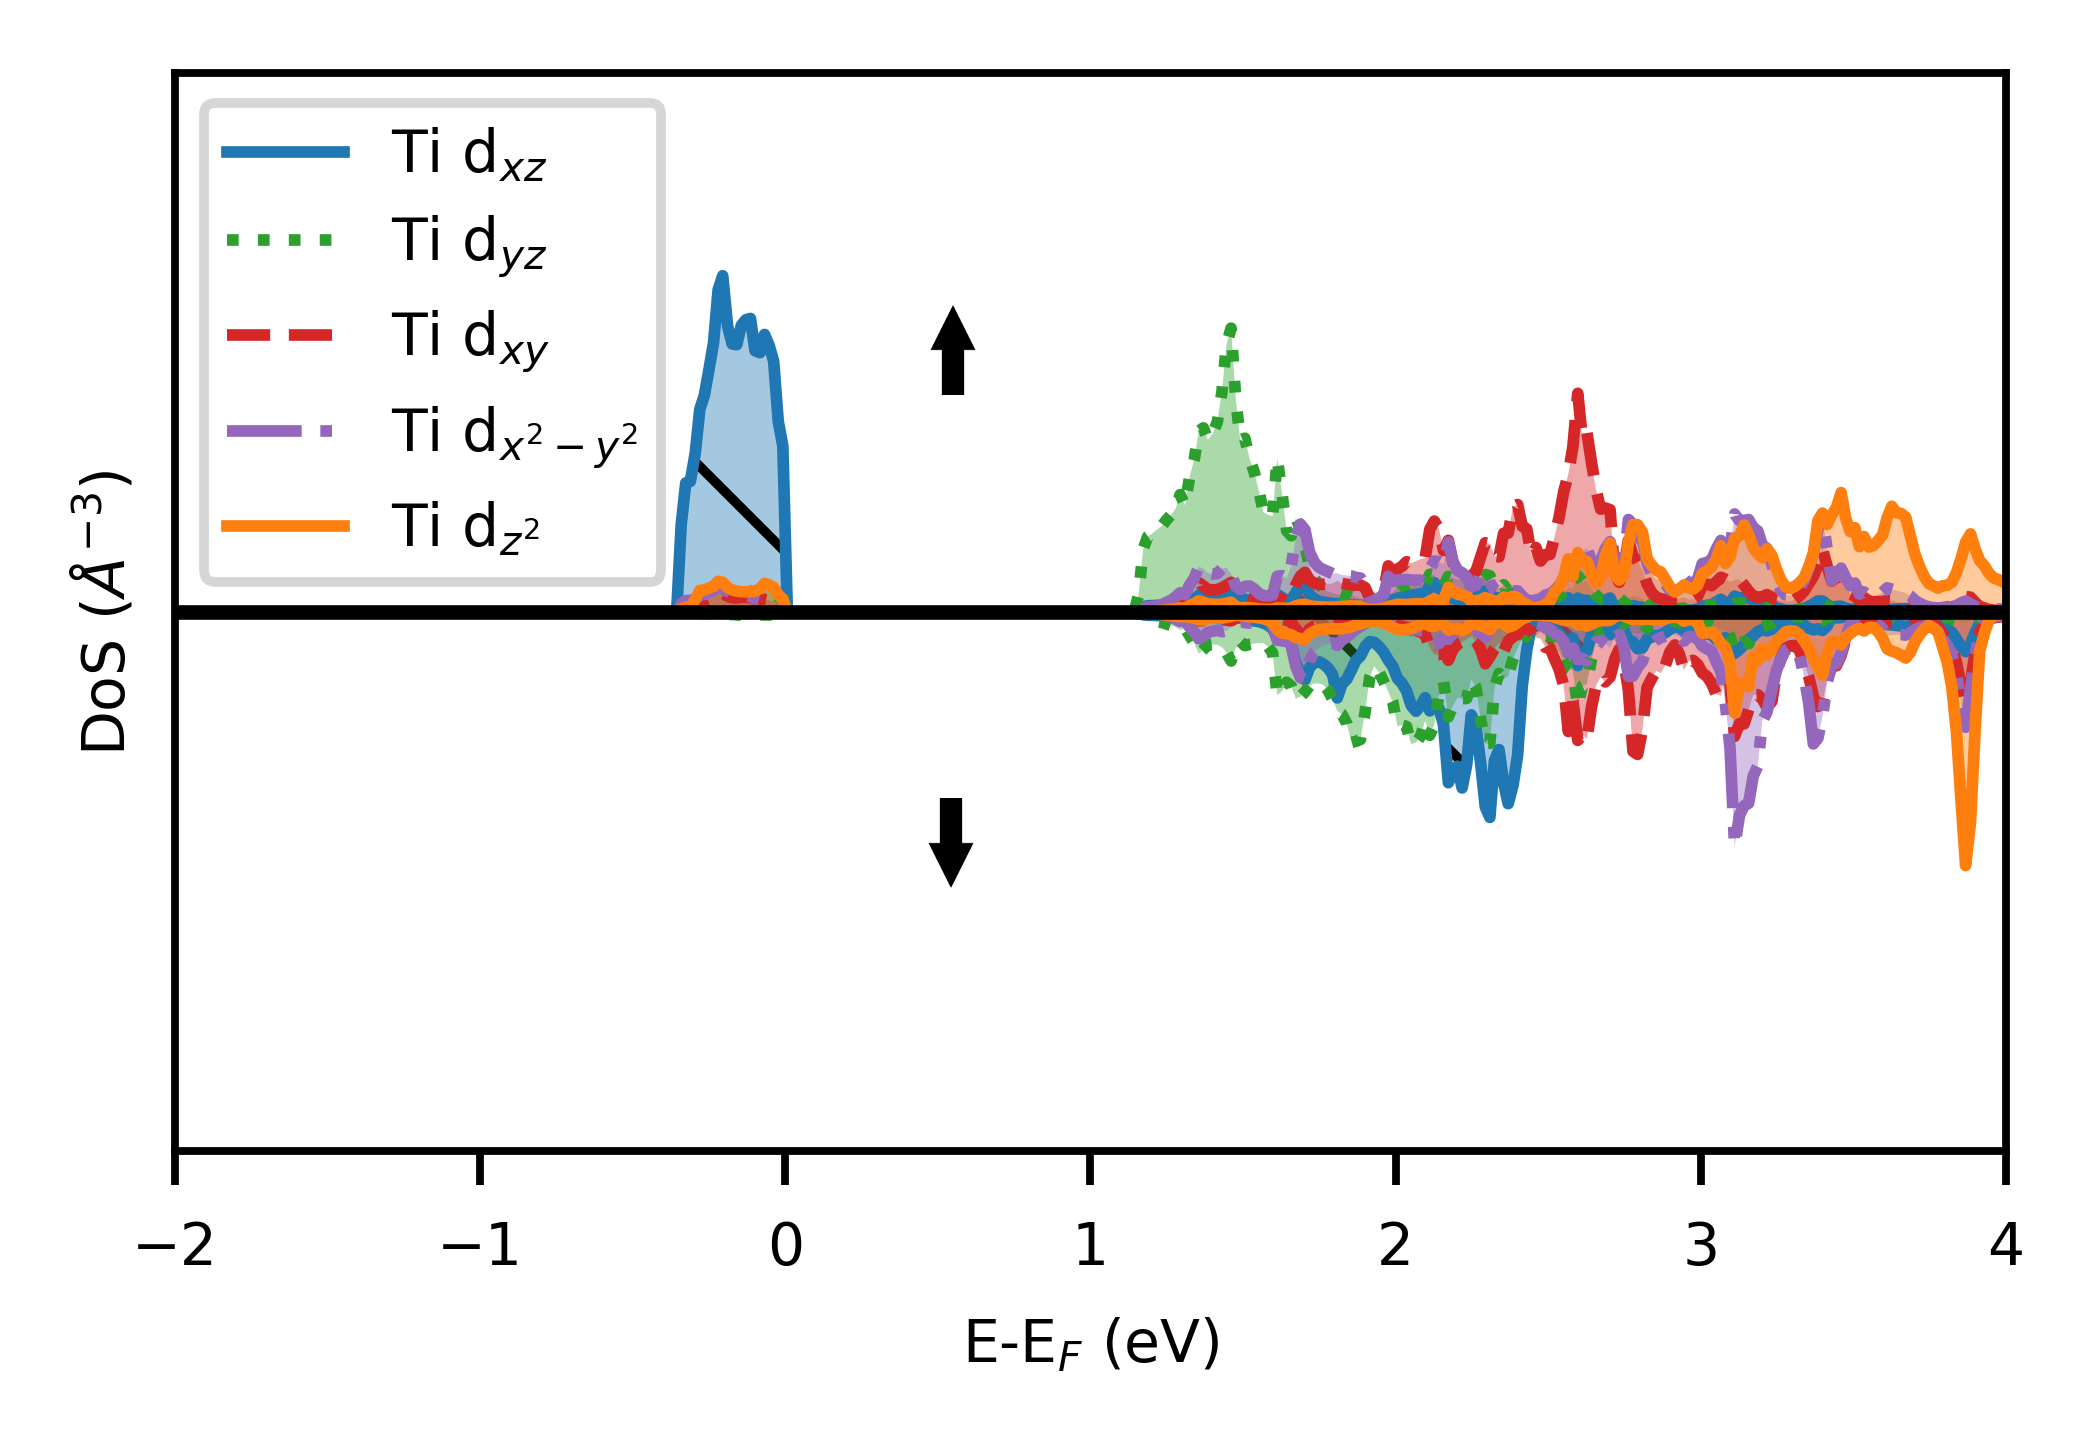
The local DOS for one Ti atom in phase V is shown in Fig. 8. Due to the pentagonal bi-pyramidal oxygen complex surrounding the Ti atom, the degeneracy of the different d-orbitals is lifted. The occupied d-orbitals are seen to be of dxz character, which is separated from the the unoccupied dyz orbital, pointing between O atoms. It should be noted that the local dxz orbitals of Ti nearest neighbors do not overlap to the same extent as in phase IV.
The gap between occupied and unoccupied d-states appear only if a nonzero on-site U is included in the calculation. The separation of d orbitals into upper and lower Hubbard bands is thus due to strong correlation between d-electrons. The filled O states are well below the low-binding energy d-states. Therefore, phase V may be classified as a true Mott insulatorZaanen et al. (1985).
The magnitude of the gap, will depend on the choice of the U-parameter. Nevertheless U eV seems to adequately reproduce the EOS, and simultaneously reproduce the insulating state of phase III (and I). The gap is intact at the volumes where these phases were observed. Thus, the qualitative result of a non-metallic state reappearing in the high pressure phases is not sensitive to the specific value of U.
The results strongly suggests that the structural transition is connected with the Mott transition. The transformation into a metallic state destabilizes phase III, leading to phases IV and V, which do have Mott gaps.
Early experimental studiesKinomura et al. (1982) of the magnetic properties of TiPO4 reported a local magnetic moment on Ti3+ of 0.8 at ambient pressure. This is only slightly lower than what is expected from an insulator with Ti d1 configuration. By means of ab-initio calculations, Lopez et al. López-Moreno and Errandonea (2012) reported the magnetic moment to vanish at 12 GPa in the CrVO4 structure (phase I). Our calculations indicate that close to the collapse of phase III, the local magnetic moment is effectively zero.
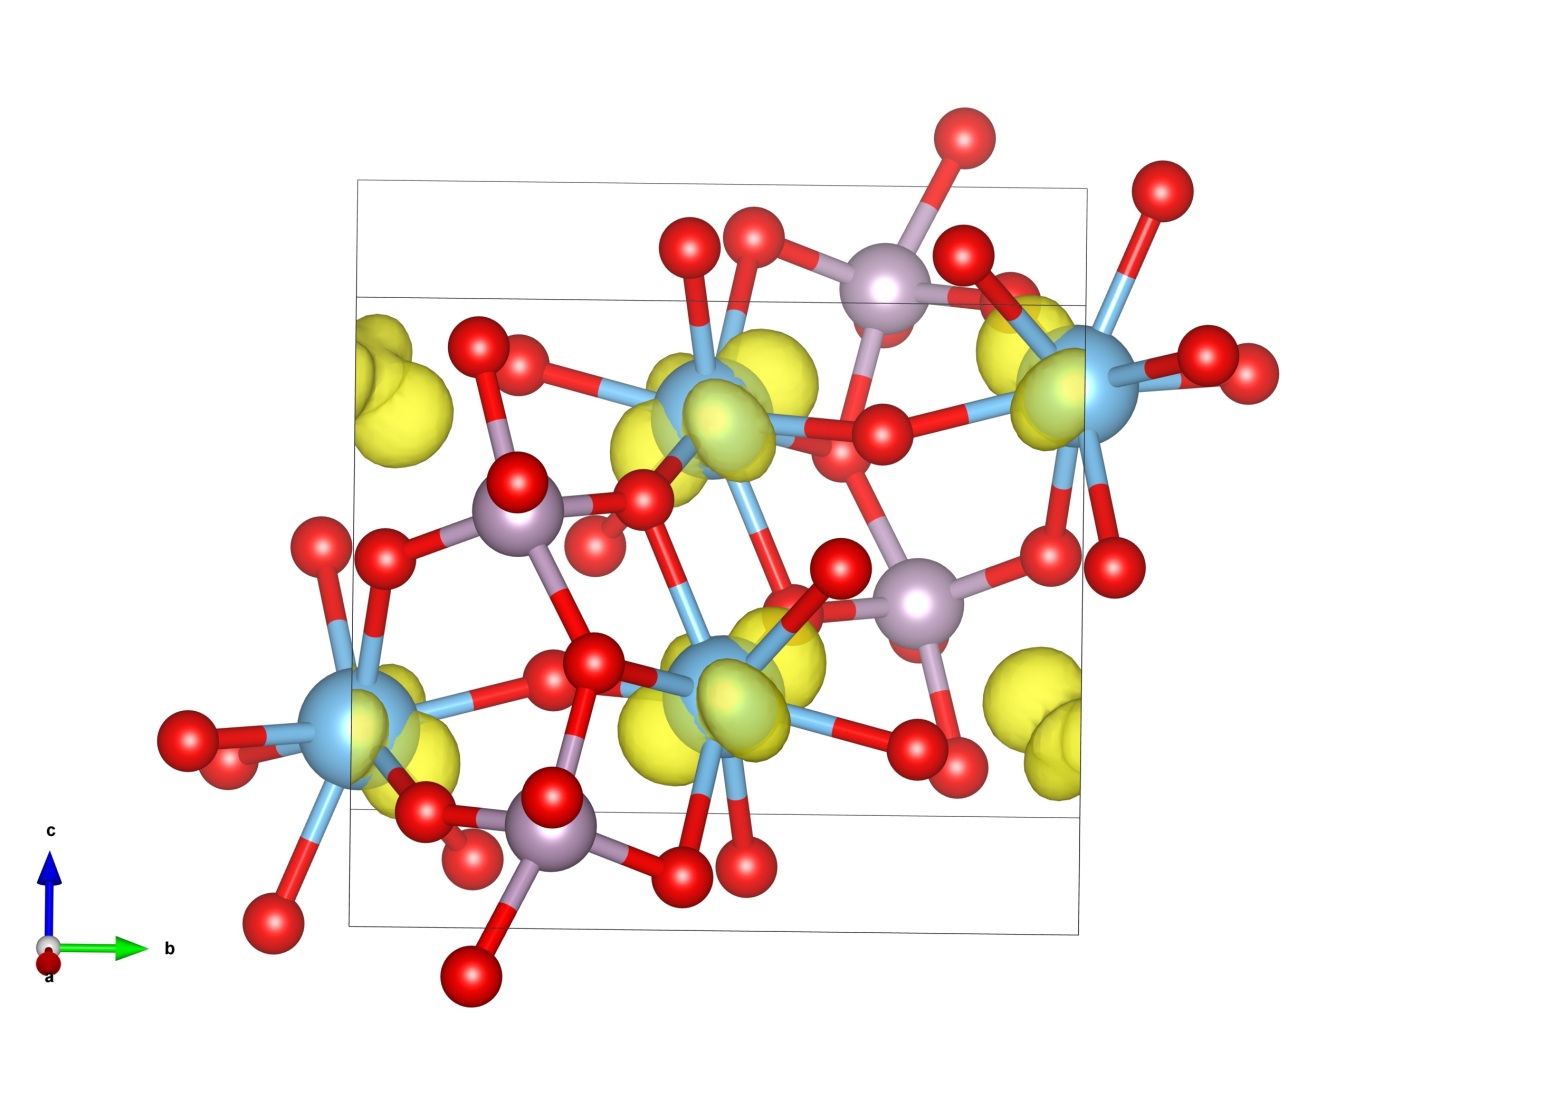
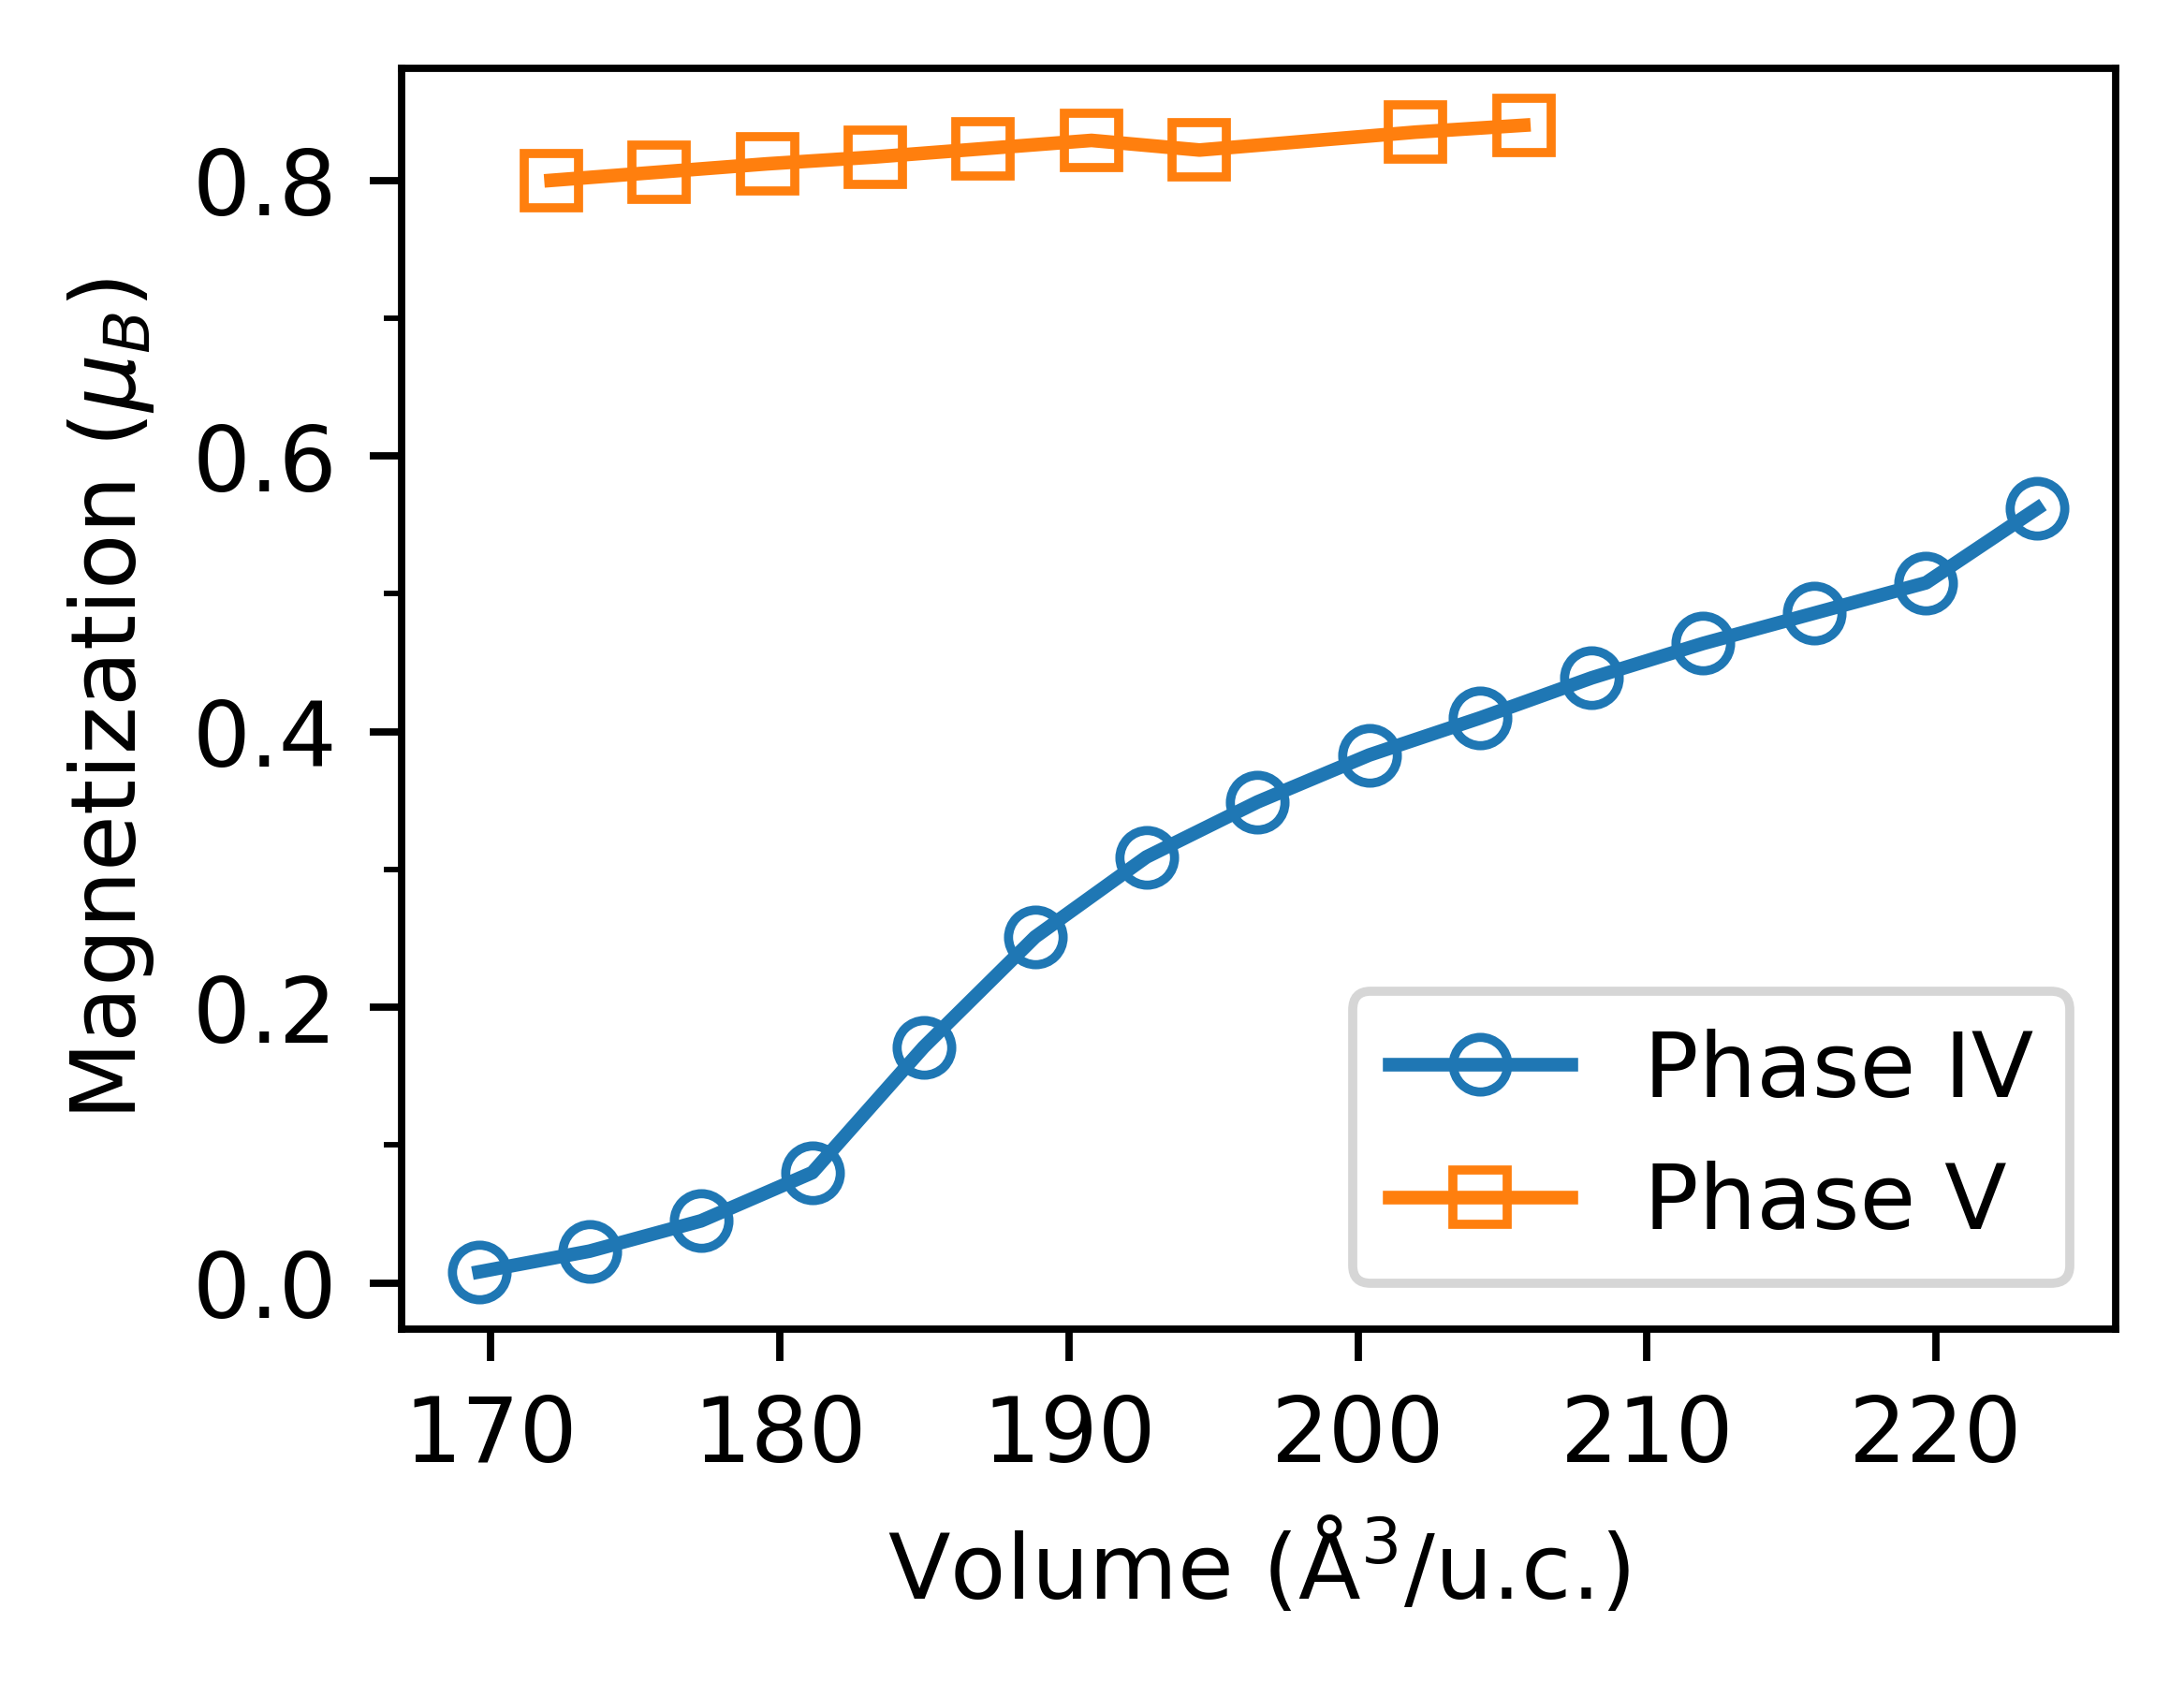
The calculated magnetic moments for phases IV and V are shown in Fig. 10 as a function of unit cell volume. At the volume where phase IV becomes stable the local magnetic moments are small, , and continuously decrease with pressure. At 65 GPa they have practically vanished, which is also indicated by the depolarized d-level DOS in Fig. 6. On the contrary, in phase V the magnetic moments are comparatively large, , and decrease very slowly with increasing pressure. Due to the crystallographic geometry, there is no overlap between neighboring dxz states (Fig. 9). The AFM order therefore seems to be due to indirect Ti-O-Ti exchange coupling. Phase V is thus clearly antiferromagnetic, and the Ti atoms feature a robust local magnetic moment, compatible with the d1 configuration.
V Conclusions
Calculations show that the recently discovered phase V of TiPO4, featuring PO5 polyhedra, is the energetically favorable structure at high pressure, as compared to phases III and IV. The less dense phase IV is most likely kinetically stabilized. These new phases appear when the pressure approaches values at which the known phase III should become metallic and lose its local magnetic moment. Phase IV shows a larger band gap, but otherwise behaves similarly to phase III. In contrast, phase V shows a band gap, and in phase V magnetism reappears. These results agree well with the color changes observed in experiments, though the small gap of phase IV obscures the transparent phase V in the experimental sample containing a mixture of the two phases.
Our finding is in many ways remarkable, as pressure-induced structural transitions in Mott insulators are usually connected with the disappearance of the band gap. In phase V of TiPO4, the gap along with magnetism reappear upon a structural transition. The density of phase V is also higher than that of phases III or IV and our calculations show that phase V is the stable phase at high pressures. Thus, it should be possible to detect the inverse pressure-induced Mott transition in TiPO4 experimentally. In summary, our study shows that TiPO4 displays intriguing phenomena not only at low temperature but also at high pressure.
Acknowledgements
This project is funded by the Knut and Alice Wallenberg Foundation for the project Strong Field Physics and New States of Matter (Grant No. KAW-2013.0020). We are grateful to the Swedish e-Science Research Centre for financial support. I.A.A. gratefully acknowledges the Swedish Research Council (VR) grant No. 2015-04391 and the Swedish Government Strategic Research Area in Materials Science on Functional Materials at Linköping University (Faculty Grant SFO-Mat-LiU No. 2009 00971). Theoretical analysis of computational results was supported by the Russian Science Foundation (Project No. 18-12-00492). The computations were performed on resources provided by the Swedish National Infrastructure for Computing (SNIC) at High Performance Computing Center North (HPC2N) and National Supercomputer Centre (NSC).
References
- Dubrovinsky et al. (2015) L. Dubrovinsky, N. Dubrovinskaia, E. Bykova, M. Bykov, V. Prakapenka, C. Prescher, K. Glazyrin, H. P. Liermann, M. Hanfland, M. Ekholm, Q. Feng, L. V. Pourovskii, M. I. Katsnelson, J. M. Wills, and I. Abrikosov, Nature 525, 226 (2015).
- Bykov et al. (2018) M. Bykov, E. Bykova, G. Aprilis, K. Glazyrin, E. Koemets, I. Chuvashova, I. Kupenko, C. McCammon, M. Mezouar, V. Prakapenka, H.-P. Liermann, F. Tasnadi, A. V. Ponomareva, I. Abrikosov, N. Dubrovinskaia, and L. Dubrovinsky, Nature Communications 9, 2756 (2018).
- Troyan et al. (2016) I. Troyan, A. Gavriliuk, R. Ruffer, A. Chumakov, A. Mironovich, I. Lyubutin, D. Perekalin, A. P. Drozdov, and M. I. Eremets, Science 351, 1303 (2016).
- (4) M. Bykov, E. Bykova, M. Hanfland, H.-P. Liermann, R. K. Kremer, R. Glaum, L. Dubrovinsky, and S. van Smaalen, Angewandte Chemie International Edition 55, 15053.
- Law et al. (2011) J. M. Law, C. Hoch, R. Glaum, I. Heinmaa, R. Stern, J. Kang, C. Lee, M.-H. Whangbo, and R. K. Kremer, Phys. Rev. B 83, 180414 (2011).
- Wulferding et al. (2013) D. Wulferding, A. Möller, K.-Y. Choi, Y. G. Pashkevich, R. Y. Babkin, K. V. Lamonova, P. Lemmens, J. M. Law, R. K. Kremer, and R. Glaum, Phys. Rev. B 88, 205136 (2013).
- Bykov et al. (2013) M. Bykov, J. Zhang, A. Schönleber, A. Wölfel, S. I. Ali, S. van Smaalen, R. Glaum, H.-J. Koo, M.-H. Whangbo, P. G. Reuvekamp, J. M. Law, C. Hoch, and R. K. Kremer, Phys. Rev. B 88, 184420 (2013).
- Hase et al. (1993) M. Hase, I. Terasaki, and K. Uchinokura, Phys. Rev. Lett. 70, 3651 (1993).
- Isobe and Ueda (1996) M. Isobe and Y. Ueda, J. Phys. Soc. Jpn. 65, 1178 (1996).
- Mao et al. (1986) H. K. Mao, J. Xu, and P. M. Bell, JGR: Solid Earth 91 (1986).
- Blöchl (1994) P. E. Blöchl, Phys. Rev. B 50, 17953 (1994).
- Kresse and Joubert (1999) G. Kresse and D. Joubert, Phys. Rev. B 59, 1758 (1999).
- Kresse and Furthmüller (1996a) G. Kresse and J. Furthmüller, Phys. Rev. B 54, 11169 (1996a).
- Kresse and Furthmüller (1996b) G. Kresse and J. Furthmüller, Computational Materials Science 6, 15 (1996b).
- Perdew and Zunger (1981) J. P. Perdew and A. Zunger, Phys. Rev. B 23, 5048 (1981).
- Dudarev et al. (1998) S. L. Dudarev, G. A. Botton, S. Y. Savrasov, C. J. Humphreys, and A. P. Sutton, Phys. Rev. B 57, 1505 (1998).
- Monkhorst and Pack (1976) H. J. Monkhorst and J. D. Pack, Phys. Rev. B 13, 5188 (1976).
- Birch (1947) F. Birch, Phys. Rev. 71, 809 (1947).
- López-Moreno and Errandonea (2012) S. López-Moreno and D. Errandonea, Phys. Rev. B 86, 104112 (2012).
- Zaanen et al. (1985) J. Zaanen, G. A. Sawatzky, and J. W. Allen, Phys. Rev. Lett. 55, 418 (1985).
- Kinomura et al. (1982) N. Kinomura, F. Muto, and M. Koizumi, Journal of Solid State Chemistry 45, 252 (1982).