Don’t Pick the Cherry:
An Evaluation Methodology for Android Malware Detection Methods
Abstract
In evaluating detection methods, the malware research community relies on scan results obtained from online platforms such as VirusTotal. Nevertheless, given the lack of standards on how to interpret the obtained data to label apps, researchers hinge on their intuitions and adopt different labeling schemes. The dynamicity of VirusTotal’s results along with adoption of different labeling schemes significantly affect the accuracies achieved by any given detection method even on the same dataset, which gives subjective views on the method’s performance and hinders the comparison of different malware detection techniques.
In this paper, we demonstrate the effect of varying (1) time, (2) labeling schemes, and (3) attack scenarios on the performance of an ensemble of Android repackaged malware detection methods, called dejavu, using over 30,000 real-world Android apps. Our results vividly show the impact of varying the aforementioned 3 dimensions on dejavu’s performance. With such results, we encourage the adoption of a standard methodology that takes into account those 3 dimensions in evaluating newly-devised methods to detect Android (repackaged) malware.
1 Introduction
The research community has been working towards devising methods to detect Android malware (e.g., [16, 19, 31, 26]). Despite proving to be sometimes inconsistent [12], researchers rely on VirusTotal [32] to either download training data to evaluate their newly-devised methods [33, 30, 38], or to label the apps they manually gathered from the wild (e.g., app marketplaces) [15, 36, 4], due to the lack of better alternatives.
To be objective, VirusTotal does not provide users with binary labels per app, such as malicious or benign. It instead provides its users with the scan results of around 60 antiviral software. Unfortunately, such results have been found to change over time (e.g., from benign to malicious and vice versa) [18]. Furthermore, there are no standards on how to utilize the obtained scan results to label apps. In this context, researchers use their intuition and adopt ad-hoc methods to label the apps in the datasets they train their methods with or, more importantly, release to the research community as benchmarks. For example, based on VirusTotal’s scan results, Li et al. labeled the apps in their Piggybacking dataset as malicious if at least one scanner deemed an app as malicious [15], Wei et al. labeled apps in the AMD dataset as malicious if 50% or more of the total scanners labeled an app as such [36], and the authors of the Drebin dataset [4] labeled an app as malicious if at least two out of ten scanners they manually selected courtesy of their reputation (e.g., AVG, BitDefender, Kaspersky, McAfee, etc.), deemed an app as malicious.
Researchers have also found that training and testing a malware detection method using different datasets (i.e., constructed for different experimental attack scenarios), yields different detection results [22]. In fact, varying the freshness of scan results and the labeling scheme alters the distribution of malicious and benign apps in the same dataset, effectively yielding different datasets and, in turn, different detection results. Therefore, our hypothesis is that depending on the 3-dimensions of (1) time, (2) labeling scheme, and (3) attack scenario implied by the utilized test dataset, the same malware detection method might perform differently. This, we argue, might hinder the comparability of different detection approaches. Furthermore, it might incite researchers to dismiss promising detection approaches, because they underperform on a dataset with outdated labels, or because they utilize a different labeling scheme than the one adopted by the dataset’s authors.
To objectively evaluate the performance of newly-devised detection methods, in this paper, we motivate the adoption of a framework that considers the dimensions of time, labeling scheme, and dataset to evaluate Android (repackaged) malware detection methods. To further motivate the need for such framework, we demonstrate the impact of varying the aforementioned three dimensions on the performance of the same detection method. In our demonstration, we focus on Android repackaged malware as a use case primarily due to the threat it poses to the Android ecosystem, namely, undermining user trust in legitimate apps, their developers, and the app distribution process. Using three malware datasets, viz. Malgenome [41], Piggybacking [15], and AMD [36] along with 1882 apps downloaded from the Google Play marketplace, we train and test a framework, dejavu111Déjà vu (\tipaencoding/’deZA ’vy/) is the feeling that one has experienced an event before. In essence, our framework attempts to match an app under test against a repository of previously-analyzed (i.e., seen before), apps to decide whether an app is repackaged (and potentially malicious)., which utilizes an ensemble of detection methods that have each individually been successfully utilized by researchers to effectively detect Android repackaged[40, 41] or piggybacked [15, 16] malware. Such methods include compiler fingerprinting, probabilistic classification using a naive Bayes classifier, and matching apps according to their metadata, components, classes, and methods.
Our results show that the scan results obtained from VirusTotal are continuously changing with time and, hence, should not be taken for granted unless they are up-to-date. Secondly, we found that such VirusTotal results–regardless of their freshness–can significantly alter the composition of a dataset (i.e., which apps are malicious, and which are benign), depending on the scheme adopted to label apps in a dataset. This phenomenon affected the detection accuracy of our ensemble method, dejavu, by 37.5% (i.e., 0.72 versus 0.99), which gives different views of the method’s effectiveness.
The contributions of this paper are:
-
•
A malware detection evaluation methodology, which mandates varying the freshness of scan results (e.g., from VirusTotal), the scheme adopted to label apps, and the attack scenario (section 4), and a demonstration of the effect of varying the aforementioned dimensions on the detection accuracies of an ensemble of malware detection methods called dejavu (described in section 3).
-
•
An analysis of the samples that are labeled differently when using different labeling schemes, which concludes that the majority of such apps are Adware and the majority of the URL’s they contact are benign (section 5).
-
•
We make the results of our experiments and dejavu’s source code available online 222https://goo.gl/p7hkH9.
In section 2, we motivate the need for our research using examples that we encountered during the implementation dejavu, and briefly discuss the attack scenarios usually encountered by Android repackaged malware detection methods. Section 6 discusses threats to validity. Related work is presented in section 7 and the paper is concluded in section 8.
2 Background
In this section, we motivate the need for our paper and its line of research with examples. The first example in section 2.1 demonstrates the importance of considering the dimensions of time and labeling scheme. In section 2.2, we give examples of attack scenarios under which a detection method can encounter Android repackaged malware.
2.1 Motivating Example
During our evaluation of dejavu’s components, particularly the quick matching module, against the Piggybacking dataset we came across multiple dubious scenarios. In summary, the quick matching module utilizes compiler fingerprinting to classify apps as malicious or benign if their codebases do not match. One of the scenarios we encountered was during testing an app called TP.LoanCalculator. Despite being labeled by the authors of the Piggybacking dataset as malicious, the quick matching module deemed the test app3332b44135f245a2bd104c4b50dc9df889dbd8bc79b as benign. After inspection, we found that the module classified the aforementioned test app as benign because it matched one444d8472cf8dcc98bc124bd5144bb2689785e245d83 of the apps dejavu keeps as a reference dataset (section 3) in terms of metadata, used compiler, and even codebase.
Given that Piggybacking comprises benign apps and their repackaged malicious versions, it is expected to find apps that match in terms of metadata, graphical user interface, and file names. However, two apps possessing the exact same codebase implies that they are basically the same app, perhaps with slight modifications to their resource files (e.g., strings and colors). So, how can two apps in the same dataset and with identical codebases be simultaneously deemed as malicious and benign? One possible answer to this question is that the malicious app altered the resource files of the original one (e.g., to change a URL), which we found not to be the case. The more plausible answer is that either, or both, apps were given incorrect labels.
In [15], the authors of the Piggybacking dataset labeled the apps they gathered with the aid of VirusTotal scan results. So, we retrieved the VirusTotal results of both apps by querying the platform’s web interface. The test app was labeled malicious by 14 out of 60 antiviral software scanners. We noticed, however, that the results acquired from VirusTotal indicated that the app was last analyzed in 2013. So, we uploaded the app’s APK archive for re-analysis in late 2018 to see whether the number of scanners would differ. The 2018 version of the scan results indicated that three more scanners deemed the app malicious.
The scan results obtained for the reference app were more interesting. Similar to its malicious version, this presumably benign app was last analyzed in 2013. In this case, the scan results from VirusTotal indicated that all scanners deemed the app as benign, displaying green "Clean" labels next to the names of all scanners. Nevertheless, after clicking on the Reanalyze button, 17 of the green labels turned red displaying different malware family names that indicate the malignancy of the app. That is to say, the reference app originally labeled and released as part of the Piggybacking dataset as a benign app is, in fact, another version of a malicious app of the type Adware.
Needless to say, the authors of Piggybacking did not intentionally mislabel apps. The most likely scenario is that, at the time of releasing the dataset, the reference app was still deemed as benign by the VirusTotal scanners. Our example shows the evolution of scan results returned by VirusTotal and the impact of time on them. This phenomenon implies that prior to using any datasets–including manually-labeled ones, all apps need to be re-analyzed and re-labeled.
Having mentioned labeling our example shows that 17 out of 60 scanners (i.e., 28.33% of scanners), deemed both apps as malicious. Interestingly, some renowned scanners including AVG, McAfee, Kaspersky, Microsoft, and TrendMicro continue to deem both apps as benign. However, according to the authors’ criterion to label an app as malicious if at least one scanner deems it so [15], both apps would be labeled as malicious. The same would not hold for the authors of the AMD dataset who consider an app as malicious if at least 50% of the VirusTotal scanners deem it malicious [36]. Those two dimensions (i.e., time and labeling scheme/criteria), are expected to affect the performance of any detection framework using the same dataset, especially if the malicious apps are repackaged or belong to ambiguous malware types such as Adware or Riskware. This paper attempts to demonstrate the effect of varying those two dimensions on the performance of an ensemble method, dejavu, built to detect Android repackaged malware.
2.2 Attack Scenarios
Consider a malware author (hereafter attacker) who wishes to write a malicious app that (1) resembles a renowned, benign app to trick users into downloading what they believe is a new version of a popular app, and (2) manages to evade detection by any app vetting mechanisms employed by the marketplace(s) the attacker targets. To achieve the first objective, the attacker can repackage a benign app with malicious content which is, in fact, a straightforward task [21, 15].
As for the second objective, researchers have identified two different scenarios that can be adopted by attackers to evade detection by vetting mechanisms employed by app marketplaces [22, 33]. In both scenarios, we assume that the attacker does not have access to information about (a) the methods (or lack thereof) used by the target marketplace to vet apps, and (b) the dataset of apps used to train the marketplace’s vetting mechanism. By training, we do not assert the use of machine learning classifiers; instead, we refer to apps used by a vetting mechanism as references of what is malicious and what is benign. The only information we assume the attacker has access to is the list of apps hosted on a marketplace, which can be easily obtained (e.g., by crawling a marketplace) [33]. Given such limited information, the attacker might assume that marketplaces use the apps they host as references of benign apps, especially since such apps have undergone a vetting process upon being uploaded. Based on this assumption, we identify two scenarios: conventional and confusion, which we describe in the following paragraphs.
Conventional Scenario
On the one hand, the attacker may opt to upload the repackaged app () to a marketplace () that does not host its original, benign version (). This means that the vetting mechanism employed by () will be faced with an out-of-sample app (i.e., one it has never seen before), and hence cannot easily match to either benign or malicious apps. Since it has been found that the majority of repackaged apps dwell on marketplaces on which their original versions are not hosted [33], we refer to this common scenario as conventional.
Confusion Scenario
On the other hand, the attacker may adopt the opposite approach by opting to upload their repackaged app () to a marketplace () on which the original app () is hosted. The rationale behind this choice is that vetting mechanisms can be perplexed by () which resembles a benign app it has seen before. This scenario is indeed the less common [33], yet has been found to be more effective against some techniques, such as machine learning classifiers [22].
For example, an attacker targeting Google Play might decide upon downloading a popular gaming app (e.g., com.rovio.angrybirds), grafting it with a payload that displays advertisements to the users, slightly altering its appearance (e.g., via modifying colors or strings), and re-uploading it to Google Play under a slightly different name (e.g., com.rovio.crazybirds). If Google Play indeed uses com.rovio.angrybirds in training its app vetting mechanism, it is likely that such mechanism deems com.rovio.crazybirds as benign, especially since the repackaged app’s components, structure, and even behavior are expected to match those of its original version.
3 dejavu
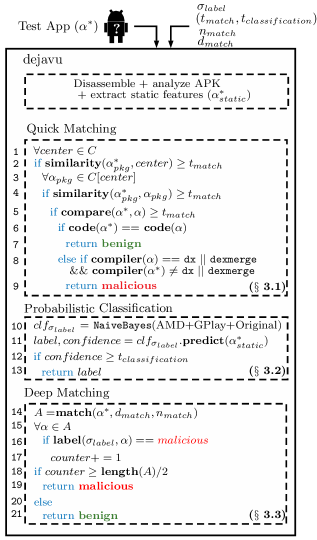
We implemented dejavu to utilize three different methods that have been successfully used to detect Android repackaged malware. Each detection method is implemented as a separate module, viz. quick matching, probabilistic classification, and deep matching. As seen in figure 1, the primary input to dejavu is an Android test app () which is sequentially tested by dejavu’s methods to decide upon its class (i.e., malicious or benign).
To emulate the attack scenarios we discussed in section 2.2, we implemented dejavu to resemble a marketplace’s vetting mechanism making use of a repository of Android apps that depict a reference dataset against which test apps are compared. To hasten dejavu’s decision about an app’s class, apps in the reference dataset have been previously decompiled and analyzed. The data extracted from each app is saved to a directory which contains a dictionary of information about the app’s components (e.g., lists of activities, files, libraries, services, etc.), the app’s icon, and a vector of static features extracted from its APK archive (listed in appendix A).
The labeling scheme to be adopted during classification is dictated by the parameter () and can have the following values:
-
•
vt1-vt1 labels an app malicious if one or more VirusTotal scanners deem it as malicious; otherwise, it is labeled as benign.
-
•
vt50p-vt50p labels an app malicious if 50% or more of the VirusTotal scanners report it as malicious; otherwise, the app is labeled as benign.
-
•
vt50p-vt1 labels an app malicious if 50% or more of the scanners deem it malicious and labels an app as benign if none of such scanners deem it malicious.
Not only does the value of () affect the ground truth label of (), it instructs dejavu to use different sets of apps in the reference dataset, viz. the ones that pass the criteria of the labeling scheme, to match apps and train classifiers. In other words, the value of () can alter the composition of, both, the reference dataset and test apps.
3.1 Quick Matching
The quick matching detection method uses three techniques to classify the test app () as quickly and as reliably as possible, prior to delving into more time-consuming detection methods. Firstly, it checks whether the test app () matches any benign app(s) in dejavu’s reference dataset. If a match is found, the method uses the techniques of codebase comparison and compiler fingerprinting to decide upon ()’s class.
Repackaging Detection
To trick users into voluntarily downloading their repackaged malicious apps, malware authors might opt to retain some basic information (or metadata) of the original benign app, such as app package name (e.g., com.my.app), app description, icon, and so forth. This behavior can be used to match test apps to benign ones in our reference dataset, which facilitates making decisions about their nature.
To rapidly figure out whether () can be matched using quick matching, we attempt to match its package name to those of benign apps (i.e., according to ), in dejavu’s reference dataset. The package names of such benign apps are clustered–using the Levenshtein distance as a distance metric [27]–and saved as a dictionary (); the values in the dictionary are lists of app package names, whereas the keys are the centers of each cluster. For example, the cluster of apps jp.colopl.allenCN, jp.colopl.enkare, jp.colopl.krarmy, has the center jp.colopl.entrain.
Firstly, the package name of (), denoted (), is compared against the centers () of different clusters () (lines 1 and 2 in figure 1). The comparison is based on the Jaccard index [6], which returns a number between and . If the similarity between () and () is greater than or equal to a matching threshold () (i.e., line 2), the cluster is investigated further. That is to say, every package name in the cluster () is compared against the test app’s () (line 3). In line 4, if the package name of () matches that of an app () in the reference dataset with similarity greater than or equal to (), the metadata (i.e., package names, descriptions, and icons), of both apps are compared (line 5). If such metadata is similar with threshold greater than the () threshold, we assume that () is some version of (). To decide whether () is malicious or benign, quick matching uses the techniques of codebase comparison and compiler fingerprinting.
Codebase Comparison
Regardless of being malicious or benign, if () shares the exact codebase with (), then we assume that both apps are effectively the same in terms of functionality. It follows that, if () is labeled as benign according to (), then () should be deemed as benign as well. The question is: what if () is, in fact, a repackaged version of () grafted with a malicious payload. If that is true, then the attacker needs to alter ()’s codebase to add their malicious code or the code that dynamically loads it, which contradicts the assumption above. In this context, we implemented quick matching to compare the codebases of () and () (i.e., line 6), and deem the former app as benign if the codebases are identical.
In checking the codebase, dejavu’s quick matching detection method compares the classes.dex files of both apps, and ignores the resource files. However, we believe that this does not affect the check’s effectiveness. The only scenario we could think of that could render the codebase comparison technique ineffective is if the original app () stores Java or Dex bytecode as a string that is stored in the resource files (e.g., strings.xml), and dynamically loads it during runtime. In this case, the attacker can modify this code to include their malicious code and repackage the app. Despite its technical possibility, we argue that such scenario is highly unlikely to manifest, especially since Android developers have more advanced, reliable, and secure methods to dynamically alter the functionalities and appearances of their apps (e.g., via App Bundles [1]).
Compiler Fingerprinting
There are some scenarios in which the codebases of () and () could differ, yet both apps could be benign. For example, () may be an updated version of (), which indeed should have a different codebase. However, the test app () may be a repackaged version of () withholding malicious code that uses the original codebase as a facade. To differentiate between such scenarios, quick matching uses the technique of compiler fingerprinting proposed by Stazzere[29], which detects Android repackaged malware based on the following assumption: legitimate developers usually have access to their apps’ source code and, hence, their apps should be compiled using the dx or dexmerge compilers that ship with the Android SDK. Consequently, apps that are compiled using third-party compilers used by reverse engineering tool (e.g., dexlib), should raise major suspicions.
Based on this idea, quick matching fingerprints ()’s and ()’s compilers using APKiD [9] and compares them (i.e., line 8). Given that it has been already established that the codebases of () and () are different, the scenario in which ()’s compiler is dx or dexmerge, whereas ()’s compiler is a third-party compiler (e.g., dexlib), implies that the developer of () most likely did not have access to the original app’s source code and had to repackage it. If this condition holds, quick matching deems () malicious, as seen in line 9.
One might argue that some developers may elect to decompile and repackage their apps to include slight modifications (e.g., fix a typographical error), without having to recompile the source code, which should undermine the correctness of the check in line 8. We argue that such slight modifications should not affect the app codebase. So, even if () embodies a repackaged version of (), having the same codebase should help deem it benign according to the check in line 6.
One exception to this general case is if legitimate developers elect to alter their codebases (e.g., to change a constant String), on the smali level and repackage their apps. However, legitimate developers that possess their apps’ code have no good reasons to work on the smali level to alter their codebases. Given the rarity of this scenario and the severity of false negatives, in this case, we opt to deem test apps that pass the check in line 8 as malicious.
Other Scenarios
The checks used between lines 1 and 9 do not cover all possible scenarios. Firstly, there are the scenarios in which quick matching was not able to match () to any apps in dejavu’s reference dataset. Secondly, there are scenarios in which the codebases of () and () are not the same, yet they share the same compilers. For example, if both () and () are compiled using the dx compiler, that could either mean that (a) () is a benign update to the benign app (), or (b) () is a malicious update to a benign app () whose source code is available online (e.g., K-9 Mail [2]). In those cases, quick matching cannot make confident decisions about ()’s class and defers the making of this decision to probabilistic classification.
3.2 Probabilistic Classification
The inability of quick matching to classify () with absolute confidence according to domain-knowledge-based assumptions implies uncertainty. To deal with such uncertainty, we widen the scope within which we attempt to match the test app (). So, instead of matching the test app () to a specific app in terms of metadata, we attempt to match it to a class of apps (i.e., malicious or benign), using information about the files in its APK archive, its components, the permissions it requests, and the API calls it utilizes. Furthermore, instead of yielding absolute confidence about the test app ()’s class, we relax this requirement and return a probabilistic measure. Such probabilistic measure, we argue, suits types and families of malware that are ambiguous (e.g., Adware), which are considered to be potentially unwanted rather than purely malicious. Lastly, we still aspire to maintain the efficiency of the classification process by classifying a test app as quickly as possible.
To achieve such objectives, the probabilistic classification detection method relies on a probabilistic machine learning classifier to infer the class of () for the following reasons. In general, machine learning proved to be a reliable method in the field of (Android) malware detection and has, hence, been utilized by various researchers within this domain [17, 30, 4]. Furthermore, once features are extracted from Android apps, machine learning classifiers are usually faster to train and validate than more complex methods (e.g., dependency graph isomorphism [7]). However, the abundance of research in this field and the utilization of different datasets and features make it difficult to compare their performances to decide upon a few approaches to consider [20]. Consequently, we chose a classifier that yields classification confidence in the form of a probability along with the class label.
The classifier we use is a multinomial Naive Bayes classifier trained using static features extracted from the apps in dejavu’s reference dataset. Those static features, enumerated in appendix A, depict information about the apps’ components [24, 23], the permissions they request [4][37], the API calls found in their codebases [39], and the compilers used to compile them.
According to the value of (), the classifier will be trained using the apps in the reference dataset which satisfy the labeling scheme’s criteria (i.e., line 10); hence, the name (). For example, if the labeling scheme is vt50p-vt1, the classifier will be trained using malicious apps deemed by more than 50% of VirusTotal scanners and using benign apps deemed malicious by no VirusTotal scanners.
To classify (), the aforementioned static features are extracted from the app to yield a vector of numerical features (). In line 11, the classifier () uses () to classify the test app and returns a () corresponding to the class (i.e., malicious or benign), it is more confident () belongs to along with a () in such decision in the format of a probability. If the returned () is greater than or equal to a threshold passed to dejavu, called (), the probabilistic classification method returns the () (lines 12-13). Otherwise, the task of classifying () is further deferred to the deep matching detection method.
3.3 Deep Matching
The last detection method used by dejavu is deep matching. Unlike quick matching, the deep matching method attempts to match the test app () to a number of similar malicious or benign apps in the reference dataset. The method defines the similarity between apps in terms of the overlap between different app information. For example, given two lists of strings, say () and (), depicting the files included in the APK archives of two apps, deep matching defines similarity in terms of the Jaccard index between the lists (i.e., ).
In line 14, deep matching takes the test app () as an input along with an analysis depth () and an upper bound on the apps to match to (). The upper bound parameter, (), limits the number of apps against which () is allowed to be matched. This parameter is meant to speed up the matching process by instructing the match method to conclude its matching process once it finds () apps that are similar to () with a threshold of at least (i.e., two-thirds), and returns the matched apps as a set ().
The exact information used by the deep matching’s match method (to compare and match apps), depends on the value of the () parameter, which depicts the depth of the extracted information. If , deep matching compares the apps’ metadata in a manner similar to how quick matching compares () and () in line 5, viz. the apps’ package names, descriptions, and the structural similarity of their icons according to the SSIM measure [35]. If , the method retrieves lists of all components declared by the two apps being compared and calculates the Jaccard index between them. To avoid prolonging the matching process, deep matching does not compare the content of components; instead their names. Lastly, if the value of , the list of resource files, libraries, classes, and methods are compared using the Jaccard distance as well.
The match method is implemented in a cumulative manner that includes similarity scores from depth levels lower than the level passed to the method in the final similarity score. For example, if (), the method would include the similarity score achieved at depths one, two, and three in the final similarity score it returns. The overall similarity score between two apps is an unweighted average of all the scores returned by each depth level. For instance, if matching depths one, two, and three returned scores of , , and the final score returned will be . So, the higher the value of (), the more the information retrieved and compared.
For each app () matched by match, the label of this app is retrieved in accordance with the labeling scheme () passed to dejavu. The method keeps track of the number of apps labeled as malicious (lines 16-17). The final verdict returned by deep matching vis-à-vis ()’s class is determined as a simple majority vote of the labels/classes of the matched apps (i.e., ). For instance, if () is matched to a set of ten apps () six of which are malicious, the app () will be labeled as malicious (line 19). The test app () will be labeled as benign (line 21) if 50% or less of the apps in () are malicious, according to ().
4 Evaluation
In this section, we use the detection methods of dejavu to investigate the effect of varying the dimensions of time, labeling schemes adopted by researchers to label apps in their datasets, and attack scenarios on the detection accuracies of such methods. To tackle such concerns, we postulate the following research questions and devise experiments that address them:
-
RQ1
How do labeling schemes affect the choice of dejavu’s input parameter values?
-
RQ2
How does the variation of label values in time, affect the accuracies of detection methods?
-
RQ3
How does varying the labeling scheme affects the accuracies of detection methods?
-
RQ4
How do detection methods perform across different scenarios (i.e., conventional versus confusion)?
-
RQ5
What effect does combining detection methods have on detection performance?
-
RQ6
What do the apps that do not fit either criteria in the vt50p-vt1 labeling scheme comprise?
4.1 Datasets
| Labeling Scheme () | ||||||
|---|---|---|---|---|---|---|
| Dataset | original | vt1-vt1 | vt50p-vt50p | vt50p-vt1 | More Malicious Scan Results | Less Malicious Scan Results |
| Piggybacked (2014-2017) | 1399 (malicious) | 1263 (90%) | 159 (11.36%) | 159 (11.36%) | 845 (60.4%) | 234 (16.72%) |
| Original (2014-2017) | 1355 (benign) | 852 (63%) | 1348 (99.5%) | 852 (63%) | 219 (16.16%) | 212 (15.64%) |
| Malgenome (2010-2012) | 1234 (malicious) | 1234 (100%) | 1234 (100%) | 1234 (100%) | 366 (29.65%) | 609 (49.35%) |
| Gplay (2017) | 1882 (benign) | 1572 (83%) | 1837 (99.46%) | 1572 (83%) | 107 (5.7%) | 79 (4.2%) |
| AMD (2010-2016) | 24553 (malicious) | 24552 (99.9%) | 12765 (52%) | 12765 (52%) | 12481 (50.83%) | 6454 (26.3%) |
In this section, we briefly discuss the composition of the datasets we used to train and test dejavu. The largest, and most recent, dataset we use is AMD [36], which comprises 24,553 malicious apps of different malware families and types. The dataset provides us with a comprehensive view of malicious behaviors that can be found in Android malware. Consequently, dejavu uses the apps from the AMD dataset as references to malicious behaviors and includes them in its reference dataset.
To complement the malicious apps in dejavu’s reference dataset with the benign ones, we downloaded around 1900 apps from the Google Play store and added them to the reference dataset. We do not assert that such apps are benign, given the unfortunate fact that some malicious apps make it past Google Play’s app vetting mechanisms and dwell on the marketplace [33]. Instead, all apps in the reference dataset are dynamically labeled according to the specified labeling scheme (), and based on recently downloaded VirusTotal scan reports, prior to being used to train any detection methods.
We use two datasets to test dejavu’s detection methods emulating the conventional and confusion scenarios discussed in section 2.2. The first test dataset we utilize is Malgenome [41]. It originally comprised 1260 malicious apps, almost 86% of which were found to be repackaged malware instances. Despite being released in 2012, malicious apps that were originally released as part of Malgenome continue to exist in Android app marketplaces and, consequently, in more recent Android malware datasets [22, 36]. Using this dataset, we wish to assess dejavu’s ability to successfully recognize malicious apps that do not match to any benign ones used by the framework (i.e., conventional scenario).
The second test dataset we use is Piggybacking [15]. The dataset comprises 1400 pairs of original apps along with their repackaged versions gathered between 2014 and 2017. Given the hashes of the apps belonging to this dataset, we downloaded as many apps as possible from the Androzoo repository [3]. We managed to acquire 1355 original, benign apps and 1399 of their repackaged, malicious versions. The reason behind such an imbalance is that some original apps have more than one repackaged version. In our experiments, we refer to the benign segment of the dataset as Original, and the dataset’s malicious segment as Piggybacked (not to be confused with Piggybacking, which also includes the Original segment). We use this dataset to simulate the confusion scenario in which an attacker targets a marketplace with a repackaged malware whose benign version is hosted by the marketplace. So, we include the Original segment in dejavu’s reference dataset and test the framework’s detection methods using both, the Original and Piggybacked segments. The former segment of the dataset is used to ensure that the techniques adopted by dejavu’s detection methods do not prevent it from correctly classifying benign apps it has seen before. The latter segment depicts the manifestation of the confusion scenario.
4.2 Dataset Composition Analysis
As discussed in section 1, adopting different labeling schemes alters the composition of the same dataset. In table 1, we show the impact of, both, time and labeling schemes on each of the datasets enumerated in section 4.1. For each Dataset, the table shows the number of malicious/benign apps the dataset contained at the time of release (i.e., using the original labeling scheme). The emboldened values in the Labeling Scheme () column, depicts the same labeling scheme adopted by the dataset authors to label apps. For example, malicious apps in the Piggybacked dataset were labeled as such if at least one VirusTotal scanners deemed them malicious. However, the numbers under vt1-vt1, vt50p-vt50p, and vt50p-vt1 are according to the latest VirusTotal scan results that we acquired between December 2018 and January 2019 after re-analyzing all apps.
Comparing the numbers in the original column and the emboldened ones gives us an indication of how time affects the composition of each dataset. As seen in the table, apart from the Malgenome dataset, time has a substantial effect on the number of apps that continue to be labeled as malicious or benign according to the labeling scheme adopted by the dataset’s authors at the time of release. For example, in [15], the Piggybacked segment of the Piggybacking dataset comprised 1399 apps that had at least one VirusTotal scanner deeming them as malicious. Using the same criterion, as of early 2019, about 10% of such apps seize to be labeled as malicious and switch to becoming benign. The effect of time on the Original segment of the aforementioned dataset is more significant; about 38% of the apps originally labeled as benign (i.e., with no VirusTotal scanners deeming them malicious), were updated to be malicious. Similarly, 17% of the apps we downloaded from the Google Play marketplace, which are presumed to have undergone rigorous vetting prior to being available for download, were deemed malicious by at least on VirusTotal scanner. The same effect of time can be noticed on the AMD dataset where almost 50% of its apps failed to pass the labeling criterion its authors used to deem an app malicious (i.e., at least 50% of VirusTotal scanners deem an app as malicious).
As part of studying the effect of time on the labels of apps in Android (malware) datasets, we studied the difference in the number of VirusTotal scanners that deemed apps as malicious/benign between two scans, where we triggered the latest scan of apps in the aforementioned datasets between November 2018 and January 2019. Each scan report downloaded from VirusTotal includes a field, positives_delta, that depicts that difference as a signed integer. A positive difference indicates an increased number of scanners deeming an app malicious, whereas a negative difference indicates a decreased number of such scanners. In table 1, we summarize those differences for all datasets. The fields (More Malicious Scan Results) and (Less Malicious Scan Results) show the number of apps in each dataset that had the number of VirusTotal scanners deeming them as malicious, respectively, increase and decrease. The time interval between two scans might differ from one app to another. So, the numbers under both columns do not depict the change in VirusTotal scan results over a fixed period of time. However, such results show that the scan results of VirusTotal are dynamic and continuously changing, which directly affects the composition of each dataset. That is to say, each time an app is (re)analyzed, depending on the labeling scheme, it might have a different number of VirusTotal scanners deeming it as malicious and, thus, may switch class from being malicious to benign or vice versa. Such volatility can render decent results achieved by a given detection method less indicative of the method’s quality, especially since it has been achieved on an obsolete, perhaps incorrect, labeling.
| Detection Methods | Quick Matching | Probabilistic Classification | Deep Matching | dejavu Ensemble | |||||||||||||
|---|---|---|---|---|---|---|---|---|---|---|---|---|---|---|---|---|---|
| Labeling Scheme () | org | vt11 | vt50 | vt501 | org | vt11 | vt50 | vt501 | org | vt11 | vt50 | vt501 | org | vt11 | vt50 | vt501 | Total Apps |
| 0.89 | 0.98 | 0.99 | 0.99 | 0.70 | 0.78 | 0.51 | 0.58 | 0.98 | 0.96 | 1.0 | 1.0 | 0.83 | 0.92 | 0.98 | 0.99 | ||
| Piggybacked (confusion/malicious) | 71% | 49% | 99% | 87% | 97% | 80% | 55% | 83% | 4% | 4% | 5% | 0.7% | 97% | 91% | 96% | 97% | 1399 |
| 0.99 | 0.95 | 0.85 | 0.87 | 0.37 | 0.45 | 0.56 | 0.27 | 0.64 | 0.91 | 1.0 | 0.91 | 0.97 | 0.90 | 0.69 | 0.93 | ||
| Original (reference/benign) | 95% | 67% | 21% | 19% | 46% | 65% | 47% | 72% | 6% | 7% | 7% | 5% | 98% | 89% | 60% | 98% | 1355 |
| 1.0 | 1.0 | 1.0 | 1.0 | 0.74 | 0.93 | 0.99 | 0.99 | 1.0 | 1.0 | 1.0 | 1.0 | 0.74 | 0.93 | 0.99 | 0.99 | ||
| Malgenome (conventional/malicious) | 2% | 2% | 2% | 2% | 99% | 67% | 78% | 93% | 2% | 1% | 1% | 1% | 99% | 68% | 79% | 93% | 1234 |
| Detection Methods | Quick Matching | Probabilistic Classification | Deep Matching | dejavu Ensemble | |||||||||||||
| Labeling Scheme () | org | vt11 | vt50 | vt501 | org | vt11 | vt50 | vt501 | org | vt11 | vt50 | vt501 | org | vt11 | vt50 | vt501 | Total Apps |
| 0.68 | 1.0 | 1.0 | 1.0 | 0.78 | 0.74 | 0.75 | 0.74 | 0.0 | 0.0 | 0.0 | 0.0 | 0.72 | 0.99 | 0.97 | 0.99 | ||
| Piggybacked (confusion/malicious) | 112 (8%) | 112 (38%) | 108 (8%) | 108 (36%) | 0% | 267 (19%) | 267 (90%) | 1399 | |||||||||
| 0.99 | 0.93 | 0.93 | 0.93 | 0.53 | 0.53 | 0.61 | 0.52 | 0.0 | 0.0 | 1.0 | 1.0 | 0.99 | 0.94 | 0.75 | 0.94 | ||
| Original (reference/benign) | 149 (11%) | 149 (17%) | 188 (14%) | 188 (22%) | 1 (0.07%) | 1 (0.1%) | 468 (34%) | 468 (54%) | 1355 | ||||||||
| 1.0 | 1.0 | 1.0 | 1.0 | 0.91 | 0.91 | 0.99 | 0.99 | 0.0 | 0.0 | 0.0 | 0.0 | 0.90 | 0.93 | 0.99 | 0.99 | ||
| Malgenome (conventional/malicious) | 13 (1%) | 513 (41%) | 0% | 685 (55%) | 1234 | ||||||||||||
4.3 Malware Detection Experiments
As discussed in section 3, each dejavu detection method expects different parameters, which can take different values. To answer RQ2 and RQ3 objectively, we should keep the value of each detection method’s parameter constant across different datasets and labeling schemes. However, we do not know beforehand the impact of varying the values of each parameter on the detection accuracies of each detection method, which is the concern of RQ1.
4.3.1 Varying Parameters vs. Detection Accuracies
We ran each of the 3 detection methods against 3 test datasets, using 4 different labeling schemes, and varying 3 to 4 values of the main parameters of each detection method (i.e., for quick matching, for probabilistic classification, and for deep matching). That yields a total of experiments.
The results of such experiments suggest that the detection methods quick matching, probabilistic classification, and deep matching yield the best detection accuracies–regardless of the utilized dataset and labeling scheme–when the values of their respective parameters are (), (), and (). In summary, we noticed that the higher the value of a parameter, the more precise the detection method is. For example, increasing quick matching’s () value helps the method increase its detection accuracy against the Original dataset regardless of the adopted labeling scheme. We argue that such increase in the parameter’s value instructs the method to harshen its criteria in matching test apps () to apps in dejavu’s reference dataset (), effectively ruling out noisy apps and matching apps that are (almost) identical (i.e., with (). Similarly, higher values of () instruct deep matching to not only match apps according to their metadata but to include the names of their files, components, classes, and methods as well, which intuitively yields more precise matchings and, in turn, classifications. We plot such classification accuracies and summarize them in figure 2 and table 5, respectively, in appendix B.
Throughout this section, we plot and tabulate the detection accuracies achieved by each detection method using the aforementioned parameter values. Furthermore, we ran dejavu’s ensemble against the test datasets of Piggybacked, Original, and Malgenome using such values.
4.3.2 Time vs. Detection Accuracies
The data in table 2 summarizes the detection accuracies achieved by dejavu and its methods on different datasets under different labeling schemes. We use the data in this table to demonstrate the disarray varying the labeling scheme introduces to the composition of training datasets which ultimately affects the percentage of apps each detection method managed to analyze and the detection accuracies they yield. Without considering such percentages, it might seem that quick matching performs better under the vt1-vt1 labeling scheme than on the original one (i.e., 0.98 versus 0.89, respectively). However, under original, quick matching manages to classify 71% of 1399 apps as opposed to 49% under vt1-vt1.
To objectively compare the performance of detection methods, towards answering RQ2 and RQ3, we considered the apps that each detection method managed to classify under all labeling schemes (i.e., an intersection), which we summarize in table 3. A further demonstration of the impact of labeling schemes on the composition of training datasets and test results can be seen in the table. That is the number of apps all detection methods managed to classify depicts small percentages of the actual dataset. For example, only 112 apps (8%) out of 1399 were classified by quick matching under different labeling schemes. This phenomenon reaches an extreme for the deep matching detection method which manages to classify completely different apps under each labeling scheme, yielding an intersection of zero apps.
Similar to table 1, we emboldened the labeling scheme that was adopted by the datasets’ authors at the time of labeling and releasing the datasets to highlight the effect of time on the detection methods’ accuracies. In this case, the Piggybacked, Original, and Malgenome datasets share the same scheme, viz. vt1-vt1, or vt11 for short. We argue that time allows the VirusTotal scan results to mature or converge to a state that reflects each app’s real intentions. That is to say, the older an app is, the longer the time analysts have to analyze it, and the more accurate its labels are expected to be, which should help different detection methods classify apps in a dataset more accurately.
The detection accuracy scored by quick matching on the Piggybacked dataset under vt1-vt1 supports this hypothesis; the method’s detection accuracy had an improvement of 0.32 (i.e., increase of 47%), under the vt1-vt1 labeling scheme, albeit on 8% of the dataset. As for Malgenome, the performance of quick matching remained the same. So, it seems the time positively affects the performance of quick matching on malicious datasets. However, the exact opposite experience was encountered by the detection method on the Original dataset. Under vt1-vt1, as seen in table 1, the composition of the Original dataset significantly differed, with only 63% of the apps continued to be labeled as benign. To understand whether this structural modification affected the performance of quick matching, we retrieved the Original apps misclassified by the method under vt1-vt1. We found that 100% of such apps were compiled using dexlib and were identically matched to apps compiled using dx or dexmerge, yet the codebases of both apps differed. So, they were deemed malicious according to dejavu’s policy seen in line 8 of figure 1. This scenario would manifest in case (a) the same legitimate developer of an app opts to update their codebase on the smali level and repackage their apps, or (b) more likely the VirusTotal scan results continue to label such apps as benign mistakenly. Under the original labeling scheme, such apps would have been correctly classified as benign.
The same performance exhibited by quick matching was exhibited by dejavu’s ensemble. That is to say, on malicious datasets, time seems to enable dejavu to score better accuracies, whereas the detection accuracies on the Original dataset seems to worsen with time. We investigated the contribution of each individual detection method to detection accuracies scored by dejavu as an ensemble (i.e., as seen in appendix B), and found that quick matching contributed the most to the correctly classified apps on the Piggybacked and Original datasets. This explains, we argue, why the performance of quick matching was replicated on the ensemble method.
4.3.3 Labeling Scheme vs. Detection Accuracies
Towards answering RQ3, we investigated the impact of varying the labeling scheme on the detection accuracy of dejavu’s detection methods. Similar to the time dimension, we could not identify a unified pattern that explains the accuracies scored by all detection methods. In other words, one cannot assert, for example, that the performance of all detection methods improves after adopting the vt50p-vt1 labeling scheme. The only patterns we could identify were particular to a detection method, on a specific dataset, using certain labeling schemes. For instance, the accuracies of quick matching and dejavu’s ensemble generally improve on the Piggybacked and Malgenome datasets the harsher the condition to deem an app as malicious gets. Apart from such individual patterns, the detection accuracies scored by different detection methods appear to be haphazard.
We argue that varying the labeling scheme alters the labels in dejavu’s reference dataset, effectively yielding different versions of such datasets used to train the probabilistic classifier or match apps. For example, under the vt1-vt1 labeling scheme, the naive Bayes classifier used to classify apps in the Original dataset is trained using 24552 malicious apps from the AMD dataset, whereas the one under the vt50p-vt50p scheme will be trained using 12765 malicious apps. Intuitively, those apps are expected to yield different accuracies.
The mercurial performance of different detection methods under different labeling schemes on the same datasets is what we aspire to emboss in this paper. For example, consider the detection accuracies scored by dejavu’s ensemble on the Piggybacked dataset. Under the original labeling scheme, the method scores an accuracy of 0.72. However, the same method scores an accuracy of 0.99 on the exact same set of apps under the vt1-vt1 and vt50p-vt1.
So, depending on the adopted labeling scheme, the detection accuracy of the same detection method on the same dataset can differ by 37.5% (i.e., from 0.72 to 0.99). This phenomenon, we believe, is of the utmost significance, especially since it implies that two independent groups of researchers might have–depending on the labeling perspectives they adopt–two completely different experiences with working on the same dataset using two similar or even identical methods. Not only does this encourages one of such hypothetical groups to mistakenly, yet justifiably, abandon their approach, it gives other researchers assessing the other group’s work an incomplete picture of their detection method’s capabilities.
4.3.4 dejavu as an Ensemble
With RQ4, we wish to investigate whether combining different detection methods as a sequential ensemble (i.e., as seen in figure 1), helps boost the detection accuracies. As discussed in the previous sections, dejavu’s ensemble detection method faced the same challenges encountered by the individual methods courtesy of varying the dimensions of time and labeling schemes. However, the ensemble method managed to outperform its individual counterparts in the number of apps classified. For all datasets, dejavu’s ensemble managed to classify more apps than individual detection methods.
The reason behind this is that individual detection methods were designed to defer the classification of an app if they could not classify it with a confidence higher than a given value. Combining different methods increases the chances of classifying an app by one of the three methods.
5 Discussion
In interpreting the results of our experiments, we could not find any patterns that link the detection accuracies scored by dejavu’s detection methods on different labeling schemes and datasets with one another. The lack of such patterns is exactly what we wish to demonstrate in this paper and its core contribution, viz. varying the freshness of labels (i.e., time), the labeling scheme, and the attack scenario (i.e., represented by the dataset used to test the method), makes the same detection method yield very different detection accuracies. So, to objectively assess the performance of a detection method, researchers should take into account those three dimensions, and evaluate their detection methods using the combinations of all values of such dimensions rather than focusing on the combination(s) that yield the best accuracies. As a demonstration, we applied this evaluation methodology on dejavu and its detection methods and used the results of this evaluation to answer the research questions we postulated in section 4.
During our experiments, we noticed that, generally, varying the labeling scheme () indeed affects the detection accuracies scored by dejavu’s detection methods. However, regardless of the adopted labeling scheme, we found that the higher the values of the parameters used by dejavu’s detection methods, the higher the detection accuracies they score, which is the concern of RQ1. For example, the quick matching detection method is guaranteed to yield the highest detection accuracies with values of ().
We argue that the higher the values of such parameters, the harsher the criteria the detection method applies to match a test app () to one app or a class of reference apps (), and the more accurate the classification decision gets. For instance, a value of () would instruct the probabilistic classification detection method to return a label (i.e., malicious or benign), only if its classifier is 100% confident in its decision, as opposed to 80% or 70% confidence for values of 0.8 or 0.7, respectively.
In table 1, we showed that time significantly alters the composition of different datasets. We expected such effect to be a reflection of the maturity of the scan results returned by VirusTotal [18]. That is, the older an Android app is, the more analysis it will be subject to, and the more accurate its labels will be. This should, in theory, help detection methods achieve better detection accuracies using labels drawn from more recent VirusTotal scans. Regarding (RQ2), the results of our experiments partly support this hypothesis. We found that, by and large, dejavu’s detection methods perform better with time on malicious datasets (i.e., Piggybacked and Malgenome), especially quick matching and the ensemble.
As for RQ3, similar to the time dimension, varying the labeling scheme () had a noticeable effect on the detection accuracies of different detection methods. In this case, however, we could not identify patterns that explain the performances of all methods. Nonetheless, we demonstrate that by altering the labeling scheme, a given detection method can achieve on the exact same set of apps different detection accuracies with differences up to 0.32 in some cases. For example, as per table 3, the dejavu ensemble detection method achieved on the Original dataset a detection accuracy of 0.99 under the original labeling scheme, 0.94 under vt1-vt1, and 0.75 under vt50p-vt1. So, using the same detection method and the same dataset of apps, researchers adopting a conservative labeling scheme of vt1-vt1 (i.e., an app is deemed malicious if only one VirusTotal scanner deems it so), those adopting a relaxed scheme of vt50p-vt50p, and those relying on the original labeling scheme adopted by the dataset authors will have very different experiences. We believe that such discrepancies stem from the way each detection method uses the reference dataset, whose composition is profoundly affected by varying the labeling scheme (i.e., as seen in table 1). The aforementioned discrepancies, once again, emboss the effect of adopting different, labeling schemes on the performance of the same detection method on the same dataset.
In answering RQ4, we found that certain detection methods outperform the others under different attack scenarios (i.e., as discussed in section 2.2). Using the results tabulated in table 3, we found that quick matching performs better in most cases under the confusion scenario. By definition, the confusion scenario occurs whenever a repackaged app is being uploaded to a marketplace on which the original, benign app resides, in an attempt to confuse any vetting mechanism about the repackaged app’s true intentions. So, based on this assumption, quick matching attempts to match test apps () to one, or more, of the benign apps in dejavu’s reference dataset (). Since the test app () is designed to be similar to its benign counterpart (), quick matching can effectively match apps and, using the techniques of codebase similarity and compiler fingerprinting, decide upon whether () is a malicious version of ().
As for the probabilistic classification method, we found that it performs poorly under the confusion scenario. Nonetheless, we found that the method scores higher detection accuracies than the other detection methods under the conventional scenario, under which the test app () acts as an out-of-sample app that has never been seen before by a marketplace’s app vetting mechanism. Lastly, we found that the deep matching detection method can be useful only upon being utilized as a complementary method (e.g., within the dejavu ensemble). Despite scoring high detection accuracies (as seen in table 2), the method manages to analyze a small percentage of the datasets ranging from 1% to 7% when used individually.
Within the malware analysis and detection domain, combining detection methods is usually expected to yield better results [34, 13, 28]. Consequently, we combined the individual detection methods of quick matching, probabilistic classification, and deep matching as an ensemble, called dejavu, and recorded its detection accuracies on different datasets and labeling schemes. To answer RQ5, we found that the ensemble method does not consistently out or underperform individual detection methods when considering accuracy as the performance metric. However, considering the larger number of apps it classifies, dejavu’s ensemble method can be considered to provide more comprehensive results.
Lastly, we postulated RQ6 in an attempt to understand the nature of apps in the AMD and Piggybacking datasets that do not fit either criteria of the vt50p-vt1 labeling scheme. In other words, according to VirusTotal scan results, what are the apps that were deemed malicious by at least one scanner, yet were deemed malicious by less than 50% of such scanners. For convenience, we refer to those apps as the gap apps. Our hypothesis was that such gap apps are so-called potentially unwanted software or grayware (e.g., Adware). Given that VirusTotal scanners seldom agree upon a common label, we used the data provided by Hurier et al. via their tool Euphony[12] to get a consensus label for each gap app. Unfortunately, the data provided by Euphony does not include consensus labels for all the identified gap apps.
| Dataset | Gap Apps | Euphony | Top Families | |||
|---|---|---|---|---|---|---|
| Piggybacking | 1602 (58%) | 906 |
|
|||
| AMD | 11788 (48%) | 9250 |
|
As seen in table 4, applying the vt50p-vt1 labeling scheme reveals that about 58% of the apps in the Piggybacking dataset and about half of the apps in the AMD dataset belong to this set of ambiguous apps. Using Euphony, we managed to unify the labels of 906 and 9250 gap apps in the Piggybacking and AMD datasets, respectively. The results in the Top Families column reveal that the majority of such ambiguous gap apps is Adware. We postulate another research question: given the uncertainty of its nature, why is Adware considered malicious?
Firstly, we argue that the malignancy of Adware is a matter of perspective. On the one hand, as long as the Adware payload does not disrupt the functionality of the app itself or overwhelm them with advertisements, users might not consider this breed of apps as malicious. On the other hand, developers that rely on revenues from advertisements embedded in their apps, yet have their apps repackaged to re-route such revenues to attackers will consider Adware as malicious.
Secondly, the payloads of Adware are usually not malicious. That is they do not usually jeopardize the device’s stability or leak any sensitive user information. Instead, they establish contact with remote URL’s to display advertisements or download extra content. To decide upon whether such URL’s are malicious, we extracted the URL’s contacted by the gap apps in the AMD and Piggybacking datasets and used VirusTotal scans results of such URL’s. Out of 553 URL’s extracted from Piggybacking’s gap apps, only 98 (17.72%) were labeled as malicious by at least one VirusTotal scanner, with an average of 1.70 scanners out of 66.66 deeming the URL’s malicious. The results for the AMD’s gap apps were similar, viz. 1709 (14%) out of 12282 URL’s were found malicious with an average of 1.27 positive scanners out of 66.61.
We manually inspected a random sample of the URL’s labeled as malicious in both datasets and found that the majority of such URL’s pointed to advertisement engines and servers (e.g., https://api.airpush.com). Interestingly, some of the more suspicious URL’s (e.g., http://221.11.29.181 or http://f5mv9t9x9wtx.pflexads.com), were either labeled as benign or were not even scanned by any of the VirusTotal scanners.
6 Threats to Validity
We have identified four aspects that threaten the validity of our findings, which we discuss in the following paragraphs.
As a use case, we focus on Android repackaged malware due to the threat it poses to the Android ecosystem. Furthermore, given that Android repackaged malware can be encountered under different circumstances (as discussed in section 2.2), focusing on this breed of malware allows us to incorporate the dimension of attack scenario in our experiments. However, we argue that our evaluation framework is applicable to other types of Android malware and to other platforms (e.g., Windows-based malware), which we plan to investigate in future work.
Secondly, the sizes of the datasets we used in our evaluation (i.e., Piggybacked, Original, and Malgenome), are relatively small. Those sizes further decrease upon focusing on the apps that were classified by a detection method under all different labeling schemes (i.e., table 3). However, these are state-of-the-art datasets for the use case we have in this paper, and we consider it out of scope to increase the sizes of these datasets. Other use cases (e.g., Windows-based malware) may have larger datasets. Nevertheless, this is an important aspect to consider when using our evaluation methodology.
Thirdly, the detection methods and techniques utilized by dejavu depict only a subset of all the methods devised to detect Android (repackaged) malware. For instance, we did not consider dynamic-based methods that consider the runtime behaviors of test apps. Moreover, we only used one classifier (i.e., naive Bayes), instead of an ensemble of classifiers, for example. However, the objective of this paper is neither to compare all possible detection methods for Android (repackaged) malware nor to promote dejavu as a particularly promising detection method. The core contribution of our work is to indicate that–regardless of the type, quality, or sophistication of the utilized detection method–varying the freshness of VirusTotal’s scan results, the scheme adopted to interpret them to label apps, and the dataset used to emulate a particular attack scenario significantly impacts the detection accuracy a detection method.
Lastly, the 3 dimensions in our evaluation methodology are not to be considered an exhaustive list. We plan to research other aspects that might affect the performance of malware detection methods and incorporate them in our framework.
7 Related Work
In this section, we enumerate the research efforts we found are most relevant to ours.
(Android) Malware Labeling
There is a number of efforts that discuss the challenges facing the (Android) malware detection community due to the inconsistencies of labeling schemes and the volatility of data acquired from antiviral software/platforms. For example, in [11], Hurier et al. discuss the difficulty of acquiring a consensus vis-à-vis the label of a malicious Android app across different antiviral scanners. Similarly, Sebastian et al. in [25] introduce a cross-platform approach to rank (Android) malware labels and remove any noisy or redundant aliases associated with a malware instance. A closer work to ours, despite not focusing on Android malware, is that of Mohaisen et al. in [18]. In this work, the labels returned by different antiviral scanners are assessed to unveil the danger of relying on incomplete, inconsistent, and incorrect malware labels.
We have noticed that different researchers are aware of the problems of using (a) inconsistent and outdated information acquired from platforms such as VirusTotal, and (b) the presence of different interpretations of such information to label Android apps [14, 33, 36, 12]. Nonetheless, none of the aforementioned studies, and, to the best of our knowledge, no studies investigate the impact of using outdated labels or different labeling schemes on the performance of a detection method even on the same dataset.
Attack Scenarios
In our experiments, we considered two scenarios under which Android repackaged malware can be encountered by detection or app vetting mechanisms, namely, conventional scenario and confusion scenario. In the latter scenario, we assumed that attackers may elect to target marketplaces on which the original, benign versions of their malicious, repackaged instances reside to confuse any app vetting mechanisms using such benign apps as references of benign behaviors [5, 8, 38, 10]. Numerous efforts focus on devising and demonstrating methods to repackage Android apps in a manner that evades detection by any detection methods. By and large, such efforts focus on evading detection by machine learning classifiers and, thus, assumes that attackers possess substantial knowledge about (a) the structure of the classifier they are up against (e.g., the model it uses, its parameters, and the features used to train it), and (b) the field of adversarial machine learning.
In section 2.2, we defined a more realistic attacker that does not possess that much information about the detection methods they are trying to evade. Consequently, the closest work to ours was that of Salem et al. in [22]. In their work, they demonstrated the effect of the confusion scenario on the performance of an ensemble of machine learning classifiers that otherwise perform well (i.e., under the conventional scenario). They demonstrated that by testing an ensemble of classifiers that have been trained using apps from the Original segment of the Piggybacking dataset using apps from the Piggybacked segment. Despite solely using the original labeling scheme of the dataset, their experiments show the impact of the confusion scenario, which inspired us to evaluate dejavu under similar circumstances.
8 Conclusion
In evaluating (Android) malware detection methods, researchers usually rely on (outdated) scan results obtained from VirusTotal to label the apps in their training and test datasets [36, 15, 41]. Unfortunately, due to the lack of concrete standards or common practices that guide this labeling process, researchers rely on their subjective intuition to label apps. Using outdated labeling information and adopting different schemes to label apps, we argue, significantly affects the compositions of the datasets utilized by a malware detection method during evaluation, which leads to very different outcomes. Unfortunately, this phenomenon renders the effectiveness of a detection method as a matter of perspective. That is, depending on which side of this labeling kaleidoscope we are standing, the performance of a given detection method even on the same dataset might differ.
To demonstrate volatility of the data acquired from VirusTotal and the effect of interpreting it differently on the performance of Android repackaged malware detection methods, we implemented a representative ensemble of three detection methods, called dejavu, and used it to conduct more than 130 experiments using four different labeling schemes and three different datasets containing over 30,000 Android apps. The results obtained from our experiments indeed show that the detection accuracy achieved by one detection method might significantly vary depending on the freshness of the labels (e.g., acquired from VirusTotal), the labeling scheme, and the attack scenario, with differences up to 47% (i.e., from 0.68 to 1.0).
With our results and insights, we aspire to instigate the adoption of a methodology to evaluate the effectiveness of malware detection methods, that takes into consideration the freshness of labels, the different labeling schemes that can be adopted to label apps, and the different scenarios under which malware can be found, if applicable. In other words, we encourage researchers to adopt the following practices in evaluating the detection methods they devise. Firstly, malware analysis and detection researchers need to take the time dimension and the evolution of VirusTotal scan results into consideration upon labeling their apps and re-analyze those apps or acquire the latest scan results prior to evaluating their methods. Secondly, to accommodate different labeling schemes and ensure the comprehensiveness of their methods, researchers are encouraged to document the effect of adopting different labeling schemes on the performance of their methods. Needless to say, the more consistent the performance of a method across different labeling schemes, the steadier and more reliable it is. Lastly, researchers are encouraged to utilize different datasets of apps and scenarios (as seen in section 2.2), to ensure that their detection methods are resilient under different circumstances. With that in mind, our primary focus for future work is to devise a measure that gives an overall assessment of the effectiveness of a detection method given its performance across different combinations of the dimensions of time, labeling scheme, and attack scenario.
References
- [1] About android app bundles, 2019.
- [2] K-9 mail - advanced email for android, 2019.
- [3] Allix, K., Bissyandé, T. F., Klein, J., and Le Traon, Y. Androzoo: Collecting millions of android apps for the research community. In Mining Software Repositories (MSR), 2016 IEEE/ACM 13th Working Conference on (2016), IEEE, pp. 468–471.
- [4] Arp, D., Spreitzenbarth, M., Hubner, M., Gascon, H., and Rieck, K. Drebin: Effective and explainable detection of android malware in your pocket. In NDSS (2014).
- [5] Chen, X., Li, C., Wang, D., Wen, S., Zhang, J., Nepal, S., Xiang, Y., and Ren, K. Android hiv: A study of repackaging malware for evading machine-learning detection. arXiv preprint arXiv:1808.04218 (2018).
- [6] Cohen, W., Ravikumar, P., and Fienberg, S. A comparison of string metrics for matching names and records. In Kdd workshop on data cleaning and object consolidation (2003), vol. 3, pp. 73–78.
- [7] Crussell, J., Gibler, C., and Chen, H. Andarwin: Scalable detection of android application clones based on semantics. IEEE Transactions on Mobile Computing 14, 10 (2015), 2007–2019.
- [8] Demontis, A., Melis, M., Biggio, B., Maiorca, D., Arp, D., Rieck, K., Corona, I., Giacinto, G., and Roli, F. Yes, machine learning can be more secure! a case study on android malware detection. IEEE Transactions on Dependable and Secure Computing (2017).
- [9] Fenton, C. Apkid: Android application identifier for packers, protectors, obfuscators and oddities - peid for android, 2018.
- [10] Grosse, K., Papernot, N., Manoharan, P., Backes, M., and McDaniel, P. Adversarial examples for malware detection. In European Symposium on Research in Computer Security (2017), Springer, pp. 62–79.
- [11] Hurier, M., Allix, K., Bissyandé, T. F., Klein, J., and Le Traon, Y. On the lack of consensus in anti-virus decisions: Metrics and insights on building ground truths of android malware. In International Conference on Detection of Intrusions and Malware, and Vulnerability Assessment (2016), Springer, pp. 142–162.
- [12] Hurier, M., Suarez-Tangil, G., Dash, S. K., Bissyandé, T. F., Traon, Y. L., Klein, J., and Cavallaro, L. Euphony: Harmonious unification of cacophonous anti-virus vendor labels for android malware. In Proceedings of the 14th International Conference on Mining Software Repositories (2017), IEEE Press, pp. 425–435.
- [13] LeDoux, C., and Lakhotia, A. Malware and machine learning. In Intelligent Methods for Cyber Warfare. Springer, 2015, pp. 1–42.
- [14] Li, L., Bissyandé, T., and Klein, J. Rebooting research on detecting repackaged android apps: Literature review and benchmark. arXiv preprint arXiv:1811.08520 (2018).
- [15] Li, L., Li, D., Bissyandé, T. F., Klein, J., Le Traon, Y., Lo, D., and Cavallaro, L. Understanding android app piggybacking: A systematic study of malicious code grafting. IEEE Transactions on Information Forensics and Security 12, 6 (2017), 1269–1284.
- [16] Li, L., Li, D., Bissyande, T. F. D. A., Klein, J., Cai, H., Lo, D., and Le Traon, Y. Automatically locating malicious packages in piggybacked android apps. In 4th IEEE/ACM International Conference on Mobile Software Engineering and Systems (2017).
- [17] Mariconti, E., Onwuzurike, L., Andriotis, P., De Cristofaro, E., Ross, G., and Stringhini, G. MAMADROID: Detecting Android Malware by Building Markov Chains of Behavioral Models. In Proceedings of the Annual Symposium on Network and Distributed System Security (NDSS) (2017).
- [18] Mohaisen, A., and Alrawi, O. Av-meter: An evaluation of antivirus scans and labels. In International Conference on Detection of Intrusions and Malware, and Vulnerability Assessment (2014), Springer, pp. 112–131.
- [19] Pan, X., Wang, X., Duan, Y., Wang, X., and Yin, H. Dark hazard: Learning-based, large-scale discovery of hidden sensitive operations in android apps.
- [20] Pendlebury, F., Pierazzi, F., Jordaney, R., Kinder, J., and Cavallaro, L. Enabling fair ml evaluations for security. In Proceedings of the 2018 ACM SIGSAC Conference on Computer and Communications Security (2018), ACM, pp. 2264–2266.
- [21] Salem, A., Paulus, F. F., and Pretschner, A. Repackman: A tool for automatic repackaging of android apps. In Proceedings of the 1st International Workshop on Advances in Mobile App Analysis (2018), ACM, pp. 25–28.
- [22] Salem, A., and Pretschner, A. Poking the bear: Lessons learned from probing three android malware datasets. In Proceedings of the 1st International Workshop on Advances in Mobile App Analysis (2018), ACM, pp. 19–24.
- [23] Sanz, B., Santos, I., Laorden, C., Ugarte-Pedrero, X., Bringas, P. G., and Álvarez, G. Puma: Permission usage to detect malware in android. In International Joint Conference CISIS’12-ICEUTE´ 12-SOCO´ 12 Special Sessions (2013), Springer, pp. 289–298.
- [24] Sato, R., Chiba, D., and Goto, S. Detecting android malware by analyzing manifest files. Proceedings of the Asia-Pacific Advanced Network 36 (2013), 23–31.
- [25] Sebastián, M., Rivera, R., Kotzias, P., and Caballero, J. Avclass: A tool for massive malware labeling. In International Symposium on Research in Attacks, Intrusions, and Defenses (2016), Springer, pp. 230–253.
- [26] Shahriar, H., and Clincy, V. Kullback-leibler divergence based detection of repackaged android malware.
- [27] Shrivastava, S. K., Rana, J., and Jain, R. Text document clustering based on phrase similarity using affinity propagation. International Journal of Computer Applications 61, 18 (2013).
- [28] Spreitzenbarth, M., Schreck, T., Echtler, F., Arp, D., and Hoffmann, J. Mobile-sandbox: combining static and dynamic analysis with machine-learning techniques. International Journal of Information Security 14, 2 (2015), 141–153.
- [29] Stazzere, T. Detecting pirated and malicious android apps with apkid, 2016.
- [30] Suarez-Tangil, G., Dash, S. K., Ahmadi, M., Kinder, J., Giacinto, G., and Cavallaro, L. Droidsieve: Fast and accurate classification of obfuscated android malware. In Proceedings of the Seventh ACM on Conference on Data and Application Security and Privacy (2017), ACM, pp. 309–320.
- [31] Tian, K., Yao, D., Ryder, B. G., and Tan, G. Analysis of code heterogeneity for high-precision classification of repackaged malware. In Security and Privacy Workshops (SPW), 2016 IEEE (2016), IEEE, pp. 262–271.
- [32] VirusTotal. Virustotal, 2019.
- [33] Wang, H., Liu, Z., Liang, J., Vallina-Rodriguez, N., Guo, Y., Li, L., Tapiador, J., Cao, J., and Xu, G. Beyond google play: A large-scale comparative study of chinese android app markets. In Proceedings of the Internet Measurement Conference 2018 (2018), ACM, pp. 293–307.
- [34] Wang, W., Gao, Z., Zhao, M., Li, Y., Liu, J., and Zhang, X. Droidensemble: Detecting android malicious applications with ensemble of string and structural static features. IEEE Access (2018).
- [35] Wang, Z., Bovik, A. C., Sheikh, H. R., and Simoncelli, E. P. Image quality assessment: from error visibility to structural similarity. IEEE transactions on image processing 13, 4 (2004), 600–612.
- [36] Wei, F., Li, Y., Roy, S., Ou, X., and Zhou, W. Deep ground truth analysis of current android malware. In International Conference on Detection of Intrusions and Malware, and Vulnerability Assessment (2017), Springer, pp. 252–276.
- [37] Wu, D.-J., Mao, C.-H., Wei, T.-E., Lee, H.-M., and Wu, K.-P. Droidmat: Android malware detection through manifest and api calls tracing. In Information Security (Asia JCIS), 2012 Seventh Asia Joint Conference on (2012), IEEE, pp. 62–69.
- [38] Yang, W., Kong, D., Xie, T., and Gunter, C. A. Malware detection in adversarial settings: Exploiting feature evolutions and confusions in android apps. In Proceedings of the 33rd Annual Computer Security Applications Conference (2017), ACM, pp. 288–302.
- [39] Zhou, W., Zhou, Y., Grace, M., Jiang, X., and Zou, S. Fast, scalable detection of piggybacked mobile applications. In Proceedings of the third ACM conference on Data and application security and privacy (2013), ACM, pp. 185–196.
- [40] Zhou, W., Zhou, Y., Jiang, X., and Ning, P. Detecting repackaged smartphone applications in third-party android marketplaces. In Proceedings of the second ACM conference on Data and Application Security and Privacy (2012), ACM, pp. 317–326.
- [41] Zhou, Y., and Jiang, X. Dissecting android malware: Characterization and evolution. In Security and Privacy (SP), 2012 IEEE Symposium on (2012), IEEE, pp. 95–109.
Appendices
A Static Features
As discussed in section 3.2, we trained our probabilistic classifiers using numerical features statically extracted from the APK archives of apps in the Piggybacking (i.e, Piggybacked+Original), AMD, Malgenome, and GPlay datasets. In total, each app was represented by a vector of 40 features, which are divided into four categories, namely, basic features, permission-based features, API call features, and miscellaneous features. The following list mimics the order of every feature in the feature vector.
-
Basic features:
-
1.
Minimum SDK version (supported by the app).
-
2.
Maximum SDK version (supported by the app).
-
3.
Total number of activities.
-
4.
Total number of services.
-
5.
Total number of broadcast receivers.
-
6.
Total number of content providers.
-
1.
-
Permission-based features:
-
7.
Total request permissions.
-
8.
Ratio of Android permissions to total permissions.
-
9.
Ratio of Custom permissions to total permissions.
-
10.
Ratio of dangerous permissions to total permissions.
-
7.
-
API call features:
-
11.
Total number of classes.
-
12.
Total number of methods.
-
13.
Count of calls to methods in the android.accounts.AccountManager package.
-
14.
Count android.app.Activity package.
-
15.
Count android.app.DownloadManager package.
-
16.
Count android.app.IntentService package.
-
17.
Count android.content.ContentResolver package.
-
18.
Count android.content.ContextWrapper package.
-
19.
Count android.content.pm.PackageInstaller package.
-
20.
Count android.database.sqlite. SQLiteDatabase package.
-
21.
Count android.hardware.Camera package.
-
22.
Count android.hardware.display. DisplayManager package.
-
23.
Count android.location.Location package.
-
24.
Count android.media.AudioRecord package.
-
25.
Count android.media.MediaRecorder package.
-
26.
Count android.net.Network package.
-
27.
Count android.net.NetworkInfo package.
-
28.
Count android.net.wifi.WifiInfo package.
-
29.
Count android.net.wifi.WifiManager package.
-
30.
Count android.os.PowerManager package.
-
31.
Count android.os.Process package.
-
32.
Count android.telephony.SmsManager package.
-
33.
Count android.widget.Toast package.
-
34.
Count dalvik.system.DexClassLoader package.
-
35.
Count dalvik.system.PathClassLoader package.
-
36.
Count java.lang.class package.
-
37.
Count java.lang.reflect.Method package.
-
38.
Count java.net.HttpCookie package.
-
39.
Count java.net.URL.openConnection package.
-
11.
-
Miscellaneous features:
-
40.
Zero-based index of the compiler used to compile the app from (dx, dexmerge, dexlib 1.x, dexlib 2.x, Jack 4.x, or unknown).
-
40.
| Detection Methods |
|
|
|
||||||||||||
| Labeling Scheme () | vt1-vt1 | vt50p-vt50p | vt50p-vt1 | vt1-vt1 | vt50p-vt50p | vt50p-vt1 | vt1-vt1 | vt50p-vt50p | vt50p-vt1 | ||||||
|
0.8 | 0.9 | 0.7 | 1.0 | 1.0 | 1.0 | 3 | 2 | 2 | ||||||
|
0.7 | 1.0 | 0.7 | 1.0 | 1.0 | 1.0 | 2 | 2 | 3 | ||||||
|
0.7 | 0.7 | 0.8 | 1.0 | 1.0 | 1.0 | 2 | 2 | 2 | ||||||
| Detection Methods |
|
|
|
||||||||||||||||||||||||||
|---|---|---|---|---|---|---|---|---|---|---|---|---|---|---|---|---|---|---|---|---|---|---|---|---|---|---|---|---|---|
| Labeling Scheme () | vt1-vt1 | vt50p-vt50p | vt50p-vt1 | vt1-vt1 | vt50p-vt50p | vt50p-vt1 | vt1-vt1 | vt50p-vt50p | vt50p-vt1 | ||||||||||||||||||||
|
|
|
|
|
|
|
|
|
|
||||||||||||||||||||
|
|
|
|
|
|
|
|
|
|
||||||||||||||||||||
|
|
|
|
|
|
|
|
|
|
||||||||||||||||||||
B Additional Figures
B.1 dejavu Ensemble Accuracies and Parameters
To address research question (RQ1), we conducted a series of experiments to investigate any relationship between different labelings scheme and the parameters adopted by dejavu’s individual detection methods (i.e., (), (), and ()), and whether this relationship affects the detection accuracies scored by each method on the Piggybacked, Original, and Malgenome datasets. In figure 2, we plot this relationship and use it to extract the parameter values that helped each detection method achieve the highest detection accuracy on each dataset-labeling scheme combination. Furthermore, we tabulate such values in table 5.

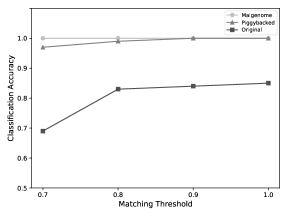


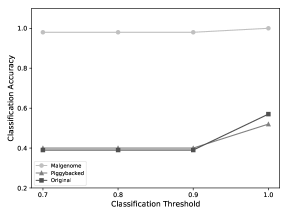
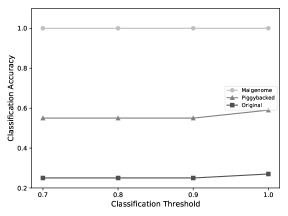
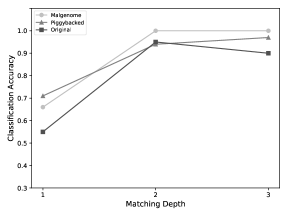
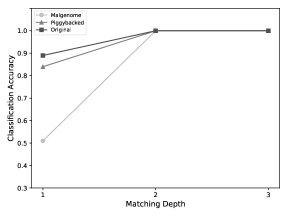
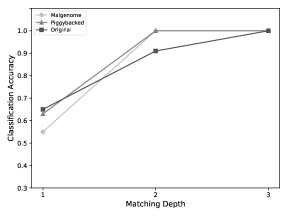
B.2 dejavu Detection Method Decomposition
In this section, we plot the contribution of each individual detection method to the detection accuracies of dejavu’s ensemble. Table 6 summarizes such contributions in terms of the percentage of apps each detection method correctly classified as part of the ensemble for different dataset-labeling scheme combinations. For example, under the original labeling scheme, 72% of the apps correctly classified by dejavu’s ensemble were, in fact, classified by the quick matching detection method with an average of 28.48 seconds taken to classify those apps. We present this data in the form of pie charts in figure 3.