Graphene resonator as an ultrasound detector for generalized Love waves in a polymer film with two level states
Abstract
We have investigated surface shear waves at 22 MHz in a 0.5-micron-thick polymer film on SiO2/Si substrate at low temperatures using suspended and non-suspended graphene as detectors. By tracking ultrasound modes detected by oscillations of a trilayer graphene membrane both in vacuum and in helium superfluid, we assign the resonances to surface shear modes, generalized Love waves, in the resist/silicon-substrate system loaded with gold. The propagation velocity of these shear modes displays a logarithmic temperature dependence below 1 K, which is characteristic for modification of the elastic properties of a disordered solid owing to a large density of two level state (TLS) systems. For the dissipation of the shear mode, we find a striking logarithmic temperature dependence, which indicates a basic relation between the speed of the surface wave propagation and the mode dissipation.
I Introduction
Graphene forms a promising platform for a multitude of detectors and sensors Ferrari et al. (2015). One classical application is strain gauges which can be formed using graphene in a polymer matrix Boland et al. (2016). Suspended graphene can also be employed as a strain gauge for deformations, while it simultaneously allows one to gauge the environment via chemical/physical attachment, pressure, and viscous damping. These properties make suspended graphene devices versatile tools at low temperatures Chen and Hone (2013). This includes detectors of ultrasound Verbiest et al. (2018) with sensitivity of the order of , and ultrasonic surface waves in this work utilized as a probe of two level systems. Surface wave devices are of considerable potential for sensing applications in liquid environments. Interaction of a liquid or solvent with the sensor surface can modify the properties of acoustic waves (velocity, frequency, or phase) which facilitates detection of changes in the liquid properties, or alternatively, sensing of adsorbed molecules. Rayleigh wave devices display superior sensitivity in general reaching sensitivities of the order of using interdigitated capacitors and using optical interferometric techniques in the MHz frequency range Boltz and Fortunko (1996). However, they appear unfit for operation in liquid due to strong damping associated with radiation losses into the liquid Harding and Du (1997). Hence, alternative measurement schemes are of interest.
Recently, sensing devices based on horizontal shear waves (SH) confined to the surface, Love waves, have been developed (see e.g. Refs. Kovacs et al., 1992; Harding and Du, 1997; Rocha et al., 2013, and references therein). Love waves can propagate near the surface of a substrate, when the surface is covered by a thin film having suitable properties for guiding the waves. The primary condition for existence of Love waves is that the shear wave velocity in the film is smaller than the shear wave velocity in the substrate. This can be achieved, e.g., by using polymer resists like PMMA (poly methyl methacrylate) Gizeli et al. (1992a); Harding and Du (1997) or SU-8 (epoxy-based polymer) Roach et al. (2007) which behave as soft viscoelastic materials with a quite low shear resistance, and hence their acoustic shear wave velocities are small, m/s for PMMA at room temperature Gizeli et al. (1992b). Small density (g/cm3) and small lead to good isolation of the polymer surface shear waves from the substrate. The only extrinsic loss mechanism for a shear wave mode interacting with a liquid is a result of viscous surface coupling, i.e. no mode conversion is involved, contrary to the case of Rayleigh waves Auld (1973). Since surface shear waves do not have elastic coupling into liquids, these waves are particularly attractive for sensing systems in which the liquid environment only acts as the transporting medium for the searched compounds.
In our work, we are interested in lift-off-resist polymer films (made of LOR 3A polydimethylglutarimide) which are quite commonly in use in graphene nanofabrication. These LOR films are employed as support layers for suspended graphene devices reaching ultimate carrier mobility. In this work, we have operated our suspended graphene devices as mechanical resonators, both under vacuum conditions as well as immersed in 4He superfluid. By comparing the results of devices in vacuum and immersed in superfluid, we can distinguish between graphene, gold, and substrate modes. We find that an approximately 500 nm thick LOR polymer film on top of a regular Si/SiO2 substrate display resonances corresponding to SH-waves confined to the surface, which can be considered as generalized Love waves McHale et al. (2002). The Love wave modes distinguish themselves from the other observed modes by not displaying a frequency shift when immersed in superfluid helium, as the effective mass of shear modes remains unchanged. We have investigated these waves as a function of temperature and find good agreement between the observed properties and the predictions from two level state (TLS) tunneling models Auld (1973); Roach et al. (2007). Owing to the high purity of the silicon/SiO2 substrate, we conclude that the TLS systems have to reside in the topmost, amorphous resist layer.
II Experimental methods
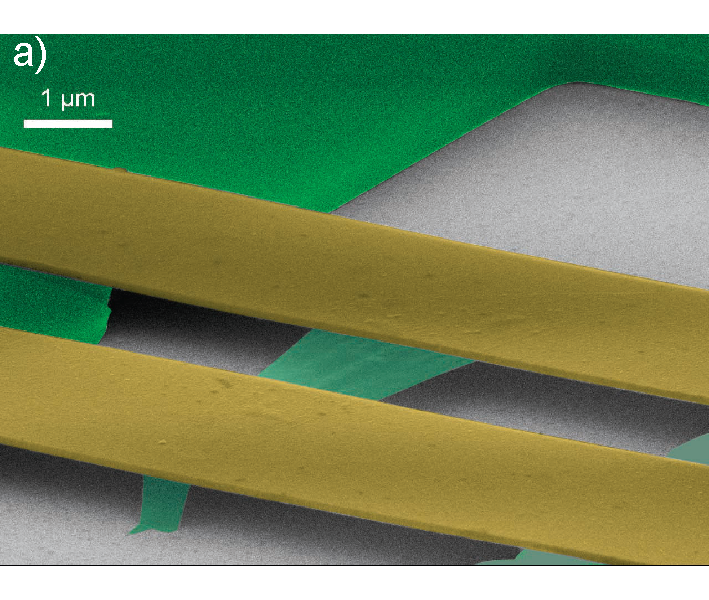
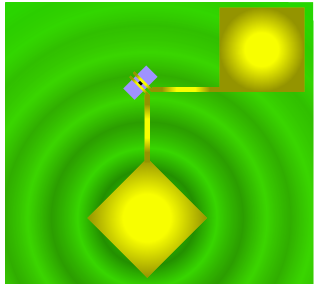
The layout of our samples is quite standard for suspended graphene devices, consisting of bonding pads, metallic leads that are partly suspended, and a fully suspended graphene section. However, in this work the bonding pads of m2 area are considered as surface wave generators.
Owing to the back-gated structure, the capacitive force becomes large across the LOR and SiO2 layers, which facilitates excitation of resonance-enhanced deformations of the substrate. For the Love-waves we are concerned with here, we seek to excite resonances that give rise to SH-modes localized near the surface. The simplest source of such SH-resonances is the pad itself executing resonant horizontal vibrations. This problem, vibrations of rectangular foundations on stratified elastic and viscoelastic media, has a long history in the context of seismic safety engineering Kobori et al. (1971); Luco (1974). Although it is possible to solve the problem numerically Wong and Luco (1976); Amiri-Hezaveh et al. (2013), we note that the characteristic frequency can be estimated via the static compliance for shear deformations Kobori et al. (1971); Gazetas (1991). We obtain in this way the estimate:
| (1) |
Here m is the sidelength of the Au/Cr pad, ng is the effective mass of the resonating mode, GPa the shear modulus of the LOR, and its Poisson’s ratio. Importantly, this resonant frequency is proportional to the velocity of SH-waves in the substrate, which for LOR becomes m/s. With Young’s modulus GPa Foulds et al. (2008) for the LOR layer and dielectric constant , we find for a typical gate excitation (V and mV) that the resonant amplitude is in the picometer range in our geometry. COMSOL simulations further confirm that the lowest eigenfrequencies of the gold pads involve mostly lateral movement while vertical displacement in opposite directions is found foremost at opposing edges. The movement can well be detected using graphene resonators, which display non-linear response already at an oscillation amplitude pm for flexural modes Song et al. (2012).
The distance from the wave generators to the sample, located on the symmetry axis (diagonal to the square) of the pad, is 100m for the two pads, respectively. The sample itself is oriented at 45 angle with respect to the symmetry axis (see Fig. 1b). For horizontal angular frequency excitations with larger than the characteristic frequency scale , the surface wave field may undergo considerable phase-shifts () between pad edge and detector Amiri-Hezaveh et al. (2013). Such a large phase shift can be considered as an indication of spatially separated generation and detection of the waves. The separation also means that additional frequency and temperature-dependent damping may occur before detection.
II.1 Samples and their characterization
Our sample fabrication follows the scheme based on different selectivities of resists: lift-off-resist (LOR) for support and PMMA for lithography were employed in the sample fabrication (for details see Refs. Kumar et al., 2018 and Tombros et al., 2011). The total thickness of the LOR layer amounted to nm after two spin-coatings. Then, we exfoliated graphene (Graphenium, NGS Naturgraphit GmbH) using a heat-assisted technique Huang et al. (2015). Graphene flakes were located on the basis of their optical contrast, and their numbers of atomic layers were verified using a Raman spectrometer with He-Ne laser (633 nm). The top metallic contacts (Cr/Au, 5 nm/60 nm) defining the freely suspended area of graphene (see Fig. 1a) were patterned and deposited using e-beam lithography and ultra-high vacuum metal evaporation techniques. Then, the LOR under and around the graphene flake was removed by exposing it to a 20 kV e-beam and developing in ethyl lactate. Finally, the chip was lifted off from hexane bath where hexane’s low surface tension allowed the graphene membrane to pass the liquid surface unharmed. A strongly doped silicon Si++ substrate (thickness m) with a 285 nm layer of thermally grown SiO2 provided the back gating electrode for the sample. The geometry of the sample is illustrated in Fig. 1.
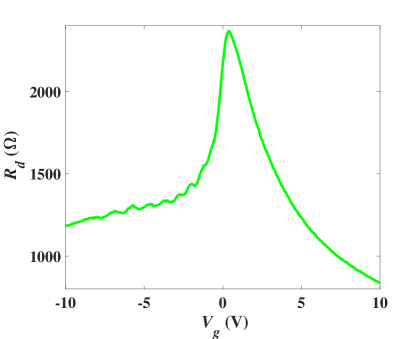
Initially, after the fabrication process, our suspended devices tend to be -doped in the first resistance vs. gate voltage scans. Following the initial characterization, the samples were cooled down to = mK base temperature of a Bluefors LD-400 dry dilution refrigerator. Prior to electrical characterization, all devices were current annealed at the base temperature. These samples on LOR were typically annealed at a bias voltage of 1.60.1 V which is comparable with the optimal annealing voltage of our HF etched, rectangular two-lead samples Laitinen et al. (2014) and are close to the values employed for our monolayer samples on LOR Kumar et al. (2018). The trilayer graphene device here is effectively slightly -doped even after annealing. Nevertheless, -junctions are formed on the negative gate voltage side, which is visible as larger resistance at V than at V, see Fig. 2. Besides a small difference in the work functions of the materials Laitinen et al. (2016), we assign this behavior to non-uniform doping and screening across the graphene layers.
Standard lock-in techniques using DL Instruments 1211 preamplifier (with sensitivity V/A) followed by a Stanford SR830 lock-in were employed for conductance measurements. The sample was voltage biased with V source-drain AC voltage while the back gate was tuned from V to V. Electronic mobility in the devices could be determined from the conductance measurements , and was found to be cm2/Vs for our trilayer sample. The gate voltage was converted into charge carrier density using , where denotes the offset of the Dirac point from V. The investigated trilayer sample had V (see Fig. 2). For our suspended monolayer graphene samples that were fabricated and characterized in the same manner as the trilayer sample, we found the Dirac point close to V, and mobility exceeding cm2/Vs. We also fabricated and measured a LOR-supported control sample where the fabrication and characterization was identical to the suspended samples except for omitting the final LOR removal step. This sample had a mobility around cm2/Vs and the Dirac point V.
II.2 Detection of mechanical modes
For the detection of mechanical modes, we employed the mixing current method based on frequency modulation Gouttenoire et al. (2010). Typically, as considered in Ref. Gouttenoire et al., 2010, the mechanical motion yields a mixing current via the change in differential conductance due to charge modulation induced by an amplitude change as:
| (2) | |||
Here describes the resonant response of the resonator, denotes the distance between the graphene membrane and the gate electrode. The sample is biased using a frequency modulated signal ; is the amplitude of the carrier frequency signal, is the frequency modulation (typically 613 Hz was employed), and defines the modulation depth (around 1-5 kHz). The angle indicates a phase shift between the drive and the response, which e.g. can be 0 or for graphene oscillations driven from the clamps due to the slow speed of flexural modes Manninen et al. (2018). Note that this mixing current formula works also for mechanical displacements in other directions provided that there is proper conductance modulation by strain.
The appealing property of the FM modulation method is its insensitivity against spurious resonance signals, when compared with other detection schemes, for example the rectification method. Thus, non-linearities in the IV curve of the graphene device cannot give rise to the observed mechanical resonance spectra.
III Experimental Results
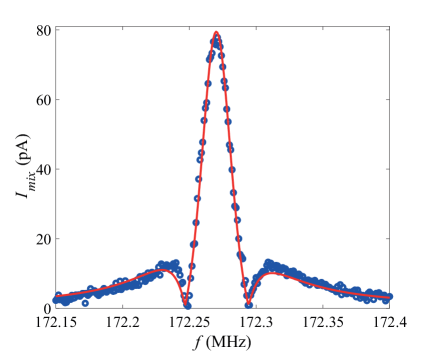
We scanned the frequency range MHz for mechanical resonances, both in vacuum as well as in superfluid 4He. Altogether, we found about 30 resonances, the majority at frequencies above 100 MHz. Owing to their high frequencies and gate voltage dependencies, we assigned most of these modes to the graphene. The resonance identified as the fundamental mode in our trilayer graphene sample is illustrated in Fig. 3a. This spectrum has the regular symmetric form of a FM modulated resonance signal. The overlaid red curve is obtained from Eq. 2 using . The fit yields for the quality factor (K).
Fig. 3b illustrates resonance peaks belonging to the the gold leads. They appear via the motion of graphene and their shape has a phase shift () compared with the graphene resonances. We display only the resonances assigned to the flexural modes of the gold at and 8.7 MHz in vacuum. Above 10 MHz, we observe also torsional modes of the gold beams. The gold modes are coupled via the graphene sheet, which leads to complicated internal dynamics of our system at large amplitudes.
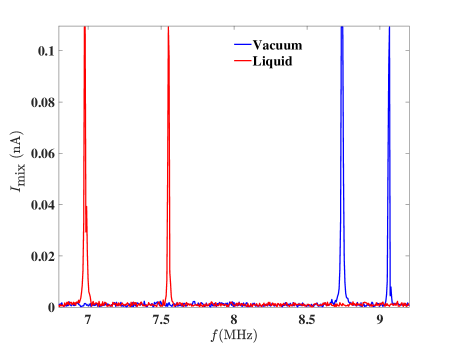
When the graphene device is immersed in liquid, the mechanical modes change dramatically. In particular, the frequency of the graphene modes drops to about % of their original frequency and their amplitude goes down by an order of magnitude. The change for both graphene and gold resonance frequencies arises due to the enhanced effective masses, which for plates with large aspect ratio is quite substantial Blaauwgeers et al. (2007). The frequency of the gold beam resonances decreases by MHz, i.e. by approximately %, which agrees well with estimates based on Ref. Blaauwgeers et al., 2007.
Our data also include resonances that do not change at low temperatures within our experimental accuracy of kHz, when the experimental chamber is filled with superfluid helium. The spectrum of one such mode around MHz is displayed in Fig. 4a at mK: the shape is asymmetric which can be accounted for by a phase shift between the drive and the response. The solid curve is a fit to the resonance formula in Ref. Gouttenoire et al., 2010 using for mixing the in-phase and out-of-phase responses. This phase shift is well in line with propagating waves between the pad and the graphene detector. Fig. 4b illustrates the same resonance at K. There is a small increase in frequency, line width, and in , which we have obtained using Eq. 2. Also, the amplitude of the resonance grows more strongly with lowering temperature than the inverse width of the mode. This is a sign that the detection sensitivity of the graphene membrane for this mode increases when the dissipation of the generated sound decreases around 22.5 MHz.
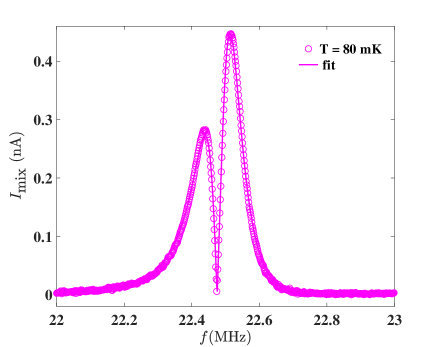
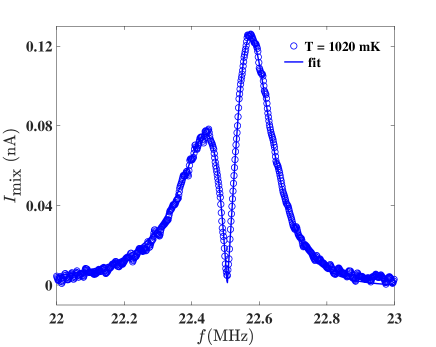
Fig. 5a displays the center frequency of the resonance of Fig. 4 as a function of temperature ; besides data in superfluid at pressure bar, there are also coinciding reference data obtained in vacuum. The center frequency was extracted using fits of Eq. 2 to the measured line shapes. Clearly, a logarithmic variation of the resonance frequency with temperature is observed below 700 mK. Above 700 mK, the resonant frequency starts to decrease with , in a similar fashion as observed in many glassy substances Piché et al. (1974).
The independence of the resonance frequency on the superfluid environment indicates that the mode is likely a surface shear mode (a generalized Love wave McHale et al. (2002)) which couples to suspended graphene via a change in the strain of the device. At low temperatures, the fraction of normal fluid is small Tilley and Tilley (1990), and no apparent viscous coupling from superfluid is observed on the shear mode. In the absence of any enhancement in the effective mass, the mode frequency remains unchanged in superfluid 4He environment.
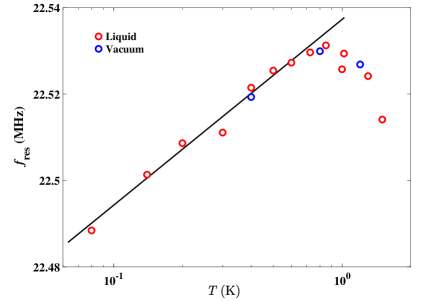
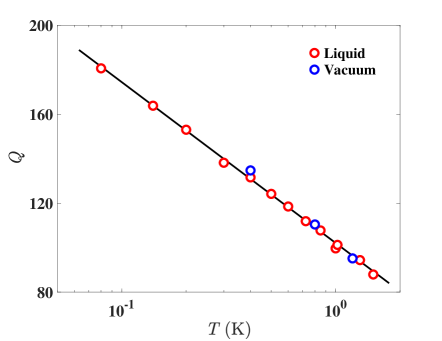
Fig. 5b displays the quality factor (see Eq. 2) of the surface mode at 22.5 MHz as a function of temperature; the data points have been extracted from the same fits as the center frequencies in Fig. 5a. Our data indicate that the dissipation of this mode is the same both in vacuum and in superfluid 4He. It also means that the surface wave does not emit sound waves in superfluid helium: because the sound velocity in liquid helium is very small, about 200 m/s Tilley and Tilley (1990), there is a strong acoustic mismatch against emitting sound from the surface wave into the superfluid. Thus, the same dependent behavior of is observed in helium liquid as in vacuum, and the quality factor is found to change from at mK up to at mK.
Similar results were also obtained with measurements in vacuum on suspended monolayer samples and a non-suspended control sample. For two suspended monolayer samples with the same m2 bonding pad size as in the trilayer sample, broad double peak resonances with quality factors were found at 21.0 MHz and 22.1 MHz, respectively. A similar resonance at 21.2 MHz with was found in the LOR-supported control sample. However, significantly higher RF input power, 40 dB more the trilayer measurements, and 20 dB more suspended monolayer case, was required to produce the same mixing current in the LOR-supported sample.
IV Discussion
Properties of glassy materials at low temperatures have been investigated extensively in the past using surface waves Piché et al. (1974); Von Haumeder et al. (1980): Strong logarithmic temperature dependence of sound velocity has been obsereved in vitreous silica glass, quite contrary to the behavior observed in fully crystalline quartz. The observed variation was interpreted by Piche et al. Piché et al. (1974) as characteristics for amorphous materials due to the existence of tunnelling defects Anderson et al. (1972); Phillips (1972). Besides amorphous silicon oxide, surface waves have been observed in amorphous germanium at temperatures K Duquesne and Bellessa (1983), and a logarithmic temperature correction in the sound velocity at 200 MHz was observed below 1 K. Since our measured indicates similar dependent velocity variation as in Refs. Piché et al., 1974; Von Haumeder et al., 1980; Duquesne and Bellessa, 1983, we associate our findings with two level state systems in the amorphous resist layer, which influence the acoustic properties across the whole sample, including the effective speed for surface shear waves. Note that, for crystalline solids, would be a decreasing function of temperature as the bulk modulus is reduced with increased thermally-induced lattice motion.
Owing to their special properties, polymers have given rise to great interest as acoustic guiding layers for localized Love waves Gizeli et al. (1992a); Du et al. (1996); Harding and Du (1997); Roach et al. (2007). To our knowledge, however, Love modes with polymers have not yet been investigated at cryogenic temperatures, although glassy properties of PMMA at MHz frequencies have been addressed by Federle and Hunklinger at K Federle and Hunklinger (1982). Our work is able to cast light on the properties of generalized Love modes at low using graphene-based detection, and thereby we can investigate glassy properties of polymers in a new fashion.
The coupling between surface phonons and the TLS systems contains two major contributions: 1) the resonant coupling and 2) relaxation processes Hunklinger (1998). When , the resonant absorption can be neglected as both of the two level states are nearly equally populated. The resonance processes, nevertheless, contribute to elastic properties at low temperatures. These processes lead to a velocity correction given by (see e.g. Ref. Tate et al., 1979):
| (3) |
where signifies the deformation potential, is density of the tunnelling defects, is the mass density, is the velocity of the sound wave, is a factor on the order of unity, and denotes an arbitrary reference temperature. The change in will lead to a corresponding change in the frequency of the resonance mode plotted in Fig. 5a. Note that the coupling parameter and its scaled value have to be considered as averaged quantities because of the intrinsic non-uniformity of the glassy resist materials in question Federle and Hunklinger (1982).
By fitting Eq. 3 to the data in Fig. 5a, we obtain . The properties of PMMA resist (density g/cm3, m/s at 4.2 K) down to 60 mK have been investigated in Ref. Federle and Hunklinger, 1982. A dependent variation of the sound speed was found, which amounted to approximately to over the range mK. This is eight times smaller than our result on a similar polymer LOR 3A (density g/cm3). Since , this would suggest that both the deformation potential and the density of two level states have to be larger in LOR 3A than in PMMA ( and are taken as approximately equal for LOR 3A and PMMA) 111Because of the high quality of our SiO2 layer and that the thickness of SiO2 is clearly less than that of LOR 3A, we neglect the influence of the SiO2 layer in our analysis, although SiO2 fulfills the speed condition for guiding a shear wave on top of silicon Du and Harding (1998). Furthermore, according to Ref. Venkatesan et al., 2010, for gold beam resonators and, thus the dissipation due to TLS systems in gold can be neglected in our work.
At high temperatures, relaxation processes dominate over the resonant ones, which leads to opposite sign for the prefactor in Eq. 3 Hunklinger (1998). Thus, there will be a maximum in as a function of , which is observed in Fig. 5a. Furthermore, at temperatures above the maximum of , acoustic losses are mostly dominated by processes having , which would lead to . This formula yields to around 1 K which is close to the measured value obtained from Fig. 5b.
Figure 5b displays a logarithmic decrease of the apparent quality factor with increasing temperature. This is in contrast to the behavior governing the accoustic attenuation if only TLS are accounted for Hunklinger (1998). Here, other mechanisms dominate the observed behavior, the most obvious being the specific frequency depence of the dynamic compliance of the source configuration. Taking the pads into account, we have for a horizontally vibrated pad in the regime where (as is the case here), that the imaginary part of the dynamic compliance scales as Luco and Westmann (1972). This leads to, consistent with observation, . Thus, the qualitative the origin of the apparent dissipative behavior in Fig. 5b lies in TLS-induced velocity changes in the LOR 3A layer.
In addition, one may argue that the both the velocity and the prefactor in Eq. 3 differs slightly under the gold layer compared with the LOR 3A region without gold. This leads to a temperature dependent velocity difference causing an acoustic impedance mismatch, guiding the shear wave towards the detector. The larger is consistent with additional disorder generation caused by heating or stress, i.e., that evaporation of Cr/Au enhances the amount of TLS systems in the resist. Consequently, as the speed difference decreases logarithmically with increasing the impedance matching is improved and leading to effective losses from regions below gold to be proportional to . This leads to a dependent enhancement in the loss of energy in the gold covered region, and the graphene detector indicates an effective .
Besides shear modes owing to the polymer layer, we have considered the possibility of having a surface acoustic wave propagating in graphene Thalmeier et al. (2010). However, the weakness of the gate dependence of the resonance frequency rules out this scenario. On the other hand, according to the review of Ref. Pohl et al., 2002, the coupling between TLS systems and surface waves can be large in polymers, which supports our view that the obtained surface wave results describe intrinsic TLS-induced properties of generalized Love waves in the resist/substrate system.
In summary, without resorting to typical piezoelectric generation and detection of surface acoustic waves, we have successfully investigated propagating surface shear modes, generalized Love waves on resist/silicon substrate system loaded by gold. These modes at ultrasonic frequencies could be excited resonantly by the high electric field below the gold bonding pads which acted as phonon cavity resonators. For detection, we employed graphene as a suspended (and non-suspended) strain gauge in a geometry which facilitated separation between graphene, gold and surface shear modes. Proof of the nature of the shear mode in the resist/substrate setting was inferred from the insensitivity of the mode frequency and the losses upon immersion of the device into superfluid helium. Our data on the temperature dependence of the propagation properties of this shear mode indicate strong coupling between two level systems and the surface wave. The coupling can be interpreted in terms of the regular tunneling TLS model in the presence of strong disorder.
Acknowledgements
We thank F. Massel for fruitful discussions. This work has been supported by the Academy of Finland (projects no. 314448 and 310086) and by ERC (grant no. 670743). This research was funded by European Union’s Horizon 2020 Research and Innovation Programme under Grant Agreement No. 824109. A.L. and J.-P.K. are grateful to Vaisälä Foundation of the Finnish Academy of Science and Letters for a scholarship. A.I. acknowledges the hospitality of Aalto University. This research project made use of the Aalto University OtaNano/LTL infrastructure which is part of European Microkelvin Platform.
References
- Ferrari et al. (2015) A. C. Ferrari, F. Bonaccorso, V. Fal’ko, K. S. Novoselov, S. Roche, P. Bøggild, S. Borini, F. H. L. Koppens, V. Palermo, N. Pugno, J. a. Garrido, R. Sordan, A. Bianco, L. Ballerini, M. Prato, E. Lidorikis, J. Kivioja, C. Marinelli, T. Ryhänen, A. Morpurgo, J. N. Coleman, V. Nicolosi, L. Colombo, A. Fert, M. Garcia-Hernandez, A. Bachtold, G. F. Schneider, F. Guinea, C. Dekker, M. Barbone, Z. Sun, C. Galiotis, A. N. Grigorenko, G. Konstantatos, A. Kis, M. Katsnelson, L. Vandersypen, A. Loiseau, V. Morandi, D. Neumaier, E. Treossi, V. Pellegrini, M. Polini, A. Tredicucci, G. M. Williams, B. Hee Hong, J.-H. Ahn, J. Min Kim, H. Zirath, B. J. van Wees, H. van der Zant, L. Occhipinti, A. Di Matteo, I. a. Kinloch, T. Seyller, E. Quesnel, X. Feng, K. Teo, N. Rupesinghe, P. Hakonen, S. R. T. Neil, Q. Tannock, T. Löfwander, and J. Kinaret, Nanoscale 7, 4598 (2015).
- Boland et al. (2016) C. S. Boland, U. Khan, G. Ryan, S. Barwich, R. Charifou, A. Harvey, C. Backes, Z. Li, M. S. Ferreira, M. E. Möbius, R. J. Young, and J. N. Coleman, Science 354, 1257 (2016).
- Chen and Hone (2013) C. Chen and J. Hone, Proceedings of the IEEE 101, 1766 (2013).
- Verbiest et al. (2018) G. J. Verbiest, J. N. Kirchhof, J. Sonntag, M. Goldsche, T. Khodkov, and C. Stampfer, Nano Letters 18, 5132 (2018).
- Boltz and Fortunko (1996) E. S. Boltz and C. M. Fortunko, Review of Progress in Quantitative Nondestructive Evaluation: Determination of the Absolute Sensitivity Limit of a Piezoelectric Displacement Transducer (Springer, 1996).
- Harding and Du (1997) G. L. Harding and J. Du, Smart Mater. Struct. 6, 716 (1997).
- Kovacs et al. (1992) G. Kovacs, G. Lubking, M. Vellekoop, and a. Venema, IEEE Ultrason. Symp. Proc. , 281 (1992).
- Rocha et al. (2013) M. I. G. Rocha, Y. Jiménez, F. A. Laurent, and A. Arnau, in State of the Art in Biosensors, edited by T. Rinken (IntechOpen, Rijeka, 2013) Chap. 11.
- Gizeli et al. (1992a) E. Gizeli, N. J. Goddard, C. R. Lowe, and A. C. Stevenson, Sensors and Actuators B: Chemical 6, 131 (1992a).
- Roach et al. (2007) P. Roach, S. Atherton, N. Doy, G. McHale, and M. I. Newton, Sensors 7, 2539 (2007).
- Gizeli et al. (1992b) E. Gizeli, N. J. Goddard, C. R. Lowe, and A. C. Stevenson, IEEE Trans. Ultrason. Ferroelectr. Freq. Control 39, 657 (1992b).
- Auld (1973) B. A. Auld, Acoustic fields and waves in solids, A Wiley-Interscience publication (Wiley, 1973).
- McHale et al. (2002) G. McHale, M. I. Newton, and F. Martin, Journal of Applied Physics 91, 5735 (2002).
- Kobori et al. (1971) T. Kobori, R. Minai, and T. Suzuki, Bulletin of the Disaster Prevention Research Institute 20, 289 (1971).
- Luco (1974) J. Luco, Nuclear Engineering and Design 31, 204 (1974).
- Wong and Luco (1976) H. L. Wong and J. E. Luco, Earthquake Engineering & Structural Dynamics 4, 579 (1976).
- Amiri-Hezaveh et al. (2013) A. Amiri-Hezaveh, M. Eskandari-Ghadi, M. Rahimian, and A. K. Ghorbani-Tanha, Journal of Applied Mechanics 80, 051017 (2013).
- Gazetas (1991) G. Gazetas, “Foundation vibrations,” in Foundation Engineering Handbook, edited by H.-Y. Fang (Springer US, Boston, MA, 1991) pp. 553–593.
- Foulds et al. (2008) I. G. Foulds, R. W. Johnstone, S. H. Tsang, M. Hamidi, and M. Parameswaran, Journal of Micromechanics and Microengineering 18, 045026 (2008).
- Song et al. (2012) X. Song, M. Oksanen, M. A. Sillanpää, H. G. Craighead, J. M. Parpia, and P. J. Hakonen, Nano letters 12, 198 (2012).
- Kumar et al. (2018) M. Kumar, A. Laitinen, and P. Hakonen, Nature Communications 9, 2776 (2018).
- Tombros et al. (2011) N. Tombros, A. Veligura, J. Junesch, J. Jasper van den Berg, P. J. Zomer, M. Wojtaszek, I. J. Vera Marun, H. T. Jonkman, and B. J. van Wees, J. Appl. Phys. 109, 093702 (2011).
- Huang et al. (2015) Y. Huang, E. Sutter, N. N. Shi, J. Zheng, T. Yang, D. Englund, H. J. Gao, and P. Sutter, ACS Nano 9, 10612 (2015).
- Laitinen et al. (2014) A. Laitinen, M. Oksanen, A. Fay, D. Cox, M. Tomi, P. Virtanen, and P. J. Hakonen, Nano Lett. 14, 3009 (2014).
- Laitinen et al. (2016) A. Laitinen, G. S. Paraoanu, M. Oksanen, M. F. Craciun, S. Russo, E. Sonin, and P. Hakonen, Physical Review B 93, 1 (2016).
- Gouttenoire et al. (2010) V. Gouttenoire, T. Barois, S.-M. Perisanu, J. L. Leclercq, S. T. Purcell, P. Vincent, and A. Ayari, Small 6, 1060 (2010).
- Manninen et al. (2018) J. Manninen, A. Laitinen, F. Massel, M. Haque, A. Isacsson, and P. J. Hakonen, to be submitted (2018).
- Blaauwgeers et al. (2007) R. Blaauwgeers, M. Blazkova, M. Človečko, V. B. Eltsov, R. de Graaf, J. Hosio, M. Krusius, D. Schmoranzer, W. Schoepe, L. Skrbek, P. Skyba, R. E. Solntsev, and D. E. Zmeev, J. Low Temp. Phys. 146, 537 (2007).
- Piché et al. (1974) L. Piché, R. Maynard, S. Hunklinger, and J. Jäckle, Phys. Rev. Lett. 32, 1426 (1974).
- Tilley and Tilley (1990) D. R. Tilley and J. Tilley, Superfluidity and superconductivity (Hilger, 1990) p. 470.
- Von Haumeder et al. (1980) M. Von Haumeder, U. Strom, and S. Hunklinger, Phys. Rev. Lett. 44, 84 (1980).
- Anderson et al. (1972) P. W. Anderson, B. I. Halperin, and C. M. Varma, Philos. Mag. 25, 1 (1972).
- Phillips (1972) W. A. Phillips, J. Low Temp. Phys. 7, 351 (1972).
- Duquesne and Bellessa (1983) J. Y. Duquesne and G. Bellessa, J. Phys. C Solid State Phys. 16, 65 (1983).
- Du et al. (1996) J. Du, G. L. Harding, J. A. Ogilvy, P. R. Dencher, and M. Lake, Sensors Actuators, A Phys. 56, 211 (1996).
- Federle and Hunklinger (1982) G. Federle and S. Hunklinger, Le J. Phys. Colloq. 43, C9 (1982).
- Hunklinger (1998) S. Hunklinger, Physica A 261, 26 (1998).
- Tate et al. (1979) A. Tate, S. Tamura, and T. Sakura, Solid State Commun. 30, 517 (1979).
- Note (1) Because of the high quality of our SiO2 layer and that the thickness of SiO2 is clearly less than that of LOR 3A, we neglect the influence of the SiO2 layer in our analysis, although SiO2 fulfills the speed condition for guiding a shear wave on top of silicon Du and Harding (1998).
- Venkatesan et al. (2010) A. Venkatesan, K. J. Lulla, M. J. Patton, A. D. Armour, C. J. Mellor, and J. R. Owers-Bradley, Phys. Rev. B 81, 073410 (2010).
- Luco and Westmann (1972) J. E. Luco and R. A. Westmann, Journal of Applied Mechanics 39, 527 (1972).
- Thalmeier et al. (2010) P. Thalmeier, B. Dóra, and K. Ziegler, Phys. Rev. B 81, 041409 (2010).
- Pohl et al. (2002) R. O. Pohl, X. Liu, and E. Thompson, Rev. Mod. Phys. 74, 991 (2002).
- Du and Harding (1998) J. Du and G. L. Harding, Sensors and Actuators A: Physical 65, 152 (1998).