Laser cooling of a nanomechanical oscillator to the zero-point energy
Abstract
Optomechanical cavities in the well-resolved-sideband regime are ideally suited for the study of a myriad of quantum phenomena with mechanical systems, including backaction-evading measurements, mechanical squeezing, and generation of non-classical states. For these experiments, the mechanical oscillator should be prepared in its ground state; residual motion beyond the zero-point motion must be negligible. The requisite cooling of the mechanical motion can be achieved using the radiation pressure of light in the cavity by selectively driving the anti-Stokes optomechanical transition. To date, however, laser-absorption heating of optical systems far into the resolved-sideband regime has prohibited strong driving. For deep ground-state cooling, previous studies have therefore resorted to passive cooling in dilution refrigerators. Here, we employ a highly sideband-resolved silicon optomechanical crystal in a 3He buffer gas environment at to demonstrate laser sideband cooling to a mean thermal occupancy of quantum (self-calibrated using motional sideband asymmetry), which is of the oscillator’s zero-point energy and corresponds to 92% ground state probability. Achieving such low occupancy by laser cooling opens the door to a wide range of quantum-optomechanical experiments in the optical domain.
Laser cooling techniques developed several decades ago Chu (1998); Cohen-Tannoudji (1998); Wieman et al. (1999); Kippenberg and Vahala (2008) have revolutionized many areas of science and technology, with systems ranging from atoms, ions and molecules Ashkin (1978); Wineland and Itano (1979); Shuman et al. (2010); Anderegg et al. (2018); Ospelkaus et al. (2011); Monroe and Kim (2013); Blatt and Roos (2012) to solid-state structures and macroscopic objects Schliesser et al. (2006); Li et al. (2011); LIGO Scientific Collaboration (2009). Among these systems, mechanical oscillators play a unique role given their macroscopic nature and their ability to couple to diverse physical quantities Aspelmeyer et al. (2014). Laser cooling of mechanical systems occurs via coupling of mechanical and electromagnetic degrees of freedom (optomechanical coupling) and has been demonstrated with a wide range of structures Wilson-Rae et al. (2007); Marquardt et al. (2007); Schliesser et al. (2006, 2008); Chan et al. (2011); Teufel et al. (2011); Verhagen et al. (2012); Wilson et al. (2015); Peterson et al. (2016); Clark et al. (2017); Rossi et al. (2018). It has led to the observation of radiation pressure shot noise Purdy et al. (2013a), ponderomotive squeezing of light Safavi-Naeini et al. (2013a); Purdy et al. (2013b), and motional sideband asymmetry Wilson-Rae et al. (2007); Safavi-Naeini et al. (2012); Weinstein et al. (2014); Sudhir et al. (2017); Qiu et al. (2019).
Many optomechanical protocols, including mechanical squeezing Kronwald et al. (2013); Lecocq et al. (2015); Wollman et al. (2015); Pirkkalainen et al. (2015), entanglement Ockeloen-Korppi et al. (2018), state swaps Palomaki et al. (2013a), generation of non-classical states Riedinger et al. (2016); Hong et al. (2017); Marinković et al. (2018); Shomroni et al. (2019a), and back-action evading (BAE) measurements below the standard quantum limit (SQL) Clerk et al. (2008); Suh et al. (2014); Shomroni et al. (2019b), require ground state preparation of a well-sideband-resolved system, where Stokes and anti-Stokes motional transitions can be driven selectively. In this case, driving of anti-Stokes transitions can be efficiently applied to damp the motion and sideband cool the system. The cooling limit is set by laser noise (classical or quantum) or by technical limitations, such as absorption heating, and determines the residual thermal noise. For the case of squeezing or BAE measurements, the amount of cooling beyond half quantum (equivalent to the zero point energy) determines the amount of squeezing or the amount to which the SQL on resonance is surpassed. Such deep ground-state preparation has been demonstrated in microwave optomechanical systems Teufel et al. (2011). In the optical domain, however, cooling below half quantum has so far only been achieved in systems with low sideband resolution, i.e. in the bad-cavity limit Peterson et al. (2016) or using feedback cooling Rossi et al. (2018).
Silicon optomechanical crystals (OMCs) Eichenfield et al. (2009); Chan et al. (2012) that couple an optical mode at telecommunication wavelengths and a co-localized mechanical mode at GHz frequencies exhibit several exceptional features, including large vacuum coupling rates Chan et al. (2012) as well as ultralong phonon lifetime MacCabe et al. (2019). They have been employed in a wide range of experiments, such as continuous quantum measurements Chan et al. (2011); Qiu et al. (2019); Shomroni et al. (2019b), and probabilistic preparation of quantum states Riedinger et al. (2016); Hong et al. (2017); Marinković et al. (2018). The compatibility of these systems with planar nanofabrication technology and their scalability have motivated studies of optomechanical topological phenomena Schmidt et al. (2015); Brendel et al. (2017), frequency conversion Fang et al. (2016) and coupling to superconducting qubits Keller et al. (2017); Arrangoiz-Arriola et al. (2018). Yet despite these promising features, ground-state preparation of silicon OMCs has only been possible via passive cooling to milli-Kelvin temperatures in dilution refrigerators Meenehan et al. (2014, 2015). Significant heating due to optical absorption—a consequence of the extremely small optical mode volume and inefficient thermalization Holland (1963)—has limited experiments to use of weak laser pulses Riedinger et al. (2016); Hong et al. (2017); Marinković et al. (2018); MacCabe et al. (2019) and precluded continuous measurements Meenehan et al. (2014); Qiu et al. (2019); Shomroni et al. (2019b).
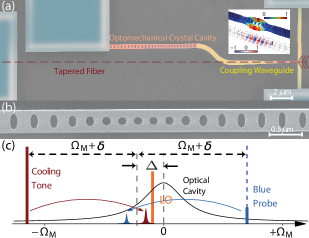
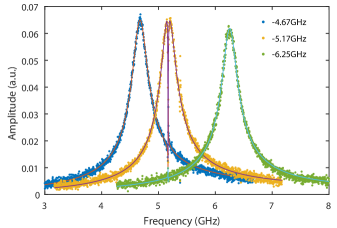
In this work, we demonstrate laser cooling of a strongly sideband-resolved silicon OMC to the zero-point energy, with residual mean phonon occupancy of (i.e. of the zero-point energy). The measurement is self-calibrated using motional sideband asymmetry Wilson-Rae et al. (2007); Weinstein et al. (2014); Qiu et al. (2019); Purdy et al. (2015); Underwood et al. (2015). Our experimental system, shown in Fig. 1(a,b), consists of a quasi-one-dimensional silicon optomechanical crystal Chan et al. (2012); Qiu et al. (2019); Shomroni et al. (2019b). The OMC is mounted in a 3He cryostat (Oxford Instruments HelioxTL) operated at and a buffer-gas pressure of , which ensures efficient thermalization of the device Qiu et al. (2019); Shomroni et al. (2019b). A tapered optical fiber is used to couple light evanescently into the coupling waveguide (40% efficiency in this work). For characterization, we monitor the laser light reflected from the single-sided optical cavity. The optical resonance is at with a total linewidth of , of which the external coupling rate is . The optical mode is coupled to a localized mechanical mode with frequency and an intrinsic damping rate of . The measured vacuum optomechanical coupling rate is . The buffer-gas causes additional damping, increasing the mechanical linewidth to sup .
Motional sideband asymmetry, a signature of the quantum nature of the optomechanical interaction, was recently observed in various optomechanical systems Safavi-Naeini et al. (2012); Weinstein et al. (2014); Sudhir et al. (2017) and used to perform self-calibrated thermometry of the mechanical oscillator close to its ground state Purdy et al. (2015); Underwood et al. (2015); Qiu et al. (2019). In our experiments, we adopt a two-tone pumping scheme [Fig. 1(c)], where a strong cooling tone near the lower motional sideband is applied for sideband cooling, while an additional weaker ‘blue probe’ is applied near the upper motional sideband. By measuring the resonantly-enhanced anti-Stokes and Stokes scattered sidebands, proportional to and , respectively, the mean phonon occupancy of the oscillator can be determined. The frequencies of the two tones are separated by , and their mean is detuned from the optical resonance frequency by [Fig. 1(c)]. In the presence of the cooling tone and blue probe, the mechanical susceptibility is modified by the radiation pressure. The effective mechanical damping rate becomes , with the total optomechanical damping rate (in the resolved-sideband regime) , where
| (1) |
and and are the intracavity photon numbers of the blue probe and cooling tone, respectively. In the weak coupling regime, , the effective mechanical frequency is , with
| (2) |
The mean final phonon occupancy is given by
| (3) |
where is the mean phonon occupancy due to the thermal environment. Importantly, the second term in the numerator of Eq. (3) corresponds to quantum backaction (QBA) heating due to resonant Stokes transitions from the blue probe [Fig. 1(c)]. This is in contrast to off-resonant Stokes transitions from the cooling tone, which are completely negligible in the well-resolved sideband regime (here ) and set the quantum limit for sideband cooling Wilson-Rae et al. (2007); Marquardt et al. (2007); Peterson et al. (2016); Clark et al. (2017). In our two-tone experiments, QBA heating due to the blue probe, , is comparable to the heating by the thermal bath at high probe powers and limits the cooling sup . Thus we perform both two-tone measurements for ancillary quantum thermometry and single-tone measurements to achieve maximum cooling power.
In each measurement, we first determine the detuning of the cooling tone from the cavity, by performing a coherent cavity response measurement Safavi-Naeini et al. (2011); Shomroni et al. (2019b). We then obtain the thermomechanical noise spectrum by measuring the cavity output field using quantum-limited balanced heterodyne detection (BHD) with a strong phase-locked local oscillator (LO; ). The frequency difference between the LO and the mean frequency of the two pumping tones is , where . The measured heterodyne noise spectrum, normalized to the shot noise floor, is given by
| (4) |
where is the overall detection efficiency. The second and third terms in Eq. (4) correspond to the scattered Stokes and anti-Stokes sidebands, which we use for self-calibrated thermometry of the oscillator.
Our scheme differs from previous experiments that utilize equal red and blue probes alongside a cooling tone Weinstein et al. (2014); Qiu et al. (2019). By using only two tones, we avoid coupling between scattered sidebands due to Floquet dynamics that may introduce errors in the inferred phonon occupancy Qiu et al. (2019). We keep the ratio between the input powers of the cooling tone and the blue probe around 6, to achieve both sufficient cooling and a measurable anti-Stokes signal (). From a series of two-tone measurements, we obtain a mean calibration coefficient between the normalized thermomechanical sideband area and the phonon occupancy using Eq. (4), where is the area of the sideband from the cooling tone sup . The calibration coefficient serves as an ancillary quantum thermometer for the mechanical mode, independent of the resistive thermometer mounted in the cryostat. For ground state cooling, we turn off the blue probe and perform single-tone sideband cooling measurements, keeping the same experimental conditions and calibration. From the measured thermomechanical noise spectrum, we can thus obtain the final occupancy using two independent calibrations, i.e., the ancillary quantum thermometry and the mechanical noise thermometry, where for the latter the mechanical mode temperature is referenced to the cryostat thermometer sup .
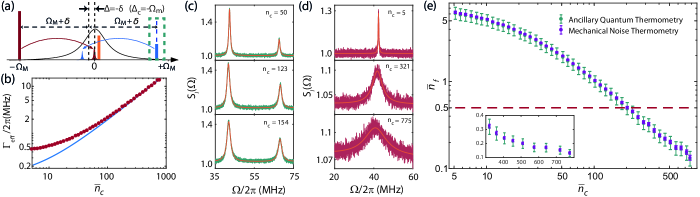
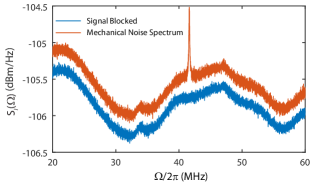
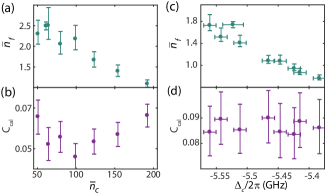
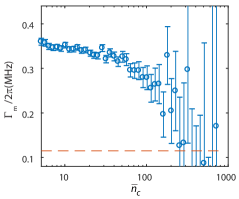
In a first set of measurements shown in Fig. 2, we vary the power of the pump tones while keeping fixed for optimal sideband cooling. A blue probe, as indicated in the dashed green box in Fig. 2(a), is utilized only for ancillary sideband asymmetry measurements. Figure 2(b) shows the effective mechanical linewidth as a function of the cooling-tone intracavity photon number , obtained from the noise spectra in the single-tone experiments (red full circles) with a theoretical plot (blue curve) assuming a mechanical linewidth and vacuum coupling rate . As shown in Fig. 2(b), deviates from the theoretical value for low intracavity photon numbers. We attribute this to condensed 3He on the surface of OMC, which degrades the mechanical linewidth at low powers but may improve the thermalization sup . Figure 2(c) and (d) show a series of noise spectra from the two-tone and single-tone measurements, respectively, at various values of along with Lorentzian fits. The noise spectra are normalized to the shot noise floor, obtained by blocking the signal beam in the BHD. The left and right thermomechanical sidebands shown in Fig. 2(c) are due to the cooling tone and the blue probe, respectively. We choose a series of pumping powers that ensures both sufficient laser cooling and measurable, non-overlapping Stokes and anti-Stokes sidebands Weinstein et al. (2014). As the power increases, the ratio of the areas of the red and blue sidebands, given by [cf. Eq. (4)], decreases as the mechanical oscillator approaches the ground state (), as shown in Fig. 2(c). We thus obtain an averaged calibration coefficient between the normalized thermomechanical sideband area and the final occupancy from a series of ancillary quantum thermometry measurements sup . At high pumping powers, we observe an increase in the noise floor, as evident in the middle and bottom panels in Fig. 2(d). This originates from beating of the high signal power with excess noise of the LO around sup . Figure 2(e) shows the inferred mean phonon occupancy vs. from the single-tone measurements, calibrated using two independent methods. The green circles show the phonon occupancy calibrated using the ancillary sideband asymmetry measurements. The purple open circles show the calibration using the cryostat thermometer by anchoring the lowest value of at . This calibration requires knowledge of , which is estimated by subtracting the calculated value of at this power from the measured , to yield . We note that is unnecessary using ancillary quantum thermometry, making it an ideal independent quantum thermometer, as opposed to conventional mechanical noise thermometry. More details on the two different calibrations of are given in the Supplemental Material sup . The two methods show excellent agreement. The minimum phonon occupancy achieved in this power-sweep experiment is (88% ground-state occupancy) and is reached at a cooling-tone intracavity photon number of .
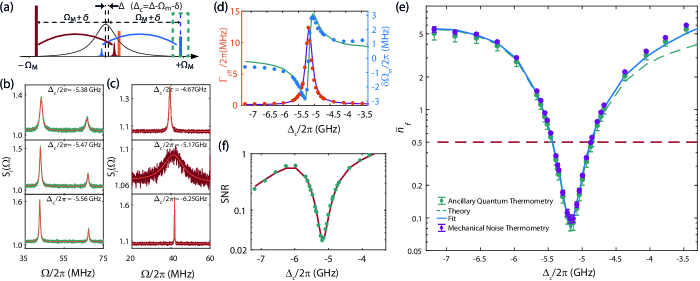
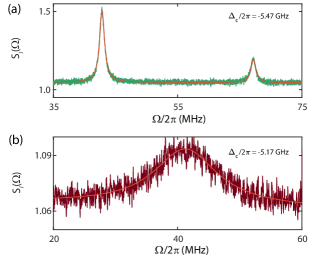
In a second set of measurements, we vary the detuning of the cooling tone with respect to the cavity resonance, keeping the frequency separation of the blue probe in the ancillary measurement and that of the LO fixed at and , respectively [Fig. 3(a)]. Figure 3(b) and (c) each show a series of measured noise spectra normalized to the shot noise floor at various values of , together with Lorentzian fits, from the two-tone and single-tone measurements. In the ancillary two-tone measurements, the input powers of the cooling tone and blue probe are and respectively, with a series of values of to ensure sufficient laser cooling and measurable, non-overlapping Stokes and anti-Stokes sidebands. To infer via sideband thermometry, the detuning-dependent intracavity photon number and optical susceptibility for the two scattered sidebands must be taken into consideration. We obtain a mean calibration coefficient between the normalized thermomechanical sideband area and the final occupancy from the sideband asymmetry measurements. For single-tone measurements, the cooling tone input power is . Figure 3(d) shows the effective mechanical linewidth (red circles) and the optical spring effect (blue circles) obtained from a Lorentzian fit to the noise spectrum, with excellent agreement with the respective theoretical curves. We note that, due to the presence of high input power throughout the measurement, the mechanical linewidth degradation observed at low powers in the previous measurement [Fig. 2(b)] is absent. Figure 3(e) shows vs. , where is calibrated from the thermomechanical sideband area from the single-tone sideband cooling measurements. Green circles are determined using the mean calibration factor obtained from sideband asymmetry measurements. The theoretical dependence calculated from experimental parameters (3) is shown as a green dashed curve for comparison. The theory curve is in excellent agreement with the data except in the region where the cooling tone approaches the cavity resonance, indicating residual optical heating Meenehan et al. (2014); Qiu et al. (2019). We fit the phonon occupancy with a model incorporating heating [blue curve in Fig. 3(e)] that is both linear and quadratic in the number of intracavity photons sup . The fit indicates that the excess optical heating in our measurements has primarily a quadratic dependence, resulting in an increase in of ; the linear coefficient is negligible. This is different from previous experiments with large optical decay rate, where linear absorption heating dominates Qiu et al. (2019). The quadratic dependence is suggestive of two-photon-absorption Barclay et al. (2005); Pernice et al. (2011). We note that in any case such optical heating cannot come from excess laser noise Rabl et al. (2009); Jayich et al. (2012); Safavi-Naeini et al. (2013b); Kippenberg et al. (2013), for which the heating rate peaks at . For the noise thermometry, we anchor the calibration to , at farthest detuning of . The resulting data are shown as purple full circles in Fig. 3(e). For with , the estimated increase in due to quadratic heating is , which is negligible compared to the bare thermal bath occupation of 8.2 phonons. This indicates that the mechanical oscillator is well-thermalized despite the high pumping power. The minimum phonon occupancy, occurring close to the red mechanical sideband (), is , which is of the zero-point energy. This places the mechanical oscillator at 92% ground state occupation. In Fig. 3(f), the signal-to-noise ratio vs. for the thermomechanical noise spectrum is shown with a fit sup that includes the quadratic heating model in addition to the standard sideband cooling theory. The fit yields an overall detection efficiency .
In conclusion, we have demonstrated high-fidelity sideband cooling to the zero-point energy of a localized GHz mechanical mode of a silicon OMC. The residual mean phonon occupancy is (92% ground state occupation). The system possess a unique blend of advantageous properties, combining high mechanical frequency, large sideband resolution, negligible optical-absorption heating and the ability to be prepared in the ground state in the presence of strong probing. These characteristics enable a large number of quantum optomechanical experiments that have remained elusive in the optical domain, including two-tone backaction-evading measurements reaching sub-SQL sensitivity Suh et al. (2014); Shomroni et al. (2019b, c), squeezed mechanical states Kronwald et al. (2013); Wollman et al. (2015); Lecocq et al. (2015); Pirkkalainen et al. (2015); Lei et al. (2016), low-added-noise optomechanical transducers Fang et al. (2016); Peterson et al. (2017); Bernier et al. (2017), as well as quantum-coherent operations such as state swapping Palomaki et al. (2013a) and entanglement generation Ockeloen-Korppi et al. (2018); Palomaki et al. (2013b).
Acknowledgements.
This work is supported by the European Union’s Horizon 2020 research and innovation programme under grant No. 732894 (FET Proactive HOT). Samples were fabricated in the Binnig and Rohrer Nanotechnology Center at IBM Research–Zurich and at the Center of MicroNanoTechnology (CMi) at EPFL.Data Availability Statement
All data and analysis files will be made available via zenodo.org upon publication.
References
- Chu (1998) S. Chu, Reviews of Modern Physics 70, 685 (1998).
- Cohen-Tannoudji (1998) C. N. Cohen-Tannoudji, Reviews of Modern Physics 70, 707 (1998).
- Wieman et al. (1999) C. E. Wieman, D. E. Pritchard, and D. J. Wineland, Reviews of Modern Physics 71, S253 (1999).
- Kippenberg and Vahala (2008) T. J. Kippenberg and K. J. Vahala, Science 321, 1172 (2008), arXiv:0712.1618 .
- Ashkin (1978) A. Ashkin, Physical Review Letters 40, 729 (1978).
- Wineland and Itano (1979) D. J. Wineland and W. M. Itano, Physical Review A 20, 1521 (1979), arXiv:arXiv:1011.1669v3 .
- Shuman et al. (2010) E. S. Shuman, J. F. Barry, and D. Demille, Nature 467, 820 (2010), arXiv:1103.6004 .
- Anderegg et al. (2018) L. Anderegg, B. L. Augenbraun, Y. Bao, S. Burchesky, L. W. Cheuk, W. Ketterle, and J. M. Doyle, Nature Physics 14, 890 (2018), arXiv:1803.04571 .
- Ospelkaus et al. (2011) C. Ospelkaus, U. Warring, Y. Colombe, K. R. Brown, J. M. Amini, D. Leibfried, and D. J. Wineland, Nature 476, 181 (2011), arXiv:1104.3573 .
- Monroe and Kim (2013) C. Monroe and J. Kim, Science 339, 1164 (2013), arXiv:0402594v3 [arXiv:cond-mat] .
- Blatt and Roos (2012) R. Blatt and C. F. Roos, Nature Physics 8, 277 (2012), arXiv:0905.0118 .
- Schliesser et al. (2006) A. Schliesser, P. Del’Haye, N. Nooshi, K. J. Vahala, and T. J. Kippenberg, Physical Review Letters 97, 243905 (2006), arXiv:0611235 [physics] .
- Li et al. (2011) T. Li, S. Kheifets, and M. G. Raizen, Nature Physics 7, 527 (2011), arXiv:1101.1283 .
- LIGO Scientific Collaboration (2009) LIGO Scientific Collaboration, New Journal of Physics 11, 73032 (2009).
- Aspelmeyer et al. (2014) M. Aspelmeyer, T. J. Kippenberg, and F. Marquardt, Reviews of Modern Physics 86, 1391 (2014), arXiv:1303.0733 .
- Wilson-Rae et al. (2007) I. Wilson-Rae, N. Nooshi, W. Zwerger, and T. J. Kippenberg, Physical Review Letters 99, 093901 (2007), arXiv:0702113 [cond-mat] .
- Marquardt et al. (2007) F. Marquardt, J. P. Chen, A. A. Clerk, and S. M. Girvin, Physical Review Letters 99, 093902 (2007), arXiv:0701416 [cond-mat] .
- Schliesser et al. (2008) A. Schliesser, R. Rivière, G. Anetsberger, O. Arcizet, and T. J. Kippenberg, Nature Physics 4, 415 (2008), arXiv:0709.4036 .
- Chan et al. (2011) J. Chan, T. P. Alegre, A. H. Safavi-Naeini, J. T. Hill, A. Krause, S. Gröblacher, M. Aspelmeyer, and O. Painter, Nature 478, 89 (2011), arXiv:1106.3614 .
- Teufel et al. (2011) J. D. Teufel, T. Donner, D. Li, J. W. Harlow, M. S. Allman, K. Cicak, A. J. Sirois, J. D. Whittaker, K. W. Lehnert, and R. W. Simmonds, Nature 475, 359 (2011), arXiv:1103.2144 .
- Verhagen et al. (2012) E. Verhagen, S. Deléglise, S. Weis, A. Schliesser, and T. J. Kippenberg, Nature 482, 63 (2012), arXiv:1107.3761 .
- Wilson et al. (2015) D. J. Wilson, V. Sudhir, N. Piro, R. Schilling, A. Ghadimi, and T. J. Kippenberg, Nature 524, 325 (2015), arXiv:1410.6191 .
- Peterson et al. (2016) R. W. Peterson, T. P. Purdy, N. S. Kampel, R. W. Andrews, P. L. Yu, K. W. Lehnert, and C. A. Regal, Physical Review Letters 116, 063601 (2016), arXiv:1510.03911 .
- Clark et al. (2017) J. B. Clark, F. Lecocq, R. W. Simmonds, J. Aumentado, and J. D. Teufel, Nature 541, 191 (2017), arXiv:1606.08795 .
- Rossi et al. (2018) M. Rossi, D. Mason, J. Chen, Y. Tsaturyan, and A. Schliesser, Nature 563, 53 (2018), arXiv:1805.05087 .
- Purdy et al. (2013a) T. P. Purdy, R. W. Peterson, and C. A. Regal, Science 339, 801 (2013a), arXiv:1209.6334 .
- Safavi-Naeini et al. (2013a) A. H. Safavi-Naeini, S. Gröblacher, J. T. Hill, J. Chan, M. Aspelmeyer, and O. Painter, Nature 500, 185 (2013a), arXiv:1302.6179 .
- Purdy et al. (2013b) T. P. Purdy, P.-L. Yu, R. W. Peterson, N. S. Kampel, and C. A. Regal, Physical Review X 3, 031012 (2013b), arXiv:1306.1268 .
- Safavi-Naeini et al. (2012) A. H. Safavi-Naeini, J. Chan, J. T. Hill, T. P. M. Alegre, A. Krause, and O. Painter, Physical Review Letters 108, 033602 (2012), arXiv:1108.4680 .
- Weinstein et al. (2014) A. J. Weinstein, C. U. Lei, E. E. Wollman, J. Suh, A. Metelmann, A. A. Clerk, and K. C. Schwab, Physical Review X 4, 041003 (2014), arXiv:1404.3242 .
- Sudhir et al. (2017) V. Sudhir, D. J. Wilson, R. Schilling, H. Schütz, S. A. Fedorov, A. H. Ghadimi, A. Nunnenkamp, and T. J. Kippenberg, Physical Review X 7, 011001 (2017), arXiv:1602.05942 .
- Qiu et al. (2019) L. Qiu, I. Shomroni, M. A. Ioannou, N. Piro, D. Malz, A. Nunnenkamp, and T. J. Kippenberg, Physical Review A 100, 053852 (2019).
- Kronwald et al. (2013) A. Kronwald, F. Marquardt, and A. A. Clerk, Physical Review A 88, 063833 (2013), arXiv:1307.5309 .
- Lecocq et al. (2015) F. Lecocq, J. B. Clark, R. W. Simmonds, J. Aumentado, and J. D. Teufel, Physical Review X 5, 041037 (2015), arXiv:1509.01629 .
- Wollman et al. (2015) E. E. Wollman, C. U. Lei, A. J. Weinstein, J. Suh, A. Kronwald, F. Marquardt, A. A. Clerk, and K. C. Schwab, Science 349, 952 (2015), arXiv:1507.01662 .
- Pirkkalainen et al. (2015) J. M. Pirkkalainen, E. Damskägg, M. Brandt, F. Massel, and M. A. Sillanpää, Physical Review Letters 115, 243601 (2015), arXiv:1507.04209 .
- Ockeloen-Korppi et al. (2018) C. F. Ockeloen-Korppi, E. Damskägg, J. M. Pirkkalainen, M. Asjad, A. A. Clerk, F. Massel, M. J. Woolley, and M. A. Sillanpää, Nature 556, 478 (2018), arXiv:1711.01640 .
- Palomaki et al. (2013a) T. A. Palomaki, J. W. Harlow, J. D. Teufel, R. W. Simmonds, and K. W. Lehnert, Nature 495, 210 (2013a).
- Riedinger et al. (2016) R. Riedinger, S. Hong, R. A. Norte, J. A. Slater, J. Shang, A. G. Krause, V. Anant, M. Aspelmeyer, and S. Gröblacher, Nature 530, 313 (2016), arXiv:1512.05360 .
- Hong et al. (2017) S. Hong, R. Riedinger, I. Marinković, A. Wallucks, S. G. Hofer, R. A. Norte, M. Aspelmeyer, and S. Gröblacher, Science 358, 203 (2017), arXiv:1706.03777 .
- Marinković et al. (2018) I. Marinković, A. Wallucks, R. Riedinger, S. Hong, M. Aspelmeyer, and S. Gröblacher, Phys. Rev. Lett. 121, 220404 (2018).
- Shomroni et al. (2019a) I. Shomroni, L. Qiu, and T. J. Kippenberg, arXiv:1909.10624 [quant-ph] (2019a), arXiv: 1909.10624.
- Clerk et al. (2008) A. A. Clerk, F. Marquardt, and K. Jacobs, New Journal of Physics 10, 095010 (2008).
- Suh et al. (2014) J. Suh, A. J. Weinstein, C. U. Lei, E. E. Wollman, S. K. Steinke, P. Meystre, A. A. Clerk, and K. C. Schwab, Science 344, 1262 (2014).
- Shomroni et al. (2019b) I. Shomroni, L. Qiu, D. Malz, A. Nunnenkamp, and T. J. Kippenberg, Nature Communications 10, 2086 (2019b).
- Eichenfield et al. (2009) M. Eichenfield, J. Chan, R. M. Camacho, K. J. Vahala, and O. Painter, Nature 462, 78 (2009), arXiv:0906.1236 .
- Chan et al. (2012) J. Chan, A. H. Safavi-Naeini, J. T. Hill, S. Meenehan, and O. Painter, Applied Physics Letters 101, 081115 (2012), arXiv:1206.2099 .
- MacCabe et al. (2019) G. S. MacCabe, H. Ren, J. Luo, J. D. Cohen, H. Zhou, A. Sipahigil, M. Mirhosseini, and O. Painter, arXiv:1901.04129 [cond-mat, physics:quant-ph] (2019), arXiv: 1901.04129.
- Schmidt et al. (2015) M. Schmidt, S. Kessler, V. Peano, O. Painter, and F. Marquardt, Optica 2, 635 (2015).
- Brendel et al. (2017) C. Brendel, V. Peano, O. J. Painter, and F. Marquardt, Proceedings of the National Academy of Sciences 114, 3390 (2017).
- Fang et al. (2016) K. Fang, M. H. Matheny, X. Luan, and O. Painter, Nature Photonics 10, 489 (2016), arXiv:1508.05138 .
- Keller et al. (2017) A. J. Keller, P. B. Dieterle, M. Fang, B. Berger, J. M. Fink, and O. Painter, Applied Physics Letters 111, 042603 (2017), arXiv:1703.10195 .
- Arrangoiz-Arriola et al. (2018) P. Arrangoiz-Arriola, E. A. Wollack, M. Pechal, J. D. Witmer, J. T. Hill, and A. H. Safavi-Naeini, Physical Review X 8, 031007 (2018), arXiv:1804.03625 .
- Meenehan et al. (2014) S. M. Meenehan, J. D. Cohen, S. Gröblacher, J. T. Hill, A. H. Safavi-Naeini, M. Aspelmeyer, and O. Painter, Physical Review A 90, 011803 (2014), arXiv:1403.3703 .
- Meenehan et al. (2015) S. M. Meenehan, J. D. Cohen, G. S. MacCabe, F. Marsili, M. D. Shaw, and O. Painter, Physical Review X 5, 041002 (2015), arXiv:1503.05135 .
- Holland (1963) M. G. Holland, Physical Review 132, 2461 (1963).
- Purdy et al. (2015) T. P. Purdy, P.-L. Yu, N. S. Kampel, R. W. Peterson, K. Cicak, R. W. Simmonds, and C. A. Regal, Physical Review A 92, 031802 (2015), arXiv:arXiv:1406.7247v1 .
- Underwood et al. (2015) M. Underwood, D. Mason, D. Lee, H. Xu, L. Jiang, A. B. Shkarin, K. Børkje, S. M. Girvin, and J. G. E. Harris, Physical Review A 92, 061801 (2015), arXiv:1406.7254 .
- (59) See Supplemental Material.
- Safavi-Naeini et al. (2011) A. H. Safavi-Naeini, T. P. Alegre, J. Chan, M. Eichenfield, M. Winger, Q. Lin, J. T. Hill, D. E. Chang, and O. Painter, Nature 472, 69 (2011), arXiv:1012.1934 .
- Barclay et al. (2005) P. E. Barclay, K. Srinivasan, and O. Painter, , 20 (2005).
- Pernice et al. (2011) W. H. P. Pernice, C. Schuck, M. Li, and H. X. Tang, Optics Express 19, 3290 (2011).
- Rabl et al. (2009) P. Rabl, C. Genes, K. Hammerer, and M. Aspelmeyer, Phys. Rev. A 80, 063819 (2009).
- Jayich et al. (2012) A. M. Jayich, J. C. Sankey, K. Børkje, D. Lee, C. Yang, M. Underwood, L. Childress, A. Petrenko, S. M. Girvin, and J. G. E. Harris, New Journal of Physics 14, 115018 (2012).
- Safavi-Naeini et al. (2013b) A. H. Safavi-Naeini, J. Chan, J. T. Hill, S. Gröblacher, H. Miao, Y. Chen, M. Aspelmeyer, and O. Painter, New Journal of Physics 15, 035007 (2013b).
- Kippenberg et al. (2013) T. J. Kippenberg, A. Schliesser, and M. L. Gorodetsky, New Journal of Physics 15, 015019 (2013).
- Shomroni et al. (2019c) I. Shomroni, A. Youssefi, N. Sauerwein, L. Qiu, P. Seidler, D. Malz, A. Nunnenkamp, and T. J. Kippenberg, Physical Review X 9, 041022 (2019c).
- Lei et al. (2016) C. Lei, A. Weinstein, J. Suh, E. Wollman, A. Kronwald, F. Marquardt, A. Clerk, and K. Schwab, Physical Review Letters 117, 100801 (2016).
- Peterson et al. (2017) G. A. Peterson, F. Lecocq, K. Cicak, R. W. Simmonds, J. Aumentado, and J. D. Teufel, Physical Review X 7, 031001 (2017), arXiv:1703.05269 .
- Bernier et al. (2017) N. R. Bernier, L. D. Tóth, A. Koottandavida, M. A. Ioannou, D. Malz, A. Nunnenkamp, A. K. Feofanov, and T. J. Kippenberg, Nature Communications 8, 604 (2017).
- Palomaki et al. (2013b) T. A. Palomaki, J. D. Teufel, R. W. Simmonds, and K. W. Lehnert, Science 342, 710 (2013b).
- Weinstein (2016) A. J. Weinstein, Quantum Electromechanics with Two Tone Drive, phd, California Institute of Technology (2016).
- Weis et al. (2010) S. Weis, R. Rivière, S. Deléglise, E. Gavartin, O. Arcizet, A. Schliesser, and T. J. Kippenberg, Science 330, 1520 (2010), arXiv:1007.0565 .
- Børkje (2016) K. Børkje, Physical Review A 94, 043816 (2016).
Supplemental Material
Liu Qiu,1,∗ Itay Shomroni,1,∗ Paul Seidler,2,† and Tobias J. Kippenberg1,‡
1Institute of Physics, École Polytechnique Fédérale de Lausanne, Lausanne CH-1015, Switzerland
2IBM Research – Zurich, Säumerstrasse 4, CH-8803 Rüschlikon, Switzerland
†Electronic address: pfs@zurich.ibm.com
‡Electronic address: tobias.kippenberg@epfl.ch
()
I Theory
In the sideband asymmetry experiments, we pump the optomechanical system with two tones, one close to the red motional sideband and the other close to the blue motional sideband of the cavity. The amplitude of the input field takes the form , where and are the amplitude and frequency of the cooling tone (blue probe), and corresponds to the input noise. The two tones are separated by , and the mean of their frequencies is detuned from the cavity resonance by , as shown in Fig. 1 in the main text. The mechanical mode is coupled to the optical field through radiation pressure and is additionally coupled to a thermal reservoir. By linearizing the intracavity optical field and the mechanical displacement , we obtain the quantum Langevin equations for the fluctuation of the intracavity fields in the frame rotating at the mean of the frequencies of the blue probe and the cooling tone Aspelmeyer et al. (2014); Weinstein et al. (2014); Wollman et al. (2015). Within the rotating-wave approximation,
| (S1) |
where and , is the intracavity photon number due to the blue probe (cooling tone) and is the vacuum optomechanical coupling rate. , , and are the total, intrinsic and external optical loss rates of the optical mode, is the mechanical damping rate, and , , and correspond to the optical input noise, optical vacuum noise and the mechanical noise. The optical and mechanical noise operators satisfy the following noise correlations,
| (S2) |
where is the mean phonon occupation of the mechanical oscillator in equilibrium with the thermal reservoir at temperature . Here describes the fluctuation in the optical field while describes the zero-point fluctuation in the mechanical motion. In general, (for a quantum limited laser) and equal to one.
Here we define the optical and mechanical susceptibility as
Solving Eq. (S1) in the Fourier domain, we thus obtain
| (S3) |
where
| (S4) |
and
| (S5) | |||
| (S6) | |||
| (S7) |
The mechanical susceptibility, which is modified by the radiation pressure from the two tones, is defined as
| (S8) |
During our measurements, the ratio of cooling-tone to blue-probe pumping powers is fixed around 6. In the weak-coupling regime (), the effective damping rate of the mechanical oscillator becomes , where the optomechancial damping rate (in the resolved-sideband limit) is , and and take the form
| (S9) |
The optical spring effect is given by
| (S10) |
From the Wiener-Khinchin theorem, the two-sided mechanical displacement noise spectrum is calculated in the lab frame as
| (S11) |
The final mechanical occupation, in the sideband resolved limit, is given by
| (S12) |
In the two-tone pumping scheme, the quantum backaction (QBA) from the blue probe can become dominant even when there is no heating due to optical absorption, as is evident from the second term in the numerator of Eq. (S12).
When coupled to both the optical and thermal reservoirs, the zero point fluctuation of the dressed mechanical mode becomes Weinstein (2016)
| (S13) |
For (i.e. a quantum limited laser field) and , we see that also .
We note that Eq. (S12) is formulated using the rotating-wave approximation, where the QBA from the cooling tone is neglected Wilson-Rae et al. (2007); Marquardt et al. (2007); Clark et al. (2017), as the system is deep in the resolved-sideband regime. In the following, we explain this conclusion using a Raman-scattering picture that addresses QBA from both the cooling tone and the blue probe Marquardt et al. (2007). Without the mechanical damping, the mean phonon occupancy of the optomechanical crystal cavity is given by the detailed balance expression
| (S14) |
where and correspond to the anti-Stokes and Stokes scattering rate, respectively, of the blue probe (cooling tone). Now, and [Eq. (S9)], whereas and take the form
| (S15) |
The imbalanced Stokes and anti-Stokes scattering from both the cooling tone and the blue probe leads to a net optomechanical damping of the mechanical oscillator . The minimum phonon occupancy is therefore given by
| (S16) |
The stochastic QBA force from both tones produces a residual phonon occupancy of the optomechanical crystal cavity. In the deep-resolved-sideband regime (), such that , the QBA from the cooling tone is negligible. After including the mechanical damping , takes the form in Eq. (S12), where the QBA from only the blue probe is considered.
Adopting the standard input-output formalism, we can obtain the output optical field . To achieve a quantum-limited measurement of the output field, we use balanced heterodyne detection, beating the reflected optical signal with a strong local oscillator. The frequency difference between the local oscillator and the mean frequency of the two pumping tones is , where . The measured single-sided heterodyne noise spectrum corresponds to the symmetrized autocorrelator of the photocurrent, , and, when normalized to the shot noise, is given by
| (S17) |
where is the overall detection efficiency. In (S17), the first term corresponds to the shot noise, whereas the second and third terms correspond to the thermomechanical sidebands of the blue probe and cooling tone.
We use Eq. (S17) to determine the phonon occupancy from the asymmetry of the motional sidebands, considering the detuning dependent scattering rate, Eq. (S9). We then obtain a calibration coefficient between the normalized thermomechanical sideband area () and the phonon occupancy, where is the sideband area under the Lorentzian noise spectrum.
To achieve high fidelity ground state preparation, we employ only the cooling tone to avoid the QBA heating from the blue probe. The final occupancy of the mechanical oscillator is , where . When the optical absorption heating is present, the final occupancy becomes
| (S18) |
Here we assume optical absorption heating both linear and quadratic in with coefficients and respectively. The signal to noise ratio (SNR) of the mechanical sideband in the noise spectrum can be calculated,
| (S19) |
where is the vacuum optomechanical cooperativity. For optimal detuning, , and high pumping powers, , we have , which depends only on the overall detection efficiency and the final occupancy Qiu et al. (2019).
II Fabrication
Our OMCs are fabricated on a silicon-on-insulator wafer (Soitec) with a top-silicon device-layer thickness of and a buried-oxide layer thickness of . We pattern our chips by electron beam lithography using 4% hydrogen silsesquioxane (HSQ) as a negative resist. Pattern transfer into the device layer is accomplished by inductively-coupled-plasma reactive ion etching (ICP-RIE) with a mixture of HBr and O2. To permit input/output coupling with a tapered fiber, an additional photolithography step is performed followed by reactive ion etching (RIE) with a mixture of and to create a mesa structure. After resist removal, the buried oxide layer is partially removed in 10% hydrofluoric acid to create free-standing devices. Following a Piranha (a mixture of sulfuric acid and hydrogen peroxide) cleaning step to remove organic residues, the sample is finally dipped into 2% hydrofluoric acid to terminate the silicon surface with hydrogen atoms. The chip is then immediately mounted on the sample holder for characterization and loaded into the cryostat.
III Experimental System Details
The experiments are performed in a 3He buffer gas cryostat (Oxford Instruments HelioxTL) capable of reaching a base temperature of . The surrounding gaseous 3He improves the thermalization of the silicon OMC and thereby significantly diminishes the temperature increase due to optical absorption, as shown in previous optomechanical experiments Qiu et al. (2019); Shomroni et al. (2019b). The optical resonance is at with a total linewidth of , of which the external coupling rate is . The optical mode is coupled to a localized mechanical mode with frequency with an intrinsic damping rate . An independent measurement is performed at temperature of and pressure of , from which we obtain vacuum optomechanical coupling rate and broadened mechanical damping rate due to additional gas damping .
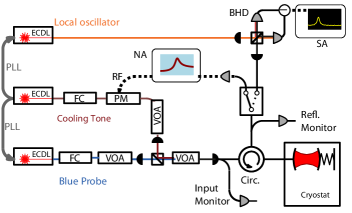
In our experiment, we work at and 3He buffer gas pressure . A schematic of the experimental setup is shown in Fig. S1. Three external cavity diode lasers (ECDLs) generate the local oscillator (Toptica CTL 1550), cooling tone (Toptica CTL 1500), and blue probe (Toptica CTL 1500). The blue probe and local oscillator (LO) are phased-locked to the cooling tone. Both cooling tone and the blue probe are filtered by a bandwidth tunable Fabry-Perot filters which are locked to the respective tones using PDH lock technique, to reject the high frequency excess laser phase noise. The cooling tone passes through a phase modulator (PM), used to generate weak sidebands as probes for coherent optomechanical spectroscopy. The cooling tone and the blue probe are combined in free-space with the same polarization and sent into a single-mode fiber that enters the cryostat. The single-pass coupling efficiency from the tapered fiber to the cavity input mirror is . A fiber-optic circulator feeds the reflected light to the detection stage, which can be toggled between two different paths. In the first path, the reflected light is sent to a fast photoreceiver connected to a network analyzer for coherent optomechanical spectroscopy, in which case the phase modulator is employed. In the second path, the reflected light is sent to a balanced heterodyne detection (BHD) setup, where it is mixed with a strong local oscillator () on balanced photodetectors. The power spectral density of the photocurrent is analyzed by a spectrum analyzer. In this case, the cooling tone is not phase modulated.
A single measurement consists of acquisition of the power spectral density for given system parameters (cooling tone power, detuning, etc.) and determination of the phonon occupancy using Eqs. (S17) and (S12), i.e. ancillary quantum thermometry and mechanical noise thermometry. This requires reliable characterizations of , , and . A measurement proceeds as follows. First, we determine the individual input and reflected powers of the cooling tone and (for two-tone measurements) blue probe by blocking each in turn. For the two-tone experiments, we nominally set the blue probe power to be a factor of 6 weaker than the cooling tone. Second, we perform coherent optomechanical spectroscopy to determine and . Third, we switch to the BHD setup and acquire the power spectral density of the photocurrent with the reflected signal sent to the BHD. We also take the shot-noise spectra for each measurement by blocking the reflected light from the BHD, to account for the LO power drift across measurements. Fourth, we record again the total input and reflected probe powers. The probe powers fluctuate by less than 1% across measurements.
IV Data Analysis
IV.1 Coherent optomechanical spectroscopy
Figure S2 shows typical coherent optomechanical spectra at several different values of for the single cooling tone measurements with same input powers as in Fig. 3(c) in the main text. The mechanical motion leads to destructive interference with the probe generated by the phase modulator, resulting in optomechanically induced transparency (OMIT) Weis et al. (2010); Safavi-Naeini et al. (2011) in the reflected cavity response. We fit the data with a theoretical model described by Ref. Safavi-Naeini et al., 2011 to extract and , which are used along with the measured powers, to determine the intracavity photon numbers.
IV.2 Calibration using sideband asymmetry
Typical incoherent noise spectra from the BHD are shown in Fig. S3. The blue curve corresponds to the shot noise and is obtained by blocking the signal beam in the BHD. We note that the uneven shot noise floor originates from the frequency dependent gain of the balanced detector. The red curve corresponds to the thermomechanical noise spectrum in the single-tone detuning-sweep measurements at . For convenience, we normalize the noise spectrum to the shot noise as shown in Fig. S4. Figure S4(a) shows the single-sided noise spectrum consisting of the scattered sidebands from two-tone sideband asymmetry measurements. Accordingly, we use a fitting function with two Lorentzian terms,
| (S20) |
where , , , , and are the fitting parameters. corresponds to the noise background. () and () correspond to the area and center frequency of the sideband from the cooling tone (blue probe), with effective linewidth . From Eq. (S17) we have and , where and are given by Eq. (S9). We can therefore determine both the phonon occupancy
| (S21) |
and the calibration coefficient
| (S22) |
which fully calibrates the measurement.
In Fig. S5, we show the ancillary quantum thermometry for both the power-sweep and detuning-sweep measurements, including the phonon occupancy and the calibration coefficient. For the power-sweep measurements as shown in Fig. S5(a) and (b), we choose series of pumping powers, which ensure both sufficient laser cooling and measurable while non-overlapping Stokes and anti-Stokes sidebands Weinstein et al. (2014). For the detuning sweep measurements as shown in Fig. S5(c),(d) we choose series of close to the red sideband to obtain sufficient laser cooling and measurable while non-overlapping Stokes and anti-Stokes sidebands. The different calibration coefficients between the power-sweep and detuning-sweep measurements are mainly due to due to the different coupling conditions of the tapered fiber. The averaged calibration coefficient along with the corresponding standard deviation is used for the ancillary quantum thermometry in the single-tone measurements.
The final occupancy can be determined from the sideband area,
| (S23) |
where and are the sideband area and the scattering rate of the cooling tone for the single-tone measurement as shown in Fig. S4(b).
IV.3 Mechanical Noise Thermometry
The occupancy can also be determined using mechanical noise thermometry by anchoring the normalized thermomechanical noise area to the cryogenic thermometer,
| (S24) |
where and are the sideband area and the scattering rate of the cooling tone at a specific anchor data point. In this case, it is assumed that the mechanical mode temperature is given by the resistive thermometer and there is no excess heating at the anchor point. The mean phonon occupancy of the mechanical oscillator is when the mechanical mode is in equilibrium with the thermal reservoir. In the case of negligible optomechanical damping (), Eq. (S24) can be simplified to .
In the power-sweep series, , we have . We note that knowledge of is required for the mechanical noise thermometry, as the additional optomechanical damping has to be considered. From independent single-tone sideband cooling measurements performed at a temperature of and pressure of , we obtain a mechanical damping rate and vacuum optomechanical coupling rate . As evident from the Fig. 2(b) in the main text, the mechanical linewidth is larger for low input powers. This is due to condensed 3He on the sample surface, as the lower temperatures in the experiment are obtained by pumping a condensed 3He reservoir. In Fig. S6, we show the inferred for different , where is calculated from the experimental values. The error bars correspond to the fitting error in . At low pumping powers, the SNR is decreased due to the broadened . To have a measurable anti-Stokes signal in the noise thermometry shown in Fig. 2, we start from intracavity photon number , with calculated based on experimental values. From the fitted effective mechanical linewidth , we estimate for . This is adopted for the mechanical noise thermometry by anchoring at with as shown in Fig. 2 in the main text. For the detuning-sweep series, is restored to the mechanical linewidth of at as shown in Fig. 3(d) at large input powers due to the residual optical heating. The mechanical noise thermometry is anchored at with . Importantly, the ancilla quantum thermometry is completely independent of and .
IV.4 Excess laser noise
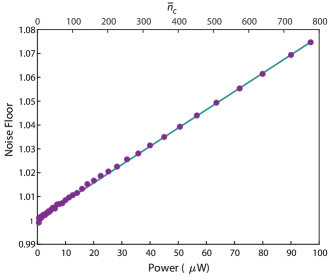
Excess laser noise is known to constrain sideband cooling and to corrupt motional sideband asymmetry measurements Rabl et al. (2009); Jayich et al. (2012); Safavi-Naeini et al. (2013b); Kippenberg et al. (2013); Børkje (2016). As shown in our previous work Qiu et al. (2019), the excess laser frequency noise spectrum density at frequency of is measured below . In all the measurements, the pumping tones (cooling tone and blue probe) pass through narrow bandwidth filter cavity locked to the respective pumping tones to reject high frequency excess phase noise. In Fig. S7, we presented the noise floor fitted from the thermomechanical noise spectra in the balanced heterodyne measurements (purple full circles), which increases linearly with the reflected power (intracavity photon number) in the single-tone power-sweep measurements (green line). In BHD, we choose a LO power of around . The beating between the highest reflected power () and vacuum noise from the LO can lead to an increased noise floor by . The noise floor increase observed in our heterodyne measurements originates from the beating between the high reflected power and excess noise of the LO around Qiu et al. (2019). This can be eliminated in principle by passing the LO through a narrow bandwidth filter cavity. However, this will introduce large insertion loss and experimental complexity, thus is not implemented in our measurements.
IV.5 Error Analysis
As noted earlier, before and after each set of measurements, both the input powers and the reflected powers of the two tones are checked, and their fluctuation is less than 1%. Besides, for each set of measurements the reflection efficiency varies less than 1%, which eliminates the power/detuning dependence for the calibration efficiency. We adopt a detuning uncertainty of for from the fitting error from the coherent optomechanical spectra in both the power-sweep and the detuning-sweep series of measurements. The detuning uncertainty is taken into consideration for the ancillary quantum thermometry and is included in the error bars of phonon occupancy calibration in addition to the Lorentzian fitting error from the noise spectrum.