Optical Spectroscopic Observations of Gamma-Ray Blazar Candidates VIII: The 2016-2017 follow up campaign carried out at SPM, NOT, KPNO and SOAR telescopes.
Abstract
The third Fermi source catalog lists 3033 -ray sources above significance. More than 30% are classified as either unidentified/unassociated Gamma-ray sources (UGSs), with about 20% classified as Blazar candidates of uncertain types (BCUs). To confirm the blazar-like nature of candidate counterparts of UGSs and BCUs, we started in 2012 an optical spectroscopic follow up campaign. We report here the spectra of 36 targets with observations from the Observatorio Astronómico Nacional San Pedro Mártir, the Southern Astrophysical Research Observatory, the Kitt Peak National Observatory and the Northern Optical Telescope, between 2016 and 2017. We confirm the BL Lac nature of 23 sources, and the flat spectrum radio quasar nature of other 7 ones. We also provide redshift estimates for 19 out of these 30 confirmations, with only one being a lower limit due to spectral features ascribable to intervening systems along the line of sight. As in previous analyses, the largest fraction of now-classified BCUs belong to the class of BL Lac objects, that appear to be the most elusive class of active galactic nuclei. One of the BL Lacs identified in this work, associated with 3FGL J2213.6-4755, lies at a redshift of 1.529, making it one of the few distant gamma-ray BL Lac objects.
Keywords galaxies: active - galaxies: BL Lacertae objects - quasars: general
1 Introduction
We are currently living in a golden age for gamma-ray astronomy. Thanks to the discoveries performed with the Large Area Telescope (LAT) (see e.g., Massaro et al. 2016a, , for a recent review on the extragalactic gamma-ray sky), on board the Fermi Gamma-ray Space Telescope (Atwood et al., 2009) launched in 2008, the number of gamma-ray sources is continuously increasing. There are 1450 gamma-ray objects listed in the Fermi-LAT First Source Catalog (1FGL; Abdo et al., 2010) and more than 3000 included in the last release of the Fermi-LAT Third Source Catalog (3FGL; Acero et al., 2015).
However, one of the key scientific questions identified before the launch of Fermi is still unsolved: a significant fraction of the objects detected by Fermi ranging between 30% to 40%, still constitute the population of the unidentified/unassociated gamma-ray sources (UGSs) lacking a classified, low-energy counterpart (see e.g., Hartman et al., 1999; Pittori et al., 2009). The search for UGS counterparts at lower frequencies is a challenging task (see e.g., Peña-Herazo et al., 2017, and references therein), mostly due to the Fermi-LAT positional uncertainty that is at least an order of magnitude larger than that in the radio-infrared-optical and even soft X-ray band (Massaro et al. 2012a, ; Massaro et al. 2013a, ). This prevents us from using standard procedures for positional crossmatches, making it necessary to use multifrequency information (see e.g, Cowperthwaite et al., 2013; Massaro et al. 2013b, ; Maselli et al., 2015) and associated statistical analyses.
Blazars are among the most extreme classes of radio-loud active galactic nuclei (AGN) whose observational properties and emission at all wavelengths are generally interpreted as due to particles accelerated in a relativistic jet aligned, within a small angle, to our line of sight (Blandford & Rees, 1978). Blazars emit via non-thermal processes over the entire electromagnetic spectrum, from radio to rays (e.g., Urry & Padovani, 1995). They exhibit a broad, double-bump spectral energy distribution (SED) coupled with highly variable (i.e., days to minute time scales) and polarized emission (Andruchow et al., 2005; Angelakis et al., 2016), apparent superluminal motions (Jorstad et al., 2001), flat radio spectra, even at low radio frequencies (see e.g. Massaro et al. 2013c, ) and peculiar infrared colors (Massaro et al., 2011; D’Abrusco et al., 2012; Massaro & D’Abrusco, 2016) discovered thanks to the all-sky survey carried out with the WISE satellite (Wright et al., 2010).
Blazars are mainly classified as BL Lac objects, from the name of the prototype, when the equivalent width (EqW) of the emission and/or absorption lines present in their optical spectra is less than 5 Å (Stickel et al., 1991), while they are known as flat spectrum radio quasars when broad emission lines typical of quasar-like (QSO) spectra are visible. The faintness of spectral features, if present at all, in BL Lac objects is the reason why the determination of their redshifts is challenging (Landoni et al. 2015b, ; Paiano et al. 2017a, ; Paiano et al. 2017b, ).
There are several methods developed to properly assess the blazar nature of a -ray source and/or to search for its potential low-energy counterpart, as those based on radio (Ghirlanda et al., 2010; Giroletti et al., 2016), infrared (D’Abrusco et al., 2013), optical (Sandrinelli et al., 2013; Marchesini et al., 2016; Paiano et al. 2017c, ), optical polarization (Blinov et al., 2018), X-ray follow up observations (Stephen et al., 2010; Takahashi et al., 2012; Takeuchi et al., 2013; Paggi et al., 2013; Landi et al., 2015), a broader multiwavelength approach (Paiano et al., 2017), or machine learning algorithms (Doert & Errando, 2014). Unfortunately to get a conclusive answer on the nature of the low-energy counterpart associated with a Fermi source, optical spectroscopic observations are strictly necessary (Massaro et al. 2015a, ). This is also the case of those sources listed in the Fermi AGN catalogs (1LAC, 2LAC and 3LAC Abdo et al., 2010; Ackermann et al., 2011, 2015) known as blazar candidate of uncertain type (BCUs).
BCUs are radio, infrared or X-ray sources associated with a Fermi source on the basis of the statistical procedures developed in the Fermi catalogs (Ackermann et al., 2015). If there is a positional correlation between a gamma-ray souce and a lower energy candidate counterpart, which is in turn either an unclassified blazar, or an unidentified source with a typical two-humped blazar-like spectral energy distribution, then this candidate counterpart is classified as a BCU. In particular, this means that these potential counterparts of -ray sources show multifrequency behavior similar to blazars, satisfying at least one of the following criteria: (i) are listed as blazars of uncertain type (BZUs) in the Roma-BZCAT (Massaro et al., 2009, 2015) or (ii) are sources with a flat radio spectrum and/or showing the typical two-humped SED and listed in at least one of the catalogs used to associate -ray sources in the Fermi catalogs.
In 2012, we started an optical spectroscopic campaign to perform follow up observations of UGSs for which our statistical algorithms based on the infrared colors (Massaro et al. 2012b, ; D’Abrusco et al., 2013) identified a potential counterparts (see e.g., Paggi et al., 2014; Massaro et al., 2014, for the initial results of our campaign), as well as to search for a blazar confirmation on the nature of the BCUs (Álvarez Crespo et al. 2016a, ). To date more than 250 new blazars have been discovered thanks to our optical campaign (see e.g., Massaro et al. 2016b, , for a recent review) and will be listed in the future releases of the Fermi gamma-ray catalogs.
Results of our follow up optical campaign were used by several groups to: (i) build the luminosity function of BL Lacs (see e.g., Ajello et al., 2014); (ii) select potential targets for the Cherenkov Telescope Array (see e.g., Massaro et al. 2013d, ; Arsioli et al., 2015); (iii) obtain stringent limits on the dark matter annihilation in sub-halos (see e.g., Zechlin & Horns, 2012; Berlin & Hooper, 2014); (iv) search for counterparts of new flaring gamma-ray sources (see e.g., Bernieri et al., 2013); (v) test new gamma-ray detection algorithms (see e.g., Campana et al., 2015, 2016, 2017); (vi) perform population studies on the UGSs (see e.g., Acero et al., 2013) and (vii) discover the new subclass of radio weak BL Lacs (see e.g., Massaro et al., 2017), to name a few.
Here we present an analysis of the spectroscopic observations collected between 2016 and 2017 on a sample of BCUs. The current paper is organized as follows. In § 2.1 we present the sample selection, then in § 2.2 we briefly describe the data reduction procedures. § 3 is devoted to our results while summary and conclusions are given in § 4. Unless otherwise stated we adopt cgs units for numerical results and spectral indices, , are defined by flux density, S. We also adopt a cosmological model with , and .
2 Observations
2.1 Sample selection
To be consistent with our previous analyses, throughout this paper we will adopt the Roma-BZCAT (Massaro et al., 2009, 2015) nomenclature: labeling as BZB the BL Lac subclass, and as BZQ the Flat spectrum radio quasars subclass.
As in previous analyses, we built a list of possible targets out of the potential counterparts of the UGSs with IR colors (see also D’Abrusco et al., 2014) or low radio frequency spectra (below 1 GHz Massaro et al. 2013e, ; Nori et al., 2014; Giroletti et al., 2016) similar to known, associated, Fermi blazars; or out of the associated candidate counterparts to BCUs as listed by the Fermi catalogs (Ackermann et al., 2015; Acero et al., 2015). Out of those targets, we selected those that were visible during the observing nights awarded to our optical spectroscopic campaign. The final sample is further reduced after taking into account magnitude limits for each observatory, which in our case range from 18 to 19.5 magnitudes in the R band.
We observed 30 targets associated with Fermi gamma-ray sources and classified as BCUs in the 3LAC (Ackermann et al., 2015), then we also observed 4 BZBs already present in the latest version of the Roma-BZCAT for which a spectroscopic redshift estimate is not reported in the literature. In the latter case given the variabile emission of BL Lacs we re-observed these sources hoping to find them in a low/quiescent state so to potentially detect some emission and/or absorption features in their optical spectra, the same strategy we adopted in the past to fill gaps in our schedule during the observations (Massaro et al. 2015b, ; Landoni et al. 2015a, ).
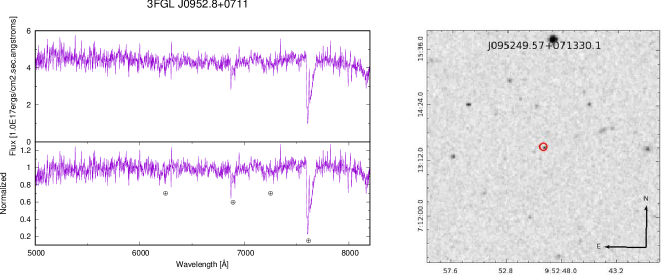
We also observed one BL Lac candidate, as classified in the Roma-BZCAT, that is a source classified as BL Lac but not confirmed, i.e., with only a description of its optical spectrum available in the literature but no images to verify it. This source, 5BZB J0607+4739, has been also associated with the Fermi object: 3FGL J0607.4+4739 (Massaro et al. 2015a, ). Finally, we also observed one source listed as a potential blazar-like counterpart of the UGS 3FGL J0952.8+0711, a blazar candidate indicated by our procedures based on the IR colors of gamma-ray blazars (D’Abrusco et al., 2013). In summary, our sample includes a total of 36 sources.
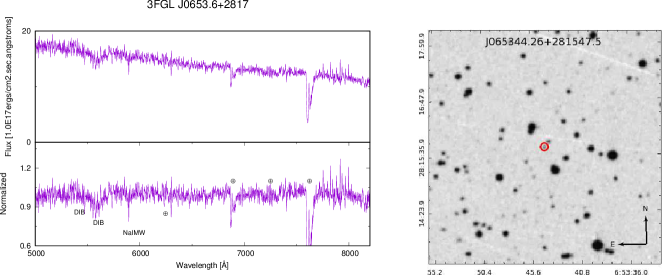
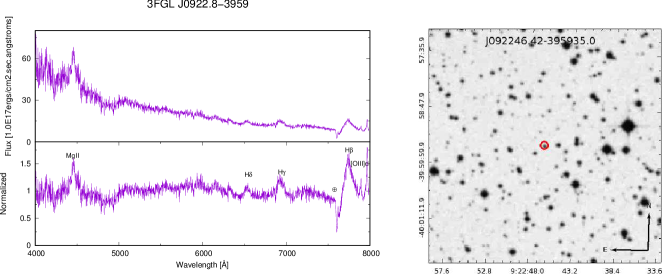
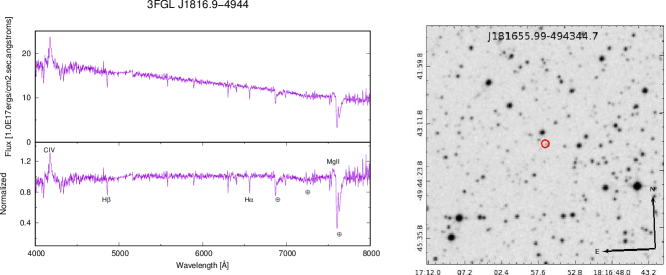
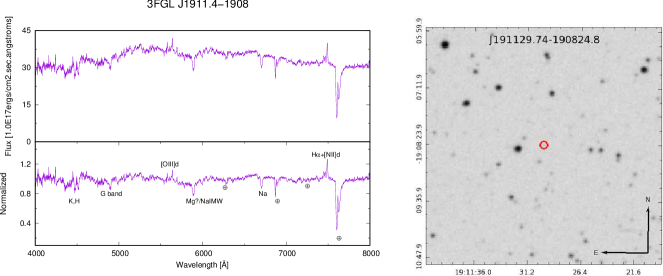
It is worth noticing that, given that they are BCUs, some information was already known beforehand. In some cases, the source was already classified as an AGN due to its physical properties but a proper classification (as either BL Lac or FSRQ) was missing. For example, in the cases of 3FGL J1816.9-4944 and 3FGL J1911.4-1908 (Massaro et al. 2015a, , and references therein), for which an optical spectral classification was necessary to confirm their nature. In the case of 3FGL J0653.6+2817, optical data was already available in the literature but was non-conclusive (Mahony et al., 2011; Álvarez Crespo et al. 2016b, ). The BZB sources are the only ones already classified, for which we aim only to pinpoint their redshifts. Finally, a redshift of 0.591 was already reported in the literature for the candidate counterpart of object 3FGL J0922.8-3959 (White et al., 1988), although there were no optical spectra available. From our spectrum, the object shows strong emission lines, at a redshift of , which is slightly different but still compatible with the previous value. Lastly, an optical spectroscopic identification for the UGS source 3FGL J0952.8+0711 was later published in the literature (Paiano et al. 2017c, ). We nevertheless checked whether this source showed any signs of spectral variability. As for the rest of our sample, no optical information whatsoever was found.
2.2 Data reduction
All our data were acquired, reduced and analyzed following the same method adopted in our previous analyses of this spectroscopic campaign. Here we reported only the basic details regarding the data collection and a brief overview of our standard procedure used for the extraction of the optical spectra, more information can be found in our previous works (see e.g., Ricci et al., 2015; Álvarez Crespo et al. 2016b, ; Álvarez Crespo et al. 2016c, ; Peña-Herazo et al., 2017, for additional details).
Targets were observed at several observatories:
-
•
Three sources were observed with the 2.1 m telescope at the San Pedro Martir (SPM) Observatory, Mexico, on two runs: on 2016/01/16 the first one and between 2017/08/22 and 2017/08/24 the second one. We used the Boller & Chivens spectrograph with a resolution of 2.3 Å and a spectral range of 3800 Å to 8200 Å.
-
•
Twenty-four sources were observed with the 4.1 m telescope from the Southern Astrophysical Research Observatory (SOAR), in Chile, on two runs between 2017/05/08 and 2017/05/09, and between 2017/08/18 and 2017/08/20, respectively. We used the Goodman spectrograph with a resolution of 2 Å and a spectral range from 4000 Å to 8000Å.
-
•
One source was observed with the 2.5 m Northern Optical Telescope (NOT), in 2016/01/14. We used the ALFOSC spectrograph with a resolution of 7 Å and a spectral range covering from 4200 Å to 9700 Å.
-
•
Eight sources were observed with the 4 m telescope at the Kitt Peak National Observatory (KPNO), USA, between 2016/08/12 and 2016/10/12. We used the KOSMOS spectrograph with a resolution of 1 Å and a spectral range covering from 5000 Å to 8200 Å.
All the data were reduced using the standard IRAF procedures for bias and flat correction, for cosmic ray and sky subtraction, and for wavelength and flux calibration. Wavelength calibration was performed with spectra from comparison lamps taken immediately after or right before the pointing of the object of interest, to minimize flexion issues, if any. Spectrophotometric standards were taken every night with the same configuration, for flux calibration purposes. To remove cosmic rays we used the L.A.Cosmic IRAF algorithm (van Dokkum, 2001), which provides a robust identification and removal of cosmic rays. In the cases in which more than one exposure was taken (to ensure minimum influence of the cosmic rays over the final result), the final spectra were combined. All the final spectra were dereddened for galactic absorption assuming values as given by the NASA/IPAC Galactic Dust111http://irsa.ipac.caltech.edu/applications/DUST/, Reddening and Extinction maps (Schlafly & Finkbeiner, 2011), and normalized to better visualize spectral features (if any).
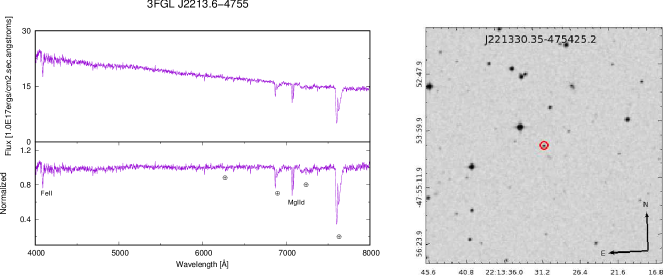
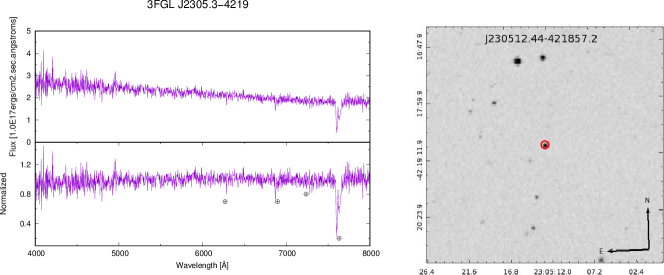
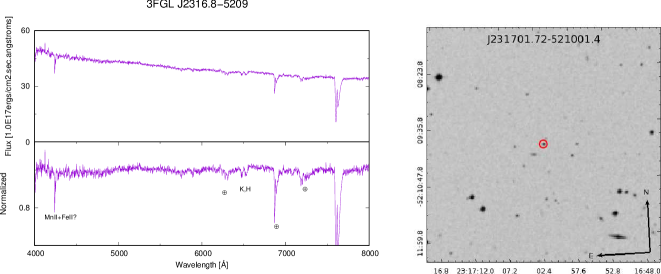
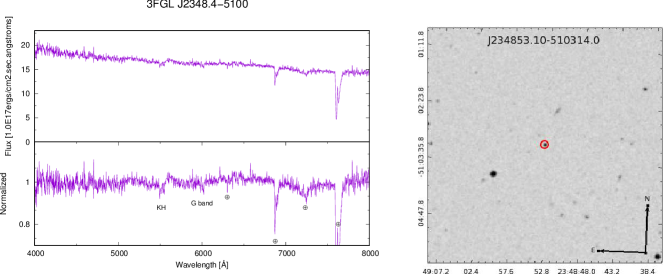
All the details about our sample together with the log of our observations are presented in Table 1, where we report the Fermi name and that of its assigned counterpart taken from the 3LAC catalog (Ackermann et al., 2015), the WISE name, its classification based on the spectra collected, an estimated value for its redshift (for those sources showing emission/absorption lines), the observing dates, the average signal-to-noise ratio (SNR) and the exposure time. The spectra presented in this work show all SNRs of at least 10, to strengthen the confidence in our results. Spectra with an SNR of less than 30 are flagged, to indicate that the resulting classification should be taken with caution. We claim a line identification whenever there are at least two absorption and/or emission lines present, that can be identified with a single redshift value. The only exceptions to this are 3FGL J2107.7-4822 and 3FGL J2213.6-4755, for which the resulting redshift are only a lower limit.
| Fermi Name | Association | WISE Name | Fermi | BZCat | Redshift | Obs. date | SNR | Exp. time | Obs. |
| class | class | [yyyy-mm-dd] | [s] | ||||||
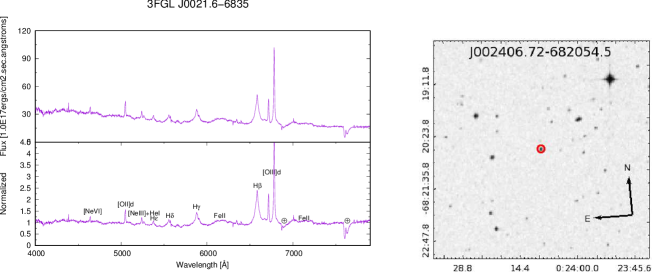
| 3FGL J0021.6-6835∗ | PKS 0021-686 | J002406.72-682054.5 | BCU | QSO | 0.354 | 2017-08-20 | 11 | 2x600 | SOAR |
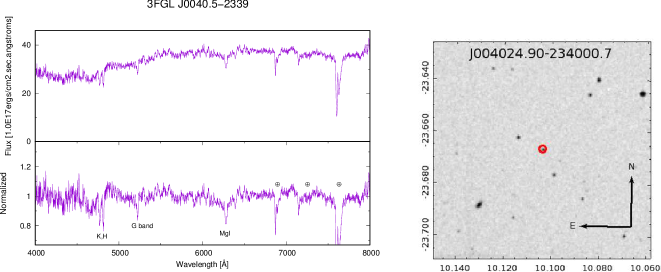
| 3FGL J0040.5-2339∗ | PMN J0040-2340 | J004024.90-234000.7 | BCU | BZB/galaxy | 0.213 | 2017-08-18 | 14 | 2x700 | SOAR |
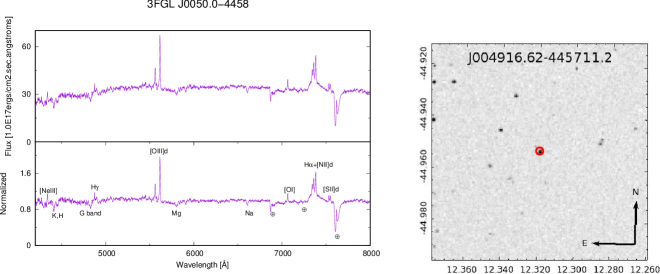
| 3FGL J0050.0-4458 | PMN J0049-4457 | J004916.62-445711.2 | BCU | QSO/Sy | 0.121 | 2017-08-20 | 31 | 2x500 | SOAR |
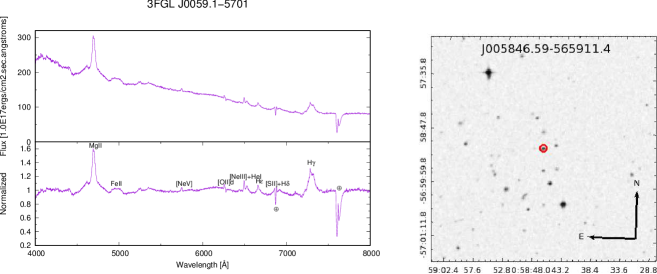
| 3FGL J0059.1-5701∗ | PKS 0056-572 | J005846.59-565911.4 | BCU | QSO | 0.677 | 2017-08-18 | 15 | 2x1000 | SOAR |
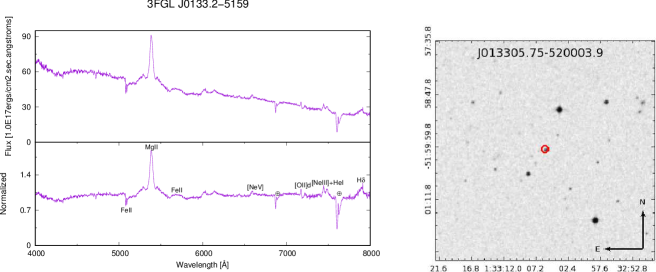
| 3FGL J0133.2-5159∗ | PKS 0131-522 | J013305.75-520003.9 | BCU | QSO | 0.925 | 2017-08-18 | 17 | 2x1200 | SOAR |
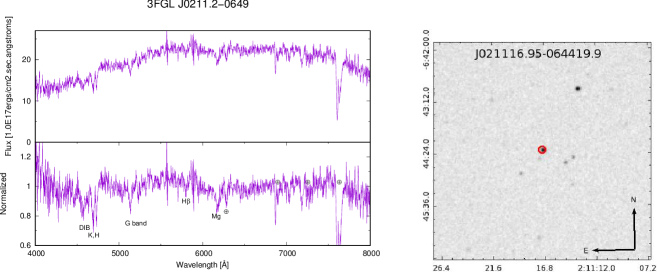
| 3FGL J0211.2-0649∗ | NVSS J021116-064422 | J021116.95-064419.9 | BCU | BZB | 0.194 | 2017-08-20 | 17 | 2x500 | SOAR |
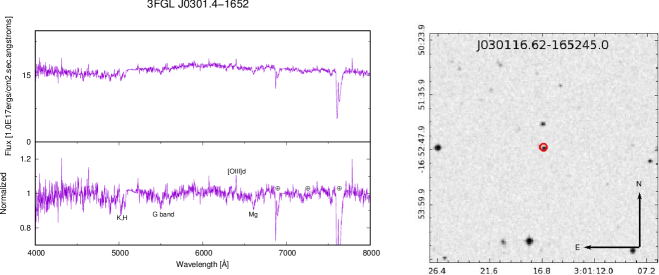
| 3FGL J0301.4-1652∗ | PMN J0301-1652 | J030116.62-165245.0 | BCU | BZB/galaxy | 0.278 | 2017-08-20 | 27 | 2x800 | SOAR |
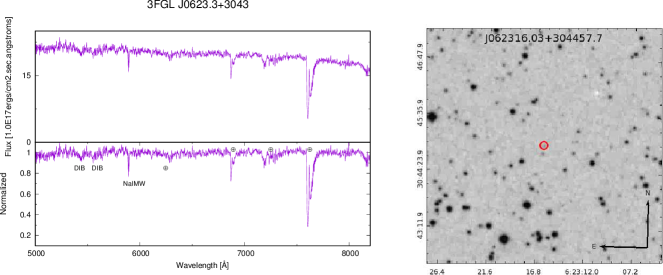
| 3FGL J0623.3+3043 | B6 J0623+3045 | J062316.03+304457.7 | BCU | BZB | ? | 2016-12-09 | 30 | 2x1200.0 | KPNO |
| 3FGL J0653.6+2817∗ | B6 J0653+2816 | J065344.26+281547.5 | BCU | BZB | ? | 2016-12-10 | 25 | 2x900 | KPNO |
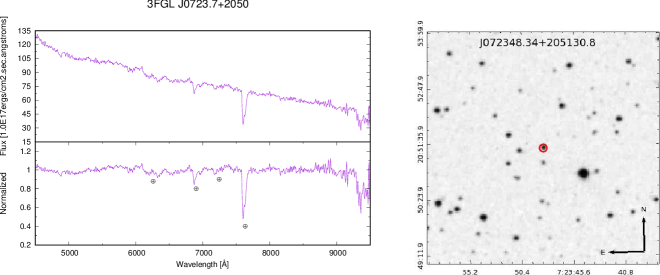
| 3FGL J0723.7+2050∗ | GB6 J0723+2051 | J072348.34+205130.8 | BCU | BZB | ? | 2016-01-14 | 22 | 3x600 | NOT |
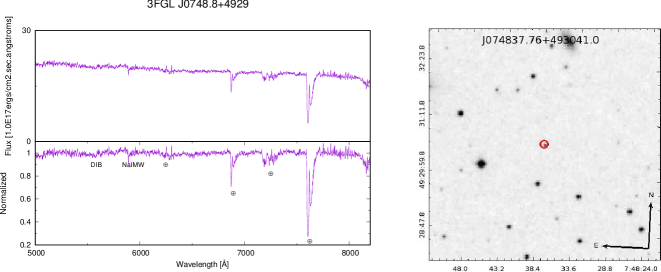
| 3FGL J0748.8+4929 | VSS J074837+493040 | J074837.76+493041.0 | BCU | BZB | ? | 2016-12-09 | 75 | 2x1800 | KPNO |
| 3FGL J0922.8-3959∗ | PKS 0920-39 | J092246.42-395935.0 | BCU | QSO | 0.595 | 2017-05-08 | 11 | 3x600 | SOAR |
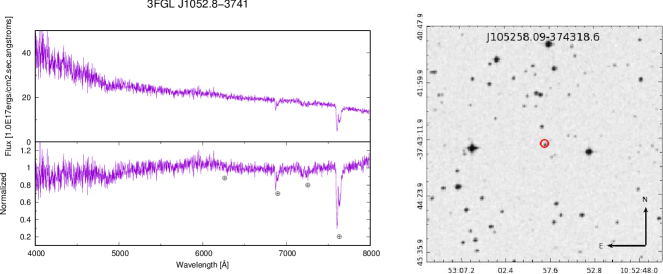
| 3FGL J1052.8-3741∗ | PMN J1053-3743 | J105258.09-374318.6 | BCU | BZB | ? | 2017-05-09 | 16 | 3x400 | SOAR |
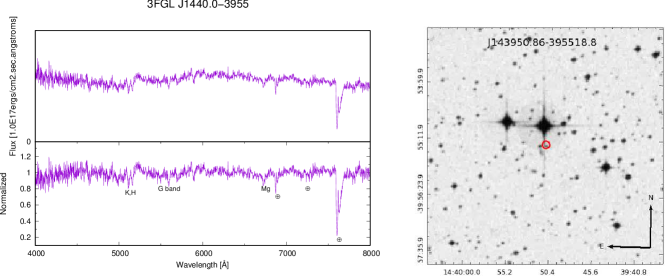
| 3FGL J1440.0-3955∗ | 1RXS J143949.8-395524 | J143950.86-395518.8 | BCU | BZB | 0.300 | 2017-08-19 | 11 | 1x1000 | SOAR |
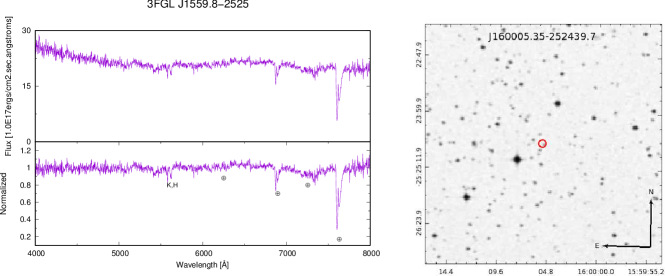
| 3FGL J1559.8-2525∗ | NVSS J160005-252439 | J160005.35-252439.7 | BCU | BZB | 0.416 | 2017-08-18 | 24 | 1x1200 | SOAR |
| 3FGL J1816.9-4944∗ | PMN J1816-4943 | J181655.99-494344.7 | BCU | QSO | 1.70 | 2017-08-20 | 27 | 2x1200 | SOAR |
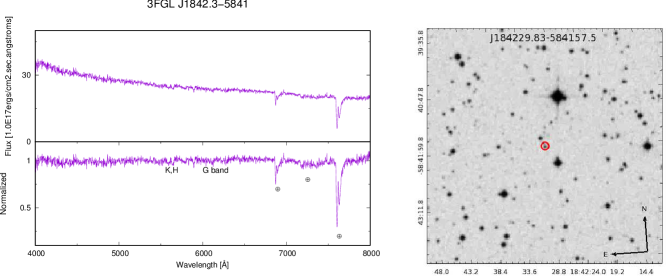
| 3FGL J1842.3-5841∗ | 1RXS J184230.6-584202 | J184229.83-584157.5 | BCU | BZB | 0.421 | 2017-05-09 | 28 | 3x770 | SOAR |
| 3FGL J1911.4-1908 | PMN J1911-1908 | J191129.74-190824.8 | BCU | BZB/galaxy | 0.138 | 2017-08-20 | 38 | 3x870 | SOAR |
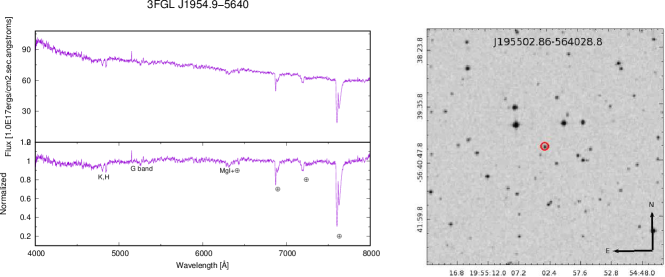
| 3FGL J1954.9-5640 | 1RXS J195503.1-564031 | J195502.86-564028.8 | BCU | BZB | 0.221 | 2017-08-18 | 42 | 2x900 | SOAR |
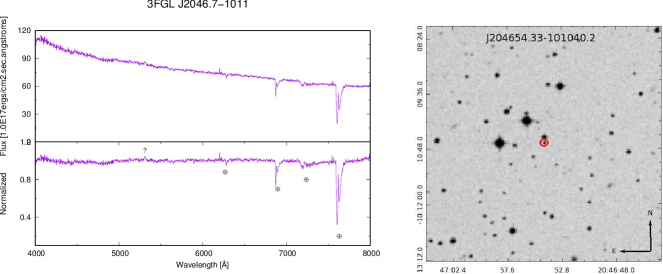
| 3FGL J2046.7-1011 | PMN J2046-1010 | J204654.33-101040.2 | BCU | BZB | ? | 2017-08-18 | 30 | 2x1000 | SOAR |
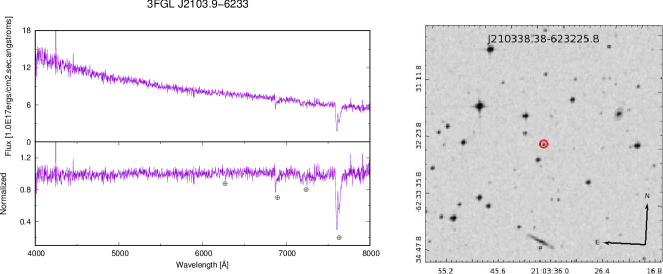
| 3FGL J2103.9-6233∗ | PMN J2103-6232 | J210338.38-623225.8 | BCU | BZB | ? | 2017-08-19 | 13 | 2x800 | SOAR |
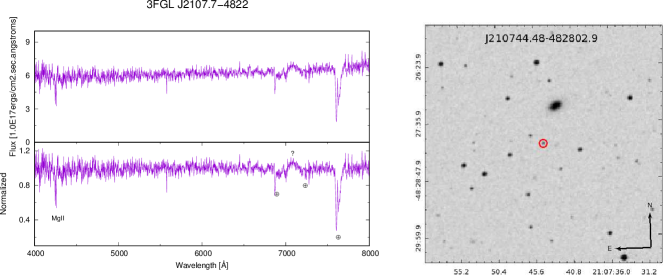
| 3FGL J2107.7-4822∗ | PMN J2107-4827 | J210744.48-482802.9 | BCU | QSO | 0.519 | 2017-08-18 | 19 | 2x1200 | SOAR |
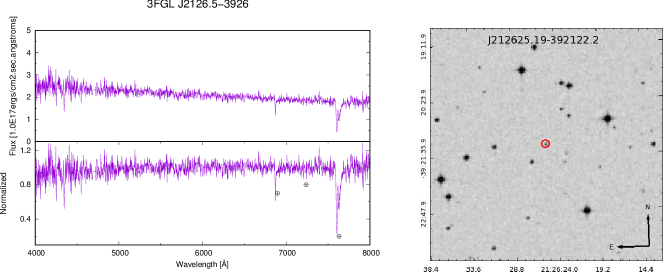
| 3FGL J2126.5-3926∗ | PMN J2126-3921 | J212625.19-392122.2 | BCU | BZB | ? | 2017-08-20 | 15 | 4x1300 | SOAR |
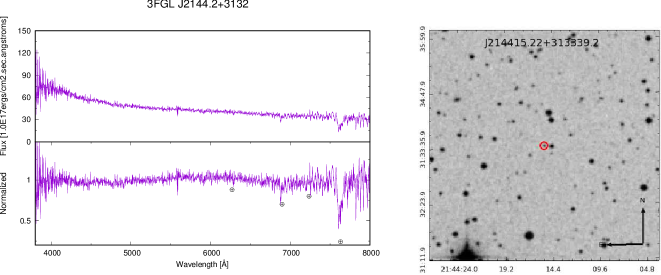
| 3FGL J2144.2+3132∗ | MG3 J214415+3132 | J214415.22+313339.2 | BCU | BZB | ? | 2017-08-22 | 23 | 3x1800 | SPM |
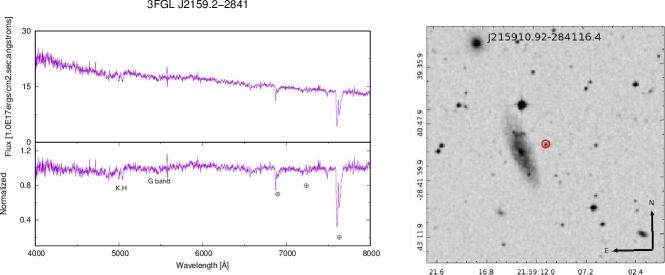
| 3FGL J2159.2-2841∗ | NVSS J215910-284115 | J215910.92-284116.4 | BCU | BZB | 0.270 | 2017-08-20 | 27 | 2x900 | SOAR |
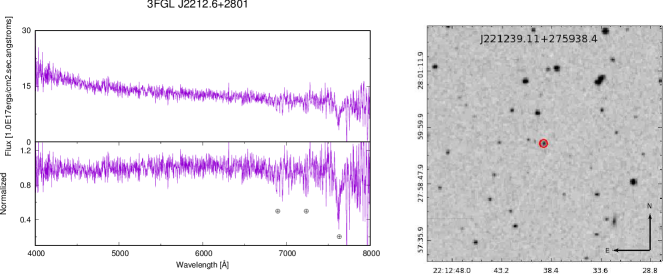
| 3FGL J2212.6+2801∗ | MG3 J221240+2759 | J221239.11+275938.4 | BCU | BZB | ? | 2017-08-24 | 13 | 3x1800 | SPM |
| 3FGL J2213.6-4755∗ | SUMSS J221330-475426 | J221330.35-475425.2 | BCU | BZB | 1.529 | 2017-08-18 | 28 | 2x1200 | SOAR |
| 3FGL J2305.3-4219∗ | SUMSS J230512-421859 | J230512.44-421857.2 | BCU | BZB | ? | 2017-08-20 | 13 | 3x1200 | SOAR |
| 3FGL J2316.8-5209 | SUMSS J231701-521003 | J231701.72-521001.4 | BCU | BZB | 0.646 | 2017-08-18 | 32 | 3x1200 | SOAR |
| 3FGL J2348.4-5100 | SUMSS J234852-510311 | J234853.10-510314.0 | BCU | BZB | 0.392 | 2017-08-20 | 31 | 2x1200 | SOAR |
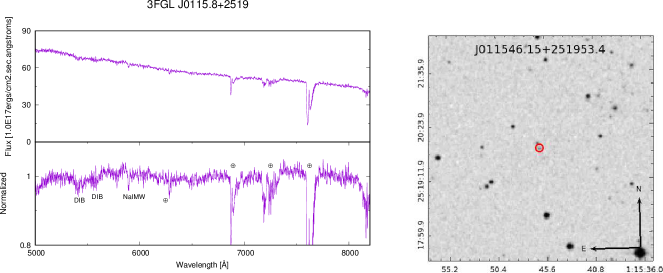
| 3FGL J0115.8+2519 | 5BZB J0115+2519 | J011546.15+251953.4 | BZB | BZB | ? | 2016-12-09 | 50 | 2x900 | KPNO |
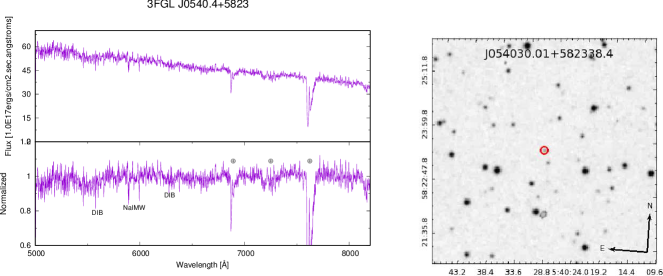
| 3FGL J0540.4+5823 | 5BZB J0540+5823 | J054030.01+582338.4 | BZB | BZB | ? | 2016-12-10 | 25 | 2x1200 | KPNO |
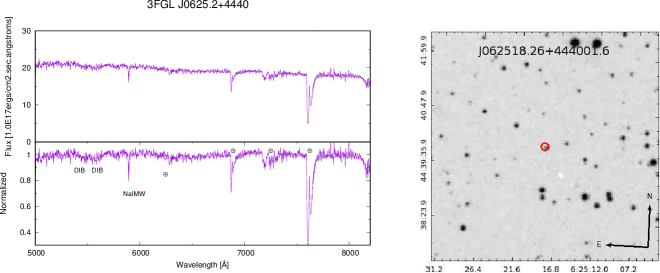
| 3FGL J0625.2+4440 | 5BZB J0625+4440 | J062518.26+444001.6 | BZB | BZB | ? | 2016-12-08 | 50 | 2x900 | KPNO |
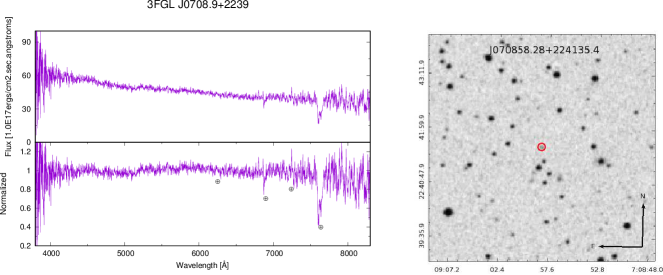
| 3FGL J0708.9+2239 | 5BZB J0708+2241 | J070858.28+224135.4 | BZB | BZB | ? | 2016-01-16 | 29 | 1x1800 | SPM |
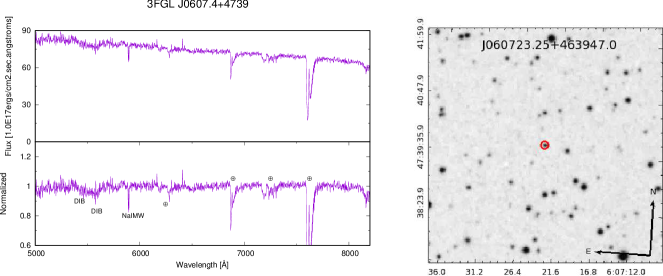
| 3FGL J0607.4+4739 | 5BZB J0607+4739 | J060723.25+473947.0 | BZB | BZB | ? | 2016-12-10 | 70 | 2x900 | KPNO |
| 3FGL J0952.8+0711 | VSS J095249+071330 | J095249.57+071330.1 | UGS | BZB | 0.574 | 2016-12-09 | 15 | 2x900 | KPNO |
3 Results and Source details
As occurred in our previous BCU counterpart analyses (Álvarez Crespo et al. 2016a, ), we found that a large fraction of them are classifiable as BL Lacs. In particular, as shown in Table 1, 23 out of 30 BCUs pointed are BL Lacs, 11 with a certain redshift estimate, and 11 with a classical featureless spectrum. The remaining one is SUMSS J221330-475426, associated with 3FGL J2213.6-4755 and with a lower limit on its of 1.529. This lower limit is due to the presence of some absorption lines from intervening systems along the line of sight. There are also 3 out of the 12 BZBs, namely: PMN J0040-2340, PMN J0301-1652 and PMN J1911-1908, associated with 3FGL J0040.5-2339, 3FGL J0301.4-1652 and 3FGL J1911.4-1908, respectively, that appear to have the optical spectrum partially dominated by the one of their host galaxy and thus could resemble the BZG definition reported in the latest version of the Roma-BZCAT (see also Massaro et al., 2015, for more details). It is worth mentioning that SUMSS J221330-475426, the associated counterpart the BCU 3FGL J2213.6-4755, is a BL Lac source with a measurable redshift of 1.529 based on FeII and MgII absorption doublets. As these doublets are very narrow, we conclude they must be from an intervening system, thus making the z value a lower limit. This means it is one of the few distant BZBs lying within the end of the distance distribution for BL Lacs (Massaro et al., 2009). According to the Roma-BZCAT, only 15 BL Lac objects are reported at redshifts higher than 1, with 12 of them being uncertain. This is why there are a number of campaigns to find such objects (Landoni et al., 2018), which can significantly help population studies. Lastly, in the case of SUMSS J231701-521003, associated with 3FGL J2316.8-5209, we detect two absorption doublets. They are compatible with the MnII and FeII resonance lines, the first, and with the CaII doublet the second, both at a redshift of . However, the doublet in the blue end of the spectrum could be also attributed to the MgII lines from an intervening system at .
The remaining 7 BCUs observed are all classifiable as QSO with a redshift estimate, with the only exception for PMN J0049-4457 associated with the Fermi source 3FGL J0050.0-4458, which shows an optical spectrum more similar to that of the nucleus of a Seyfert galaxy 1.8 or 1.9 (see e.g., Masetti et al., 2010; Rojas et al., 2017), but has a clear flat radio spectrum and a bolometric luminosity typical of a BZQ (of the order of erg/s). Moreover, although PMN J2107-4827, associated with 3FGL 2107.7-4822, shows a broad emission feature in its spectrum and is thus classified as a QSO, we can only give a lower limit to its redshift due to an intervening system (i.e., ) from which we detect the MgII double absorption. The emission line, although certainly from the object itself, remains unidentified.
Our optical spectrum of 5BZB J0607+4739, the BL Lac candidate listed in the Roma-BZCAT and associated with 3FGL J0607.4+4739, is featureless thus suggesting it is classifiable as BL Lac; as occurs for all the other four BZBs, namely: 5BZB J0115+2519, 5BZB J0540+5823, 5BZB J0625+4440 and 5BZB J0708+2241, for which, unfortunately, it was not possible to obtain a estimate.
Finally, the low-energy source VSS J095249+071330 that lies within the positional uncertainty region of the UGS 3FGL J0952.8+0711 is a classical BZB with a featureless optical spectrum. This is in agreement with the spectrum already reported in the literature Paiano et al. 2017c , although in our case no lines are visible. This is probably due to the lower resolution of our spectrum.
All the lines measured from the observed spectra are reported in Table 2 for each 3FGL counterpart, alongside their respective line identifications.
| Name | z | Line | Obs. wavelength | Eqw. | Eqw. error |
| [3FGL] | [Å] | [Å] | [Å] | ||
| 3FGL J0021.6-6835 | 0.354 | [NeVI] | 4640 | +2.1 | 0.1 |
| [OII]d | 5040 | +6.9 | 0.2 | ||
| [NeIII] | 5240 | +3.1 | 0.1 | ||
| HeI | 5267 | +1.6 | 0.1 | ||
| H | 5376 | +4.1 | 0.2 | ||
| H | 5555 | +18 | 1 | ||
| H | 5882 | +29.8 | 0.9 | ||
| FeII | 6160 | - | - | ||
| H | 6584 | +57 | 3 | ||
| [OIII] | 6717 | +13.8 | 0.4 | ||
| [OIII] | 6782 | +53 | 1 | ||
| FeII | 7180 | - | |||
| 3FGL J0040.5-2339 | 0.213 | CaII (K) | 4772 | 5.0 | 0.2 |
| CaII (H) | 4813 | 3.8 | 0.2 | ||
| G band | 5220 | 2.8 | 0.2 | ||
| MgI | 6280 | 3.3 | 0.2 | ||
| 3FGL J0050.0-4458 | 0.121 | [NeIII] | 4338 | +2.5 | 0.2 |
| CaII (K) | 4411 | 3.5 | 0.2 | ||
| CaII (H) | 4450 | - | - | ||
| G band | 4825 | 3.3 | 0.4 | ||
| H | 4873 | - | - | ||
| [OIII] | 5561 | +4.1 | 0.3 | ||
| [OIII] | 5615 | +9.9 | 0.1 | ||
| Mg | 5803 | 2.4 | 0.3 | ||
| Na | 6607 | 2.0 | 0.1 | ||
| [OI] | 7065 | +1.8 | 0.1 | ||
| [NII] | 7343 | +2.4 | 0.3 | ||
| H | 7367 | +41 | 3 | ||
| [NII] | 7383 | +4.3 | 0.6 | ||
| [SII] | 7532 | +1.4 | - | ||
| [SII] | 7549 | +1.7 | - | ||
| 3FGL J0059.1-5701 | 0.677 | MgII | 4694 | +46 | 4 |
| FeII | 4976 | - | - | ||
| [NeV] | 5749 | - | - | ||
| [OII]d | 6257 | - | - | ||
| NeIII | 6494 | - | - | ||
| HeI | 6527 | +1.4 | 0.1 | ||
| H | 6665 | +4.0 | 0.2 | ||
| [SII] | 6873 | - | - | ||
| H | 6919 | - | - | ||
| H | 7299 | +35 | 1 |
| Name | z | Line | Obs. wavelength | Eqw. | Eqw. error |
| [3FGL] | [Å] | [Å] | [Å] | ||
| 3FGL J0115.8+2519 | ? | - | - | - | - |
| 3FGL J0133.2-5259 | 0.925 | FeII | 5082 | - | - |
| FeII | 5095 | - | - | ||
| MgII | 5386 | +57 | 3 | ||
| FeII | 5683 | - | - | ||
| [NeV] | 7173 | - | - | ||
| [NeIII] | 7445 | +4.1 | 0.4 | ||
| HeI | 7485 | +5.1 | 0.4 | ||
| H | 7892 | +18.1 | 0.9 | ||
| 3FGL J0211.2-0649 | 0.194 | CaII (K) | 4696 | 4.3 | 0.1 |
| CaII (H) | 4737 | 3.0 | 0.1 | ||
| G band | 5140 | 2.8 | 0.1 | ||
| H | 5806 | 1.6 | 0.3 | ||
| Mg | 6180 | 4.0 | 0.1 | ||
| 3FGL J0301.4-1652 | 0.278 | CaII (K) | 5023 | 4.0 | 0.3 |
| CaII (H) | 5071 | 2.2 | 0.1 | ||
| G band | 5500 | 2.8 | 0.4 | ||
| [OIII] | 6335 | +2.3 | 0.2 | ||
| [OIII] | 6398 | +1.9 | 0.2 | ||
| MgI | 6611 | 3.3 | 0.3 | ||
| 3FGL J0540.4+5823 | ? | - | - | - | - |
| 3FGL J0607.4+4739 | ? | - | - | - | - |
| 3FGL J0623.3+3043 | ? | - | - | - | - |
| 3FGL J0625.2+4440 | ? | - | - | - | - |
| 3FGL J0653.6+2817 | ? | - | - | - | - |
| 3FGL J0708.9+2239 | ? | - | - | - | - |
| 3FGL J0723.7+2050 | ? | - | - | - | - |
| 3FGL J0748.8+4929 | ? | - | - | - | - |
| 3FGL J0922.8-3959 | 0.595 | MgII | 4456 | +65 | 4 |
| H | 6534 | +15 | 1 | ||
| H | 6930 | +39 | 3 | ||
| H | 7745 | +97 | 5 | ||
| [OIII] | +6.9 | 1 | |||
| [OIII] | +14 | 2 | |||
| 3FGL J0952.8+0711 | ? | - | - | - | - |
| 3FGL J1052.8-3741 | ? | - | - | - | - |
| 3FGL J1440.0-3955 | 0.300 | CaII (K) | 5115 | 5.8 | 0.2 |
| CaII (H) | 5160 | 4.4 | 0.1 | ||
| G band | 5595 | 3.0 | 0.2 | ||
| MgI | 6728 | 2.8 | 0.1 | ||
| 3FGL J1559.8-2525 | 0.416 | CaII (K) | 5579 | 4.6 | 0.3 |
| CaII (H) | 5620 | 2.3 | 0.1 |
| Name | z | Line | Obs. wavelength | Eqw. | Eqw. error |
|---|---|---|---|---|---|
| [3FGL] | [Å] | [Å] | [Å] | ||
| 3FGL J1816.9-4944 | 1.70 | CIV | 4183 | +49 | 4 |
| H* | 4860 | 2.1 | 0.1 | ||
| H* | 6560 | 2.7 | 0.1 | ||
| MgII | 7562 | +3.9 | 0.2 | ||
| 3FGL J1842.3-5841 | 0.421 | CaII (K) | 5592 | 2.6 | 0.4 |
| CaII (H) | 5641 | 2.2 | 0.2 | ||
| G band | 6117 | 3.4 | 0.5 | ||
| 3FGL J1911.4-1908 | 0.138 | CaII (K) | 4476 | 4.0 | 0.3 |
| CaII (H) | 4514 | 3.2 | 0.2 | ||
| G band | 4894 | 3.3 | 0.3 | ||
| H | 5542 | - | - | ||
| [OIII] | 5636 | +1.8 | 0.2 | ||
| [OIII] | 5695 | +0.9 | 0.1 | ||
| Na | 6705 | 3.0 | 0.1 | ||
| [NII] | 7451 | 1.0 | 0.1 | ||
| H | 7567 | +0.7 | 0.3 | ||
| [NII] | 7491 | 2.8 | 0.1 | ||
| 3FGL J1954.9-5640 | 0.221 | CaII (K) | 4802 | 1.6 | 0.2 |
| CaII (H) | 4846 | 1.5 | 0.1 | ||
| G band | 5255 | 0.9 | 0.1 | ||
| MgI+Tell. | 6316 | 2.5 | 0.2 | ||
| 3FGL J2046.7-1011 | - | - | - | - | - |
| 3FGL J2103.9-6233 | ? | - | - | - | - |
| 3FGL J2107.7-4822 | 0.519 | MgII | 4246 | 2.3 | 0.2 |
| MgII | 4258 | 2.0 | 0.1 | ||
| ? | 7085 | +26.2 | 2.0 | ||
| 3FGL J2126.5-3926 | ? | - | - | - | - |
| 3FGL J2144.2+3132 | ? | - | - | - | - |
| 3FGL J2159.2-2841 | 0.270 | CaII (K) | 4999 | 2.6 | 0.1 |
| CaII (H) | 5042 | 2.9 | 0.1 | ||
| G band | 5463 | 2.2 | 0.2 | ||
| 3FGL J2212.6+2801 | ? | - | 0.0 | 0.0 | |
| 3FGL J2213.6-4755 | 1.529 | FeII | 4089 | 3.5 | 0.1 |
| MgII | 7071 | 2.2 | 0.4 | ||
| MgII | 7089 | 1.7 | 0.2 | ||
| 3FGL J2305.3-4219 | ? | - | - | - | |
| 3FGL J2316.8-5209 | 0.646 | MnII? | 4241 | - | - |
| FeII? | 4253 | - | - | ||
| CaII (K) | 6477 | 1.2 | 0.1 | ||
| CaII (H) | 6529 | 1.4 | 0.1 | ||
| 3FGL J2348.4-5100 | 0.398 | CaII (K) | 5503 | 1.5 | 0.1 |
| CaII (H) | 5549 | 0.8 | 0.1 | ||
| G band | 6013 | 1.6 | 0.2 |
4 Summary and conclusions
This is paper number VIII of the series dedicated to the optical spectroscopic campaign of UGSs and BCUs listed in the Fermi catalogs, aiming to obtain spectroscopic confirmation of their associated and/or potential low-energy counterparts. The analysis presented here is almost entirely dedicated to BCUs as occurred in additional works (see e.g., Álvarez Crespo et al. 2016a, ).
Here we reported the follow up spectroscopic observations of a sample listing 36 targets, carried out thanks to the SPM, SOAR, KPNO and NOT observatories. All of them were observed between January 2016 and August 2017. The selected sample includes 30 BCUs, 4 BZBs already classified in the latest version of the Roma-BZCAT and associated with Fermi sources but lacking a estimate, and 1 BL Lac candidate also associated with a Fermi source but lacking a spectroscopic confirmation of its classification. Additionally, we re-observed the object VSS J095249+071330, an infrared source lying within the position uncertainty region of the UGS 3FGL J0952.8+0711 showing IR colors similar to those of known Fermi blazars (Massaro et al., 2011), and already identified as a BL Lac object (Paiano et al. 2017c, ).
Our results can be summarized as follows.
-
•
Twenty-three out of thirty BCUs are classifiable as BL Lac objects. The remaining 7 are all QSOs, and thus presenting a flat radio spectrum can be classified as BZQs, with the only exception of PMN J0049-4457, associated with 3FGL J0050.0-4458, for which the optical spectrum resembles that of an absorbed Seyfert galaxy.
-
•
For 12 of the BL Lac objects we are able to obtain a estimate, one of them being only a lower limit due to spectral features ascribable to intervening systems along the line of sight.
-
•
All the four BZBs re-observed to get an estimate of their redshift show featureless optical spectra. This is also the case of 5BZB J0607+4739, the BL Lac candidate listed in the Roma-BZCAT and associated with 3FGL J0607.4+4739. Our observations confirm its BL Lac nature.
-
•
Finally, we also re-observed the BZB object VSS J095249+071330, already associated with 3FGL J0952.8+0711. We do not detect any spectral variability with the results published previously in the literature.
-
•
We could associate an optical counterpart for the BCU 3FGL J2213.6-4755, which is SUMSS J221330-475426. This source is a BL Lac lying at a redshift of 1.529, which means it is one of the rare, most distant BL Lacs, which are counted by tens.
The current analysis increases the number of optical spectroscopic confirmation for UGSs and BCUs by 20% (Massaro et al. 2016b, ). It also confirms the trends that a large fraction of the sources classified tend to be BL Lacs, regardless of whether they were selected from the BCU list of the Fermi catalogs, or among the objects lying within the positional uncertainty regions of UGSs. These objects are not only the largest known population of gamma-ray sources but continue to be the most elusive class in the gamma-ray sky.
This paper reports the results achieved with single-slit spectroscopic observations collected until August 2017. More results are to come in the near future, given that 10 more nights will be used to complete the BCU observations in the Southern Hemisphere. We expect to carry on with our campaign until the end of 2019, since more nights have been awarded in the next semesters.
Acknowledgements This work is supported by the ”Departments of Excellence 2018 - 2022” Grant awarded by the Italian Ministry of Education, University and Research (MIUR) (L. 232/2016). This research has made use of resources provided by the Compagnia di San Paolo for the grant awarded on the BLENV project (S1618_L1_MASF_01) and by the Ministry of Education, Universities and Research for the grant MASF_FFABR_17_01. E. J. M. acknowledges the financial contribution from the Universidad Nacional de La Plata - Ay. Mov. Doctorandos 2018. F. M. acknowledges financial contribution from the agreement ASI-INAF n.2017-14-H.0. A. P. acknowledges financial support from the Consorzio Interuniversitario per la fisica Spaziale (CIFS) under the agreement related to the grant MASF_CONTR_FIN_18_02. F. R. acknowledges the support from FONDECYT Postdoctorado 3180506 and CONICYT project Basal AFB-170002. E. J. B. acknowledges support from Programa de Apoyo a Proyectos de Investigación e Innovación Tecnológica (IN109217).
References
- Abdo et al. (2010) Abdo, A. A., Ackermann M., Ajello, M. et al. 2010, ApJ 715, 429
- Abdo et al. (2010) Abdo, A. A., Ackermann M., Ajello, M. et al. 2010 ApJS, 188, 405
- Abdo et al. (2013) Abdo, A. A., Ajello, M., Allafort, A. et al. 2013 ApJS, 208 17
- Acero et al. (2013) Acero, F., Donato, D., Ojha, R. et al. 2013 ApJ, 779, 133
- Acero et al. (2015) Acero, F., Ackermann M., Ajello, M. et al. 2015 ApJS, 218, 23
- Ackermann et al. (2011) Ackermann, M., Ajello, M., Allafort, A. et al. 2011, ApJ 743, 171
- Ackermann et al. (2015) Ackermann, M., Ajello, M., Atwood, W. B. et al. 2015 ApJ, 810, 14
- Ajello et al. (2014) Ajello, M., Romani, R. W.; Gasparrini, D., et al. 2014 ApJ, 780, 73
- (9) Alvárez Crespo, N., Massaro, F., DÁbrusco, R. et al. 2016a ApSS, 361, 316
- (10) Alvárez Crespo, N., Masetti, N., Landoni, M. et al. 2016b AJ, 151, 32
- (11) Alvárez Crespo, N., Massaro, F., Milisavljevic, D. et al. 2016c AJ, 151, 95
- Andruchow et al. (2005) Andruchow, I., Romero, G. E., Cellone, S. A. et al. 2005, A&A, 442, 97
- Angelakis et al. (2016) Angelakis, E., Hovatta, T.; Blinov, D. et al. 2016, MNRAS 463, 3365
- Arsioli et al. (2015) Arsioli, B., Fraga, B., Giommi, P. et al. 2015 A&A, 579A, 34
- Atwood et al. (2009) Atwood, W. B., Abdo, A. A., Ackermann, M. et al. 2009 ApJ, 697, 2, 1071
- Berlin & Hooper (2014) Berlin, A. & Hooper D. 2014 PhRvD, 89a6014
- Bernieri et al. (2013) Bernieri, E., Campana, R.; Massaro, E. et al. 2013 A&A, 551L, 5
- Blandford & Rees (1978) Blandford R. D. & Rees, M. J. 1978 Proc. Pittsburgh Conference on BL Lac Objects, 328
- Blinov et al. (2018) Blinov, D., Pavlidou, V. et al. 2018, MNRAS, 474, 1296
- Campana et al. (2015) Campana, R., Massaro, E. Bernieri, E. et al. 2015 Ap&SS, 360, 65
- Campana et al. (2016) Campana, R., Massaro, E. Bernieri, E. et al. 2016 Ap&SS, 361, 185
- Campana et al. (2017) Campana, R., Maselli, A., Bernieri, E. et al. 2017 MNRAS, 465, 2784
- Cowperthwaite et al. (2013) Cowperthwaite, P. S., Massaro, F., D’Abrusco, R. et al. 2013 AJ, 146, 110
- D’Abrusco et al. (2012) D’Abrusco, R., Massaro, F., Ajello, M. et al. 2012 ApJ, 748, 68
- D’Abrusco et al. (2013) D’Abrusco, R., Massaro, F., Paggi, A. et al. 2013 ApJS, 206, 12
- D’Abrusco et al. (2014) D’Abrusco, R., Massaro, F., Paggi, A. et al. 2014 ApJS, 215, 14
- Doert & Errando (2014) Doert, M. & Errando, M. 2014, ApJ, 782, 41.
- Ghirlanda et al. (2010) Ghirlanda, G., Ghisellini, G., Tavecchio, F. et al. 2010 MNRAS, 407, 2, 791
- Giroletti et al. (2016) Giroletti, M., Massaro, F., D’Abrusco, R. et al. 2016 A&A, 588A, 141
- Hartman et al. (1999) Hartman, R. C., Bertsch, D. L., Bloom, S. D. et al. 1999 ApJSS, 123, 79
- Jorstad et al. (2001) Jorstad, S. G., Marscher, A. P., Mattox, J. R. et al. 2001 ApJ, 556, 738
- Landi et al. (2015) Landi, R., Bassani, L., Stephen, J. B. et al. 2015 A&A, 581, A57
- (33) Landoni, M., Massaro, F., Paggi, A. et al. 2015a AJ, 149, 163
- (34) Landoni, M., Falomo, R., Treves, A. et al. 2015b ApJ, 150, 6, 181
- Landoni et al. (2018) Landoni, M., Paiano, S., Falomo, R. et al. 2018 ApJ, 861, 2.
- Mahony et al. (2011) Mahony, E. K., Sadler, E. M., Croom, S. M. et al. 2011 MNRAS, 417, 2651
- Marchesini et al. (2016) Marchesini, E. J., Masetti, N., Chavushyan, V. et al. 2016 A&A 596, A10
- Maselli et al. (2015) Maselli, A., Massaro, F., D’Abrusco, R. et al. 2015 Ap&SS, 357, 141
- Masetti et al. (2010) Masetti, N., Parisi, P., Palazzi, E. et al. 2010 A&A 519, A96
- Massaro et al. (2009) Massaro, E., Giommi, P., Leto, C. et al. 2009 A&A, 495, 2, 691
- Massaro et al. (2015) Massaro, E., Maselli, A., Leto, C. et al. 2015 A&SS, 357, 75
- Massaro et al. (2011) Massaro, F., D’Abrusco, R., Ajello, M. et al. 2011 ApJ, 740L, 48
- (43) Massaro, F., D’Abrusco, R., Tosti, G. et al. 2012a ApJ, 752, 61
- (44) Massaro, F., D’Abrusco, R., Tosti, G. et al. 2012b ApJ. 750, 138
- (45) Massaro, F., D’Abrusco, R., Paggi, A. et al. 2013a ApJS, 209, 10
- (46) Massaro, F., D’Abrusco, R., Paggi, A. et al. 2013b ApJS, 206, 13
- (47) Massaro, F., Giroletti, M., Paggi, A. et al. 2013c ApJS, 208, 15
- (48) Massaro, F., Paggi, A., Errando, M. et al. 2013d ApJS, 207, 16
- (49) Massaro, F., D’Abrusco, R., Giroletti, M. et al. 2013e ApJS, 207, 4
- Massaro et al. (2014) Massaro, F., Masetti, N., D’Abrusco, R. et al. 2014 AJ, 148, 66
- (51) Massaro, F., D’Abrusco, R., Landoni, M. et al. 2015a ApJS, 217, 2
- (52) Massaro, F., Landoni, M., D’Abrusco, R. et al. 2015b A&A, 575A, 124
- (53) Massaro, F., Thompson, D. J., Ferrara, E. C. 2016a A&ARv, 24, 2
- (54) Massaro, F., Álvarez Crespo, N., D’Abrusco, R. et al. 2016b ApSS, 361, 337
- Massaro & D’Abrusco (2016) Massaro, F. & D’Abrusco R. 2016, 827, 67
- Massaro et al. (2017) Massaro, F., Marchesini, E. J., D’Abrusco, R. et al. 2017 ApJ, 834, 113
- Nori et al. (2014) Nori, M., Giroletti, M., Massaro, F. et al. 2014 ApJS, 212, 3
- Paggi et al. (2013) Paggi, A., Massaro, F., D’Abrusco, R. et al. 2013 ApJS, 209, 9
- Paggi et al. (2014) Paggi, A., Milisavljevic, D., Masetti, N. et al. 2014 AJ, 147, 112
- Paiano et al. (2017) Paiano, S., Franceschini, A. & Stamerra, A., MNRAS 2017, 468, 4902.
- (61) Paiano, S., Landoni, M., Falomo, R. et al. 2017a ApJ, 837, 2, 144
- (62) Paiano, S., Landoni, M., Falomo, R. et al. 2017b ApJ, 844, 2, 120
- (63) Paiano, S., Falomo, R., Franceschini, A. et al. 2017c ApJ, 851, 2, 135
- Peña-Herazo et al. (2017) Peña-Herazo, H. A., Marchesini, E. J., Álvarez Crespo, N. et al. 2017 Ap&SS, 362, 228
- Pittori et al. (2009) Pittori, C., Verrecchia, F., Chen, A. W. et al. 2009 A&A, 506, 3
- Ricci et al. (2015) Ricci, F., Massaro, F., Landoni, M. et al. 2015 AJ, 149, 160
- Rojas et al. (2017) Rojas, A. F., Masetti, N., Minniti, D. et al. 2017 A&A 602, A124
- Sandrinelli et al. (2013) Sandrinelli, A., Treves, A., Falomo, R. et al. 2013 ApJ, 146, 6, 163
- Schlafly & Finkbeiner (2011) Schlafly, E. F. & Finkbeiner, D. P. 2011 ApJ, 737, 103
- Stephen et al. (2010) Stephen, J. B., Bassani, L., Landi, R. et al. 2010 MNRAS, 408, 1, 422
- Stickel et al. (1991) Stickel, M., Padovani, P., Urry, C. M. et al. 1991 ApJ, 374, 431
- Takahashi et al. (2012) Takahashi, Y., Kataoka, J., Nakamori, T. et al. 2012 ApJ, 747, 64.
- Takeuchi et al. (2013) Takeuchi, Y., Kataoka, J., Maeda, K. et al. 2013 ApJS, 208, 25.
- Urry & Padovani (1995) Urry, C. M. & Padovani, P. 1995 PASP, 107, 803
- van Dokkum (2001) van Dokkum, P. G. 2001 PASP, 113, 1420V.
- White et al. (1988) White, G. L, Jauncey, D. L., Savage, A. et al. 1988 ApJ, 327, 561.
- Wright et al. (2010) Wright, E. L., Eisenhardt, P. R. M, Mainzer, A. K. et al. 2010 AJ, 140, 1868
- Zechlin & Horns (2012) Zechlin, H. & Horns, D. 2012 JCAP, 11, 050