Soft grain compression: beyond the jamming point
Abstract
We present the experimental studies of highly strained soft bidisperse granular systems made of hyperelastic and plastic particles. We explore the behavior of granular matter deep in the jammed state from local field measurement, from the grain scale to the global scale. By mean of a dedicated digital image correlation code and an accurate image recording method, we measure for each compression step the evolution of the particle geometries and their right Cauchy-Green strain tensor fields. We analyze the evolution of the usual macroscopic observables (stress, packing fraction, coordination, fraction of non-rattlers, etc.) along the compression process through the jamming point and far beyond. Analyzing the evolution of the local strain statistics, we evidence a crossover in the material behavior deep in the jammed state for both sorts of particles. We show that this crossover is due to a competition between material compression, dilation and shear, so its position depends on the particle material. We argue that the strain field is a reliable observable to describe the evolution of a granular system through the jamming transition and deep in the dense packing state whatever is the material behavior.
I Introduction
Wound healing Martin and Parkhurst (2004), cell monolayer growth Angelini et al. (2011); Madhikar et al. (2018), embryo developing Atia et al. (2017); Sadati et al. (2013), cancer invasion (Bi et al., 2015, 2016), squeezed foam Bolton and Weaire (1990); Durian (1995); Katgert and van Hecke (2010); Winkelmann et al. (2017), squeezed emulsion Brujić et al. (2003a, b); Zhou et al. (2006); Brujić et al. (2007); Desmond et al. (2013); Lorenzo et al. (2013); Fan et al. (2017) and metal, plastic or ceramic powder sintering Barés et al. (2014); all these very different systems have the common point to be described as packings of discrete, deformable particles. Even if the jamming transition – the transition between a fluid-like and a solid-like behavior of the granular matter – of stiff or weakly deformable particles has been very well studied, theoretically Liu and Nagel (1998); Degiuli et al. (2015); Jacquin et al. (2011); Berthier et al. (2011), numerically O’hern et al. (2003); O’Hern et al. (2002); Heussinger and Barrat (2009); Srivastava and Fisher (2017); Dagois-Bohy et al. (2017); Kapfer and Krauth (2015) and experimentally Brujić et al. (2007); Bi et al. (2011); Majmudar et al. (2007); Behringer (2015); Zhao et al. (2019) during the past decades, very few is known about the behavior of these soft granular systems at high packing fraction.
Up to the jamming point the compressibility of these particles can be neglected since the material is not able to carry load. Around the jamming point it is possible to consider that these particles are ruled by a linear elastic behavior since the stress and so the deformations are assumed to be small Brujić et al. (2003a, b); Zhou et al. (2006). However far beyond the jamming point it is necessary to consider a more complicated local behavior for the particle materials; different mechanisms more complicated than elasticity are at play: hyperelasticity, plasticity, damage, fracture etc. This implies that a large diversity of mechanical behaviors have to be considered for the particles. On top of this, it is also important to consider a large diversity of scales, shapes and interaction mechanisms.
These soft granular matter systems have been studied experimentally and numerically in the biologic context to understand the effect of mechanics on a the cell arrest, deformation and interaction near the jamming point. This aims at understanding the embryonic development, cancer invasion, and wound healing Martin and Parkhurst (2004); Sadati et al. (2013); Angelini et al. (2011); Szabo et al. (2006). Experiments have also been carried out to make faceted polyhedral microgels objects from emulsions compressed to packing fractions very close to Fan et al. (2017). But monolayer soap foams and oil emulsion are most likely the most well understood soft granular systems since many studies have been carried out near the jamming transition showing that, at the global and local scales, these systems do not differ too much from rigid particle packings in terms of coordination and force distributions Brujić et al. (2003b); Bolton and Weaire (1990); Durian (1995); Brujić et al. (2007); Zhou et al. (2006); Katgert and van Hecke (2010); Winkelmann et al. (2017). However, few is known for bulk material particles and not so many methods exist to measure mechanical interactions at the grain scale. Among differentsHowell et al. (1999); Jongchansitto et al. (2014); Brodu et al. (2015); Amon et al. (2017) the most common is the photoelasticimetry Howell et al. (1999); Daniels et al. (2017); Zadeh et al. (2019a, b), the measurement of the boundary deformation Brujić et al. (2003a, b, 2007); Brodu et al. (2015) and recently inverse problem method coupled with digital image correlation (DIC) have been also used for stiff particles Hurley et al. (2014); Marteau and Andrade (2017); Li et al. (2019). However, nothing exists for local (sub-granular) measurements in soft granular systems in an highly strained state.
Recently numerical models have manage to simulate these squeezable materials. Several approaches have been tested: Nezamabadi et al. (2017) have introduced the Material Point Method (so called MPM) and the Bonded Particle Model (so called BPM) to simulate the compression of dense granular systems. They have been followed by Boromand et al. (2018) who introduced the Deformable Particle Model (so called DPM) to simulate the compression of 2D grains which are polygons composed of a large number of vertices. Nevertheless, these different studies have barely been confronted to experimental results Vu et al. (2019a) and they all only focus on particle geometry variations and macroscopic observable changes without looking at the material evolution down to the particle scale.
However several questions remain about the behavior of highly strained granular matter: () Is there a transition or a crossover in the material behavior when the packing fraction increase in the dense state? () Are some elements of the Hertz contact framework still valid in this state? () What is the effect of the exact nature of the material whose the particles are made of, on the local and global behaviors of the packing? In order to tackle these issues, in this paper, we propose a pioneer model experiment bringing informations currently inaccessible. We introduce a novel method capable of measuring the local displacement field and inferring other mechanical fields in irregularly-shaped highly strained granular materials of any rheology. These measurements are made at the grain scale without inverse problem solving, so without any assumption on the system fabric, nor on the material rheology.
The paper is organized as follow. First, we introduce the experimental method and image processing techniques. Then, we present the results in a second section giving first the evolution of the global observables and then the variation of the local statistics. Finally we end with concluding discussions in a third section.
II Experimental method
II.1 Set-up
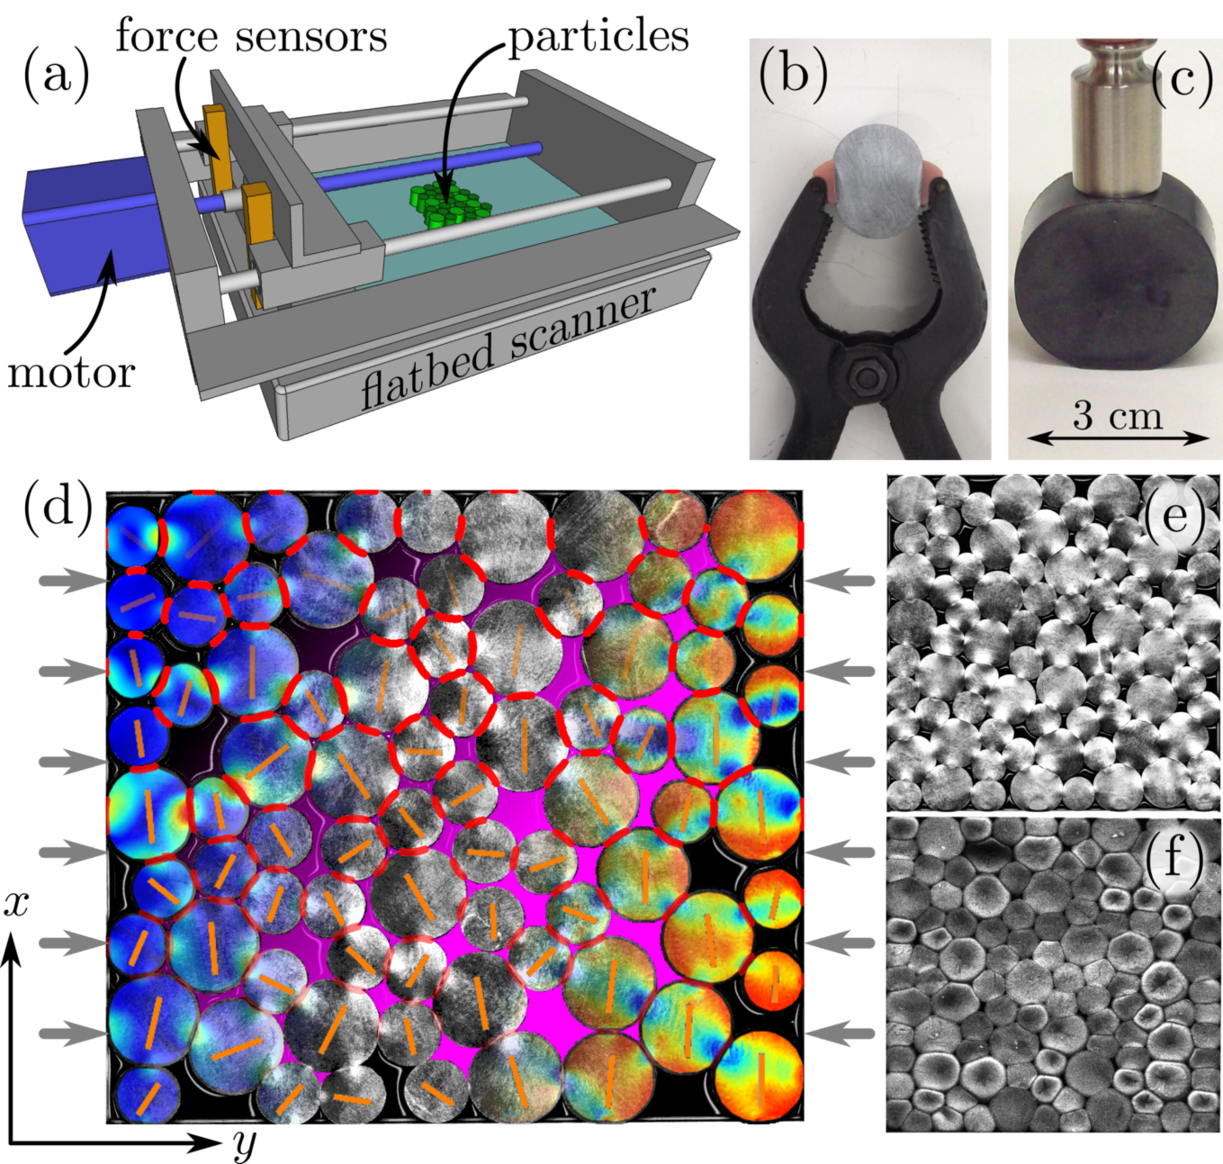
One of the most challenging point when dealing with experimental study of highly strained granular matter is to make quantitative measurements at the grain scale for the whole packing. To overcome this challenge, we used the novel set-up already presented in Vu et al. (2019b) and shown in fig. 1a. This consists in a compression machine positioned on a flatbed scanner. Randomly arranged bidisperse soft cylinders lay on a scanner top glass and are compressed step by step in one direction, while imaged from below with the scanner. The so obtained accurate images ( Mpx) are analyzed using the DIC method Hild and Roux (2006); Bornert et al. (2009); Pan et al. (2009); Vu et al. (2019b) to follow the evolution of the displacement and strain fields in each particle.
As shown in fig. 1a the compression device is composed of four wall forming an inner rectangle of initial dimension mm2. A stepper motor rotate a screw which moves one of the wall along the major direction of the rectangle. Two force sensors are attached to this wall to hold it and record the global stress evolution, , when compressing uniaxially the granular system. The global stress is measured continuously with a frequency of Hz while the system is compressed step by step. At each step the wall moves rightward (along the -axis in fig. 1) of a distance of mm at a speed of mm/min. Then, the system stays at rest during min which is enough for the particle to rearrange and the whole packing to relax as verified on the stress signal. Once relaxed the packing is imaged from below with a flatbed scanner CanoScan F Mark II with a resolution of dpi ( m/px). It takes about min to scan a bit picture of roughly (kpx)2. Granular systems are compressed up to global strains as high as %.
The two most common types of highly deformable material behaviors have been explored in this study; namely hyperelastic incompressible and plastic compressible particles have been studied. The hyperelastic grains are made of silicone sil (a) (see fig. 1b) whose Young modulus is MPa and Poisson ratio is Vu et al. (2019b). The Poisson ratio very close to provides that the material is almost incompressible. It has been shown that the particle behavior is very close to an ideal hyperelastic one Vu et al. (2019b). The plastic grains are made of % agar hydrogel aga (see fig. 1c) which has been shown to behave almost like a perfect elastoplastic material when loaded quasistatically Vu et al. (2019b). The material parameters are kPa, for the Young modulus, , for the Poisson ratio, kPa, for the plastic modulus and Pa, for the yield stress. The fact that is quite small permits to get highly compressed systems with a packing fraction, , larger than .
In both hyperelastic and plastic cases, bidisperse grains are casted cylinders of diameters mm and mm and of height mm. The bidispersity permits to avoid grain crystallization. For each experiment around particles are used keeping the small over large number of particle ratio constant around . The DIC method to measure displacement fields on the particle bottom faces requires a thin random pattern with a high optical contrast. In the case of hyperelastic particles, this is obtained by mixing the silicone sil (a) with black dye sil (b) and coating the mold bottom with a very thin layer of silver glitter sil (c). In the case of plastic particles, % of black Indian ink and % of thin metallic glitter sil (b) in mass are added to the hydrogel before casting. In both cases the glitter characteristic size is m which creates a random pattern with correlation length around m on the bottom face of each particle.
For both sorts of particle three compression runs have been carried out. For each run with hyperelastic particles, a layer of vegetable oil with a low viscous coefficient ( mPas) is coated on the glass surface in order to almost remove static basal friction and to improve optic transmission. This oil also makes the inter-particle friction vanishing. For plastic particles, a similar effect is obtained by adding DI water in the system. In order to counter evaporation of the water contained in the sample all along the experiments, the particles are regularly and gently moistened dropping DI water on the top of them so that they stay saturated in water. Experiments are stopped when particles pop out of the scanner glass due to force chain buckling. This happen after % strain for hyperelastic particles (see fig. 1e) while it reaches twice larger strain values for experiments with plastic particles (see fig. 1f).
The jamming transition have been widely studied over the past two decades Liu and Nagel (1998); O’Hern et al. (2002); O’hern et al. (2003); Katgert and van Hecke (2010); Zhao et al. (2019) and observing it is not the main purpose of this paper. Still to validate the experimental method that we present and even if our system is not large enough for a proper study of this transition, the hyperelastic particle systems have been prepared loose enough to observed this transition point during the compression process. On the contrary to go further in the deeply jammed state, plastic systems have been prepared with a packing fraction very close to the random close packing by densely packing grains by hand at the beginning of the compression. In both cases, the systems are prepared manually avoiding grain segregation and crystallization as much as possible.
II.2 Image processing
For each experiment, sets of to black and white pictures, , are obtained, where is the compression step going from to . The thin random patterns induced by the glitter used in the particle making process, permits to perform DIC with an algorithm modified from the one presented in Vu et al. (2019b). As shown in fig. 1d this permits to follow the particle displacements, rotations, shapes and strain tensor fields.
The first step of the algorithm consists in detecting the particle positions on the first frame, . This is done by using the shiny aspect of the particles over the dark background of this picture (see fig. 1e and f). The image is blurred with a Gaussian noise of standard deviation much larger than the correlation length of the random pattern, namely m. The so obtained image is binarized with a threshold chosen to have for the background and for the particle areas. Image convolution is then performed between a pre-set image of a single ideal particle with the diameter of the smallest particles and the binarized image. After performing the convolution, binarizing the resulting image using a threshold of % of the peak convolution value results in a field of well-isolated regions whose barycenters correspond to the particle centers . The area of each region indicates the particle’s diameter Zadeh et al. (2019b, a).
Each particle is then tracked along the compression process by mean of DIC. For a given particle at the compression step, a sub-image, , corresponding to a square of px2 centered in the middle of the particle, is extracted from the full picture. The new position of this square in the image of the step is found using Fourier transform DIC Pan et al. (2009). This consists in convolving with the full image by mean of Fast Fourier Transform (FFT). The maximum of convolution gives the new position of the particle with one pixel accuracy. To get a subpixel accuracy and measure the particle rotation a Nelder-Mead maximization algorithm is applied to the following correlation function:
| (1) |
where is a function that interpolate a sub-image of at coordinate with a squared shape of size tilted of an angle . The initial guess for the optimization algorithm is the position found with the FFT DIC algorithm and . In very few cases, when important grain rearrangements happen Barés et al. (2017a) (translation larger than px or large rotation), the initial guess is given manually by mean of a graphical interface. This permits, for each particle, to obtain a set of smaller images centered around the particle and aligned with the initial orientation of the particle (see orange bars in fig. 1d). Then, these sets of images where the solid rigid motion has been corrected, can be treated independently as pictures of a complex compression tests on fixed particles.
For each of these sets, the same large displacement DIC algorithm as the one used for a single particle is used Vu et al. (2019b). A regular grid is defined on the particle at the first step. This tiling defines correlation cells whose centers are tracked from one image to another to get the particle displacement field (see fig. 1d). Note that in this case the repair is attached to the particle. Just like it is done for the tracking of the particle centers previously described, the center of the correlation cells are tracked by first applying FFT DIC to have a rough estimation of the displacement. This estimation is then improved by maximizing a correlation function similar to the one given in eq. 1, but neglecting the rotation . The dimension of the correlation cells are px ( m) which is times larger than the typical size of the random pattern. This provides a displacement measurement with a strong accuracy: px ( nm). More details about the DIC algorithm are given in Vu et al. (2019b) and Barés et al. (2017b) and the Python codes are freely available DIC .
II.3 Local and global measurements
Many different observables are then, deduced from the displacement field measured at the grain scale. First, the evolution of the deformation gradient tensor, , is computed for each particle from following the definition Taber (2004):
| (2) |
with being the second order identity tensor. Similarly the evolution of right Cauchy-Green strain tensor, is obtained from Taber (2004):
| (3) |
Physically, the right Cauchy-Green strain tensor reflects the differences between the metrics of the deformed and undeformed bodies Taber (2004). It is related to the Green-Lagrangian strain tensor using . Under the small deformation assumption this last tensor turns out to be the strain tensor classically used in elasticity theory. In the large deformation case, is more commonly used than because its principal invariants are directly used to compute energy density functions and constitutive equations Taber (2004). These different principal invariants are also computed:
| (4) | ||||
It is worth noting that in the 2D case . The two eigenvalues, and (see fig. 1d), and corresponding eigenvectors, and of the right Cauchy-Green strain tensor are computed as well, along with the von Mises strain field: . In this study, since we compare materials with very different behaviors and elastic moduli, not to make any further assumptions about the exact material behaviors, we do not deal with the stress tensor nor the energy fields. Nevertheless we note that they could be directly deduced from the deformation gradient tensor Taber (2004); Vu et al. (2019b).
In the highly strained cases, as shown in fig. 1e and f, it is not possible to differentiate particle edges near the contact regions. So it is not possible to determine and track the particle boundaries directly from the raw images. To follow the evolution of the particle shape, the position of the correlation cells near the particle edges are tracked instead. For a given particle before the first compression step, the centers of the correlation cells belonging to the convex enveloped enclosing all the correlation cells are marked. They form the particle boundary which is followed by tracking the position of these points. A linear interpolation of these points gives the shape function in polar coordinate.
Contacts between particles are detected using these boundaries and the strain field information. If two particles have their edges closer than a certain threshold ( mm) and if, close to the particle boundaries ( mm), the von Mises strain differs from its average value by more the % (), then the particles are considered to be in contact. The choice of % is just above the noise measurement value. This high von Mises strain variation means that locally the deformation is high enough to consider that the contact actually bears a force. The contact length is directly deduced from this criterion applied locally (see fig. 1d) and the specific contact length, , is then defined as the ratio between this contact lengths and the particle perimeter.
From the shape function of each particle, we also define the anisotropy, , as the ratio between the size of the particle along its shortest direction () over its size along its largest direction (). This last major direction is recorded as . The particle asphericity, , is also computed from as Boromand et al. (2018):
| (5) |
where is the particle perimeter and is the particle area. So, for each particle at the compression step, we measure:
-
•
the position, ; and orientation, ,
-
•
the displacement field, ,
-
•
the deformation gradient tensor, ,
-
•
the right Cauchy-Green strain tensor, ; its principal invariants, ; its eigenvalues, ; its eigenvectors, ; and its von Mises field ,
-
•
the shape and the deduced anisotropy, ; asphericity, ; and major direction, .
-
•
the contact regions and their lengths.
As shown in fig. 1d, voids surrounding the particles are also detected. From the particle positions and shapes, a binarized images are built with everywhere except in regions covered by particles. Disconnected islands in these pictures form voids. To avoid boundary effects only voids that are not in contact with the system edges are kept. Just like for the particles shape, areas, , and asphericity, (see eq. 5), are computed. For each void region, the solidity, , is also defined as the ratio between the area of the void and the area of the smallest convex region including this void.
At the global scale, apart from the compression stress, , defined as the measured force over the system width, we also measure the evolution of the packing fraction, , the coordination, , and the fraction of non-rattlers (NR), . The packing fraction is defined as the ratio between the area of the box prescribing the particles and the sum of the particle areas measured from their initial shape . This definition implies that can be greater than for compressible materials. The coordination, , is the ratio between the total number of contacts in the system and the number of NR particles Göncü et al. (2010); Bi et al. (2011). NR are particles with at least two force-bearing contacts. The fraction of NR, , is simply the number of NR particles over the total number of particles.
These quantities have been measured for three experiments with hyperelastic particles and three experiments with plastic particles. Each time initial configurations were different. Most of the graphs shown in this paper plot data from two significant experiments, one for each sort of materials. When specified, plots also show results averaged over the three experiments.
III Results
III.1 Global observables
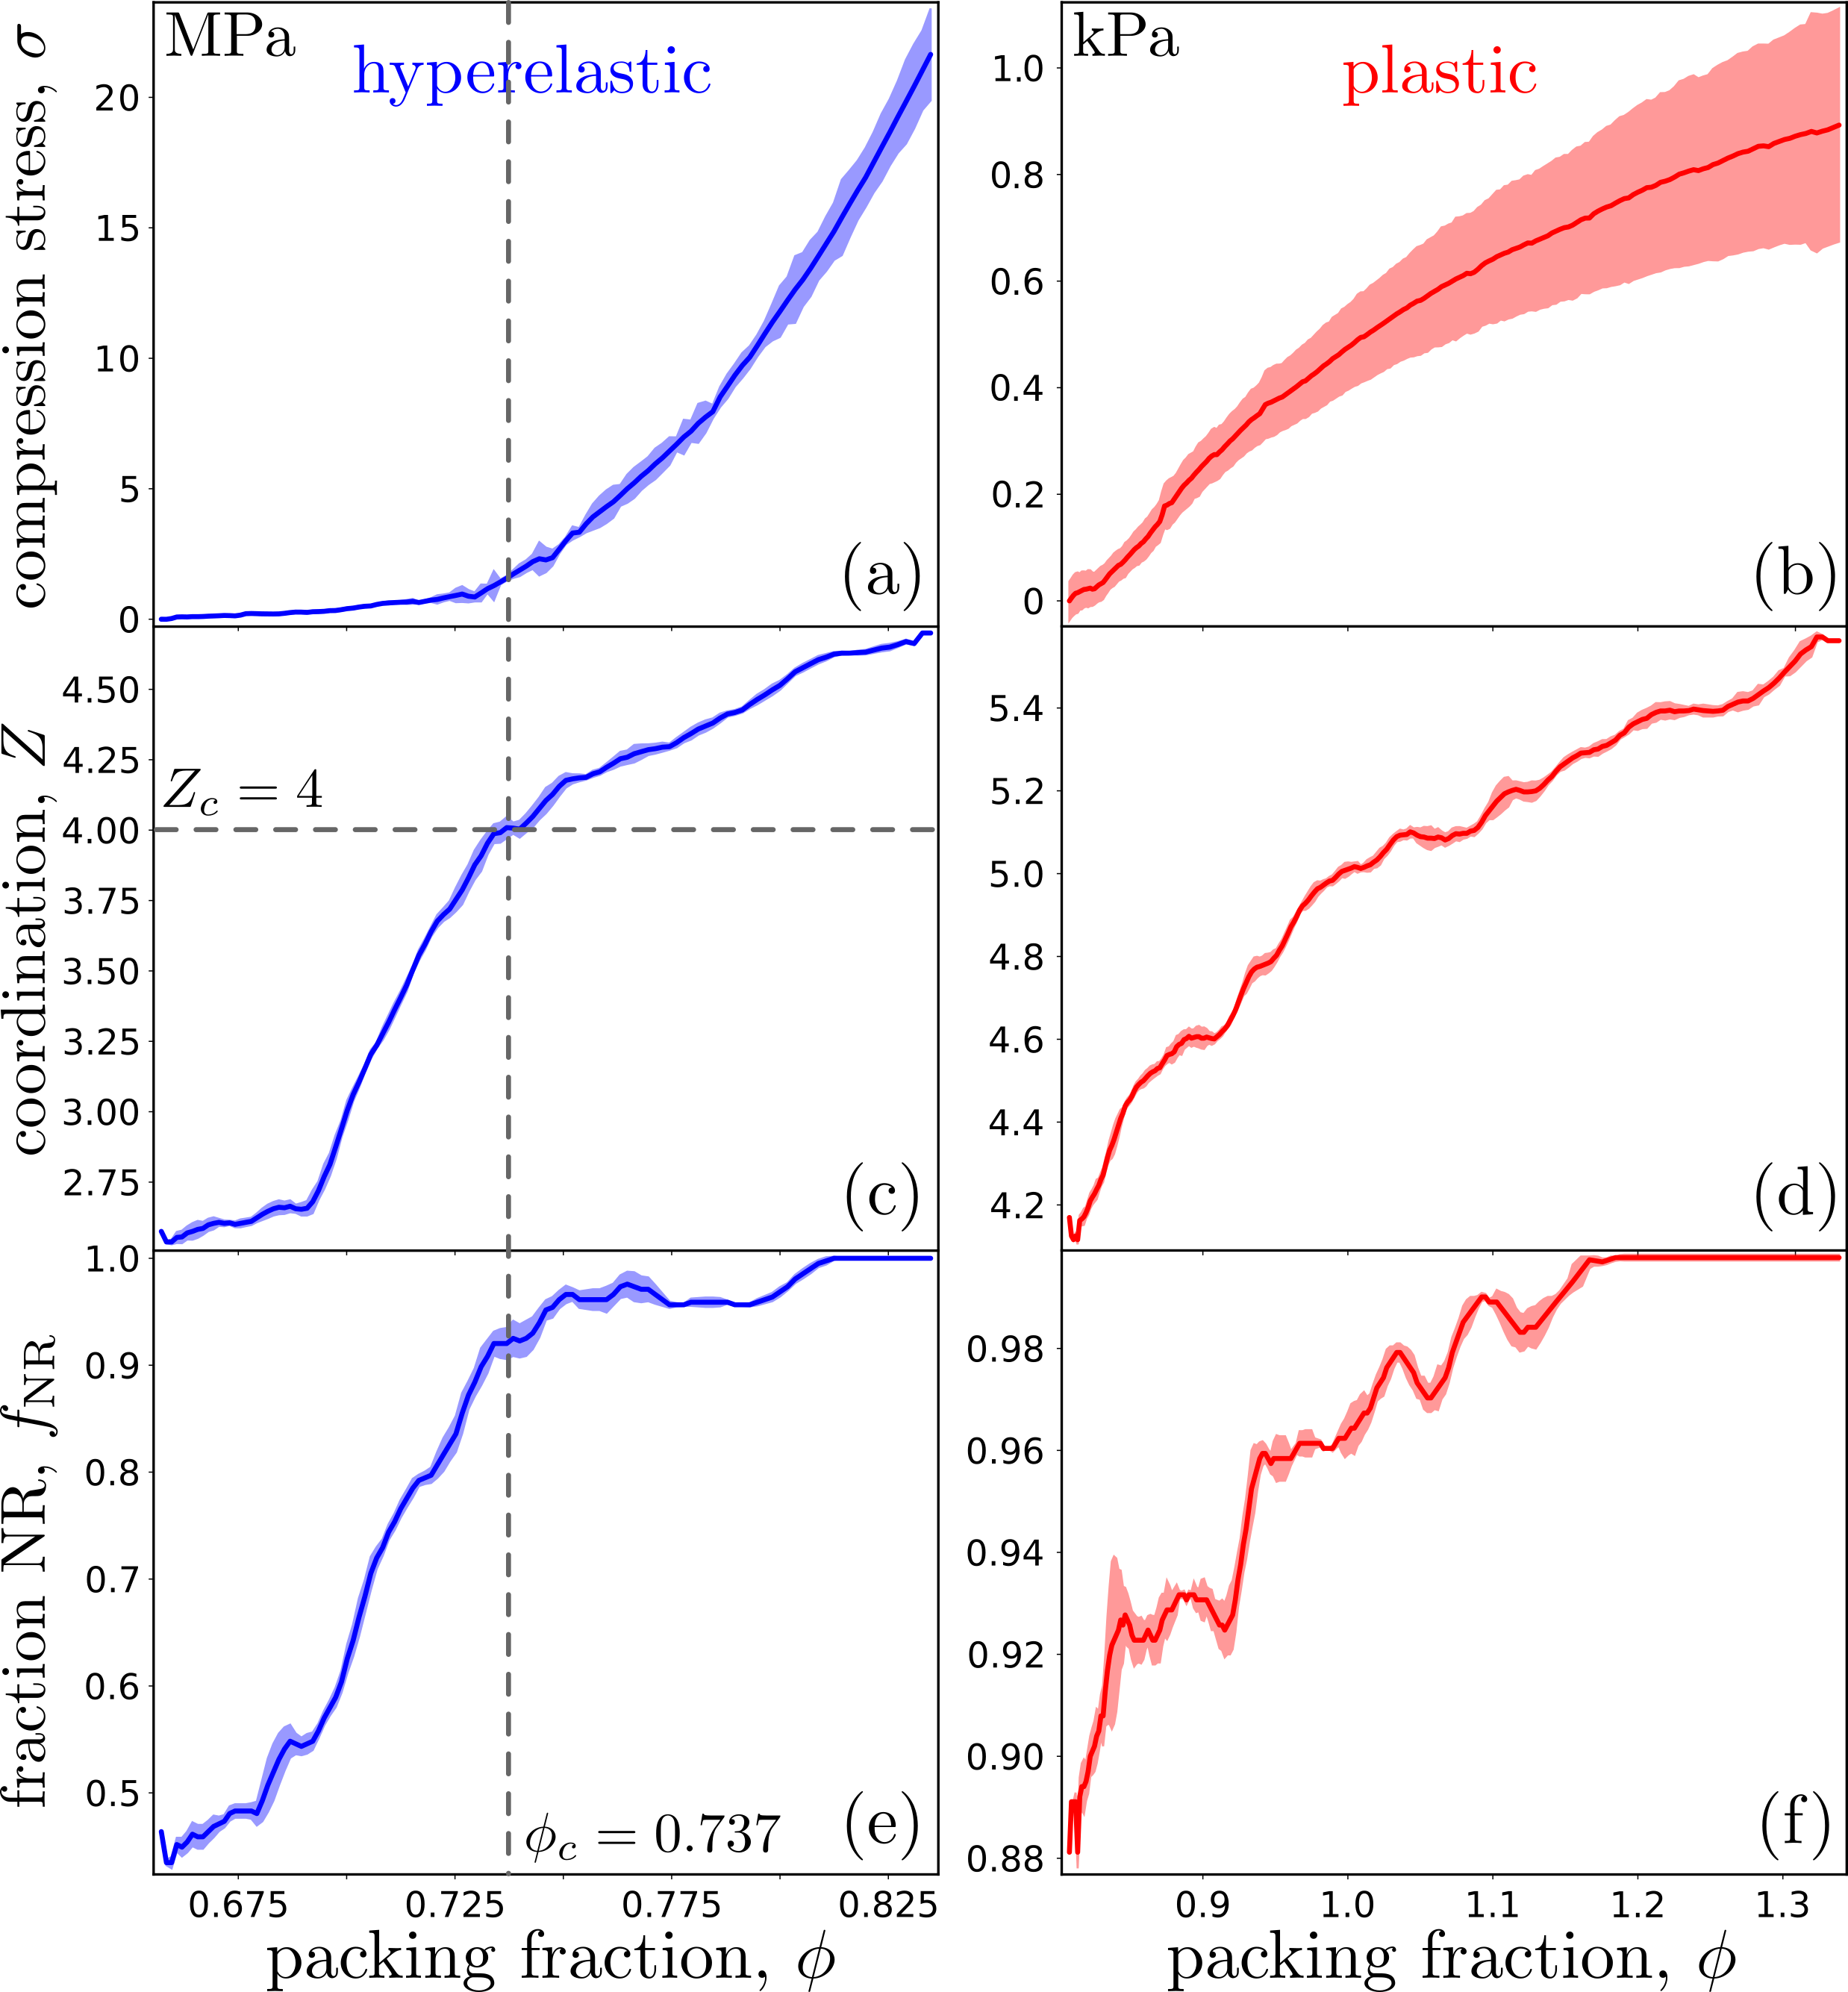
For two typical experiments fig. 2a and b show the evolution of the global stress, , as a function of the packing fraction, , for hyperelastic and plastic particles respectively. In the first case after a transient regime where the stress stays close to , it rapidly increases with a superlinear regime. On the contrary for plastic particles, directly enters a sublinear regime. In both cases no saturation regime is observed. The two regimes found for hyperelastic particles correspond with the unjammed and jammed states Liu and Nagel (1998); O’hern et al. (2003); van Hecke (2009). In the first state, each particle can move without impediment from their neighbors and the bulk modulus is zeros. This regime is favored by the fact that particles are slippery. Then, when increasing the packing fraction, particles cannot significantly rearrange any more and the system develops a yield stress in a disordered state; it can resist the loading. The local evolution of the packing deep in this last regime is what we mainly investigate in this paper.
As emphasized in the rest of the fig. 2 explained in the next paragraphs, the jamming transition happens at a critical packing fraction . This value significantly varies from one experiment to another () because it depends on the initial conditions due to the small system size. More importantly, it is lower than the random close packing value ( O’Hern et al. (2002)) expected to correspond with the jamming point for frictionless particles isotropically stressed. This low value comes from the fact that () the particles we used are not perfectly frictionless, () boundaries are frictional, () lubricating liquids induce attractive capilary bridges between particles Halsey and Levine (1998); Mason et al. (1999) () the compression is uniaxial and () the system is quite small so that the jamming packing fraction lays in a broad range O’hern et al. (2003). In the plastic case (fig. 2b), the system is prepared with a large initial density and enters the jamming regime at the beginning of the experiment; the unjammed regime is barely not observed.
For the same experiments, in fig. 2c and d, we show the evolution of the coordination number, , as a function of the packing fraction, , for hyperelastic and plastic particles respectively. In the case of hyperelastic particles, after a short regime where stays just above contacts per grain it rapidly increases up to after . Then, it increases slowly in a regime similar to the one observed for plastic particles. This last regime is in agreement with the square root increase already observed in the jammed state for many different experimental systems and numerical simulations Durian (1995); O’hern et al. (2003); Majmudar et al. (2007); Katgert and van Hecke (2010); Winkelmann et al. (2017). However, this finding does not agree the linear regime observed for soap bubbles Winkelmann et al. (2017). This is most likely due to the fact that in this latter case, particles are not made of a bulk material so their individual mechanical behavior is significantly different of our systems. The jamming point is crossed for which corresponds with the isostatic point for perfectly slippery particles van Hecke (2009); above the system, in the jammed state, is more and more hyperstatic. One more time, the fact that the jamming point is crossed slightly below is most likely due to residual friction and the capillary attraction between particles.
Figure 2e and f show the evolution of the fraction of NR, , as a function of for the two sorts of particles. In both cases this quantity increases non-monotonously until it reaches a saturation value, , where all the particles are in contact with their neighbors as we can see in fig. 1e and f. In the case of hyperelastic materials, before the jamming point, rapidly increases on the same range as . Then, it reaches the jamming point at a critical value . The same observation is made for plastic particles. The value is larger than the one measured for frictional particles () jammed by shear Behringer (2015).
Apart from the stress variation in the jammed state, at the global scale, there are no significant differences between the evolution of the systems made of hyperelastic particles and the ones made of plastic ones. In both cases, the fact that curves (, and ) are not smooth is explained by the sharp grain rearrangements during the compression process reminiscent of what is observed during the shear process Barés et al. (2017a). It is also worth noting that even with the shapes are the same, due to the small system size and the different initial conditions, from one experiment to the other, , and curves do not collapse.
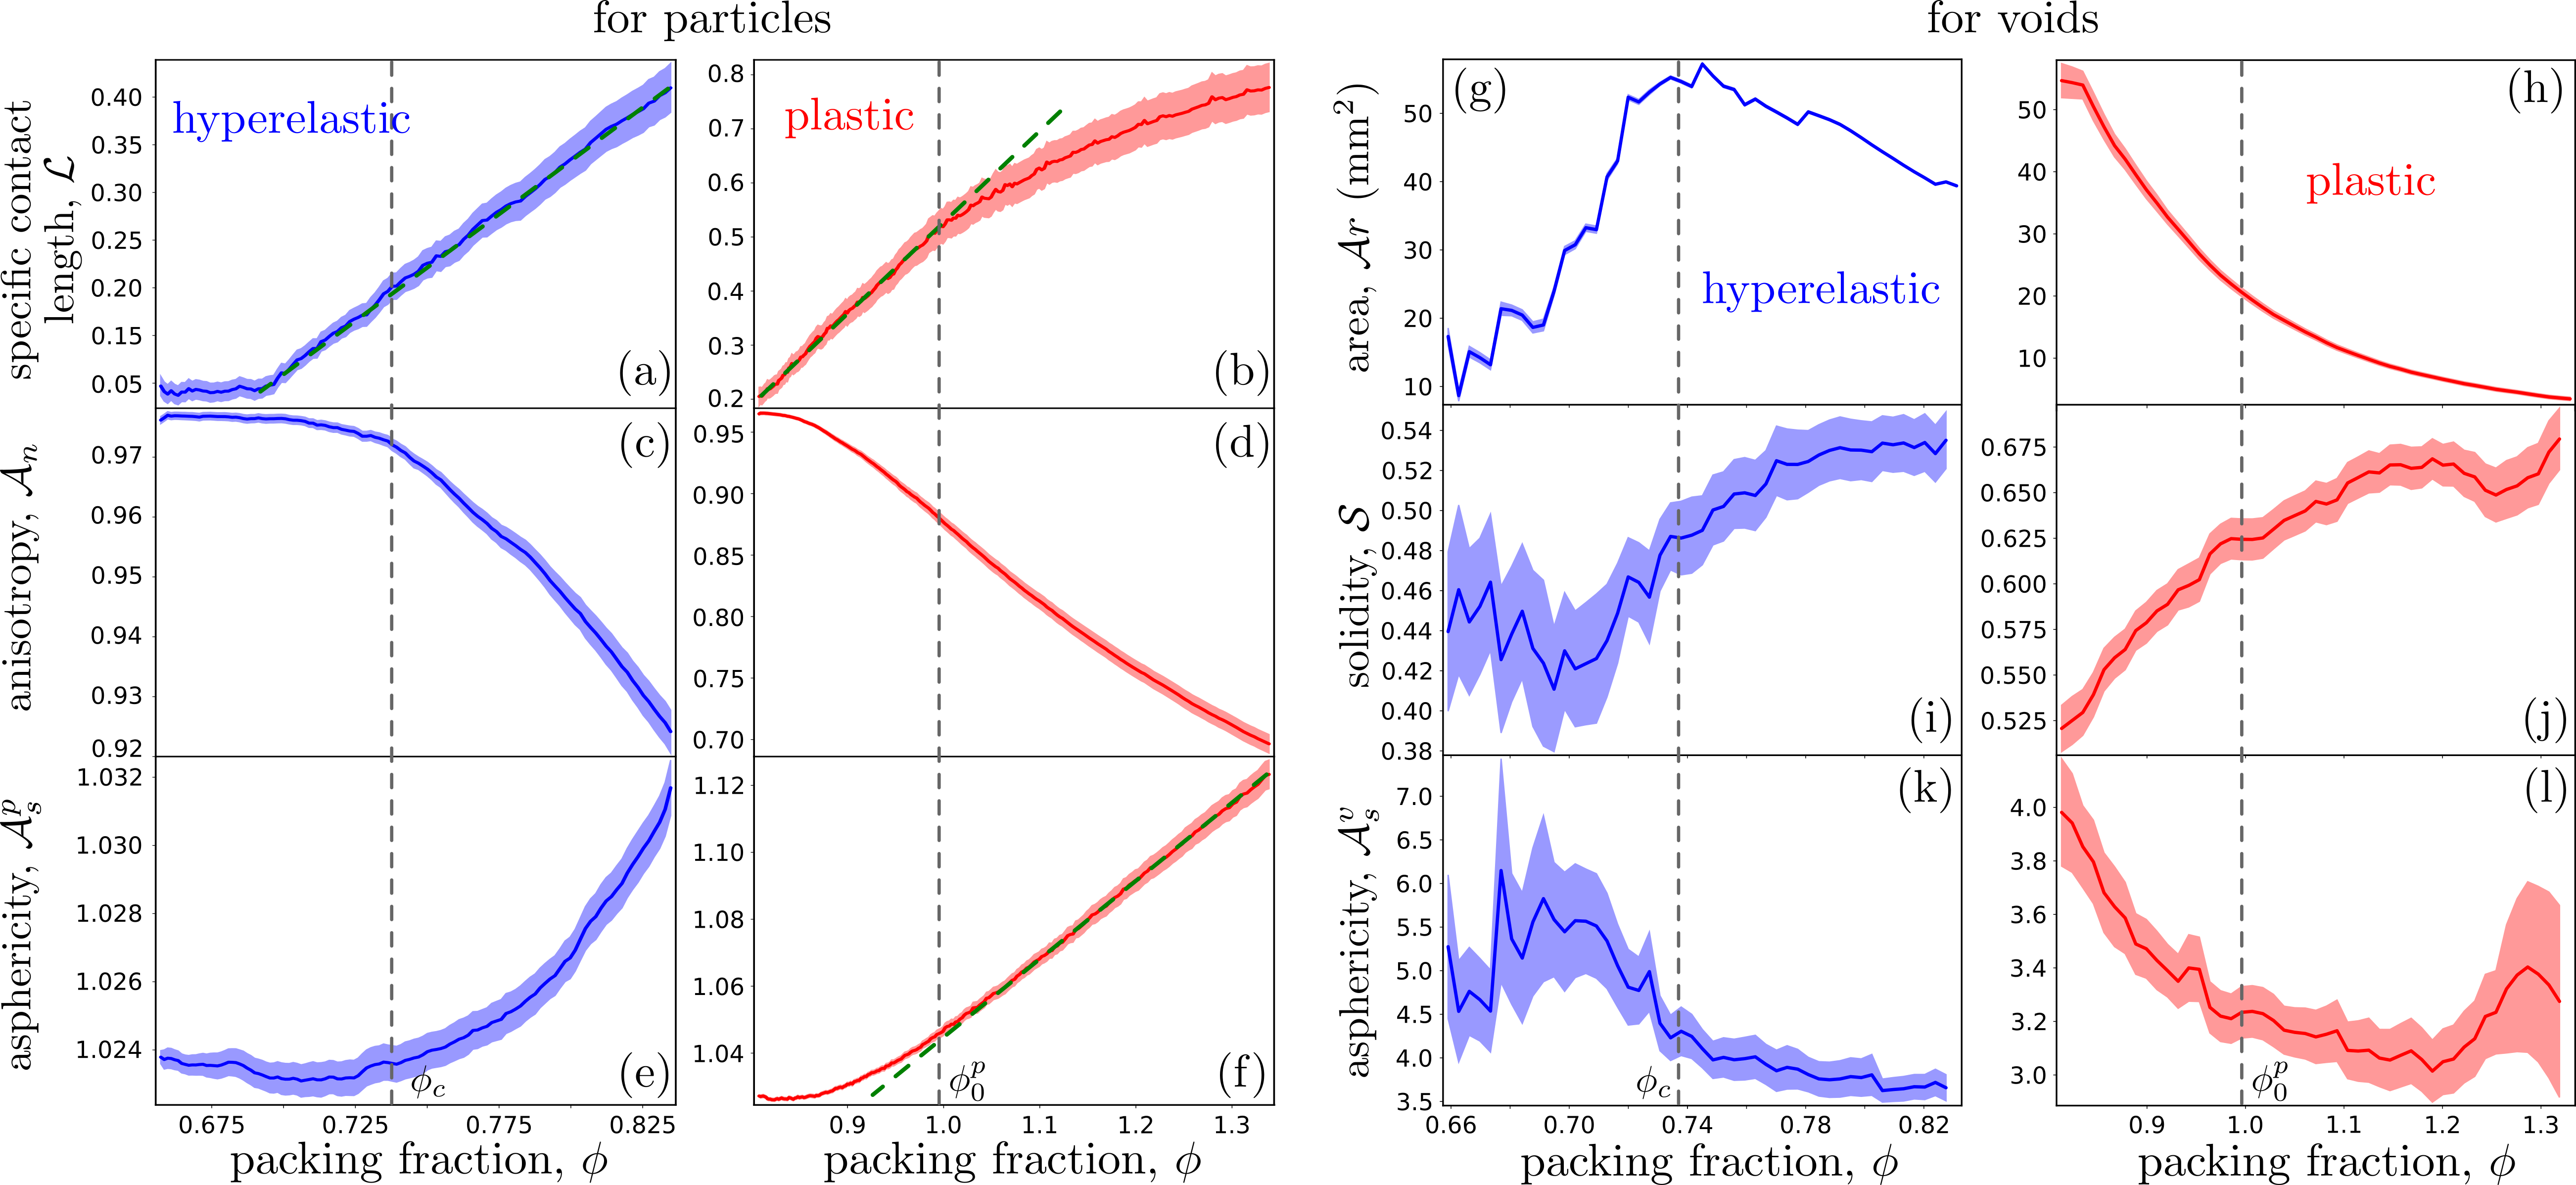
For the same typical experiments as the ones used for fig. 2, in fig. 3a and b, we show the evolution of the average specific contact length, , during the compression process for hyperelastic and plastic particles respectively. In the hyperelastic case after a short transient regime where stays below the noise measurement level, it then increases linearly with slope just before the jamming transition point. The beginning of the linear increase () corresponds with the growth of the coordination in fig. 2c. It corresponds with the beginning of the force chain building up due to finite size effects (arches in the system) and residual basal friction. In the plastic particle case, this increase is also linear with slope until a crossover around ; then it becomes sublinear. Contrary to , the value of this crossover is stable from one experiment to another, it does not significantly depend on the initial conditions.
The particle average anisotropy, and the asphericity are plotted as a function of the packing fraction for hyperelastic and plastic particles in fig. 3c to f respectively. For hyperelastic particles, and stay close to before jamming () and then rapidly decrease and increase respectively after the jamming point. This evidences an important and continuous deformation of the particles from their initial circular shape. Both values are not exactly in the undeformed configuration since they are computed using a polygonal interpolation () of the circular particles. For plastic particles, first slowly decreases and then keeps on decreasing sublinearly. For , the curve progressively increases and enters a linear regime with slope from the crossover point . We note that around the jamming point follows the same tendency as the one evidenced by Boromand et al. (2018) for numerical simulations of squeezed polygons and that the maximum asphericity () is also close to the maximum they found ().
Figures 3g and h show the evolution of the total void area , as a function of for hyperelastic and plastic particles respectively. In the first case the total void area erratically increases up to the jamming point were almost all the interstitial voids are formed thanks to the particle rearrangements and induced contact nucleations. Then decreases due to the particle deformation and the flow of the particle matter toward the voids. In the plastic case the system is very close to jamming at the beginning and most the voids are already formed. So it directly and sharply decreases in a sublinear manner.
Figures 3g to l show the evolution of the average void solidity and asphericity , as a function of the packing fraction for hyperelastic and plastic particles respectively. In the case of hyperelastic particles, both and are constant within their error bars until reaches the point where the coordination and the fraction of NR begin to increase ( in fig. 2c and e). Then, increases and decreases until they both reach a plateau value. In the case of plastic particles and directly increases and decreases respectively and then both plateau around a constant value. The plateau values correspond with the fact that the void are formed and their shapes evolve only homothetically while their areas decrease.
III.2 Local observables statistics
III.2.1 Particle geometry
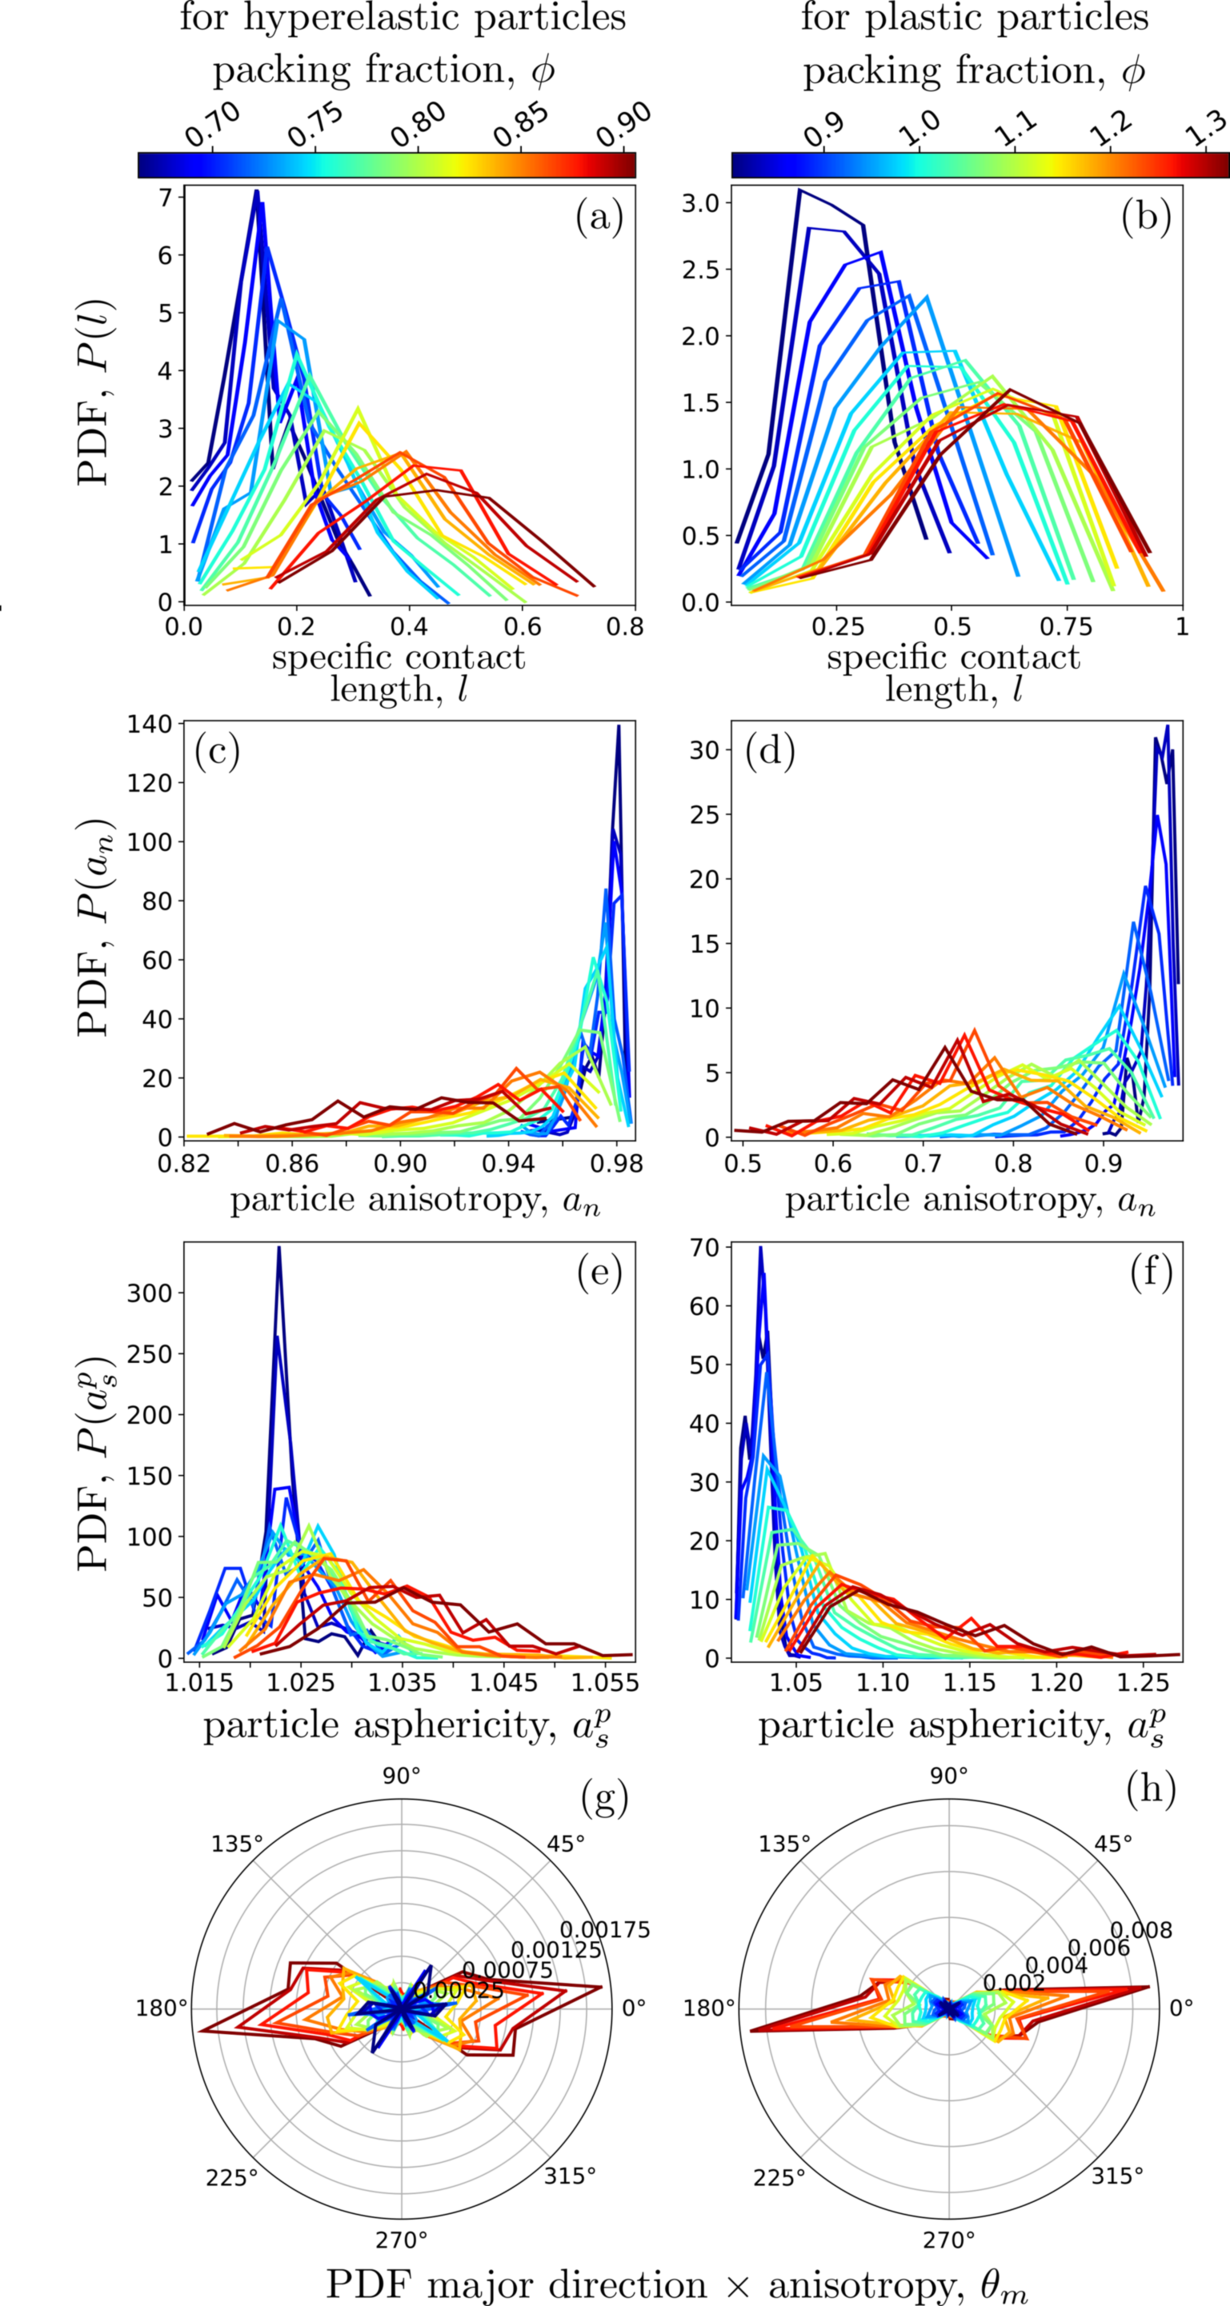
Figures 4a and b show how the probability density function (PDF) of the specific contact lengths, , evolves with for experiments with hyperelastic and plastic particles respectively. These lengths are computed for each particle and PDFs are averaged over three experiments for each material. For both materials, the PDFs are Gaussian-like with increasing mean and standard deviation values. This means that more and more contacts are created and also that their individual length increases with a broader and broader diversity in size. In the plastic case for , the curves collapse which means that the contact network of the packing is frozen. In this case the individual contact lengths barely increase, the evolution of the system is mainly due to the compressibility of the particle material. This is in agreement with the fact for void shapes do not evolve as seen in fig. 3h, j and l.
In fig. 4c and d we show the evolution of the particle anisotropy PDF, , as a function of the packing fraction for experiments with hyperelastic and plastic particles respectively. These anisotropies are computed for each particle and PDFs are averaged over three experiments for each material. At first the particle anisotropies are all very close to so is a narrow Gaussian centered around this value. This corresponds this the fact that particles are undeformed. When compressing, for both materials, the average value decreases while the standard deviation rapidly increases. This means that particles are deformed with a broad range of shape diversity, the ones involved in strong force chains being more deformed than the others. In the case of plastic particles, for highly deformed states – typically – a broad Gaussian-like peak re-appears which means that most of the particles are deformed with the same manner; they form polygons with sharp edges as shown in fig. 1f.
Figures 4e and f show the evolution of the grain asphericity PDF, , for experiments with hyperelastic and plastic particles respectively. These quantities, , are computed for each particle and PDFs are averaged over three experiments for each material. As for the anisotropy, at the beginning, the particle asphericities are concentrated around , when particles are not deformed. Then when the compression level increases, average value increases as well as standard deviation. However, unlike for and no saturation regime is observed for plastic particles, keeps on evolving even at high packing fraction.
In fig. 4g and h we show the evolution of the particle major direction, , distribution, as a function of the packing fraction for experiments with hyperelastic and plastic particles respectively. By sake of clarity, the major direction of each particle is multiplied by its anisotropy before computing the PDFs. Also, PDFs are averaged over three experiments for each material. For both materials, at the beginning of the compression no preferred direction appear for the particle geometry, the behavior is reminiscent of an isotropic compression. This is due to the fact that particle can rearrange to homogenize the strain in the system. However, after few percent of deformation, a preferred direction emerges and amplifies; particles flatten long the normal direction to the compression axis. As the compression strain level is higher for plastic particles, the major direction PDF has a larger amplitude.
III.2.2 Void geometry
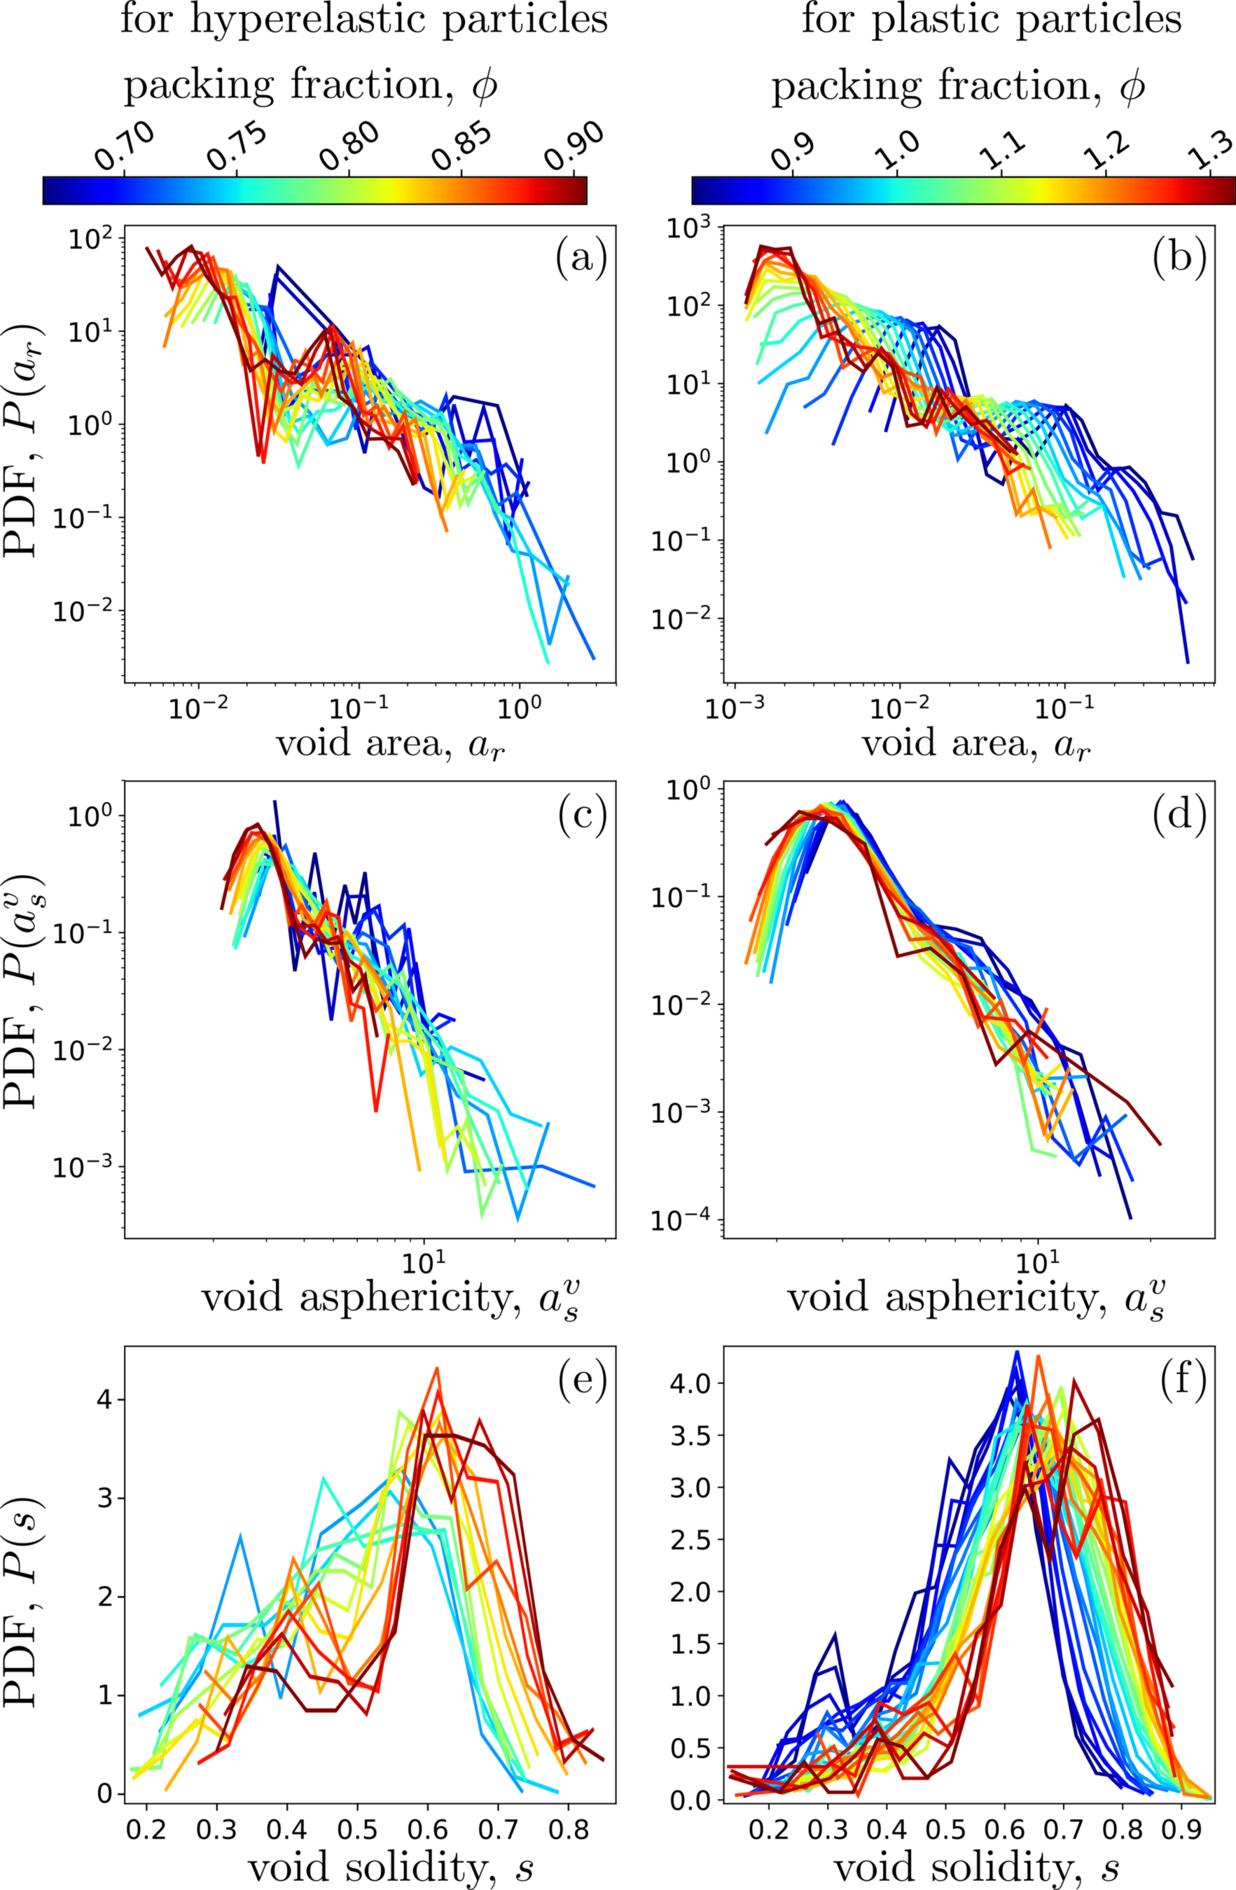
In fig. 5 we show the evolution of the PDFs of the different void geometry observables during the compression process. Figures 5a and b plot the PDFs of the scaled void areas, , for hyperelastic and plastic particles respectively. These PDFs span several orders of magnitude and are aligned along power-laws that shift toward smaller relative areas when the packing fraction increase. Figures 5c and d present the PDFs of the void asphericities, , when increases for the two same experiments. In both hyperelastic and plastic cases PDFs collapse on a master curve. Most of the voids have an asphericity value around and a power-law tail describe the values of the remaining ones. Figures 5e and f show the PDF of the void solidity, , for increasing packing fraction for hyperelastic and plastic experiments respectively. In both cases most of the voids have a solidity value around and this value slightly increases with the packing fraction. Whatever is the observable there is no significant differences between the evolution of the void geometries in the hyperelastic and the plastic cases.
III.3 Strain field evolution
Beyond the geometrical aspects, the DIC at the grain scale gives information about the local strain in the system. Below the jamming point, this strain stays negligible; even if it does not exactly vanish due mainly to boundary effects – force chains along walls for example. On the contrary, above the jamming point in the highly deformed regime, the strain field can reach high levels and becomes a relevant quantity to study the granular packing evolutions.
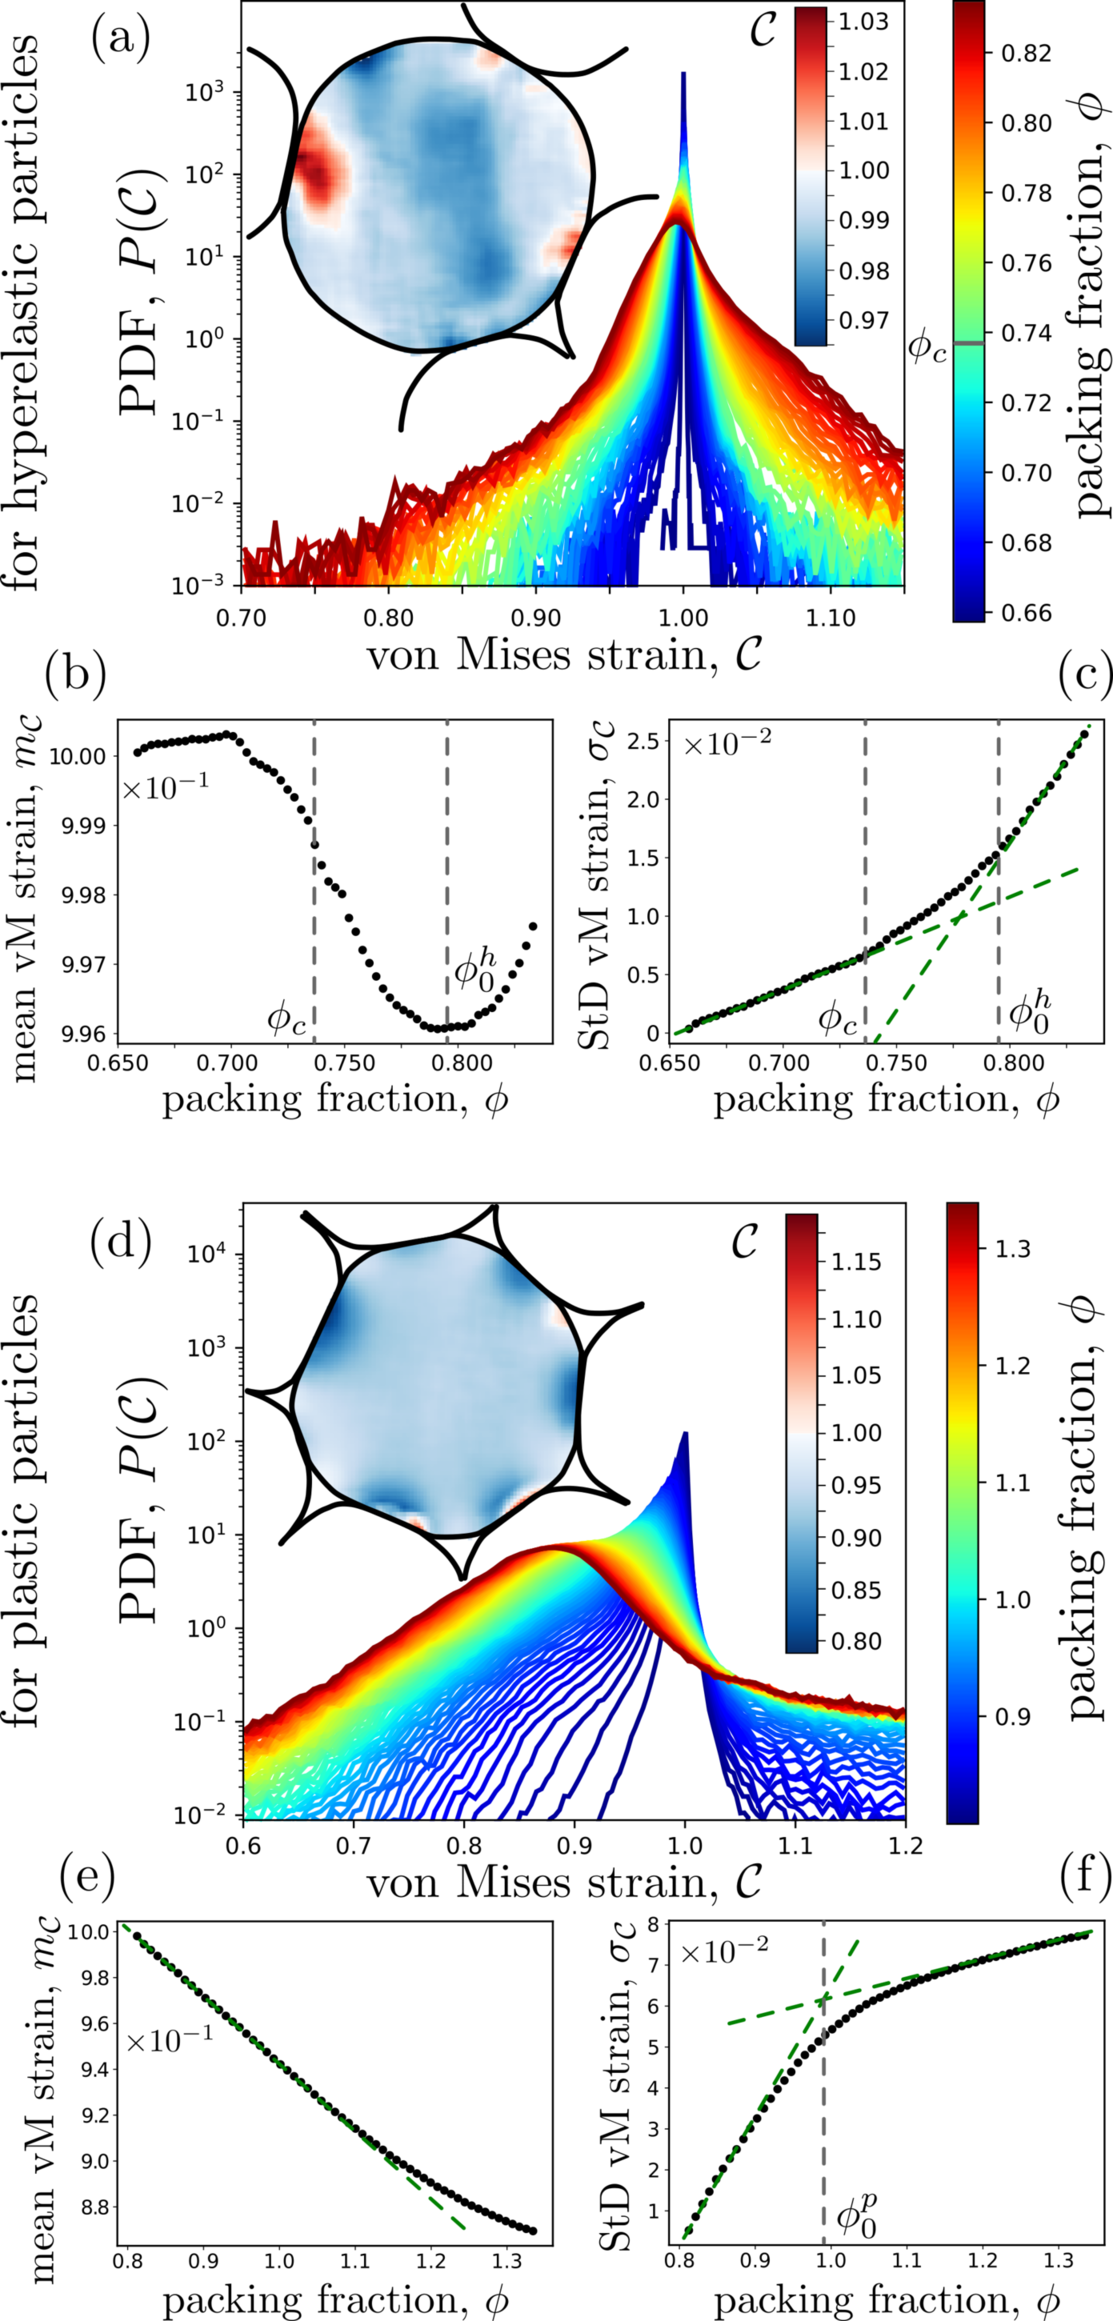
Figure 6a shows the evolution of the the von Mises strain PDF measured for all the particles of a typical experiment carried out with hyperelastic material. At the beginning of the compression, is a sharp Gaussian centered around with a very narrow standard deviation induced by the noise measurement level. This almost constant value is due to the fact that the whole system is unloaded so no deformation is measured and . For higher packing fraction the distribution shifts to the left and gets broader and broader. This left shifting comes from the fact that the system is continuously compressed so the von Mises strain gets smaller than . However, as shown in the inset of fig. 6a, for areas near the strongly loaded edges, instead of being smaller than , is slightly greater. This comes from the material incompressibility: instead of being only squeezed, in Eulerian coordinates, matter is pushed apart normally to the compression direction making the right Cauchy-Green strain larger than . This is in agreement with what is shown in fig. 6b. The mean value of the distribution, , stays first close to and then begins to decrease rapidly around the jamming point – . This corresponds with the fact that just before jamming the system forms weak force chains percolating only in the compression direction so slowly begins to decrease before jamming. At the jamming point, force chains percolate in every direction so compression strain increases in more and more particles and decreases on average. It reaches a minimum for and then increases back. This corresponds to the point where material dilation due to matter incompressibility begins to grow faster than material compression (see field in the inset of fig. 6a).
This is also in agreement with fig. 6c showing the evolution of the von Mises strain standard deviation, . This quantity continuously increases. Below the jamming point and above , grows linearly with with slopes and respectively. In between a smooth crossover is observed. It corresponds with the fact that matter dilation increases faster making the standard deviation of getting larger and larger. This also explains why in log-scale the PDF tails of appears asymmetrical: There is no reason for the dilation and compression areas to have the same statistical distribution. We note here that this asymmetricality is very gentle and only seen in log-scale. So even if not shown here for the sake of conciseness, the skewness of does not change significantly around and .
In fig. 6d, we plot when increases for a typical experiment with plastic particles. As observed for hyperelastic particles, it first follows a sharp Gaussian centered around . However, it differs for highly stained states since the peak position rapidly decreases to the left hand side. Contrary to what is observed for hyperelastic material, this peak never turns back to higher values because of the material compressibility. As shown in the inset of fig. 6d, except in very narrow areas close to the most loaded contacts where the incompressibility assumption is less pertinent, the strain is always smaller than : Material compressibility does not induce matter rearrangements normally to the compression direction. The monotonous shift of the peak is also evidenced by fig. 6e, that shows the mean von Mises strain, , decreasing linearly with (slope ) before saturating for packing fractions larger than . On the contrary, the standard deviation, , increases first linearly with slope and after a crossover centered around increases with a less stiff slope (). This crossover deep in the jammed regime around evidences a microscopic change in the granular matter behavior. One more time it could be explained by the competition between compression and dilation, even if this latter is less strong than the one observed from hyperelastic material. In the plastic case, PDF tails are also asymmetrical, with almost not values larger than and an exponential left hand side tail.
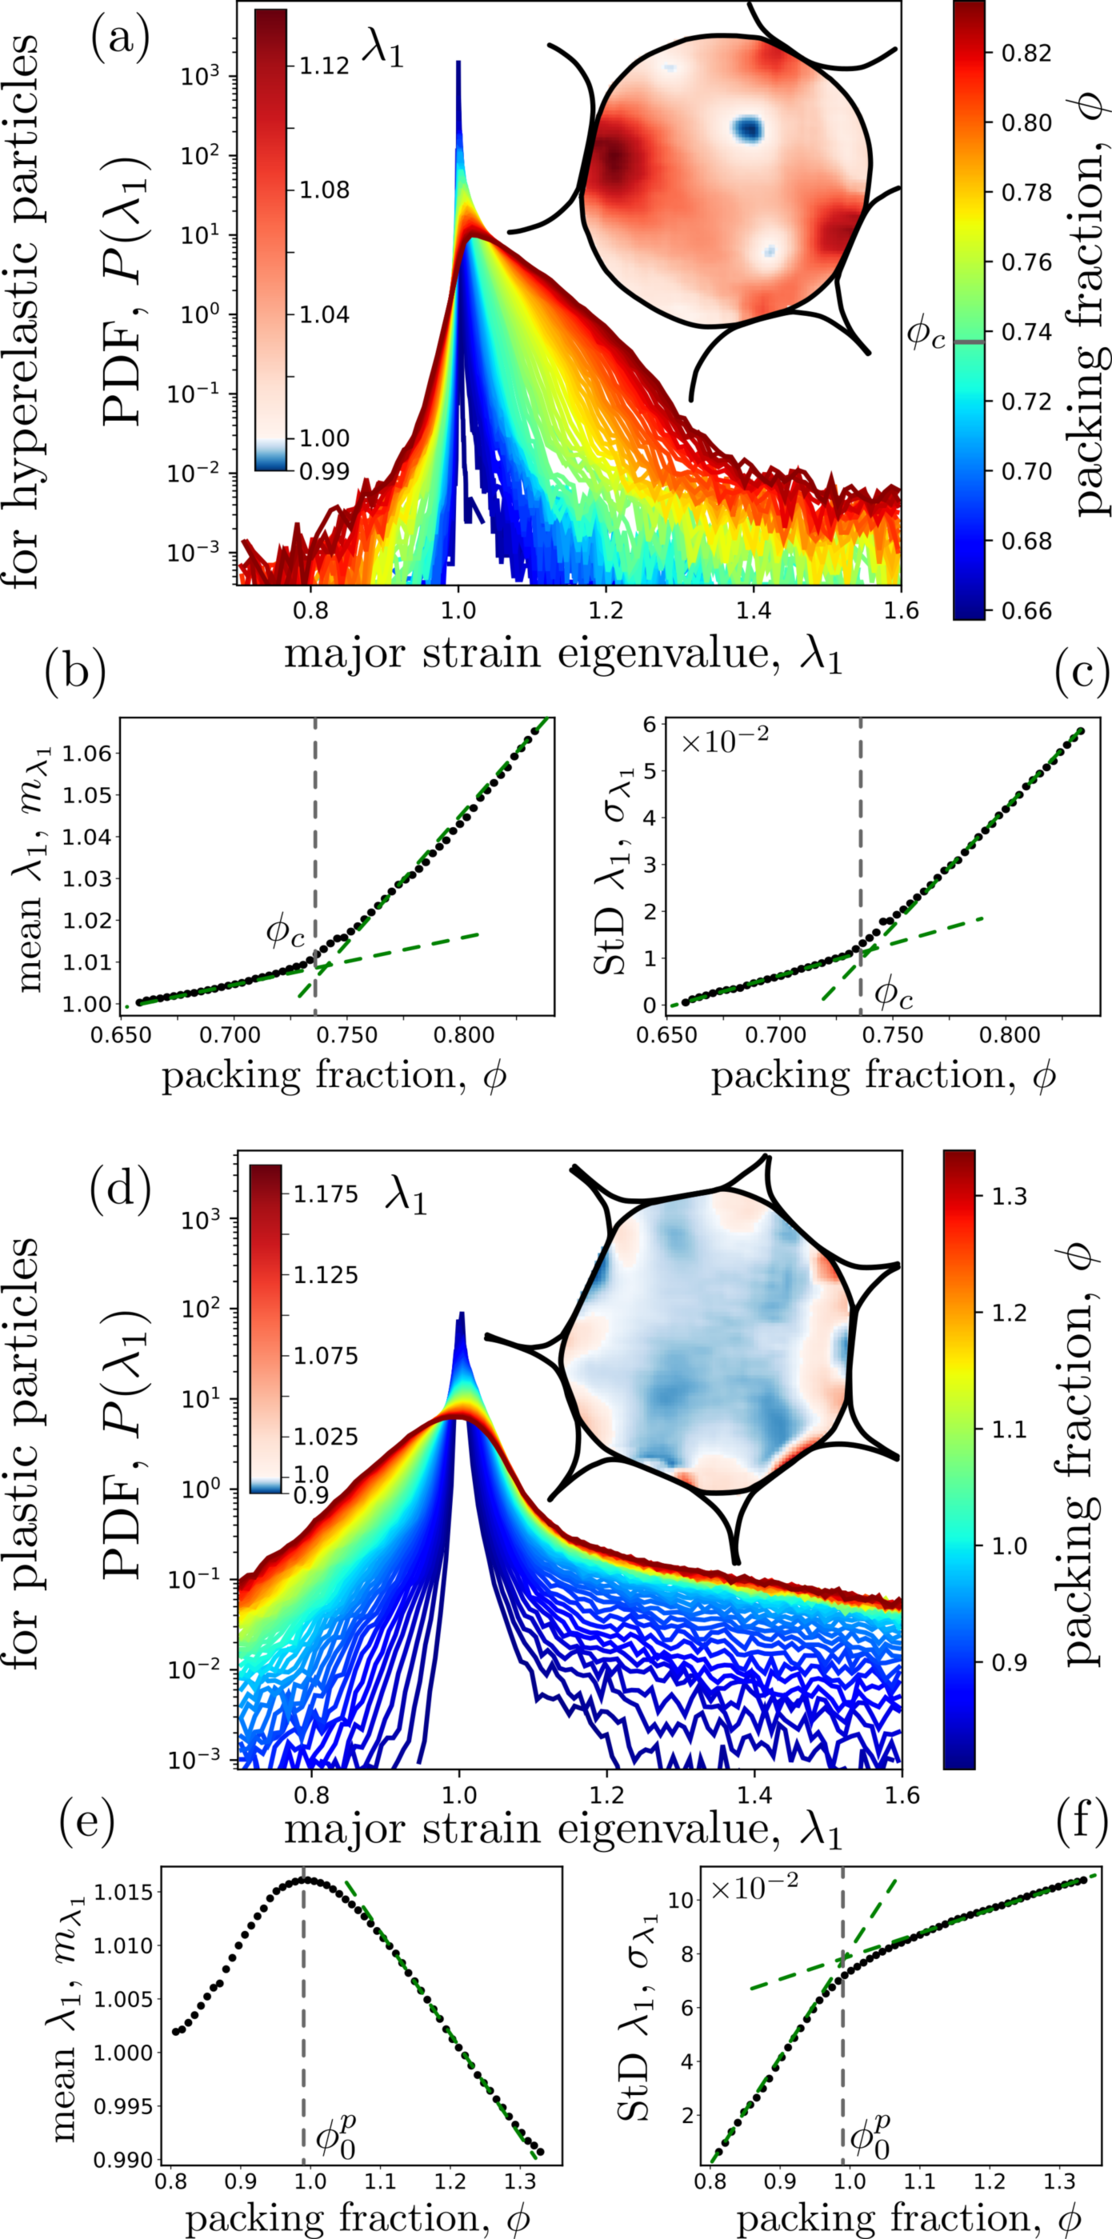
In fig. 7a, we show the PDFs of the first eigenvalue of the right Cauchy-Green strain tensor,, for increasing packing fractions when compressing hyperelastic particles. As observed for the von Mises strain in fig. 6a, for weakly strained systems, is a narrow Gaussian distribution centered around since there is almost no deformation. As shown in the inset of fig. 7a, increases where the matter is loaded and stays close to where the system remains unstrained. This implies that, when increases, the mean value of , , and its standard derivation, grow (see fig. 7b and c). Both increase linearly in the unjammed and jammed regimes with a crossover in between, at . We note that we do not see any inflexion of the curves near . We believe this is due to the fact that is not a sensitive marker of the competition between compression and dilation of the hyperelastic matter.
Figure 10d show the evolution of during the compression of plastic particles. Similarly to what is observed for hyperelastic particles, the goes from a sharp Gaussian centered around at low compression level to a broader distribution with an exponential tail at low and a rapidly then slowly decreasing value for high . The inset of 10d shows the field of a particle for a packing fraction near . Its value seems to be higher in areas where matter is sheared and close to elsewhere. As shown in fig. 10e, the average value of first increases with until it reaches a maximum value for . It then decreases linearly with slope . We believe this maximum value corresponds to a point where on average, the particles are so deformed that isotropic compression dominate over shear. The standard deviation of whose evolution with is shown in fig. 10f follows the same tendency as presented in fig. 6f; it follows two different linear regimes with slopes and separated by a smooth crossover at .
For both hyperelastic and plastic particles, we observe asymmetric PDF tails, that are not related to the skewness, when the systems are squeezed. This is due to the intrinsic asymmetrical nature of the eigenvalues. We also note that the same analysis has been done for the second and complementary eigenvalue of , . We have found curves that are symmetric with respect to the axis and made similar conclusions.
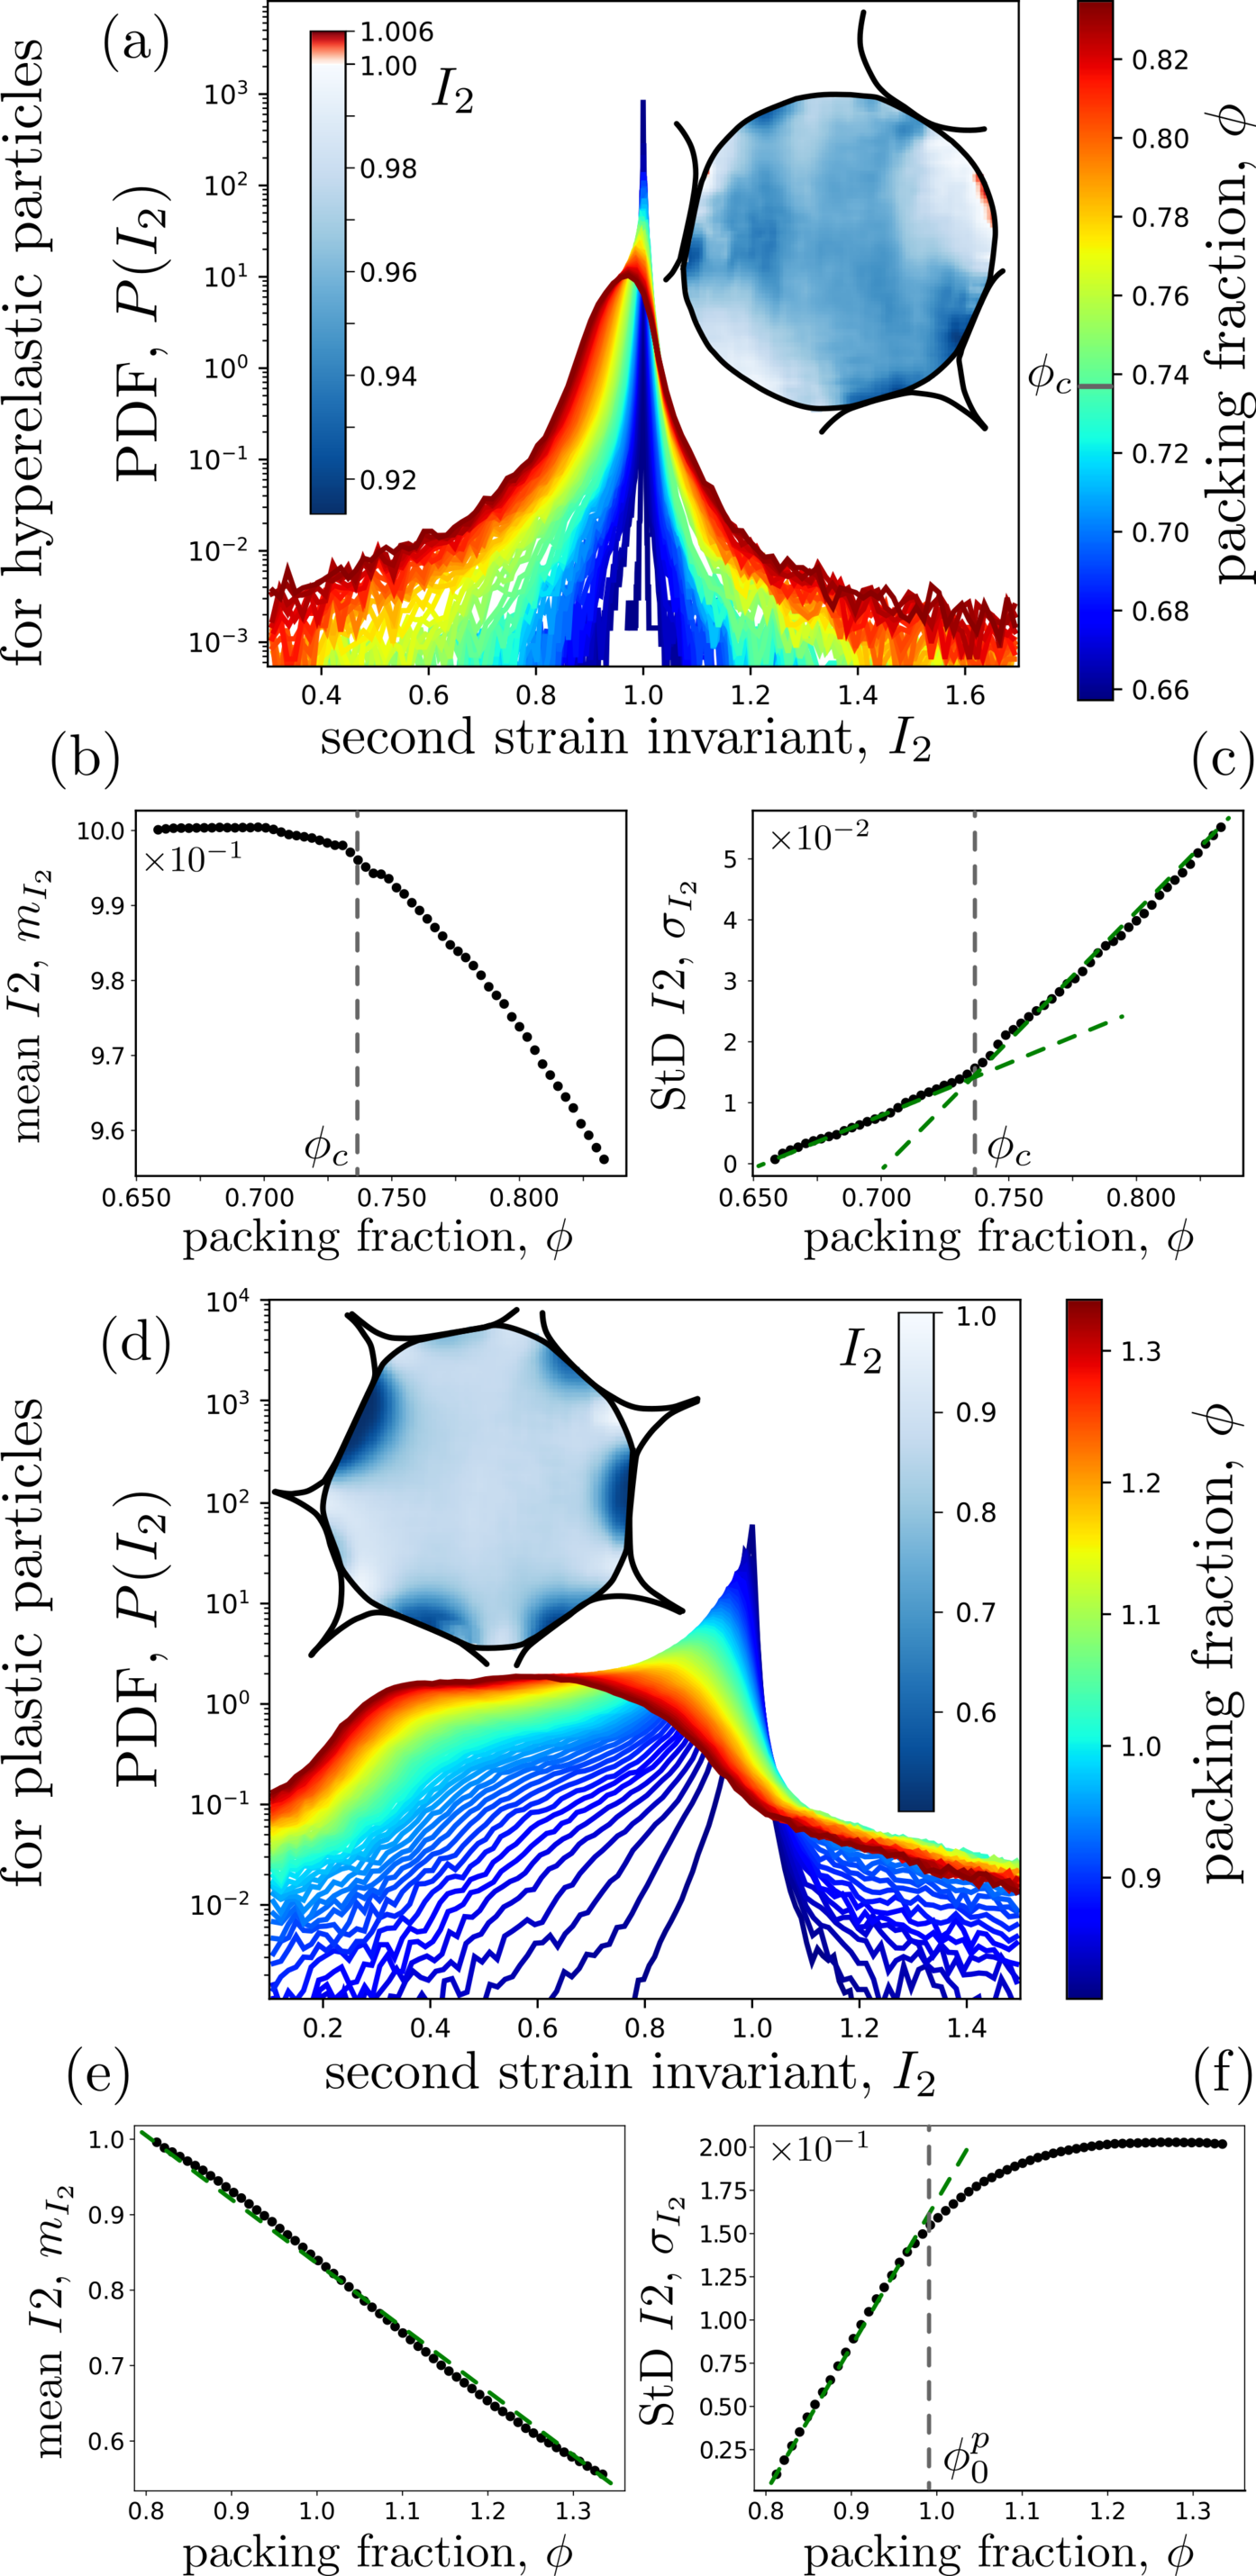
Figure 8a shows the evolution of the PDF of the second principal invariant of measured for all the particles of a typical experiment carried out with hyperelastic material. For low packing fraction, is a narrow Gaussian centered around . When increases this mean value decreases but the PDF stays symmetric contrary to what has been observed for and . In 2D, which is the square of the dilation ratio Taber (2004) in Lagrangian coordinates. So, as shown in the in set of fig. 8a, where the particle is squeezed, where there is no deformation and where material expands. This is in agreement with what is shown in fig. 8b and c. The evolution of mean and standard deviation of , and respectively display two different regimes. In the unjammed state, stays constant and linearly increases with a slop of . After a crossover around the jamming point (), rapidly decreases and increases linearly with a steeper slope (). The decrease of after corresponds with the global squeezing of the system while the increase of corresponds with the fact that particle material is more and more split between compression and expansion areas.
In fig. 8d, we plot for increasing for a typical experiment with plastic particles. Like for hyperelastic particles, it first follows a sharp Gaussian regime centered around . When the packing fraction increases, the peak shift to the left and becomes wider and wider until displays a broad plateau between and . As shown in the inset of fig. 8d, due to the almost perfect particle compressibility, is lower than everywhere and smaller close to the contact points where the squeezing is maximum. Figure 8e shows that, surprisingly the mean second invariant value evolves linearly with decreasing with slope . No inflection is observed around . However, as shown in fig. 8f, below the standard deviation of increases linearly with slope while it plateaus above. One more time, this evidences a microscopic change in the granular matter behavior. We believe it is explained by the fact that above the system is so deformed that there are almost no void anymore and the matter deforms homogeneously in the compression direction just like a bulk material would do. We also note that the plateau observed in fig. 8d for high packing fraction is magnified by the log scale, but the computation of the kurtosis evolution of does not show any clear change near .
The distribution of the first principal invariant, , has also been investigated. Observations similar to the ones made for have been concluded, so, by sake of clarity, these results are not reported in this paper.
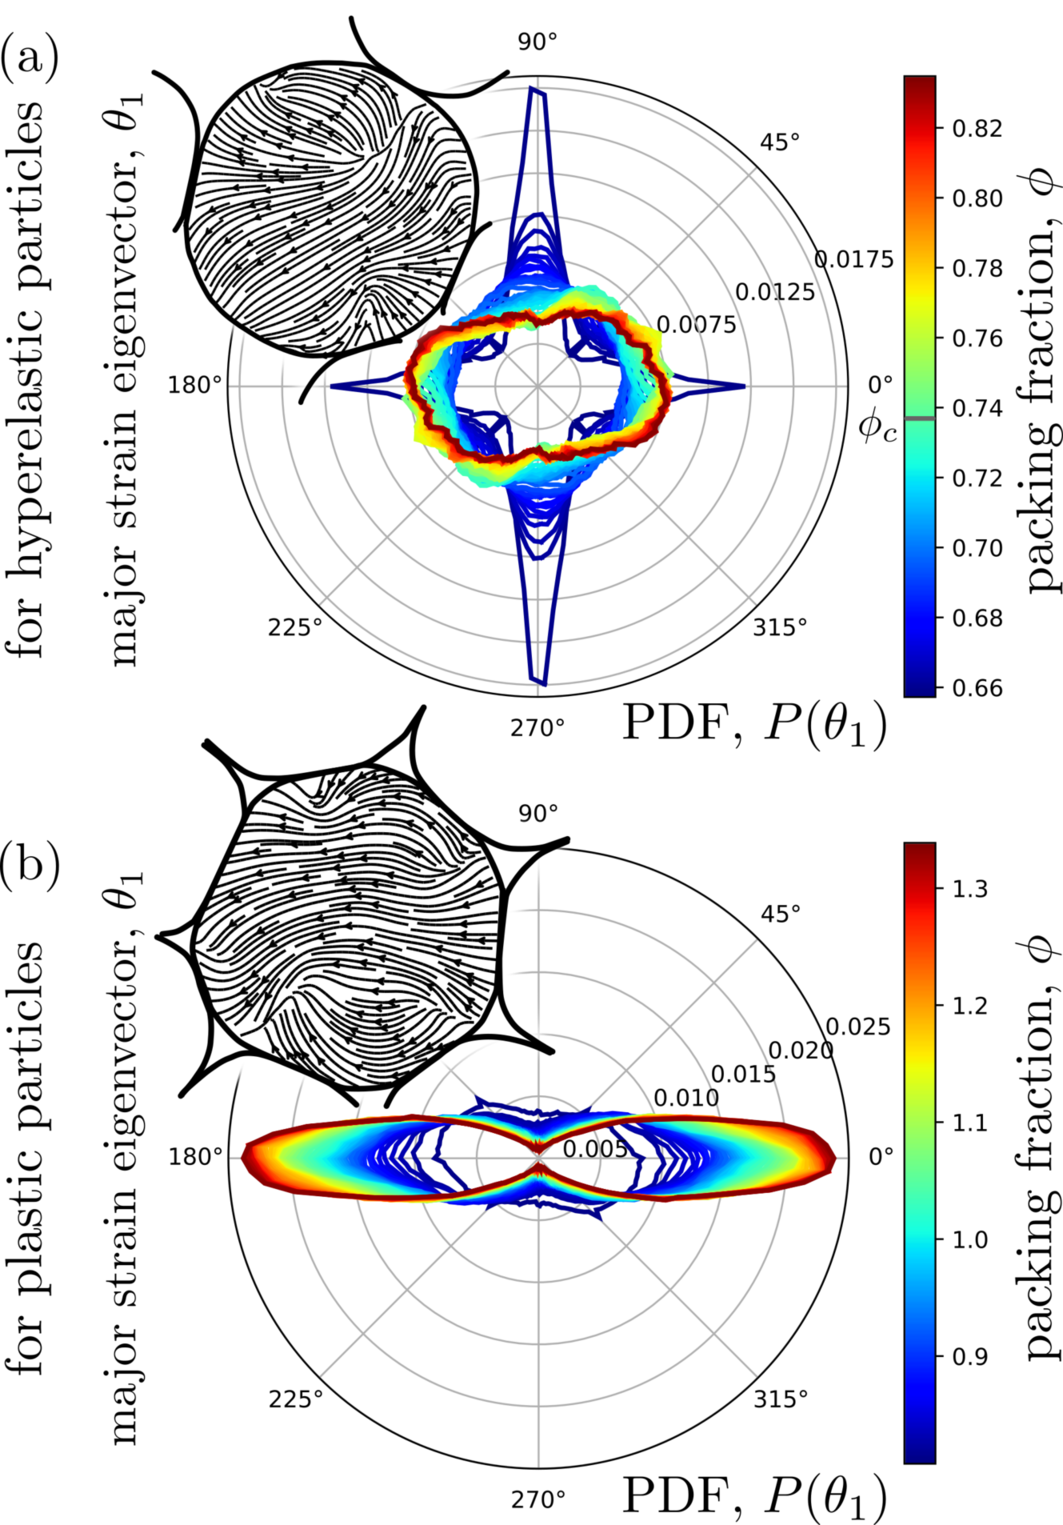
Figure 9 shows how the PDF of the first eigenvector direction evolves during the compression process for hyperelastic (a) and plastic (b) particles. In both cases when the system is fewly compressed no preferred direction is observed and the PDF is isotropic or mainly directed along the and axis. In the hyperelastic case, for higher packing fraction values, tends to elongate in the direction normal to the compression direction as shown in fig. 9a and its inset where the eigenvector field is given for a particle at packing fraction close to . As shown in fig. 9b this tendency is much stronger for plastic particles since forms two lobes aligned along the horizontal axis. This mean that the intensity of the strain is larger in the normal direction to the compression which is consistent with the fact that particles are mainly squeezed in this direction. We note that a similar study has been carried out for the second eigenvector. Similar graphs rotated by are observed. These results are not presented in this paper.
III.4 Local strain evolution
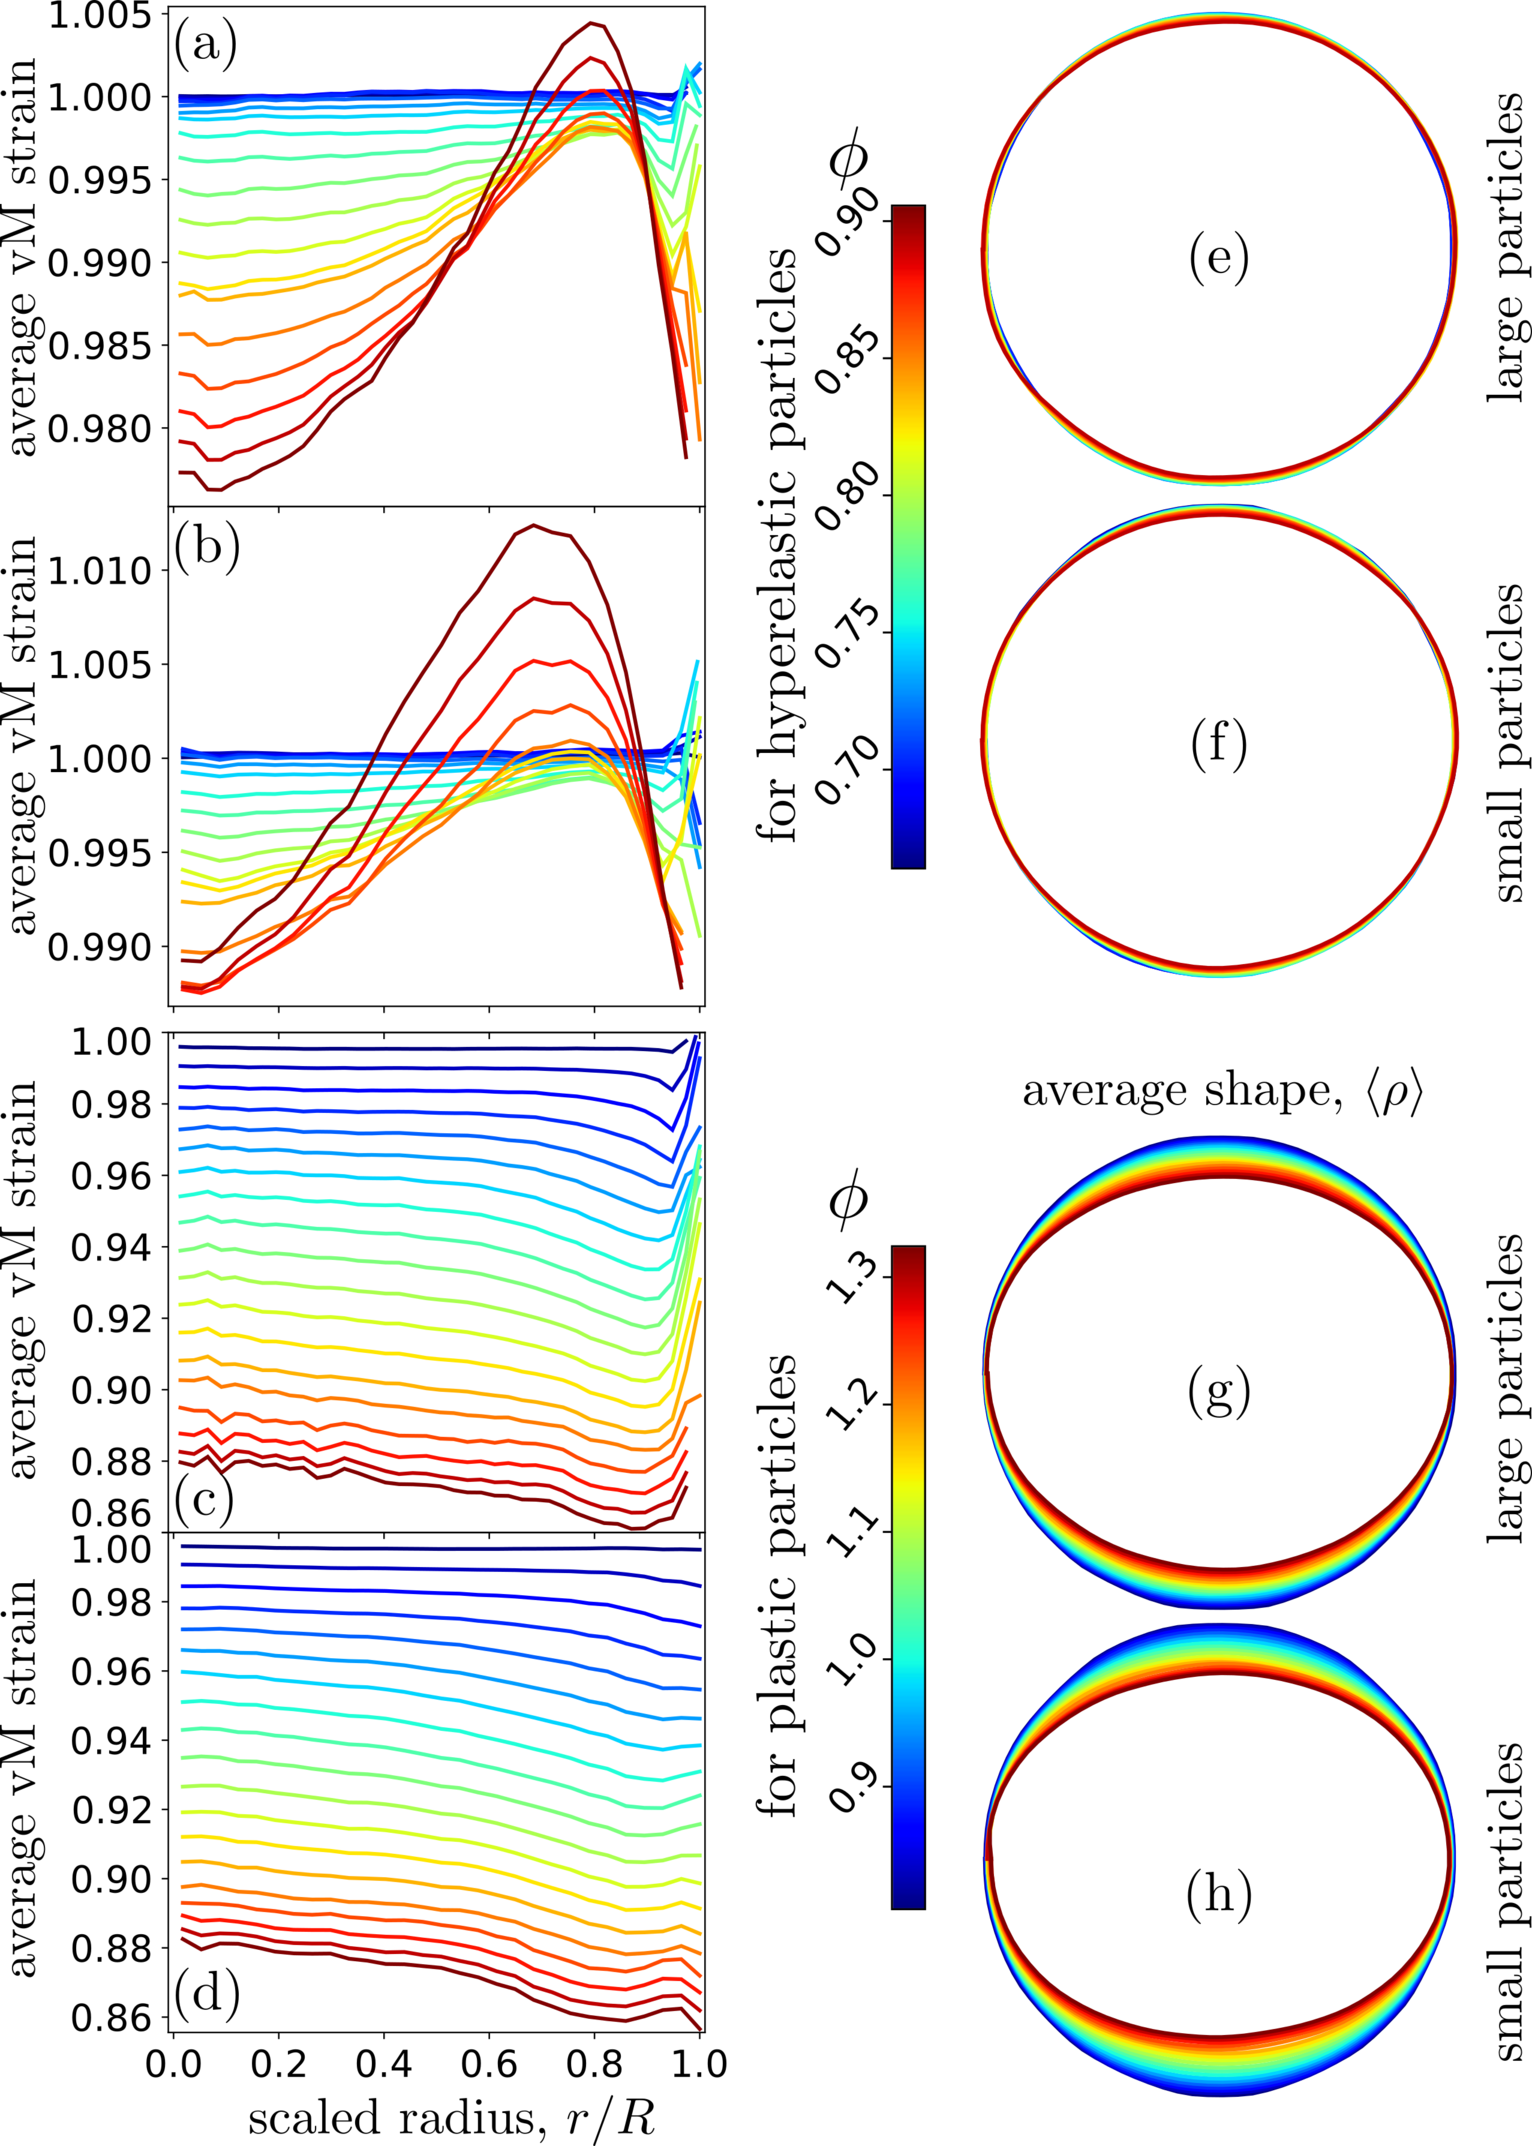
In fig. 10a to d, for each particle for different packing fractions, the von Mises strain field has been averaged radially to get , where are polar coordinates attached to the particle. These different functions are then averaged over the particles – distinguishing large and small ones – over three different experiments for hyperelastic and plastic materials. As shown in fig. 10a and b, in agreement with what is observed for a single particle Vu et al. (2019b) (see the inset of fig.6a) , is homogeneously equals to at the beginning of the compression and then rapidly decreases both in the center and very close to the edges of the particles. On the contrary, in between, few millimeters away from the edges, the von Mises strain increases and can even reach values higher than in this area where the shear strain is dominant. We note that this contrast between high and low is higher for the smaller particles.
As it was already suggested by the inset of fig.6d, fig. 10c and d show that the radial strain variation is completely different for plastic particles. For them, decreases everywhere with and it decreases even faster in the area few millimeters away from the particle edges. This is due to the fact that plastic materials do not resist well shear strain and tend to plastically deform homogeneously in the whole particle. Hence, the shear strain cannot reach high values compared to the hydrostatic strain; there is no area dominated by shear strain.
For each particle the average shape, , for a given packing fraction has also been studied. For hyperelastic particles, fig. 10e and f show that on average particles are almost not deformed except for high packing fractions where top and bottom edges move slightly inward. This comes from the fact that the material is incompressible and that, except for high values, the strain field is almost isotropic as emphasized by fig. 9a. As shown in fig. 10g and h, on the contrary for plastic material, on average, particles clearly and solely deformed along the compression axis. This is in agreement with the fact that the material is compressible with a very low Poisson ratio and that the strain field is mainly oriented horizontally as shown in fig. 9b. We also note that small particles are more deformed than larger ones.
IV Concluding dicussions
We have introduced a novel multi-scale experimental method for studying the mechanical interactions of granular matter down to the very local scale with an extremely good accuracy. This method is based on DIC and the use of a flatbed scanner to image granular media from the decimeter scale to the micrometer scale. This has been applied to the study of highly jammed soft granular materials with two typical material behaviors, namely incompressible hyperelastic and compressible plastic materials. On top of the classical macroscopic measurements (stress, packing fraction, coordination, fraction of NR), this method has been proved to gives access to all the particle geometry observables (position, shape, asphericity, anisotropy, orientation), void geometry observables (area, asphericity, solidity), displacement and strain fields at the particle scale with a so far never reached accuracy. Our study of the strain field for these two sorts of materials shows that at the onset of rigidity as well as deep in the jammed state, is a pertinent observable to consider in order to characterize the granular matter behavior from the microscopic scale. More precisely, the average value and standard deviation of () the von Mises strain , of () the eigenvalues and () invariants of shows changes of regime when crossing the jamming transition at and a second rigidity transition at . This latter depends on the material nature and is believed to be caused by a rapid change in the competition between compression, dilation and shear at the material scale. We believe it could replace the coordination van Hecke (2009) or the fraction of NR Zhang et al. (2010) as an observable that rule the system behavior.
We have also observed that when compressing hyperlastic particles, the stress grows superlinearly with (see fig. 2) which is not what is expected for Hookean particles Majmudar et al. (2007) nor for soap bubbles Durian (1995) where a linear regime is observed. For particles made of plastic material, the behavior is again different since grows sublinearly with . This can be explained by the fact that the plastic modulus is lower than the elastic one Vu et al. (2019b) so the more the system is compressed, the more the material enters in the plastic regime and the less the system is stiff.
We have shown that on average, the specific contact lengths first increase linearly in the jammed regime and then slowly saturate for densely packed systems (see fig. 3) – at least in the plastic case. The slopes corresponding with this linear regime greatly differs from one material to another. We believe this depends on the particle matter behavior and can constitutes a tool to probe the material properties of a system, in the biological case for instance Atia et al. (2017); Martin and Parkhurst (2004). We also note that contrary to what is observed from numerical simulations of deformable polygons, deep in the jammed state (), the particle asphericities increases linearly with .
Considering the intergranular voids, we have also evidenced that they are very diverse in terms for size and shape. We have also shown that their total area is maximum for , at the jamming point (see fig. 3). This means that most of the contact and the induced voids are formed at the jamming point and that, then, their size only decreases due to the particle deformation. In this study, even if our geometry is not ideal for such an analysis, the onset of rigidity has also been observed on many other observables: () the global stress increases from , () roughly equals to for , (–) the particle average anisotropy–asphericity decreases–increases from . This last point is in agreement with the fact that the jamming transition can be observed from the particle shape as already stated in previous numerical studies Bi et al. (2015, 2016); Boromand et al. (2018); Rodney et al. (2011). At the local scale the different following observables also undergo measurable crossovers around the jamming point: , , , and .
Beyond the change in mechanical behavior observed at the jamming transition, another crossover in the material rigidity is evidenced deep in the jammed regime. At the global scale, for plastic systems, for , exits a linear regime while enters a linear regime (see fig.3). At the local scale, for the same packing fraction () the standard deviations of the von Mises strain and of undergo a crossover, () the mean value of reaches a maximum and () exits a linear regime. For hyperelastic particles, for , reaches a minimum value and enters a linear regime. This crossover deep in the jammed regime around evidences a microscopic change in the granular matter behavior that has never been observed before. We believe it is due to the material properties, the compression history and the particle geometry. Indeed from the observations of the local fields, we have suggested that rapid changes in the competition between compression, dilation and shearing at the local scale can induce these crossovers. The variation of these quantities deeply depends on the material properties and particle geometries so should do.
We have observed that on average hyperelastic particles are deformed more isotropically than the plastic ones that are mainly deformed along the compression direction (see fig. 9 and 10). We believe this is due to the fact that hyperelastic particles that are more rigid and have more the ability to rearrange to minimize the stress inside the packing while plastic particles deform plastically to obtain the same result. Dealing with particle shape, we also note that the dense packing shown in fig. 1f is reminiscent of what is observed in biology for epithelial cells for example Martin and Parkhurst (2004); Atia et al. (2017) or in soap bubble experiments Bolton and Weaire (1990); Katgert and van Hecke (2010).
We believe this work could become a reference point to build up a, currently lacking, theory of the mechanical properties of material made of soft particles. It could also be used to benchmark numerical models simulating the compression of these sorts of materials. Beyond the study of highly strained soft discs packing we believe the experimental tool introduced in this paper offers an opportunity to catch experimentally the behavior of breakable, polydisperse (in size, shape and material) and inflating granular matter under different sorts of loadings. It could even be adapted to the study of porous materials.
V Acknowledgements
Gille Camp, Stéphan Devic and Rémy Mozul are greatly thanked for their technical support. Mathieu Renouf, Émilien Azéma and Vincent Huon are thanked for fruitful discussions.
References
- Martin and Parkhurst [2004] P. Martin and S. M. Parkhurst. Parallels between tissue repair and embryo morphogenesis. Development, 131(13):3021–3034, 2004.
- Angelini et al. [2011] T. E. Angelini, E. Hannezo, X. Trepat, M. Marquez, J. J. Fredberg, and D. A. Weitz. Glass-like dynamics of collective cell migration. Proceedings of the National Academy of Sciences, 108(12):4714–4719, 2011.
- Madhikar et al. [2018] P. Madhikar, J. Åström, B. Baumeier, and M. Karttunen. Morphology of proliferating epithelial cellular tissue. arXiv preprint arXiv:1811.07573, 2018.
- Atia et al. [2017] L. Atia, D. Bi, Y. Sharma, J. A. Mitchel, B. Gweon, S. Koehler, S. J. DeCamp, B. Lan, R. Hirsch, A. F. Pegoraro, et al. Universal geometric constraints during epithelial jamming. arXiv preprint arXiv:1705.04660, 2017.
- Sadati et al. [2013] M. Sadati, N. T. Qazvini, R. Krishnan, C. Y. Park, and J. J. Fredberg. Collective migration and cell jamming. Differentiation, 86(3):121–125, 2013.
- Bi et al. [2015] D. Bi, J. H. Lopez, J. M. Schwarz, and M. L. Manning. A density-independent rigidity transition in biological tissues. Nature Physics, 11(12):1074, 2015.
- Bi et al. [2016] D. Bi, X. Yang, M. C. Marchetti, and M. L. Manning. Motility-driven glass and jamming transitions in biological tissues. Physical Review X, 6(2):021011, 2016.
- Bolton and Weaire [1990] F. Bolton and D. Weaire. Rigidity loss transition in a disordered 2d froth. Physical review letters, 65(27):3449, 1990.
- Durian [1995] D. J. Durian. Foam mechanics at the bubble scale. Physical review letters, 75(26):4780, 1995.
- Katgert and van Hecke [2010] G. Katgert and M. van Hecke. Jamming and geometry of two-dimensional foams. Europhysics Letters, 92(3):34002, 2010.
- Winkelmann et al. [2017] J. Winkelmann, F. F. Dunne, V. J. Langlois, M. E. Möbius, D. Weaire, and S. Hutzler. 2d foams above the jamming transition: Deformation matters. Colloids and Surfaces A: Physicochemical and Engineering Aspects, 534:52–57, 2017.
- Brujić et al. [2003a] J. Brujić, S. F. Edwards, D. V. Grinev, I. Hopkinson, D. Brujić, and H. Makse. 3d bulk measurements of the force distribution in a compressed emulsion system. Faraday discussions, 123:207–220, 2003a.
- Brujić et al. [2003b] J. Brujić, S. F. Edwards, I. Hopkinson, and H. A. Makse. Measuring the distribution of interdroplet forces in a compressed emulsion system. Physica A: Statistical Mechanics and its Applications, 327(3-4):201–212, 2003b.
- Zhou et al. [2006] J. Zhou, S. Long, Q. Wang, and A. D. Dinsmore. Measurement of forces inside a three-dimensional pile of frictionless droplets. Science, 312(5780):1631–1633, 2006.
- Brujić et al. [2007] J. Brujić, C. Song, P. Wang, C. Briscoe, G. Marty, and H. A. Makse. Measuring the coordination number and entropy of a 3d jammed emulsion packing by confocal microscopy. Physical Review Letters, 98(24):248001, 2007.
- Desmond et al. [2013] K. W. Desmond, P. J. Young, D. Chen, and E. R. Weeks. Experimental study of forces between quasi-two-dimensional emulsion droplets near jamming. Soft Matter, 9(12):3424–3436, 2013.
- Lorenzo et al. [2013] G. Lorenzo, N. Zaritzky, and A. Califano. Rheological analysis of emulsion-filled gels based on high acyl gellan gum. Food Hydrocolloids, 30(2):672–680, 2013.
- Fan et al. [2017] J. Fan, S. H. Kim, Z. Chen, S. Zhou, E. Amstad, T. Lin, and D. A. Weitz. Creation of faceted polyhedral microgels from compressed emulsions. small, 13(31):1701256, 2017.
- Barés et al. [2014] J. Barés, M. L. Hattali, D. Dalmas, and D. Bonamy. Fluctuations of global energy release and crackling in nominally brittle heterogeneous fracture. Physical review letters, 113(26):264301, 2014.
- Liu and Nagel [1998] A. J. Liu and S. R. Nagel. Nonlinear dynamics: Jamming is not just cool any more. Nature, 396(6706):21, 1998.
- Degiuli et al. [2015] E. Degiuli, E. Lerner, and M. Wyart. Theory of the jamming transition at finite temperature. The Journal of chemical physics, 142(16):164503, 2015.
- Jacquin et al. [2011] H. Jacquin, L. Berthier, and Francesco F. Zamponi. Microscopic mean-field theory of the jamming transition. Physical review letters, 106(13):135702, 2011.
- Berthier et al. [2011] L. Berthier, H. Jacquin, and F. Zamponi. Microscopic theory of the jamming transition of harmonic spheres. Physical Review E, 84(5):051103, 2011.
- O’hern et al. [2003] C. S. O’hern, L. E. Silbert, A. J. Liu, and S. R. Nagel. Jamming at zero temperature and zero applied stress: The epitome of disorder. Physical Review E, 68(1):011306, 2003.
- O’Hern et al. [2002] C. S. O’Hern, S. A. Langer, A. L. Liu, and S. R. Nagel. Random packings of frictionless particles. Physical Review Letters, 88(7):075507, 2002.
- Heussinger and Barrat [2009] C. Heussinger and J.-L. Barrat. Jamming transition as probed by quasistatic shear flow. Physical review letters, 102(21):218303, 2009.
- Srivastava and Fisher [2017] I. Srivastava and T. S. Fisher. Slow creep in soft granular packings. Soft matter, 13(18):3411–3421, 2017.
- Dagois-Bohy et al. [2017] S. Dagois-Bohy, E. Somfai, B. P. Tighe, and M. van Hecke. Softening and yielding of soft glassy materials. Soft matter, 13(47):9036–9045, 2017.
- Kapfer and Krauth [2015] S. C. Kapfer and W. Krauth. Two-dimensional melting: From liquid-hexatic coexistence to continuous transitions. Physical Review Letters, 114(3):035702, 2015.
- Bi et al. [2011] D. Bi, J. Zhang, B. Chakraborty, and R. P. Behringer. Jamming by shear. Nature, 480(7377):355, 2011.
- Majmudar et al. [2007] T. S. Majmudar, M. Sperl, S. Luding, and R. P. Behringer. Jamming transition in granular systems. Physical review letters, 98(5):058001, 2007.
- Behringer [2015] R. P. Behringer. Jamming in granular materials. Comptes Rendus Physique, 16(1):10–25, 2015.
- Zhao et al. [2019] Y. Zhao, J. Barés, H. Zheng, J. E. S. Socolar, and R. P. Behringer. Shear jammed, fragile, and steady states in homogeneously strained granular materials. accepted in Physical Review Letters, arXiv preprint arXiv:1904.10051, 2019.
- Szabo et al. [2006] B. Szabo, G. J. Szöllösi, B. Gönci, Z. Jurányi, D. Selmeczi, and T. Vicsek. Phase transition in the collective migration of tissue cells: experiment and model. Physical Review E, 74(6):061908, 2006.
- Howell et al. [1999] D. Howell, R. P. Behringer, and C. Veje. Stress fluctuations in a 2d granular couette experiment: a continuous transition. Physical Review Letters, 82(26):5241, 1999.
- Jongchansitto et al. [2014] P. Jongchansitto, X. Balandraud, M. Grédiac, C. Beitone, and I. Preechawuttipong. Using infrared thermography to study hydrostatic stress networks in granular materials. Soft matter, 10(43):8603–8607, 2014.
- Brodu et al. [2015] N. Brodu, J. A. Dijksman, and R. P. Behringer. Spanning the scales of granular materials through microscopic force imaging. Nature communications, 6:6361, 2015.
- Amon et al. [2017] A. Amon, P. Born, K. E. Daniels, J. A. Dijksman, K. Huang, D. Parker, M. Schröter, R. Stannarius, and A. Wierschem. Preface: Focus on imaging methods in granular physics, 2017.
- Daniels et al. [2017] K. E. Daniels, J. E. Kollmer, and J. G. Puckett. Photoelastic force measurements in granular materials. Review of Scientific Instruments, 88(5):051808, 2017.
- Zadeh et al. [2019a] A. A. Zadeh, J. Barés, T. Brzinski, K. E. Daniels, J. Dijksman, N. Docqiuer, H. Everitt, J. Kollmer, O. Lantsoght, D. Wang, M. Workamp, Y. Zhao, and H. Zheng. Photoelastic methods wiki. https://git-xen.lmgc.univ-montp2.fr/PhotoElasticity/Main/wikis/home, 2019a.
- Zadeh et al. [2019b] A. Abed Zadeh, J. Barés, T. A. Brzinski, K. E. Daniels, J. Dijksman, N. Docquier, H. Everitt, J. E. Kollmer, O. Lantsoght, D. Wang, M. Workamp, Y. Zhao, and H. Zheng. Enlightening force chains: a review of photoelasticimetry in granular matter. Granular Matter, 2019b.
- Hurley et al. [2014] R Hurley, E. Marteau, G. Ravichandran, and J. E. Andrade. Extracting inter-particle forces in opaque granular materials: beyond photoelasticity. Journal of the Mechanics and Physics of Solids, 63:154–166, 2014.
- Marteau and Andrade [2017] E. Marteau and J. E. Andrade. A novel experimental device for investigating the multiscale behavior of granular materials under shear. Granular Matter, 19(4):77, 2017.
- Li et al. [2019] L. Li, E. Marteau, and J. E. Andrade. Capturing the inter-particle force distribution in granular material using ls-dem. Granular Matter, 21(3):43, 2019.
- Nezamabadi et al. [2017] S. Nezamabadi, T. H. Nguyen, J.-Y. Delenne, and F. Radjai. Modeling soft granular materials. Granular Matter, 19(1):8, 2017.
- Boromand et al. [2018] A. Boromand, A. Signoriello, F. Ye, C. S. O’Hern, and M. D. Shattuck. Jamming of deformable polygons. Physical review letters, 121(24):248003, 2018.
- Vu et al. [2019a] T. L. Vu, J. Barés, S. Mora, and S. Nezamabadi. Numerical simulations of the compaction of assemblies of rubberlike particles: A quantitative comparison with experiments. Physical Review E, 99(6):062903, 2019a.
- sil [a] Moldstar™ 15 slow, castable silicone from smooth-on. https://www.smooth-on.com/products/mold-star-15-slow/, a.
- [49] A10752 agar powder from alfa aesar.
- Vu et al. [2019b] T. L. Vu, J. Barés, S. Mora, and S. Nezamabadi. Deformation field in diametrically loaded soft cylinders. Experimental Mechanics, pages 1–15, 2019b.
- Hild and Roux [2006] F. Hild and S. Roux. Digital image correlation: from displacement measurement to identification of elastic properties–a review. Strain, 42(2):69–80, 2006.
- Bornert et al. [2009] M. Bornert, F. Brémand, P. Doumalin, J.-C. Dupré, M. Fazzini, M. Grédiac, F. Hild, S. Mistou, J. Molimard, J.-J. Orteu, L. Robert, Y. Surrel, P. Vacher, and B. Wattrisse. Assessment of digital image correlation measurement errors: methodology and results. Experimental mechanics, 49(3):353–370, 2009.
- Pan et al. [2009] B Pan, K. Qian, H. Xie, and A. Asundi. Two-dimensional digital image correlation for in-plane displacement and strain measurement: a review. Measurement science and technology, 20(6):062001, 2009.
- sil [b] Silc pig™ black, silicone color pigment from smooth-on. https://www.smooth-on.com/products/silc-pig/, b.
- sil [c] Cast magic™, silver thin metalic glitter from smooth-on. https://www.smooth-on.com/products/cast-magic/, c.
- Barés et al. [2017a] J. Barés, D. Wang, D. Wang, T. Bertrand, C. S. O’Hern, and R. P. Behringer. Local and global avalanches in a two-dimensional sheared granular medium. Physical Review E, 96(5):052902, 2017a.
- Barés et al. [2017b] J. Barés, T.-L. Vu, and S. Mora. An experimental method to measure the strain field inside a granular material. 2017b.
- [58] Python codes to post-process experimental images (particle tracking, dic, fields computation, etc.). https://git-xen.lmgc.univ-montp2.fr/Image/granular_dic.
- Taber [2004] L. A. Taber. Nonlinear theory of elasticity: applications in biomechanics. World Scientific, 2004.
- Göncü et al. [2010] F. Göncü, O. Durán, and S. Luding. Constitutive relations for the isotropic deformation of frictionless packings of polydisperse spheres. Comptes Rendus Mécanique, 338(10-11):570–586, 2010.
- van Hecke [2009] M. van Hecke. Jamming of soft particles: geometry, mechanics, scaling and isostaticity. Journal of Physics: Condensed Matter, 22(3):033101, 2009.
- Halsey and Levine [1998] T. C. Halsey and A. J. Levine. How sandcastles fall. Physical Review Letters, 80(14):3141, 1998.
- Mason et al. [1999] T. G. Mason, A. J. Levine, D. Ertaş, and T. C. Halsey. Critical angle of wet sandpiles. Physical Review E, 60(5):R5044, 1999.
- Zhang et al. [2010] J. Zhang, T. S. Majmudar, A. Tordesillas, and R. P. Behringer. Statistical properties of a 2d granular material subjected to cyclic shear. Granular Matter, 12(2):159–172, 2010.
- Rodney et al. [2011] D. Rodney, A. Tanguy, and D. Vandembroucq. Modeling the mechanics of amorphous solids at different length scale and time scale. Modelling and Simulation in Materials Science and Engineering, 19(8):083001, 2011.