Relationship Between Macrostep Height and Surface Velocity for a Reaction-Limited Crystal Growth Process
Abstract
![[Uncaptioned image]](/html/1903.09929/assets/x1.png)
This work examined the effect of macrostep height on the growth velocity of a vicinal surface during reaction- (interface-) limited crystal growth under non-equilibrium steady state conditions. The Monte Carlo method was employed, based on a restricted solid-on-solid (RSOS) model with point-contact-type step-step attraction (termed the p-RSOS model). Although this is a simple lattice model, the model surface shows a variety of distinctive configurations depending on the temperature and the driving force for crystal growth. The results demonstrate that the surface velocity decreases as the height of the faceted macrostep increases. In addition, the significant variation in surface velocity recently reported by Onuma et al. in a study based on 4H-SiC was reproduced. This work also shows that the terrace slope, elementary step velocity and elementary step kinetic coefficient are all affected by the faceted macrostep height.
- PACS numbers
-
81.10.Aj 64.60.Q- 82.60.Nh 68.35.Md 02.70.Uu 81.10.Dn 68.35.Ct 05.70.Np
I Introduction
The production of high-quality SiC crystals is an important prerequisite for the production of advanced power devices with low power consumption rates. Although self-organized faceted macrosteps are known to lower the quality of crystalline SiC mitani , dislocations penetrating the crystal have been shown to end at the side surfaces of macrosteps usui ; miyake ; harada . Hence, the intentional introduction of macrosteps can effectively decrease the dislocation density in a SiC crystal. In addition, controlling the self-assembly and disassembly of faceted macrosteps is an important aspect of fabricating semiconductor crystals.
There have been numerous studies concerning step bunching during diffusion limited crystal growth pimpinelli ; barabasi ; misba10 ; krzy14 ; krzy17 . As an example, Chernov chernov61 and co-workers nishinaga89 ; nishinaga93 performed detailed studies of the diffusion field around macrosteps or trains of macrosteps during steady-state growth in which volume diffusion was the rate-determining process. This same prior work also generated mathematical expressions for the velocity of macrostep advancement under these conditions, i. e. where is the height of the macrostep chernov61 . The essential point to derive this equation is the mass conservation during the diffusion limited crystal growth. Recently, Onuma et al. onuma17 determined the relationship between the macrostep velocities and heights in 4H-SiC using in situ confocal laser scanning microscopy and found that, when employing a Si–Ni flux, the experimental data could be explained by Chernov’s equation chernov61 . Thus, they concluded that the rate-determining process in 4H-SiC crystal growth is volume diffusion. In contrast, when Al was added to the Si–Ni flux, the data were too scattered to be explained by the equation, and so the rate was thought to have been determined by the interfacial reactions.
Despite this prior work, reaction- (that is, interface-) limited growth has not been studied sufficiently. In addition, such interfacial (or surface) reactions are always accompanied by volume diffusion or surface diffusion, and so it is difficult to separate the effects of interfacial reactions from those of diffusion in an actual system. For this reason, the present work employed computational experiments involving extreme conditions, using the Monte Carlo method.
We have been studying the self-assembly/disassembly of macrosteps on a theoretical basis, neglecting the effects of the surface and volume diffusion. The main driving force for the assembly of steps in such cases is anomalous surface tension at low temperatures. The anomaly in surface tension is caused microscopically by step-step attraction. This prior work employed the restricted solid-on-solid (RSOS) model in conjunction with point contact step-step attraction, termed the p-RSOS model akutsu09 ; akutsu11 ; akutsu11JPCM ; akutsu12 ; akutsu14 ; akutsu16-2 . Point contact step-step attraction is considered to result from the energy gain associated with the point at which neighboring steps meet. At such meeting points, the dangling bonds of the neighboring steps overlap to merge to create actual bonds between atoms. The resulting energy gain leads to the step-step attraction. Although the p-RSOS model involves a simple lattice, the vicinal surface of the model exhibits a variety of surface configurations with respect to the self-assembling/disassembling of macrosteps depending on the temperature and the driving force for crystal growth akutsu16 ; akutsu16-3 ; akutsu17 ; akutsu18 .
The most important aspect of the p-RSOS model is that it allows reliable calculations of a polar graph of the surface tension (the Wulff figure) and the equilibrium crystal shape (ECS). The surface tension is surface free energy per unit normal area. Since surfaces and steps are low-dimensional objects, thermal fluctuations are so severe that they destroy the ordered phase for the system with the short-range force, generally mermin . The calculation of the surface free energy with the mean-field or the quasi-chemical approximation often leads to wrong results. Hence, the calculations more precise than the mean field approximation are required. In the present work, we applied the transfer matrix version of the density matrix renormalization group (DMRG) method dmrg ; dmrg2 ; dmrg3 ; pwfrg ; pwfrg2 ; pwfrg3 ; akutsu98 ; akutsu06 to calculate the surface tension. Therefore, the morphological phenomena resulting from the anisotropy of the surface tension can be analyzed by referring to the calculated Wulff figures.
The aim of this work was to demonstrate the effect of the macrostep height on the surface velocity, the terrace slope, the elementary step velocity, and the elementary step kinetic coefficient in the case of reaction (interface)-limited crystal growth in the non-equilibrium steady state. This involved simulating the vicinal surface based on the p-RSOS model and using the Monte Carlo method in the non-conserved system of mass.
II Microscopic Model and Calculation Method
II.1 The p-RSOS model
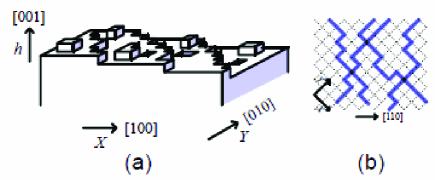

In this study, the p-RSOS model was employed as the microscopic model (Fig. 1) akutsu09 -akutsu18 . In this approach, the total energy of the (001) surface can be written as
| (1) |
where is the total number of lattice points, is the surface energy per unit cell on the planar (001) surface, is the microscopic ledge energy, is the Kronecker delta and is the microscopic step-step interaction energy. contributes to the surface energy at the meeting point of neighboring steps when the height difference in the diagonal direction is , and is assumed to originate from the energy gain when overlapping dangling bonds at step edges form bonding states. The summation with respect to is performed over all sites on the square lattice and when is negative, the step-step interaction becomes attractive.
It should also be noted that the RSOS model implicitly requires that the height difference between the nearest neighbor sites be restricted to . The surface free energy density, surface tension and ECS can be calculated using the transfer matrix version of the DMRG method dmrg ; dmrg2 ; dmrg3 , termed the product-wave-function renormalization group (PWFRG, or tensor network) method pwfrg ; pwfrg2 ; pwfrg3 ; akutsu98 ; akutsu15book .
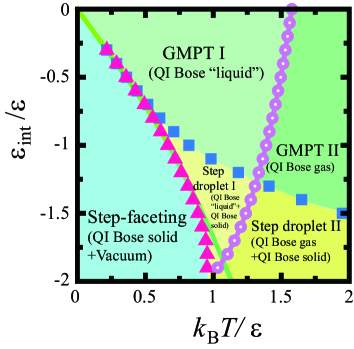
After detailed calculations of the surface free energy density and the surface tension, we found out that the surface undergoes the first order transition with respect to the self-assembling/disassembling of the elementary steps in the vicinal surface (Fig. 3). At high temperatures, the vicinal surface exhibits the Gruber-Mullins-Pokrovsky-Talapov (GMPT) universal behavior akutsu98 ; gmpt ; gmpt2 ; akutsu15book (Fig. 3 (c)). As the temperature is decreased, the surface tension around the (111) surface becomes discontinuous (Fig. 3 (b)) below , while the surface tension around the (001) surface becomes discontinuous (Fig. 3 (a)) below . The faceting diagram shown in Fig. 3 summarizes the surface tension discontinuities.
The profile of the faceted macrostep on the vicinal surface at equilibrium is also determined by the surface tension continuity akutsu16-3 . At (GMPT zone), a faceted macrostep does not appear on the vicinal surface. In contrast, at (that is, the step-droplet zone), a faceted macrostep with the side surface being the surface coexists with vicinal surfaces having the slope . Note that vicinal surfaces with the slope do not appear, because they are thermodynamically unstable. At (that is, the step-faceting zone), the vicinal surface consists of only the and the surfaces.
II.2 Monte Carlo method
The Monte Carlo method was adopted together with the Metropolis algorithm for the non-conserved systems to study the non-equilibrium steady state. The microscopic surface energy for a fixed number of steps, , was determined using the equation
| (2) |
where is the time in units of Monte Carlo steps per site (MCS/site) and is the driving force for the crystal growth (that is, the chemical potential difference between the bulk crystal and the ambient phase). When , the crystal grows, whereas when , the crystal recedes (evaporates, dissociates or melts).
The site on the surface for an Monte Carlo event is chosen randomly. Addition or removal of an growth unit is determined with the probability 0.5. The energies of the surface before or after of the event or are calculated based on Eq. (2). If , the event occurs with the probability 1; whereas if , the event occurs with the probability .
Periodic boundary conditions were required in the direction of the mean step-running. In the direction normal to the mean step-running, the surface heights of the lowest side line were connected to the surface heights at the topmost line by adding the number of elementary steps. The initial surface configuration involved the preparation of a parallel train of steps and a single macrostep.
It should be noted that the external parameters are the microscopic ledge energy , microscopic step-step attraction (), temperature , total number of elementary steps , linear system size , and driving force for the crystal growth .
II.3 Macrostep height
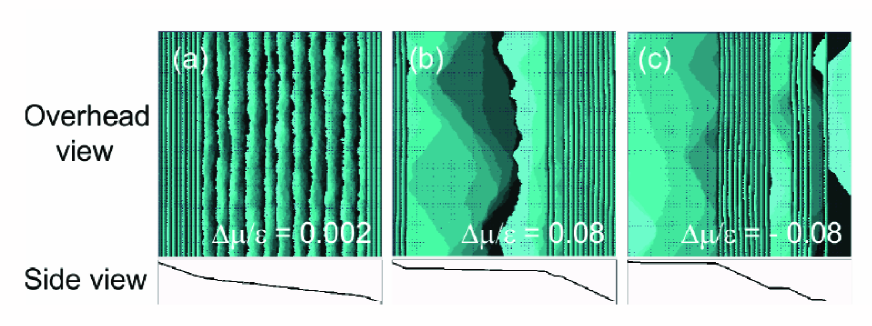
Images of the simulated surfaces at MCS/site are presented in Fig. 4. The average macrostep height was obtained using the equation
| (3) | |||||
where is the direction (normal to the mean step-running direction), is the direction (along the mean step-running direction) and is the number of merged steps. When determining the average value, the data over the first MCS/site were discarded and the values over the subsequent MCS/site were averaged. The surface velocity was estimated by finding the average surface height , using the formula
| (4) |
Here, is defined as
| (5) |
where and are MCS/site and MCS/site, respectively.
III Results and discussion
III.1 Macrostep height dependence of the surface velocity
| Symbol | value | description | |
|---|---|---|---|
| 0.4 | Crossover point between the | ||
| 0.63 | step-detachment mode and | ||
| the kinetically roughened mode. | |||
| 0.4 | Crossover point from the 2D | ||
| nucleation mode to the successive | |||
| step-detachment mode. | |||
| 0.4 | Freezing point | ||
| 0.4 | Yielding point |
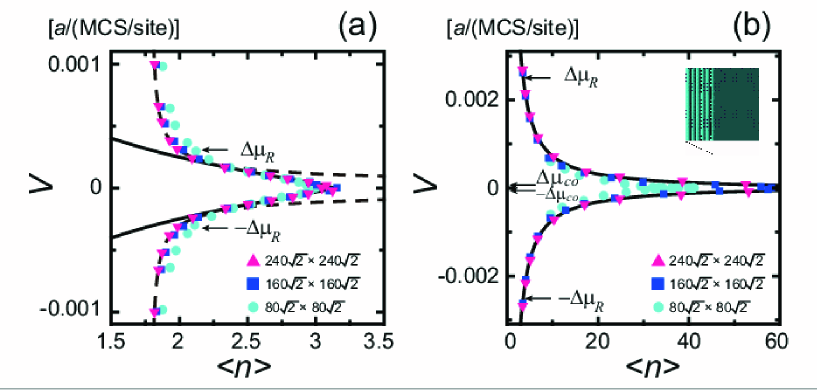
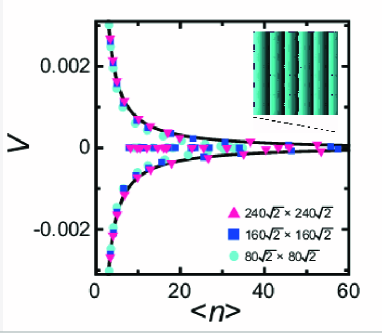
The effects of height on the surface velocity are shown in Fig. 5. These data demonstrate that surface velocity decreases as the mean size of the macrostep, , increases. It should be noted that both and are functions of driving force for the crystal growth in the non-equilibrium steady state akutsu18 . According to our previous work akutsu18 , there are several characteristic driving forces, which are summarized in Table 1.
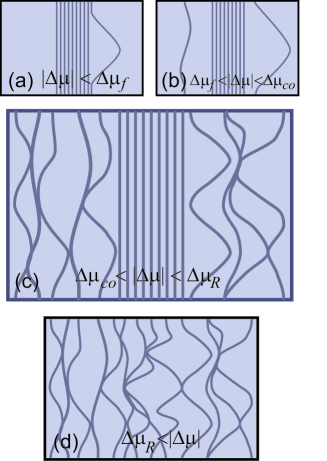
In the step-droplet zone, for , the vicinal surface has the structure shown in Fig. 4 (a), i. e. a faceted macrostep with a (111) side surface in conjunction “terrace” surfaces having the slope . The characteristics of this structure are provided in Fig. 6 (c). In contrast, in the case of , the vicinal surface is kinetically roughened and a macrostep is not formed. The characteristics of this structure are shown in Fig. 6 (d). Although there is no macrostep, the elementary steps merge locally to form the faceted local macrosteps. In addition, and exhibit power law behaviors akutsu17 .
In the step-faceting zone, the change in dynamics is more complex than in the step-droplet zone, as there are characteristic driving forces near equilibrium in addition to . At equilibrium, only the (001) and (111) surfaces are thermodynamically stable, and the (001) surface forms the terrace, while the (111) surface forms the side surface of the macrostep. In the event that , the surface does not grow, because there is a lack of nucleation growth, meaning that the mean waiting time for the formation of a single nucleus exceeds the observation time ( MCS/site in this work). In the case that a 2D island is formed at the edge of the macrostep as a result of thermal fluctuations, the island shrinks because the elementary step that surrounds the island recedes back to the macrostep due to the step tension (Fig. 6 (a)). In addition, since the vicinal surface freezes for , the height of the faceted macrostep is largely determined by the initial configuration. As a result, the relationship between and also depends on the initial configuration, and so the – plot in Fig. 7 exhibits significant scatter in the region between the solid lines.

In the case of , the crystal growth proceeds via 2D single nucleation (Fig. 6 (b)). If , then the crystal grows and nucleation occurs at the lower edge of the macrostep while growth occurs on both the (001) and (111) surfaces (Fig. 8 (a)). Conversely, if , then the crystal evaporates or dissolves. A “negative” 2D island, which is the cluster of holes on a surface, (Fig. 4 (c)) is formed as a nucleus at the upper edge of the macrostep, and this negative island increases in size (Fig. 8 (b)).
If , then the crystal grows via 2D multi nucleation (Fig. 6 (c)). If , then the surface is kinetically roughened, and both and demonstrate power law behavior with respect to . Although the relationship between and in the step-faceting zone is similar to that in the step-droplet zone, the details of the relationships are different. To understand this phenomenon on the microscopic scale, these Monte Carlo results are further analyzed in the following subsections.
III.2 Step attachment/detachment model
In the case that two surfaces coexist, elementary steps will attach to or detach from the edge of the faceted side surface. The effect of on the vicinal surface morphology for was assessed by considering a step–attachment–detachment model as evolved over time akutsu17 . This was calculated as
| (6) |
where is the rate at which the elementary steps catch up to a macrostep and is the rate at which the elementary steps detach from a macrostep. When , the macrostep dissociates (as is the case for ), whereas when (the case for ), increases up to . In this case, limits the growth/recession rate of the surface. Under steady-state conditions, , where is the height of the elementary step. Thus, if , then can be expressed as , where and are the step density and the step velocity of the elementary steps, respectively.
Based on the step–attachment–detachment model, surface velocity can be expressed using more microscopic quantities, as akutsu17 ; akutsu18
| (7) |
where is the slope of the terrace surface and is the mean step velocity of the elementary steps. Since total number of elementary steps is conserved, the slope can be expressed using as
| (8) | |||||
where is the mean slope of the vicinal surface, is the number of macrosteps and is the height of the elementary steps. It should be noted that for
| (9) |
In the case of , is approximately . In addition, if , then becomes negligible, such that .
Mean step velocity can be obtained on the basis of and together with Eqs. (7) and (8) as
| (10) | |||||
The kinetic coefficient is also calculated using and , as
| (11) | |||||
Because depends on in the non-equilibrium steady state, a large value is associated with and . This result indicates that the and terms in Eqs. (10) and (11) are divergent near equilibrium (Eq. (9)). However, is also affected by and decreases to zero near equilibrium. Whether and are divergent or not near equilibrium depends on the rate of decreases of and .
III.3 Step-droplet zone
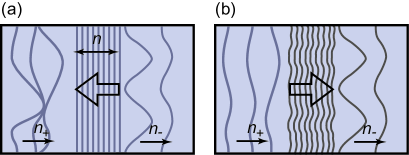

In the step-droplet zone, the vicinal surface for has a configuration similar to that in Fig. 6 (c). It is interesting to observe that the macrostep moves in the opposite direction compared to that of the elementary steps (Fig. 9 (a)). This occurs because the side of the faceted macrostep is a (111) smooth surface, such that the number of kinks on this surface is extremely low. In addition, the vicinal surface grows via the step detachment/attachment mode, and so the effect of on the surface velocity is the same as the effect on the macrostep velocity .
In contrast, in the case of step bunching caused by diffusion-limited growth, the side surface of the bunched step is rough and there are many kinks on the side surface. Consequently, the center of the bunched step side surface moves in the same direction as the elementary steps (Fig. 9 (b)). These results show that the rate-limiting process can be determined if the growth directions of the macrostep and the elementary steps are identified. Specifically, when the growth direction of the macrostep is the same as that of the elementary steps, the crystal growth is diffusion-limited, while if the opposite is true, then the crystal growth is reaction (interface)-limited.
The slope value, , can be calculated using Eq. (8) based on the value together with and . The resulting values are shown in Fig. 10 (a), which demonstrates that decreases as increases. From Fig. 10 (b), we can see that can also be expressed as
| (12) |
where , and . The line calculated using Eq. (12) is indicated by the solid lines in Figs. 10 (a) and (b).
The mean velocity of the elementary steps, , can be obtained from Eq. (10) using the values for and , and the resulting values are indicated by the symbols in Fig. 10 (c). These data demonstrate that the absolute value of decreases as increases. It is interesting to note that the kinetic coefficient of the elementary steps, , calculated using Eq. (11) (Fig. 10 (d)) is almost constant () with respect to , i. e. . Since is also correlated with according to the relationship akutsu17
| (13) |
where , , and , we can solve Eq. (13) with respect to to obtain
| (14) |
Substituting Eq. (12) into Eq. (14), we obtain
| (15) | |||||
The values of calculated from Eq. (15) are shown by the solid lines in Fig. 10 (c), and these lines accurately reproduce the Monte Carlo data for . Therefore, the surface velocity can be expressed as
| (16) | |||||
The lines obtained from Eq. (16) are indicated in Fig. 5 (a) by solid lines, and also accurately reproduce the Monte Carlo data.

In addition, for (in which case only local macrosteps are present (Fig. 6 (d))), and using , we obtain
| (17) | |||
| (18) |
Therefore, we have
| (19) | |||||
| (20) |
The lines generated using Eqs. (19) and (20) are shown by the broken lines in Fig. 5 (a) and Fig. 10 (c), respectively. Although a large macrostep does not form, step velocity is lower than that produced by the original RSOS model because the locally merged steps pin the motion of the elementary steps. As shown in Fig. 6 (d), the elementary steps form a network of steps and, at the meeting points of neighboring steps, locally merged steps form local faceted macrosteps with finite lifetimes. Because the side surface of the local faceted macrostep has few kinks, the growth of this region is quite slow akutsu12 ; akutsu14 . In this manner, the local faceted macrostep pins the elementary steps.
III.4 Step-faceting zone
In the case of the step-faceting zone, the vicinal surface consists of (001) terrace surfaces and the (111) side surface (Fig. 8) at equilibrium, both of which are smooth. The vicinal surface with the faceted macrostep in the non-equilibrium steady state shows all the configurations presented in Figs. 6 (a) – (d) depending on driving force . The cases corresponding to Figs. 6(a) and (b) are explained in §III.1. In this subsection, we analyze the data shown in Fig. 6 (c). If , growth occurs via step-detachment/attachment, as in (Fig. 6 (c)). Since multi-nucleation occurs on both the (001) and (111) surfaces at the edge of the macrostep, the velocity of the macrostep is almost zero, and surface velocity does not coincide with that of the macrostep.
In Fig. 11 (a), the values calculated from data using Eq. (8) in conjunction with the Monte Carlo method are indicated by symbols, along with the values calculated using Eq. (8). These results demonstrates that falls to zero at . The line is shown as a light green solid line in Fig. 11 (b). This line reproduces the symbols accurately except for the data close to . In Figs. 11 (c), the values obtained by the Monte Carlo method in conjunction with Eq. (10) by using and values are indicated by symbols. In Figs. 11 (d), the values obtained by the Monte Carlo method in conjunction with Eq. (11) by using and values are indicated by symbols.
The solid line in Fig. 11 (d) akutsu18 represents
| (21) |
where , , and . is related to akutsu18 in association with according to
| (22) | |||||
and
| (23) |
Here, is one of the characteristic driving forces (Table 1), is the total step free energy of the 2D critical island at the macrostep edge (calculated using the 2D Ising model) times , and is a coefficient related to the Zeldovich factor for the 2D nucleation. The solid line obtained from Eq. (21) reproduces the Monte Carlo results well, except in the case that is close to . Here, increases as increases due to the decreased step density on the terrace, i. e. . In the case of a high step density on the terrace, the number of locally merged steps is also high. Since each locally merged step is faceted and has few kinks, the velocity of the locally faceted macrostep is substantially lower than that of an elementary step. As a result, the motions of steps are pinned randomly by the locally faceted macrosteps (Fig. 6 (c)). Conversely, when is large, is small, the step density on the terrace is nearly zero, and the elementary steps meet neighboring steps less frequently. Thus, the elementary steps travel like free steps and are not pinned as often.
It is interesting to observe that is almost constant except near and . The solid line in Fig. 11 (c) was calculated using the equation , where is that in Eq. (21) and is related to the value of by Eqs. (22) and (23). As increases, increases but decreases, and so is almost unchanged over the approximate range of . Because , surface velocity becomes
| (24) |
over the approximate range of , except for . At , where , there is one faceted macrostep and several elementary steps traveling on the terrace surface. In this case, because approaches zero more rapidly than does (due to the finite size effect), the values obtained from Eq. (11) are reduced to zero.
For , the vicinal surface roughens kinetically and faceted macrosteps having finite lifetimes appear locally (Fig. 6 (d)). In the case that , , and are expressed as
| (25) | |||
| (26) | |||
| (27) |
where is the mean height of the local macrosteps. Substituting Eq. (25) into Eqs. (26) and (27) gives
| (28) | |||||
| (29) |
Similar to the results obtained for the step-droplet zone, the local macrosteps pin the step motion of the elementary steps. Hence, the and values are both substantially smaller than those in the original RSOS model.
IV Conclusions
-
•
The surface velocity decreases as the height of a faceted macrostep increases during reaction- (interface-) limited crystal growth, and this reduced velocity is related to a decrease in surface roughness or kink density.
-
•
In the step-droplet zone, the faceted macrostep grows (recedes) in the opposite direction to the growth (recession) direction of the elementary steps. The decrease in the velocity of the faceted macrostep is also proportional to (Eq. (16), ).
-
•
In the step-droplet zone, the kinetic coefficient of the elementary steps is almost constant. This coefficient has a value approximately one-third that of the kinetic coefficient of the original restricted solid-on-solid (RSOS) model because of the local faceted macrosteps on the terrace.
-
•
In the step-faceting zone, the absolute value of the growth velocity of the surface, , varies widely within the range defined by constant , because the height of the macrostep depends on the initial configuration of the vicinal surface.
-
•
In the step-faceting zone, the surface grows (recedes) via 2D multi-nucleation on both the (001) and (111) surfaces at the lower (upper) edge of the faceted macrostep. This nucleation on both surfaces inhibits the advancement of the faceted macrostep ().
V acknowledgments
The author wishes to acknowledge helpful discussions with Prof. Y. Matsumoto, Prof. T. Nishinaga, Prof. T. Ujihara, Prof. K. Fujiwara, Prof. S. Uda and Prof. K. Kakimoto. This work is supported by Kakenhi Grants-in-Aid (Nos. JP25400413 and JP17K05503) from the Japan Society for the Promotion of Science (JSPS).
VI reference
References
- (1) T. Mitani, N. Komatsu, T. Takahashi, T. Kato, S. Harada, T. Ujihara, Y. Matsumoto, K. Kurashige, and H. Okumura, “Effect of aluminum addition on the surface step morphology of 4H–SiC grown from Si–Cr–C solution”, J. Cryst. Growth, 423, 45 –49 (2015).
- (2) A. Usui, H. Sunakawa, A. Sakai, and A. A. Yamaguchi, “Thick GaN Epitaxial Growth with Low Dislocation Density by Hydride Vapor Phase Epitaxi”, Jpn. J. Appl. Phys. 36, L899–L902 (1997).
- (3) H. Miyake, A. Motogaito, and K. Hiramatsu, “Effects of Reactor Pressure on Epitaxial Lateral Overgrowth of GaN via Low-Pressure Metalorganic Vapor Phase Epitaxy”, Jpn. J. Appl. Phys. 38, L1000–L1002 (1999).
- (4) S. Harada, Y. Yamamoto, K. Seki, A. Horio, M. Tagawa, T. Ujihara, “Different behavior of threading edge dislocation conversion during the solution growth of 4H-SiC depending on the Burgers vector”, Acta Materialia, 81, 284–290 (2014).
- (5) A. Pimpinelli, J. Villain, Physics of Crystal Growth (Cambridge University Press, Cambridge, UK, 1998).
- (6) A. L. Barabasi and H. E. Stanley, Fractal Concepts in Surface Growth (Cambridge University Press, Cambridge, UK, 1995).
- (7) Misbah, C.; Pierre-Louis, O.; Saito, Y. Crystal surfaces in and out of equilibrium: A modern view. Rev. Mod. Phys. 2010, 82, 981–1040.
- (8) F. Krzyzewski, “4H-SiC surface structure transitions during crystal growth following bunching in a fast sublimation process”, J. Cryst. Growth 401, 511–513 (2014).
- (9) F. Krzyzewski, M. A. Zaluska-Kotur, A. Krasteva, H.Popova, and V. Tonchev, “Step bunching and macrostep formation in 1D atomistic scale model of unstable vicinal crystal growth”
- (10) A. A. Chernov, gThe spiral growth of crystals h Sov. Phys. USP, 4, 116 (1961); Usp. Fiz. Nauk 73, 277-331 (1961).
- (11) T. Nishinaga, C. Sasaoka, and A. A. Chernov, “ A numerical analysis for the supersaturation distribution around LPE macrostep”, Ed. I. Sunagawa, Morphology and Growth Unit of Crystals (Terra Scientific Publishing Company, Tokyo, 1989).
- (12) T. Nishinaga and T. Suzuki, “Towards understanding the growth mechanism of III-V semiconductors on an atomic scale”, J. Cryst. Growth, 128 37-43 (1993).
- (13) A. Onuma, S.Maruyama, N. Komatsu, T. Mitani, T. Kato, H. Okumura, and Y. Matsumoto, “Quantitative Analysis of Nanoscale Step Dynamics in High-Temperature Solution-Grown Single Crystal 4H-SiC via In Situ Confocal Laser Scanning Microscope”, Cryst. Growth Des. 17, 2844-2851 (2017).
- (14) N. Akutsu, “Thermal step bunching on the restricted solid-on-solid model with point contact inter-step attractions”, Applied Surface Science, 256, 1205–1209 (2009). doi:10.1016/j.apsusc.2009.05.080.
- (15) N. Akutsu, “Zipping process on the step bunching in the vicinal surface of the restricted solid-on-solid model with the step attraction of the point contact type”, J. Cryst. Growth, 318, 10–13 (2011). doi: 10.1016/j.jcrysgro.2010.10.088.
- (16) N. Akutsu, “ Non-universal equilibrium crystal shape results from sticky steps”, J. Phys. Condens. Matter, 23, 485004 (2011). doi:10.1088/0953-8984/23/48/485004.
- (17) N. Akutsu, “Sticky steps inhibit step motions near equilibrium”, Phys. Rev. E 86, 061604 (2012). DOI: 10.1103/PhysRevE.86.061604.
- (18) N. Akutsu, “Pinning of steps near equilibrium without impurities, adsorbates, or dislocations”, J. Cryst. Growth, 401, 72–77 (2014). http://dx.doi.org/10.1016/j.jcrysgro.2014.01.068.
- (19) N. Akutsu, “Effect of the roughening transition on the vicinal surface in the step droplet zone”, J. Cryst. Growth 468, 57–62 (2017). doi:10.1016/j.jcrysgro.2016.10.014.
- (20) N. Akutsu, “Faceting diagram for sticky steps”, AIP Adv., 6, 035301 (2016). dx.doi.org/10.1063/1.4943400.
- (21) N. Akutsu, “Profile of a Faceted Macrostep Caused by Anomalous Surface Tension”, Adv. Condens. Matter Phys. 2017, Article ID 2021510 (2017). doi:10.1155/2017/2021510.
- (22) N. Akutsu, ”Disassembly of Faceted Macrosteps in the Step Droplet Zone in Non-Equilibrium Steady State”, Crystals, 7, Article ID cryst7020042, (2017). doi:10.3390/cryst7020042.
- (23) N. Akutsu, ”Height of a faceted macrostep for sticky steps in a step-faceting zone”, Phys. Rev. Materials 2, 023603 (2018). DOI: 10.1103/PhysRevMaterials.2.023603.
- (24) N. D. Mermin, H. Wagner, “ Absence of ferromagnetism or antiferromagnetism in one-or two-dimensional isotropic Heisenberg models”, Phys. Rev. Lett. 1966, 17, 1133–1136 (1966). “Erratum: Absence of ferromagnetism or antiferromagnetism in one-or two-dimensional isotropic Heisenberg models. N. D. Mermin and H. Wagner [Phys. Rev. Letters 17, 1133 (1966)].” Phys. Rev. Lett., 17, 1307 (1966).
- (25) S. R. White, “Density matrix formulation for quantum renormalization groups”, Phys. Rev. Lett., 69, 2863–2866 (1992).
- (26) T. Nishino, “Density matrix renormalization group method for 2D classical models”, J. Phys. Soc. Jpn., 64, 3598–3601 (1995).
- (27) U. Schollwöck, “The density-matrix renormalization group, Rev. Mod. Phys., 77, 259–315 (2005).
- (28) T. Nishino, K. Okunishi, “Product wave function renormalization group”, J. Phys. Soc. Jpn., 64, 4084–4087 (1995).
- (29) Y. Hieida, K. Okunishi, and Y. Akutsu, “Magnetization process of a one-dimensional quantum antiferromagnet: The product-wave-function renormalization group approach”, Phys. Lett. A, 233, 464–470 (1997).
- (30) Y. Hieida, K. Okunishi, and Y. Akutsu, “Numerical renormalization approach to two-dimensional quantum antiferromagnets with valence-bond-solid type ground state”, New J. Phys., 1, 7 (1999).
- (31) N. Akutsu and Y. Akutsu, “Thermal evolution of step stiffness on the Si (001) surface: Temperature-rescaled Ising-model approach”, Phys. Rev. B, 57, R4233–R4236 (1998).
- (32) N. Akutsu and Y. Akutsu, “The Equilibrium Facet Shape of the Staggered Body-Centered-Cubic Solid-on-Solid Model – A Density Matrix Renormalization Group Study–”, Prog. Theor. Phys. 116 983 (2006).
- (33) E. E. Gruber, W. W. Mullins, “On the theory of anisotropy of crystalline surface tension”, J. Phys. Chem. Solids 28, 875-887 (1967).
- (34) V. L. Pokrovsky, A. L. Talapov, “Ground state, spectrum, and phase diagram of two-dimensional incommensurate crystals”, Phys. Rev. Lett. 42, 65–67 (1979).
- (35) N. Akutsu and T. Yamamoto, “Rough-Smooth Transition of Step and Surface”, ed. T. Nishinaga, Handbook of Crystal Growth, Vol. I. (Elsevier, 2015) pp. 265-313.