Astro2020 Science White Paper
How does dust escape galaxies?
Thematic Areas: Planetary Systems Star and Planet Formation Formation and Evolution of Compact Objects Cosmology and Fundamental Physics Stars and Stellar Evolution Resolved Stellar Populations and their Environments Galaxy Evolution Multi-Messenger Astronomy and Astrophysics
Principal Author:
Name: Edmund Hodges-Kluck Institution: University of Maryland/NASA Goddard Space Flight Center Email: edmund.hodges-kluck@nasa.gov
Co-authors: Lía Corrales (University of Michigan)
Sylvain Veilleux (University of Maryland)
Joel N. Bregman (University of Michigan)
Jiangtao Li (University of Michigan)
Marcio Meléndez (Space Telescope Science Institute)
Abstract: Whenever gas is blown out of a galaxy, chances are that it contains some cosmic dust. This dust is an important part of the metals budget for the circumgalactic and intergalactic media, and traces the outflow and stripping history of the galaxy. The dust is also interesting in its own right, as dust plays an essential role in many astrophysical processes. We have only begun to learn about circumgalactic dust, and in particular we do not know how (and when) it escapes its host galaxy. Here we describe the prospects for measuring the dust mass and properties around many individual galaxies, which will form the basis for understanding how the dust got there.
1. Circumgalactic Dust
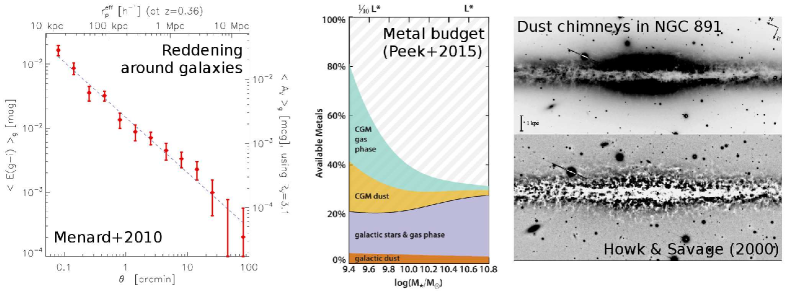
The circumgalactic medium (CGM) has recently become a hot topic—rightfully so, as it contains much (or most) of the non-dark matter associated with galaxies from to (Tumlinson et al., 2017). The CGM also contains a large amount of dust (by some estimates, more than in the galaxy itself; Ménard et al., 2010). Whereas the fraction of the CGM that has ever cycled through a galaxy remains controversial, every dust grain in the CGM was born in a galaxy.
Circumgalactic dust (CGD) is thus an important tracer of the integrated outflow and gas-stripping history of the galaxy, especially as it is long-lived in the tenuous CGM (Ferrara et al., 1991). Dust can also drive outflows through radiation pressure on grains (Murray et al., 2005). Once outside of a galaxy, CGD can cool or heat the CGM (Montier & Giard, 2004).
There is a lot of CGD. Measurements of quasar reddening around galaxies at revealed dust to beyond the virial radius (Figure 1), with a total mass exceeding that in the host galaxies (Ménard et al., 2010), and CGD accounts for up to 20% of the metal budget around small galaxies (Peek et al., 2015). The total mass remains uncertain because many sightlines pierce extended gaseous disks around the optical galaxies (Smith et al., 2016), but several lines of evidence point to large CGD masses. We would therefore like to know:
-
•
How is CGD partitioned among each CGM phase?
-
•
How does the CGD contribute to the metal budget as a function of galaxy mass?
-
•
When was CGD expelled/stripped from its natal galaxy, and how long does it live in the CGM?
-
•
Does CGD escape mostly via episodic winds, bubbling fountains, starlight “breezes,” or stripping?
Answering these questions requires measuring the mass, composition and size (hereafter, “dust properties”), velocity, and spatial distribution of the CGD. Here we address how this can be done.
2. Where does the CGD live?
Reddening of quasars (Ménard et al., 2010) or background galaxies (“standard crayons”; Peek et al., 2015) around galaxies remains an important, and perhaps the best, tool to associate dust far from galaxies with phases of the CGM. For example, about half of the CGD may reside in Mg ii absorbers (Ménard & Fukugita, 2012). However, one must account for contamination by extended gas disks, and future advances require careful selection of the sight lines (e.g., by azimuth).
This work was based on the SDSS (reaching 21-23 mag over 10,000 deg2), but many more systems are available: the Dark Energy Survey reaches =24 mag over 5,000 deg2, Pan-STARRS reaches =21-23 mag over 30,000 deg2, LSST will reach =27 mag over 30,000 deg2, and J-PAS will cover the SDSS footprint with 54 filters from the optical to near-IR. The AllWISE catalog contains 1.4106 quasars (Secrest et al., 2015), and eROSITA will discover many X-ray AGNs. By selecting samples following recent CGM studies, one can measure the average CGD properties as a function of galaxy type, and its association with different phases of gas.
One can also constrain the amount of dust in the cool and warm phases by measuring depletion of O, Si, and Fe in CGM gas. Following surveys of the CGM with HST/COS (Borthakur et al., 2015; Heckman et al., 2017; Prochaska et al., 2017), a sensitive UV spectrometer is needed to expand the sample to hundreds of galaxies; the CETUS Probe concept (Danchi et al., 2018) meets these requirements and would make these measurements as part of its surveys. It may also be possible to detect truly intergalactic gas through X-ray scattering halos (Corrales & Paerels, 2012; Corrales, 2015) with a high angular resolution, sensitive telescope, such as the Lynx HDXI (Gaskin et al., 2018) or AXIS Probe concept (Mushotzky, 2018), and a bright background source.
3. Normal Galaxies and CGD Detection Techniques
In galaxies without galaxy-scale winds, dust escapes the galaxy disk through momentum imparted from starlight (or cosmic rays), galactic fountains of hot gas powered by supernovae (Bregman, 1980), and tidal or ram-pressure stripping. The amount of dust entrained in the outflow depends on the feedback mechanism, outflow speed, grain size distribution, and composition.
The efficiency of each channel at removing dust is unknown, and they are difficult to study in isolation. The velocities are likely insufficient to remove gas from the gravitational potential, so most of this dust may remain close to the galaxy. By measuring the properties of the inner CGD around hundreds of galaxies we can identify relations with respect to the star-formation rate, galaxy mass, galaxy type, and interaction stage or morphology. The cross-section is too low to use background AGNs, but the dust can be observed in emission, absorption, and scattering:
Emission:
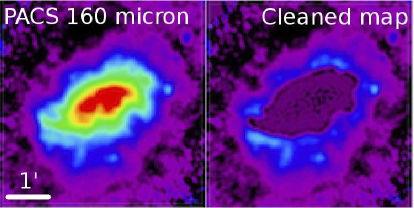
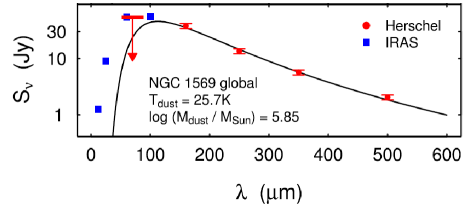
Dust processes radiation by absorbing UV or optical photons and radiating that energy in the infrared/sub-mm. The spectrum is represented by a modified blackbody, and if the temperature can be fixed by fitting the broadband spectral energy distribution (SED), the intensity yields the dust mass. Dust within several kpc of the galaxy disk is warm enough to detect in emission, and it has been detected around multiple galaxies with Herschel (e.g., Figure 2) by modeling and removing the galaxy image, including the PSF wings (Hodges-Kluck et al., 2016; McCormick et al., 2018).
The SOFIA/HAWC camera has a similar sensitivity and resolution to Herschel in the FIR, and could detect extraplanar dust within 25 Mpc, with several hours per galaxy. Sub-mm facilities (ALMA, NOEMA, and JCMT) can constrain the emissivity from the Rayleigh-Jeans tail, at the cost of long integrations at high frequency. A larger sample must include more distant galaxies and need 2-3x better angular resolution than Herschel, which will also enable mapping of changes in the emissivity-temperature relationship and the dust-to-gas ratio in streams of tidally stripped gas (Roussel et al., 2010; Meléndez et al., 2015). The Origins concept meets the requirements for an ambitious survey, while the mid-infrared instruments on WFIRST and JWST will enable a systematic measurement of circumgalactic PAHs (polycyclic aromatic hydrocarbons).
Absorption:
Outflowing dust is seen in absorption against the background thick stellar disk in the walls of “chimneys” through which hot gas escapes (Howk & Savage, 2000) (Figure 1). Most of this dust will not escape the galaxy, but it does provide information on the grain properties and outflow mass and energy budgets. Some filaments also indicate the sites of condensation of hot gas or its interaction with cooler gas (Li, 2015), and dust lanes in stripped material constrain the “outflow” rate. Further studies can be carried out with sensitive ground-based observations.
Scattering:
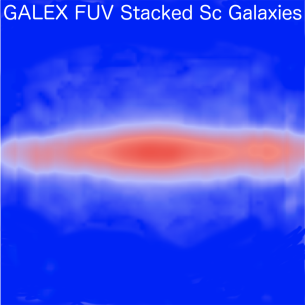
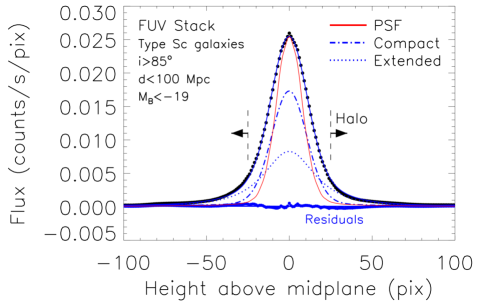
CGD near the disk scatters escaping starlight, forming a reflection nebula (RN). RNs can be detected around highly inclined galaxies, where the extraplanar light can be cleanly separated from the disk and the strong forward-scattering is mitigated by integrating through the halo. RNs are easiest to detect in the UV band (Figure 4), where the sky is dark and the scattering cross-section () is high (Hoopes et al., 2005; Seon et al., 2014; Shinn & Seon, 2015; Hodges-Kluck & Bregman, 2014), and stacked GALEX data show that RNs exist around most large, edge-on, star-forming galaxies within 100 Mpc (Figure 3). Initial work based on radiative transfer models finds - of CGD within 10 kpc of the disk (Hodges-Kluck et al., 2016; Baes & Viaene, 2016). This makes RNs a very promising probe of CGD around normal galaxies.
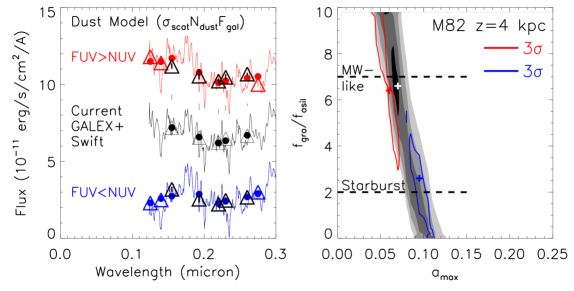
RNs constrain the CGD properties: the difference between the galaxy spectral energy distribution (SED), corrected for extinction through the disk, and the halo SED determines , which depends on the dust properties. In the silicate-graphite model that accurately describes extinction along Galactic sightlines (Mathis et al., 1977; Nozawa & Fukugita, 2013), varies with the proportion of silicate grains and the maximum grain size. The observational requirement is a SED covering 1200-2800Å. Most RN work is based on archival data, and only a few galaxies have sufficient data to make this measurement. Most are missing the required FUV (Å) data, and Figure 4 shows the constraints on dust properties that can be achieved with additional data.
Acquiring a sample for population studies requires measuring the SEDs for hundreds of RNs. This maps to requirements on the angular resolution (1′′), wavelength coverage (1200-2800Å), and field of view (10′ to cover the halo). Efficiently making such measurements requires a large collecting area. The existing FUV instruments (HST Advanced Camera for Surveys/Solar Blind Channel and the Astrosat Ultraviolet Imaging Telescope) either have too small a field of view (HST) or too little collecting area (Astrosat). However, these requirements are met by CETUS, which has a 17′field of view, point sensitivity of 26-27 mag, and ′′.
4. Galactic Winds
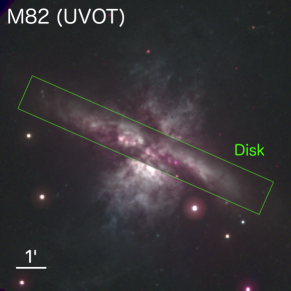
The most spectacular (and perhaps most important) dusty outflows are in galactic superwinds. The exemplar is M82 (Figure 4), for which the dust is visible in absorption, emission (Engelbracht et al., 2006; Roussel et al., 2010; Yamagishi et al., 2012; Contursi et al., 2013; Hutton et al., 2014), and scattered light (Hoopes et al., 2005; Hutton et al., 2014). Both PAHs and larger grains are seen in nearby winds with the Spitzer IRAC and Herschel PACS and SPIRE cameras McCormick et al. (2013); Meléndez et al. (2015); McCormick et al. (2018). Dusty winds are ubiquitous and contain as much as 20% of the dust in the galaxy disk, suggesting that episodic outflows are more effective than ongoing, low-level supernova feedback at removing dust.
However, spectro-polarimetry of optical emission lines in M82 reveals that the dust is kinematically decoupled from other, faster phases and that most dust will not escape the galaxy (Yoshida et al., 2011). At the same time, high-resolution FIR measurements reveal “worms” connected to H filaments (Meléndez et al., 2015) that indicate a connection between the cool and warm ionized gas. The dust properties may also depend on the primary driving mechanism (Zhang, 2018); in quasar outflows, radiation pressure may fully expel dust from galaxies (Murray et al., 2005; Ishibashi & Fabian, 2016) where hot gas fails to do so. Finally, winds can alter the dust: in at least one galaxy, NGC 891, Bocchio et al. (2016) report a vertical grain size gradient that indicates shock processing.
Dust in winds remains poorly studied except in the most famous winds. A census of dust masses will require observations with existing observatories, as well as new capabilities. Winds can be studied using the same techniques described in Section 2. To resolve wind structures in the FIR beyond 30 Mpc requires much better resolution and sensitivity than Herschel (i.e., Origins), especially since the starbursts will be very bright, point-like sources. This would also enable dust emissivity maps that constrain the dust origin (Suzuki et al., 2018). The requirements to use RNs to study winds are similar to those for normal galaxies, and so are met by CETUS, which also has a long-slit spectrometer that can separate dust and ionized gas in bright winds. Spectro-polarimetry of filaments should also be possible within 100 Mpc with large ground-based telescopes.
Masses can also be measured from unresolved dusty outflows. For example, the optical–FIR SEDs of AGNs show a separate emission peak for the dust component (Baron & Netzer, 2019). By simultaneously constraining the AGN luminosity and peak location, the mass and covering fraction of the dusty wind are found. This technique can be applied to many AGNs in a deep survey, but we emphasize that understanding the nearby CGD is important to interpreting distant outflows.
5. Summary of Requirements
Emission, extinction/absorption, and scattering provide independent insights, and the combination is very powerful. Here we list requirements to observe the CGD in a large sample. The most progress can be made with a large FIR telescope and a medium-sized, wide field UV telescope.
| Detection Technique | Methodology | Required Capabilities |
|
Emission
(mid-IR to sub-mm) |
Fit SED to find temperature and size. Flux mass. Need highly inclined galaxies within Mpc. | : 2′′-4′′@ 160 m Sens./hr: 1 mJy @ 160 m FoV: 10′ |
|
Extinction
(optical to near-IR) |
Measure reddening around galaxies at in stacks. gives composition, mass. | Sky Area: 10,000 deg2 Sensitivity: 23 mag |
|
Scattering
(UV) |
Compare RN, galaxy SED to find . Flux mass. Need highly inclined galaxies within Mpc. | : 1′′ Sensitivity: 26 mag : 1200-2800Å (filters) FoV: 10′ |
|
Depletion
(UV) |
Measure depletion ratios from CGM absorption lines | : 1,000 cm2 : 20,000 (NUV) : 1200-3000Å |
References
References
- Baes & Viaene (2016) Baes, M., & Viaene, S. 2016, A&A, 587, A86
- Baron & Netzer (2019) Baron, D., & Netzer, H. 2019, MNRAS, 482, 3915
- Bocchio et al. (2016) Bocchio, M., Bianchi, S., Hunt, L. K., & Schneider, R. 2016, A&A, 586, A8
- Borthakur et al. (2015) Borthakur, S., Heckman, T., Tumlinson, J., et al. 2015, ApJ, 813, 46
- Bregman (1980) Bregman, J. N. 1980, ApJ, 236, 577
- Contursi et al. (2013) Contursi, A., Poglitsch, A., Graciá Carpio, J., et al. 2013, A&A, 549, A118
- Corrales (2015) Corrales, L. 2015, ApJ, 805, 23
- Corrales & Paerels (2012) Corrales, L., & Paerels, F. 2012, ApJ, 751, 93
- Danchi et al. (2018) Danchi, W., Heap, S., Woodruff, R., et al. 2018, in American Astronomical Society Meeting Abstracts, Vol. 231, American Astronomical Society Meeting Abstracts #231, 140.16
- Engelbracht et al. (2006) Engelbracht, C. W., Kundurthy, P., Gordon, K. D., et al. 2006, ApJ, 642, L127
- Ferrara et al. (1991) Ferrara, A., Ferrini, F., Franco, J., & Barsella, B. 1991, ApJ, 381, 137
- Gaskin et al. (2018) Gaskin, J. A., Dominguez, A., Gelmis, K., et al. 2018, in Society of Photo-Optical Instrumentation Engineers (SPIE) Conference Series, Vol. 10699, Space Telescopes and Instrumentation 2018: Ultraviolet to Gamma Ray, 106990N
- Heckman et al. (2017) Heckman, T., Borthakur, S., Wild, V., Schiminovich, D., & Bordoloi, R. 2017, ApJ, 846, 151
- Hodges-Kluck & Bregman (2014) Hodges-Kluck, E., & Bregman, J. N. 2014, ApJ, 789, 131
- Hodges-Kluck et al. (2016) Hodges-Kluck, E., Cafmeyer, J., & Bregman, J. N. 2016, ApJ, 833, 58
- Hoopes et al. (2005) Hoopes, C. G., Heckman, T. M., Strickland, D. K., et al. 2005, ApJ, 619, L99
- Howk & Savage (2000) Howk, J. C., & Savage, B. D. 2000, AJ, 119, 644
- Hutton et al. (2014) Hutton, S., Ferreras, I., Wu, K., et al. 2014, MNRAS, 440, 150
- Ishibashi & Fabian (2016) Ishibashi, W., & Fabian, A. C. 2016, MNRAS, 457, 2864
- Li (2015) Li, J.-T. 2015, MNRAS, 453, 1062
- Mathis et al. (1977) Mathis, J. S., Rumpl, W., & Nordsieck, K. H. 1977, ApJ, 217, 425
- McCormick et al. (2013) McCormick, A., Veilleux, S., & Rupke, D. S. N. 2013, ApJ, 774, 126
- McCormick et al. (2018) McCormick, A., Veilleux, S., Meléndez, M., et al. 2018, MNRAS, 477, 699
- Meléndez et al. (2015) Meléndez, M., Veilleux, S., Martin, C., et al. 2015, ApJ, 804, 46
- Ménard & Fukugita (2012) Ménard, B., & Fukugita, M. 2012, ApJ, 754, 116
- Ménard et al. (2010) Ménard, B., Scranton, R., Fukugita, M., & Richards, G. 2010, MNRAS, 405, 1025
- Montier & Giard (2004) Montier, L. A., & Giard, M. 2004, A&A, 417, 401
- Murray et al. (2005) Murray, N., Quataert, E., & Thompson, T. A. 2005, ApJ, 618, 569
- Mushotzky (2018) Mushotzky, R. 2018, in Society of Photo-Optical Instrumentation Engineers (SPIE) Conference Series, Vol. 10699, Space Telescopes and Instrumentation 2018: Ultraviolet to Gamma Ray, 1069929
- Nozawa & Fukugita (2013) Nozawa, T., & Fukugita, M. 2013, ApJ, 770, 27
- Peek et al. (2015) Peek, J. E. G., Ménard, B., & Corrales, L. 2015, ApJ, 813, 7
- Prochaska et al. (2017) Prochaska, J. X., Werk, J. K., Worseck, G., et al. 2017, ApJ, 837, 169
- Roussel et al. (2010) Roussel, H., Wilson, C. D., Vigroux, L., et al. 2010, A&A, 518, L66
- Secrest et al. (2015) Secrest, N. J., Dudik, R. P., Dorland, B. N., et al. 2015, The Astrophysical Journal Supplement Series, 221, 12
- Seon et al. (2014) Seon, K.-i., Witt, A. N., Shinn, J.-h., & Kim, I.-j. 2014, ApJ, 785, L18
- Shinn & Seon (2015) Shinn, J.-H., & Seon, K.-I. 2015, ApJ, 815, 133
- Smith et al. (2016) Smith, M. W. L., Eales, S. A., De Looze, I., et al. 2016, MNRAS, 462, 331
- Suzuki et al. (2018) Suzuki, T., Kaneda, H., Onaka, T., et al. 2018, MNRAS, 477, 3065
- Tumlinson et al. (2017) Tumlinson, J., Peeples, M. S., & Werk, J. K. 2017, ARA&A, 55, 389
- Yamagishi et al. (2012) Yamagishi, M., Kaneda, H., Ishihara, D., et al. 2012, A&A, 541, A10
- Yoshida et al. (2011) Yoshida, M., Kawabata, K. S., & Ohyama, Y. 2011, PASJ, 63, 493
- Zhang (2018) Zhang, D. 2018, Galaxies, 6, 114