Free-electron effects on optical absorption of hybrid perovskite CH3NH3PbI3 from first principles
Abstract
Hybrid organic-inorganic perovskites, such as methyl-ammonium lead tri-iodide (MAPbI3), are interesting candidates for efficient absorber materials in next-generation solar cells, partly due to an unusual combination of low exciton binding energy and strong optical absorption. Excitonic effects in this material have been subject to debate both for experiment and theory, indicating a need for better understanding of the screening mechanisms that act upon the electron-hole interaction. Here we use cutting-edge first-principles theoretical spectroscopy, based on density-functional and many-body perturbation theory, to study atomic geometries, electronic structure, and optical properties of three MAPbI3 polymorphs and find good agreement with earlier results and experiment. We then study the influence of free electrons on the electron-hole interaction and show that this explains consistently smaller exciton binding energies, compared to those in the material without free electrons. Interestingly, we also find that the absorption line shape strongly resembles that of the spectrum without free electrons up to high free electron concentrations. We explain this unexpected behavior by formation of Mahan excitons that dominate the absorption edge, making it robust against free-electron induced changes observed in other semiconductors.
I Introduction
Hybrid organic-inorganic perovskites have seen unprecedented development over the last years, largely motivated by their potential as highly efficient absorber materials for next-generation solar cells. Research on these materials for optoelectronic applications originates as far back as the 1990s; hybrid perovskites were initially reported as dye-sensitizers in TiO2 scaffolds in 2006 Green and Ho-Baillie (2017); Matas Adams et al. (2015). Since their development as thin-film meso-superstructured photovoltaics in 2012 Lee et al. (2012), their photo-conversion efficiency has risen to over 22.7 Ishihara (1994); Saliba et al. (2016); Green et al. (2015); Zhou and Zhu (2016). The most commonly studied material in this context is methyl-ammonium lead tri-iodide MAPbI3, with MA=CH3NH3, owing to cheap solution synthesis and high performance metrics. Besides photovoltaic applications, MAPbI3 and its stoichiometric counterparts MA(Pb,Sn)(I,Br,Cl)3 have shown promise in quantum dot fluorescence Deng et al. (2018), light-emitting diodes Zhang et al. (2017), and catalysis for water splitting Bin et al. (2016).
In addition to interesting applications, the combination of organic and heavy-metal constituents renders MAPbI3 an ideal candidate to study fundamental phenomena. One example is the strong spin-orbit interaction due to heavy atoms, that heavily reduces the band gap and dominates band dispersion near the conduction-band minimumEven et al. (2013); Mosconi et al. (2016). Another example, critically influencing whether a material is a good candidate for a photovoltaic absorber, is the electron-hole interaction: If it is strong in a material, strongly bound excitonic states appear near the absorption onset. These are associated with strong optical absorption that is beneficial for harvesting light using as little absorber material as possible. At the same time, strong electron-hole interaction renders separation of electron-hole pairs challenging, which is detrimental in a photovoltaic device Gregg (2003). Interestingly, MAPbI3 balances between low exciton binding energy and large optical absorption across the visible spectrum. This facilitates efficient generation of electron-hole pairs that can be thermally separated and is beneficial for photo-current generation Herz (2016).
This interesting balance triggered numerous studies, aimed at a better understanding of excitonic effects in MAPbI3. Experimental results for exciton binding energies range from as high as 62 meV to as low as 2 meV Herz (2016), however, a few patterns emerge: First, the line shape of the absorption edge has been reported to be comparable to that of GaAs, with no clear excitonic peak and a binding energy potentially under 10 meV at room temperature Chen et al. (2018). Second, a reduction of the exciton binding energy is observed when going from the low-temperature (LT) orthorhombic phase to the room-temperature (RT) tetragonal phase. Sestu et al. measured 34 meV (LT) to 29 meV (RT) Sestu et al. (2015), Galkowski et al. measured between 14 and 25 meV (LT) to 12 meV (RT) Galkowski et al. (2016), and Yang et al. measured 16 meV (LT) to between 5 and 12 meV (RT) Yang et al. (2015a). However, there are also examples for studies where RT exciton binding energies exceed LT binding energies in others D’Innocenzo et al. (2014); Yang et al. (2015a); Sestu et al. (2015); Savenije et al. (2014); Lin et al. (2014); Miyata et al. (2015); Sun et al. (2014); Galkowski et al. (2016); Yang et al. (2017).
Further insight into this variability comes from four-wave mixing spectroscopy, to disentangle exciton binding energies of intrinsic and defect-bound excitons March et al. (2016). These results indicate that intrinsic excitons have an LT binding energy of 13 meV, whereas values for defect-bound excitons average around 29 meV, linking the variability to different defect concentrations lest uncharacterized. In particular, while exciton binding energies in pure MAPbI3 are consistently lower than 35 meV for LT and RT phases, the addition of small amounts of chlorine into MAPbI3 thin films tends to increase this value to more than 50 meV D’Innocenzo et al. (2014); Wu et al. (2014).
While the variation of experimental results causes ongoing debate of the excitonic character of the absorption edge, first-principles theoretical spectroscopy can provide deeper understanding. To this end, Bokdam et al. used many-body perturbation theory (MBPT) and solved the Bethe-Salpeter equation (BSE) for the optical polarization function, reporting an exciton binding energy of 45 meV in tetragonal MAPbI3 Bokdam et al. (2016). Similarly, Zu et al. computed 40 meV Zhu et al. (2014) and Umari et al. computed 30 meV using a similar framework Umari et al. (2018). All three studies attribute the dielectric screening of the electron-hole Coulomb interaction exclusively to electronic interband transitions, corresponding to a high-frequency dielectric constant of MAPbI3 between 5 and 7Bokdam et al. (2016); Umari et al. (2018); Zhu et al. (2014). In another work Ahmed et al. used the BSE framework to predict a binding energy of 153 meV. While these calculations were done on a coarse 444 -point grid, likely leading to an overestimate of the binding energy Ahmed et al. (2014), the values of 45 meV Bokdam et al. (2016) and 40 meV Zhu et al. (2014) quoted above still overestimate experimental data.
However, exciton binding energies are critically influenced by the strength of the electron-hole interaction and, thus, dielectric screening in the material, both in experiment and calculations. This is important because the lattice structure of MAPbI3 is very polarizable, leading to a large static dielectric constant, possibly contributing to screening. To this end, Frost et al. showed that the static dielectric constant of 25.7, accounting for lattice and electronic polarizability, leads to an exciton binding energy of less than 1 meV in a Wannier-Mott model Frost et al. (2014). Evens et al. used a value of =11 to demonstrate that including lattice contributions to screening improves agreement with measured room-temperature absorption spectra Even et al. (2014). Menéndez-Proupin et al. use a parabolic-band with a Pollman-Büttner type model for polaron screening and find an exciton binding energy of 24 meV Menéndez-Proupin et al. (2015). Umari et al. also showed that including polar phonon screening reduces the binding energy from 30 meV to 15 meV Umari et al. (2018). Finally, Hakamata et al. employed non-adiabatic molecular dynamics to calculate the time-averaged exciton binding energy in a dynamical MAPbI3 lattice, predicting a binding energy of 12 meV and a dielectric constant between and , in excellent agreement with RT measured values Hakamata et al. (2016). Bokdam et al. provide arguments against the importance of lattice screening for exciton binding energies of MAPbI3 and instead invoke formation of polarons Bokdam et al. (2016).
In this work, we study the complementary problem of an additional screening contribution due to free electrons, arising from defects or donors in a sample. First-principles studies of multiple point defects in MAPbI3 showed that charged defects with low formation energy occupy shallow levels relative to the band extrema Yin et al. (2014); Kim et al. (2014); Liu and Yam (2018); Yang et al. (2015b). Wang et al. showed that synthesis with varying ratios of PbI2:MAI precursors can change samples from - to -type, with free-electron concentrations as high as cm-3 and even at a standard precursor ratio of 1:1 moles of PbI2 and MAI, a free-electron concentration of cm-3 was measured Wang et al. (2014). Other studies confirmed free-carrier concentrations in the range of – cm-3 Dymshits et al. (2015); Guerrero et al. (2014). Dielectric screening due to free electrons has been shown to reduce the strength of the electron-hole Coulomb interaction in ZnO Schleife et al. (2011); Kronenberger et al. (2012); Kang et al. (2019) and, together with Pauli blocking lead to formation of Mahan excitons Mahan (1967) at the absorption edge.
We speculate that these effects also affect exciton binding MAPbI3 and to clarify this, we perform accurate first-principles simulations of electronic structure and optical properties of MAPbI3. The remainder of the paper is organized as follows. Section II summarizes the theoretical and computational approach for solving the BSE to calculate optical response. Section III details results for atomic geometries, electronic structure, and optical properties. We compute exciton-binding energies and optical spectra, explicitly including various concentrations of free electrons that arise in the material for varying defect concentrations. Finally, Sec. IV summarizes and concludes this work.
II Computational approach
We use density functional theory (DFT) Kohn and Sham (1965); Hohenberg and Kohn (1964) to compute fully relaxed atomic geometries of the three experimentally most relevant polymorphs of MAPbI3, i.e. the orthorhombic (O), tetragonal (T), and cubic (C) phase. Their Brillouin zones (BZs) are sampled using -centered 4 4 4, 4 4 4, and 6 6 6 -point meshes, respectively. The projector-augmented wave (PAW) method is used to describe the electron-ion interaction Blöchl (1994) and single-particle wave functions are expanded into a plane-wave basis up to a cutoff energy of 600 eV. These parameters are sufficient to converge the total energy to within 5 meV per atom. The PBEsol exchange-correlation (XC) functional Perdew et al. (2008) has previously been used to predict accurate relaxed atomic geometries for MAPbI3 Brivio et al. (2015) and is used here for the same purpose.
In order to obtain equilibrium atomic geometries, we initialize the structures of the O, T, and C phases prior to relaxation using those reported in Ref. Brivio et al., 2015. This captures the symmetry of ordered MA cations in the O phase and a pseudo-random ordering of the MA sub-lattice in the T phase. While the C phase exhibits total disordering of the MA cation sub-lattice in experiment Whitfield et al. (2016), we study a pseudo-cubic phase with ordered MA cations. This approach is common in the literature to maintain the uniform alignment of PbI3 octahedra observed experimentally for the C phaseBrivio et al. (2015); Butler et al. (2015); Targhi et al. (2018). In experiment the cubic lattice also shows a slight pseudo-cubic behavior, due to rotations of the MA cations Whitfield et al. (2016). We verify that these atomic coordinates correspond to equilibrium structures by computing total energies for several unit-cell volumina within 1 % of the equilibrium value and determine the minimum. All atomic geometries were then relaxed until Hellman-Feynman forces are smaller than 10 meV/Å.
For these relaxed geometries we compute high- and low-frequency dielectric tensors using density functional perturbation theory (DFPT) Gajdoš et al. (2006) and the generalized-gradient approximation by Perdew, Burke, and Ernzerhof (PBE) Perdew et al. (1996) to describe XC. The BZs are sampled using -centered 5 5 5, 5 5 5, and 7 7 7 -point meshes for O, T, and C phases, respectively, for these calculations.
In order to compute electronic structures that can be compared to experiment, we overcome the well-known band gap underestimation of DFT by taking quasiparticle (QP) corrections into account within MBPT Umari et al. (2014). Furthermore, due to the presence of heavy-metal ions in MAPbI3, spin-orbit coupling (SOC) is included within the PAW approach Steiner et al. (2016). We performed +SOC calculations using 1 1 1, 1 1 1, and 2 2 2 -centered -point grids for O, T, and C phases, respectively. The Green’s function was iterated four times to converge QP band gaps to within 25 meV. 4000 empty bands were included for the O and T structures, and 2000 for the C phase.
Finally, we study optical response including excitonic effects by solving the Bethe-Salpeter equation (BSE) for the optical polarization function. The BSE in the Bloch basis can be written as an eigenvalue equation Rohlfing and Louie (2000); Fuchs et al. (2008a) for the Hamiltonian
| (1) |
The indices , , and , refer to conduction band, valence band, and point in reciprocal space, respectively. The term in parentheses on the right-hand side represents single-QP excitation energies of non-interacting electron-hole pairs, described by the QP band structure. For the QP energies and we use results computed using PBE+SOC, with the band gap rigidly shifted to the +SOC gap. Bloch integrals, that enter the exchange interaction and the screened Coulomb interaction between electrons and holes, are evaluated using spin-polarized DFT-PBE Kohn-Sham eigenstates. Electronic interband screening of the electron-hole Coulomb interaction is computed using the model dielectric function proposed by Bechstedt et al. in the absence of free carriers Bechstedt et al. (1992); Cappellini et al. (1993) and approximated as a dielectric constant when free carriers are taken into account Schleife et al. (2011); Kronenberger et al. (2012). Optical spectra of C MAPbI3 are computed over a wide energy range using a 11 11 11 -point grid with a small random shift and for a careful examination of the spectral onset up to an energy of 2.2 eV, a hybrid 5:2:32.5 -point grid is used (see Ref. Fuchs et al., 2008b for nomenclature). Independent-particle spectra for the O and T phases were computed using 7 7 7 points with a small random shift.
In order to describe the influence of free electrons, we account for Burstein-Moss shift (BMS), band-gap renormalization (BGR), and additional free-electron screening of the electron-hole interaction Schleife et al. (2011); Schleife (2011, 2010); Kang et al. (2019). This approach has been successfully used to describe optical properties of doped ZnO before Schleife et al. (2011); Kronenberger et al. (2012). BMS arises from Pauli blocking of the lowest conduction-band states that are occupied by the additional free electrons, and is taken into account via their occupation numbers. BGR is described as an additional scissor shift, computed using the analytical model of Berggren and Sernelius Berggren and Sernelius (1981). Finally, the intraband contribution to dielectric screening is described as a free-electron response, which in the limit of small wave vectors becomes
| (2) |
with the Thomas-Fermi wave vector
| (3) |
Here, is the concentration of free electrons in the system, is the vacuum permittivity, is the directionally averaged high-frequency dielectric constant of the material, and is the Fermi level corresponding to .
All DFT and calculations are carried out using the Vienna Ab-Initio Simulation Package Gajdoš et al. (2006); Kresse and Joubert (1999); Kresse and Furthmüller (1996); Shishkin and Kresse (2006) (VASP). The BSE calculations are performed using the implementation described in Refs. Rödl et al., 2008; Fuchs et al., 2008b. All input and output of this work is available in the Materials Data Facility mdf .
III Results and Discussion
III.1 Atomic Geometries
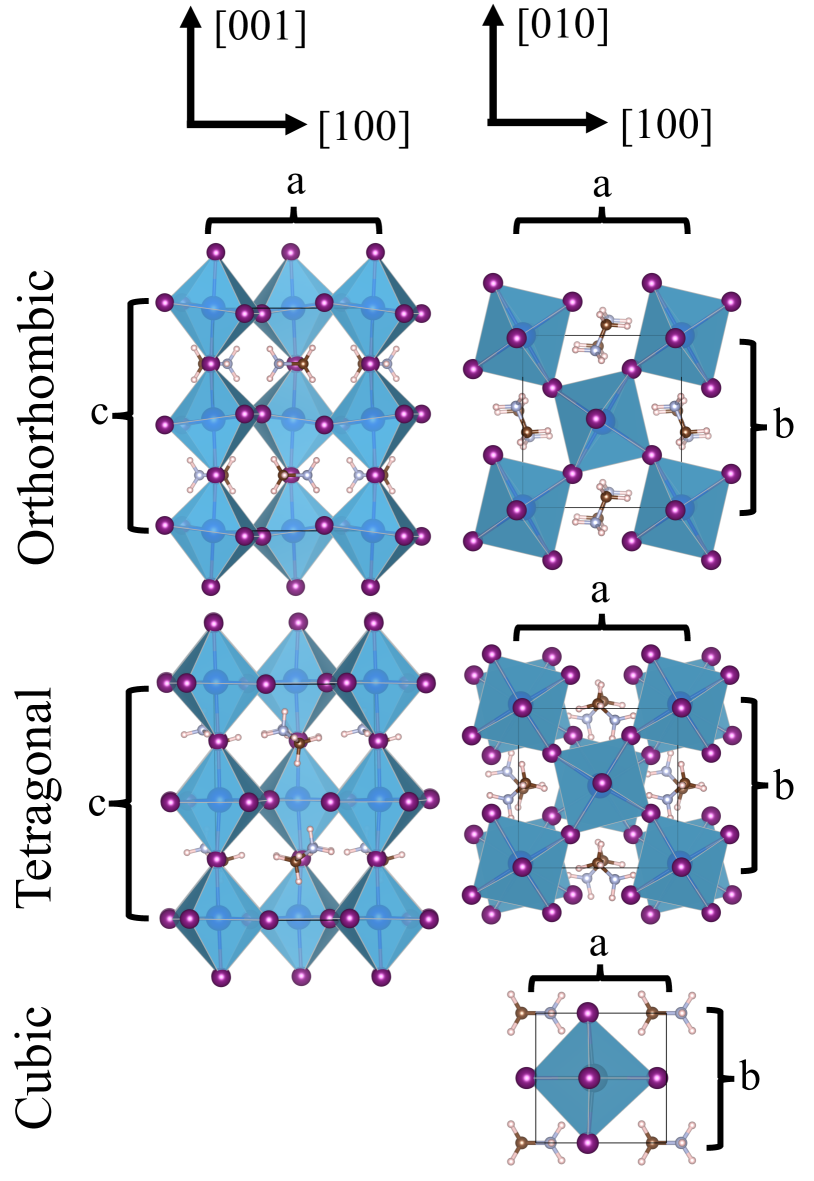
First, we study relaxed atomic geometries of the low-temperature equilibrium phase of MAPbI3, the orthorhombic (O) crystal structure with space group Pnma Ong et al. (2015); Whitfield et al. (2016). This phase has minimum entropy by ordering CH3NH3 ions periodically Brivio et al. (2015) and the PbI3 sub-lattice forms stacked octahedra that are tilted with respect to the [001] axis of the unit cell (see Fig. 1). Angles between lattice vectors are all 90∘ and the lattice parameters are non-equal, with =8.37, =9.07, and =12.67 Å. The axis agrees well with experimental values between 12.1 – 12.6 Å and the relaxed aspect ratio in this work of 0.921 only slightly underestimates that seen in experiments, 0.97 – 0.98Kong et al. (2015); Whitfield et al. (2016).
Experiment also shows that above =162 K, MAPbI3 undergoes a phase transformation to a tetragonal (T) phase with space group I4/mcm (see Fig. 1) Ong et al. (2015); Whitfield et al. (2016). This first-order phase transition is marked by three phenomena: First, we compute a change in lattice parameters from in the O to =8.70, =8.72, and =12.83 Å in the T phase. The relaxed structure results in good agreement between and with a difference of only Å. Second, there is disordering of CH3NH3 ions in the T phase, that leads to a disordered cation sub-lattice. To approximate this effect in our unit cell, we disorder the organic cations, based on the structures of Brivio et al. Brivio et al. (2015) This disorder is stabilized by -axis tilting in the T phase. Finally, alternating tilts of the octahedrons in the [001] direction appear, which in turn stabilizes the = condition Ong et al. (2015); Whitfield et al. (2016).
At even higher temperatures above =327 K, T MAPbI3 undergoes another transition to a cubic (C) phase with space group Pmm (see Fig. 1) Ong et al. (2015). This C phase is stabilized through total disordering of the MA cation sublattice. Since thermal rotation of MA cations is not accounted for in the geometry relaxation Whitfield et al. (2016), we follow the common approach of modelling this phase as a pseudo-cubic distortion of the Pmm cubic perovskite structure with ordered MA cations Ong et al. (2015); Whitfield et al. (2016). This lattice geometry is slightly triclinic; in experiment, it is also pseudo-cubic due to rotations of the MA cations Whitfield et al. (2016). Relaxed atomic geometries result in slightly tilted axes compared to the experimental Pmm phase, which agrees with earlier computational reports: Ong et al. showed that in DFT calculations the distorted C phase (space group ) is more stable compared to a constrained Pmm phase Ong et al. (2015). The average of the pseudo-cubic lattice constants =6.31 Å agrees well with measurements Whitfield et al. (2016).
Overall, our results for relaxed atomic geometries are in excellent agreement with values from experiment and previous calculations. A more detailed comparison to other work can be found in Table S1 of the supplemental material.
III.2 Electronic Structure
| Orthorhombic | Tetragonal | Cubic | |
| (PBE) | 1.55 | 1.40 | 1.51 |
| (PBE+SOC) | 0.66 | 0.70 | 0.56 |
| (+SOC) | 1.42 | 1.39 | 1.38 |
| (PBE) | 1.61Thind et al. (2017) | 1.45Thind et al. (2017), 1.68 Umari et al. (2014) | 1.44Thind et al. (2017) |
| (+SOC) | 1.81 Quarti et al. (2016), 1.32Filip and Giustino (2014) | 1.62 Umari et al. (2014), 1.67Quarti et al. (2016) | 1.28 Quarti et al. (2016), 1.48Ahmed et al. (2014) |
| (SS-+SOC) | 1.79Filip and Giustino (2014); Filip et al. (2015) | – | – |
| (QS+SOC) | – | – | 1.67Brivio et al. (2014) |
| (Exp.) | 1.65Quarti et al. (2016) | 1.5 – 1.61 Quarti et al. (2016) | 1.69 Quarti et al. (2016) |
| (DFPT) | 6.22 | 6.23 | 6.24 |
| (DFPT) | 23.17 | 22.66 | 22.1 |
| (DFPT) | 5.80 Pérez-Osorio et al. (2015) | 5.50 Umari et al. (2014), 6.60Umari et al. (2018) | 6.83 Bokdam et al. (2016) |
| (Exp.) | – | 5.00Sendner et al. (2016) | – |
| (DFPT) | 25.30Pérez-Osorio et al. (2015) | – | – |
| (MD) | – | 30.00Bokdam et al. (2016) | – |
| (Exp.) | – | 33.50Sendner et al. (2016), 28.80Poglitsch and Weber (1987) | – |
| (PBE+SOC) | 0.19 | 0.16 | 0.23 |
| (DFT+SOC) | 0.19Feng and Xiao (2014), 0.11Filip et al. (2015) | 0.15Frost et al. (2014) | 0.23 Giorgi et al. (2013) |
| (+SOC) | 0.16Filip et al. (2015) | 0.17 Umari et al. (2014) | – |
| (SS-+SOC) | 0.21Filip et al. (2015) | – | – |
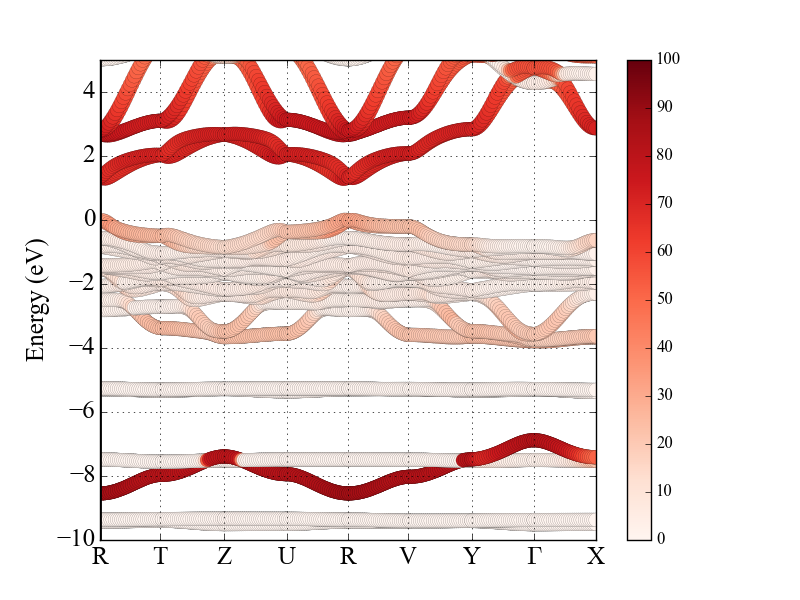
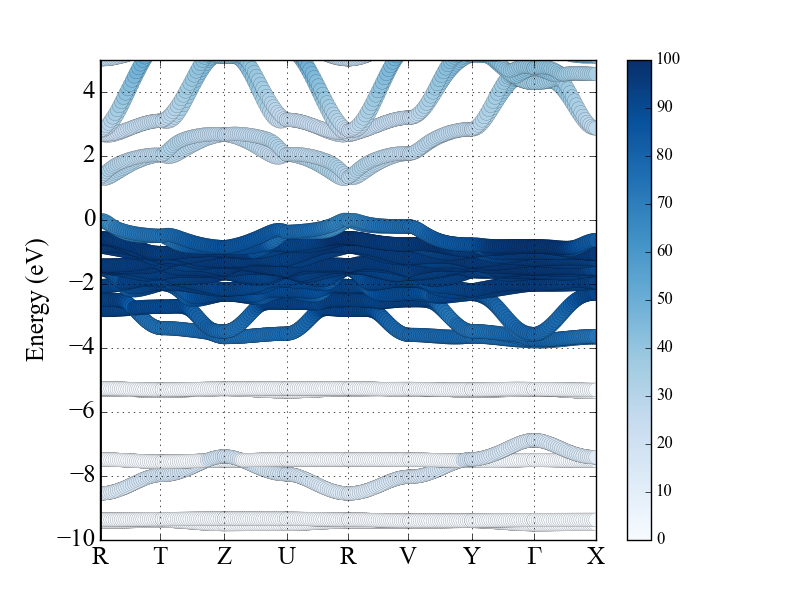
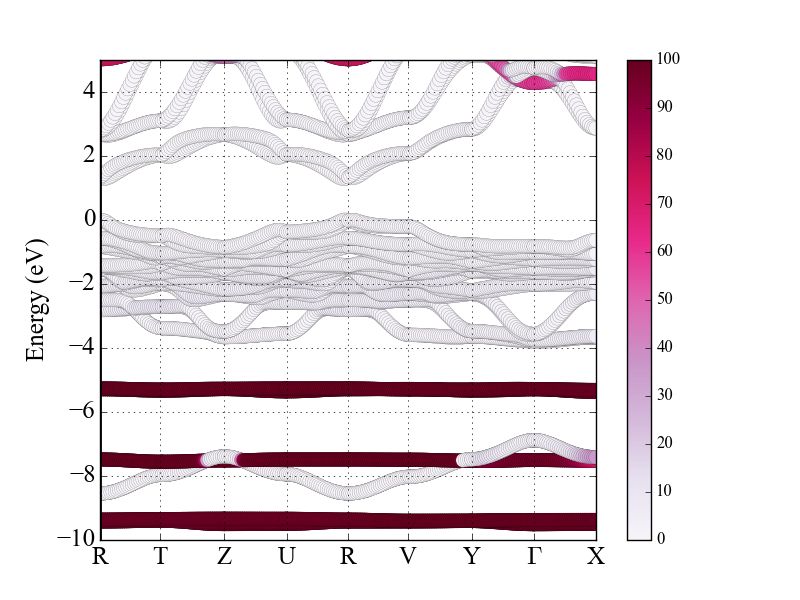
Using the +SOC approach, we compute band gaps of 1.42, 1.39, and 1.38 eV, for the O, T, and C phase, respectively (see Table 1). Figure 2 shows direct band gaps for each phase that are located at the point of the BZ for O and T phase, and at the point for the C phase. This change in reciprocal-space location of the direct gap is a consequence of cell symmetry Pedesseau et al. (2016). Our results for MAPbI3 band gaps are consistent with previous calculations and only slightly underestimate experimental values of 1.5 – 1.7 eV (see Table 1). This table also shows that previous calculations produced varying results based on the specific approximation and description of SOC Even et al. (2013); Umari et al. (2014); Mosconi et al. (2016); Park (2015). In particular, Filip and Giustino showed that different schemes for including relativistic effects and iterating the method resulted in different values for the gap: Using fully relativistic pseudopotentials for Pb and I and the scissor-self consistent method Filip and Giustino (2014) to iterate QP wave functions and eigenenergies, they predicted 1.79 eV for the orthorhombic phase Filip and Giustino (2014). Separately, Umari et al. reported 1.62 eV for the T phase Umari et al. (2014).
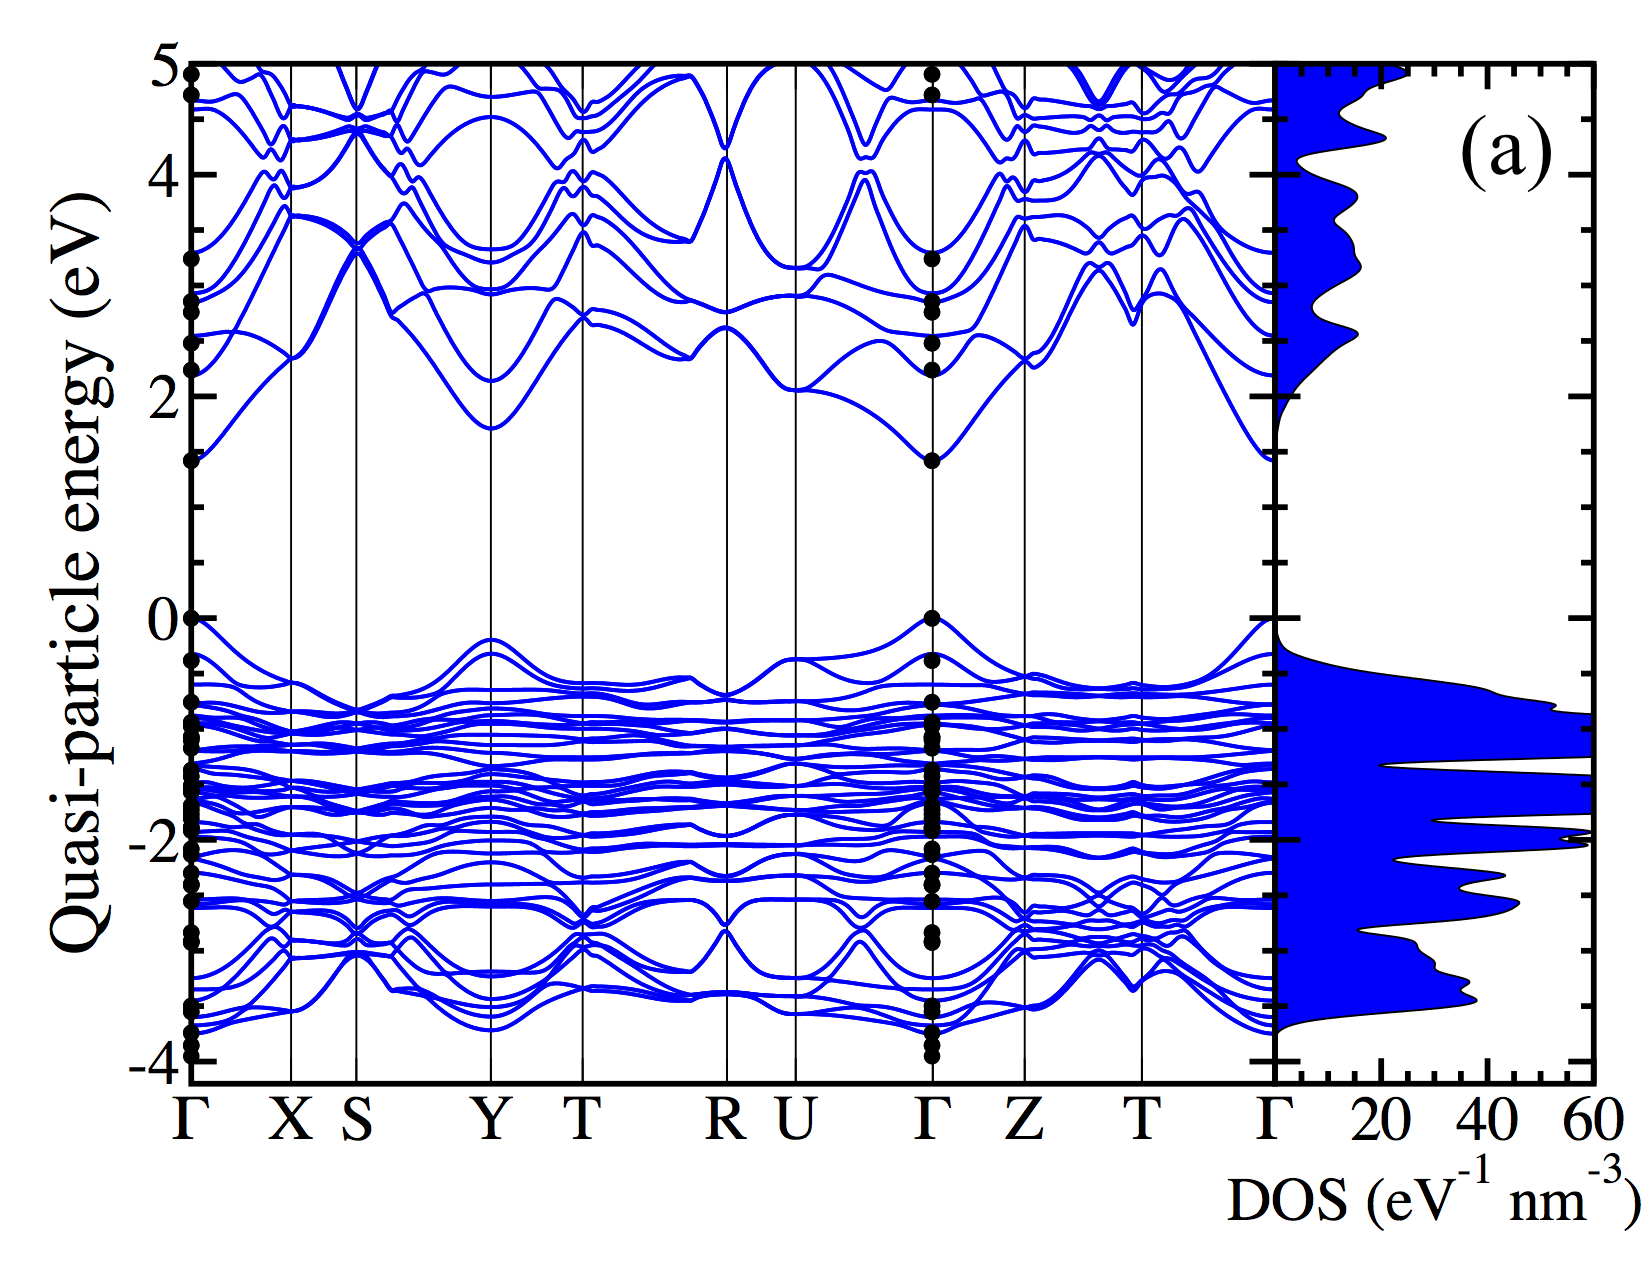
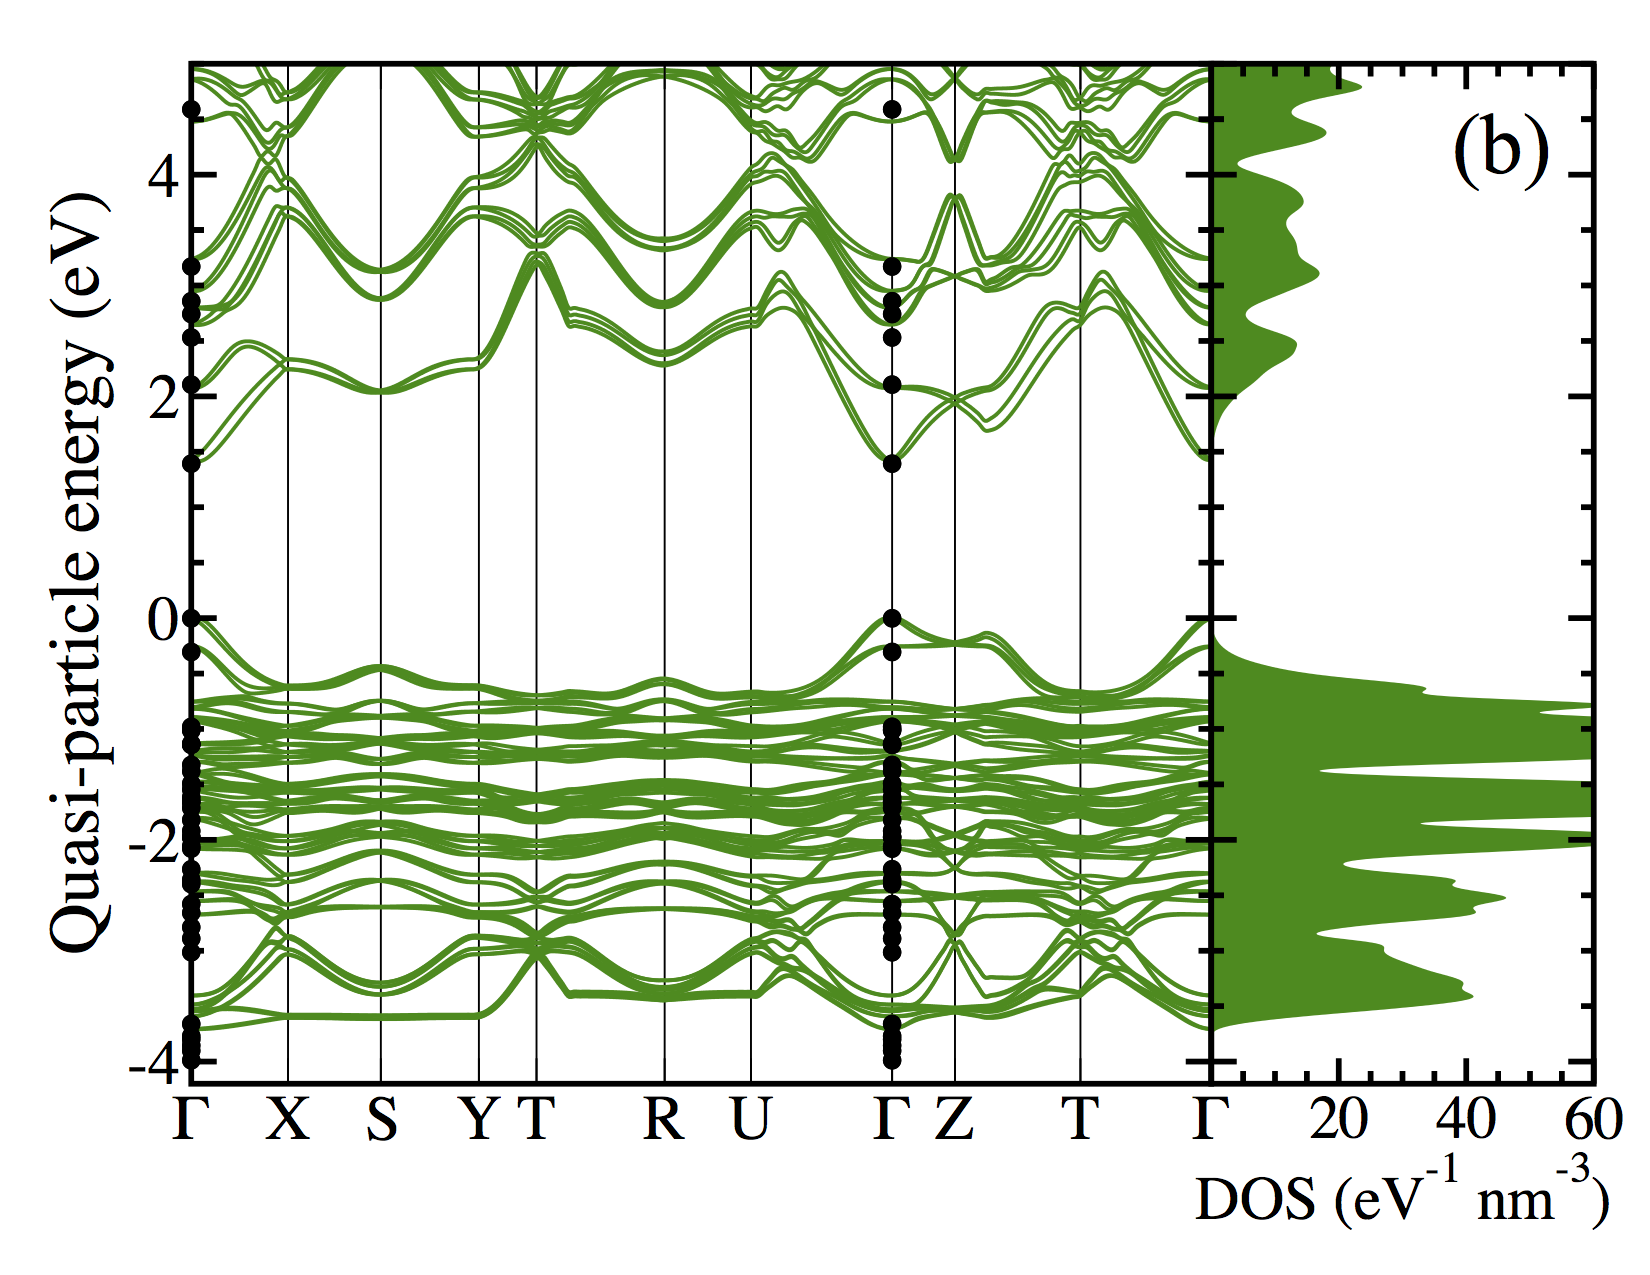
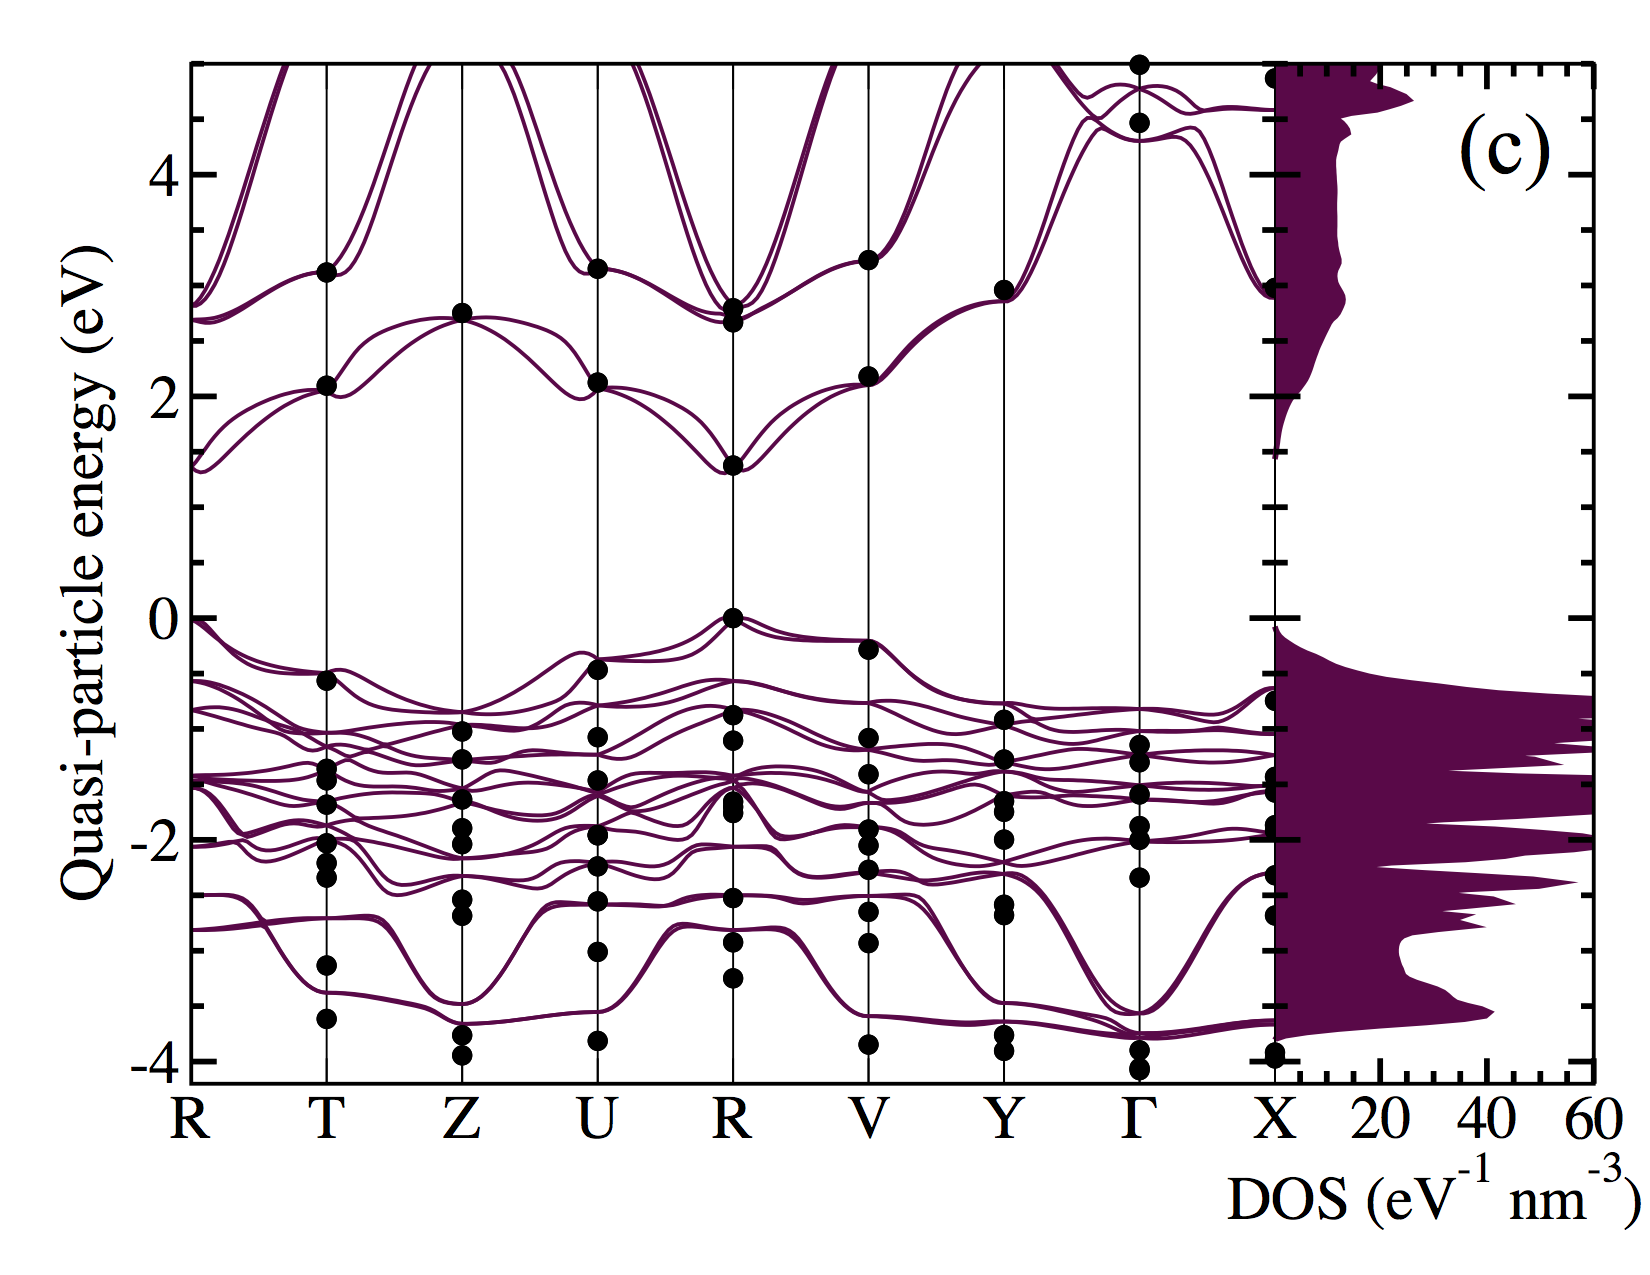
As expected, gaps at the PBE+SOC level of theory severely underestimate experimental results by more than eV for each phase. Using our +SOC data, we can correct this for the calculation of optical spectra, using a rigid scissor shift; we denote this approach by PBE++SOC. Figure 2 compares band structures of O, T, and C MAPbI3 at the PBE++SOC and +SOC levels of theory and illustrates the density of states (PBE++SOC). As can be seen in Fig. 2 the direct nature of the gap is broken by a strong Rashba-Dresselhaus spin-orbit splitting for C MAPbI3. The effect is smaller for T MAPbI3 and has been studied extensively for T and C phases Mosconi et al. (2016); Etienne et al. (2016); Mosconi et al. (2017).
By comparing +SOC energies at high-symmetry points to the electronic structure from PBE++SOC in Fig. 2, we illustrate for C MAPbI3 that the latter is a suitable basis for optical calculations. Here we are interested in optical response in the visible spectral range, hence, we focus on electronic states within 1.6 eV of the band extrema. As can be seen in Fig. 2(c) the conduction band dispersions from both approaches are in excellent agreement in this energy range: While the direct gap appears at , the largest deviation for the lowest conduction band amounts to about 0.15 eV and occurs at the -point. Overall, the valence bands are also in good agreement between both approaches. PBE++SOC results tend to predict valence band energies only slightly higher in energy than those predicted by +SOC, for instance 0.4 eV at the point [see Fig. 2(c)]. The overall width of the uppermost valence block is 0.35 eV larger at the +SOC level of theory. Hence, overall, our data indicates that excitation energies are underestimated by at most 0.3 – 0.4 eV when computing optical spectra starting from the PBE++SOC electronic structure. Finally, effective electron masses are determined by a parabolic fit near the band edge of our PBE++SOC data and also reported in Table 1.
III.3 Optical Response: Independent-quasiparticle approximation
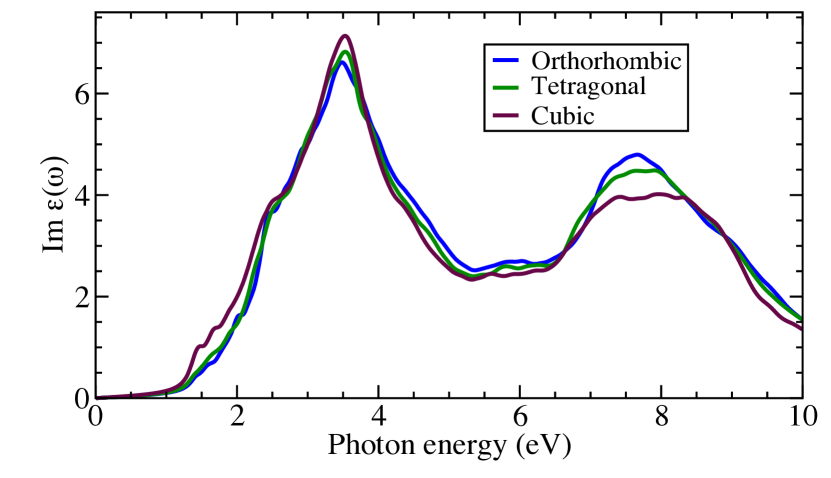
The optical absorption spectra of all three MAPbI3 phases share similar spectral features, as shown in Fig. 3. In this figure, we illustrate the polarization-averaged imaginary parts of the dielectric functions, computed using the independent-quasiparticle approximation within PBE++SOC. Our results agree overall well in the visible region between 1.5 and 3 eV with the absorption coefficient calculated using fully-relativistic +SOC Umari et al. (2014) for T MAPbI3, as shown explicitly in Fig. S4 of the supplemental material.
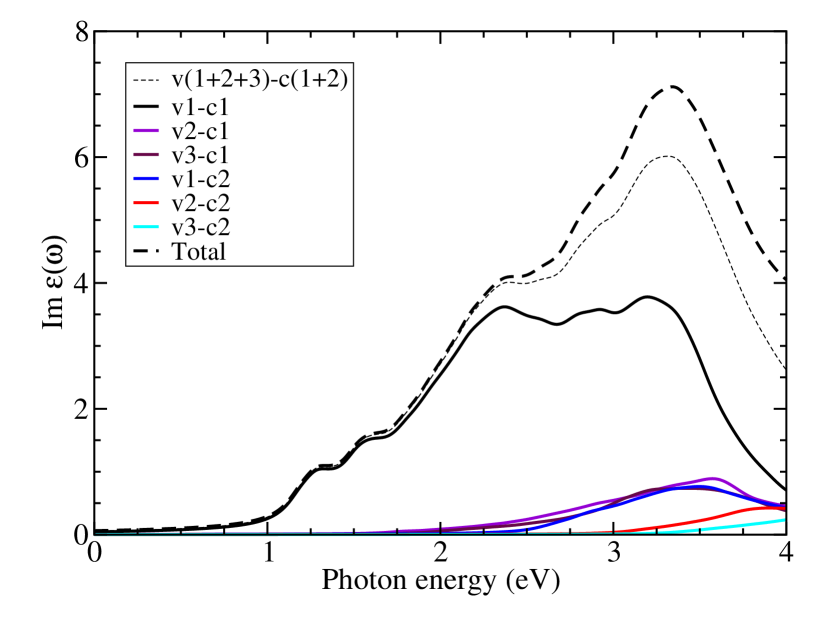
Figure 3 shows a smooth, gradual onset of absorption at the band gap for all three phases. At higher energies near 2.4 eV all spectra show a shoulder feature which we attribute to optical transitions between the uppermost valence band and lowest conduction band at points slightly away from the location of the band extrema (see Fig. S2 in the supplemental material). The difference of the lowest conduction and highest valence bands shows that transitions near the , , and point (orthorhombic), near the and point (tetragonal), and near the , , and point (cubic) dominate between 2.2 and 2.6 eV. From the shoulder, further increases into the UV energy region and peaks at 3.48, 3.53, and 3.53 eV for O, T, and C phase, respectively. The major contributions to this peak are optical transitions between the highest valence band and lowest conduction band at points far from the location of the band extrema, e.g. the point in C MAPbI3. Fig. S3 in the supplemental information also indicates that there are minor contributions from transitions from lower valence bands into the lowest conduction band. Our assignment of these spectral features agrees with that in Ref. Herz, 2016. Finally, after this peak optical response, decreases until about 5.3 eV and then increases again gradually to a much broader peak, centered around 7.7 eV, which is far outside the visible spectrum.
We also computed the static () and static electronic () dielectric constants of MAPbI3 using DFPT and the PBE electronic structure. For we find very similar values around 6.23 for all three phases (see Table 1). Our results are in the midst of previously calculated and measured values ranging from 5.5 to 7.0 Pérez-Osorio et al. (2015); Umari et al. (2014); Bokdam et al. (2016); Manser and Kamat (2014). We confirmed that the same magnitude but opposite sign of quasi-particle and SOC induced shifts, reported before for band gaps Umari et al. (2014), justifies using DFPT based on the PBE electronic structure to compute dielectric constants. Due to the large lattice polarizability of MAPbI3, our DFPT results for are much larger than , with values of 22.1 – 23.2 for the three phases (see Table 1). These results are in good agreement with earlier data from DFPT and molecular dynamics simulations, as well as experimental measurements, in the range of 25 – 35Sendner et al. (2016); Poglitsch and Weber (1987).
III.4 Optical Response: Excitonic effects
Next, we study the influence of excitonic effects on optical absorption of MAPbI3. To this end, Fig. 4 compares the independent-quasiparticle spectrum to the solution of the BSE, accounting for electronic interband screening as described by a model dielectric function Bechstedt et al. (1992); Cappellini et al. (1993) parameterized using a dielectric constant of =6.24 (see Table 1). Given the similarities of the independent-quasiparticle optical spectra of the three different phases (see Fig. 3), we only focus on C MAPbI3 in the following.
For C MAPbI3, Fig. 4 shows that excitonic effects cause a significant red shift of the absorption onset and of higher-energy features. While the onset of the independent-quasiparticle spectrum occurs at the +SOC band gap of 1.38 eV (see Table 1), the lowest eigenvalue of the BSE Hamiltonian is about 64.5 meV lower in energy. Note, that this value is not a well-converged result for the exciton binding energy due to k-point sampling, as we discuss below Fuchs et al. (2008a). Energy positions of higher-energy spectral features show larger excitonic shifts; for instance, the main peak around 3.5 eV in independent-quasiparticle approximation red-shifts by about 0.5 eV. The shift is accompanied by a redistribution of spectral weight: When including excitonic effects, features at lower energies are amplified, thus increasing the amplitude of optical absorption at lower energies.
Interestingly, in Fig. 4 positions of peaks and shoulders in the experimental spectrum seem to agree better with the independent-quasiparticle spectrum. However, we emphasize the notable difference of about 0.2 – 0.3 eV of the absorption onsets that is apparent in the figure and originates from the slightly smaller +SOC gap, compared to experiment. If this is corrected for, e.g. by rigidly shifting the absorption onset to the experimental value, we find excellent agreement of the BSEel++SOC result with experiment across the entire energy range, while the independent-particle spectrum then overestimates the position of the main peak around 3.5 eV by about 0.2 – 0.3 eV. In the following, we analyze how the description of the optical response changes in the presence of free electrons.
III.5 Optical Response: Free electrons
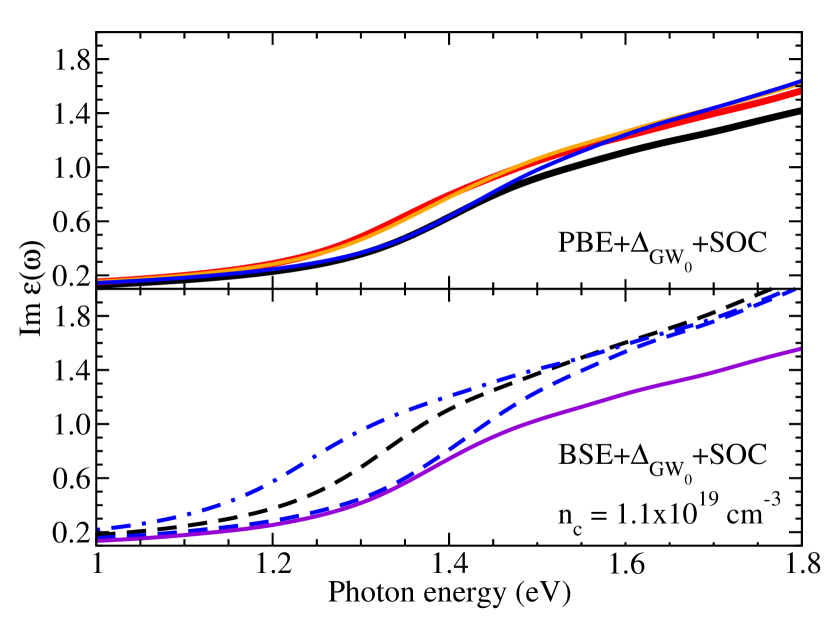
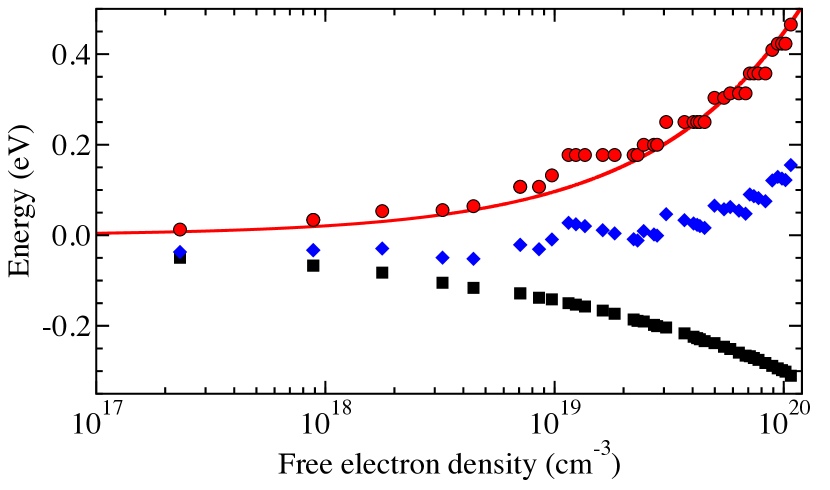
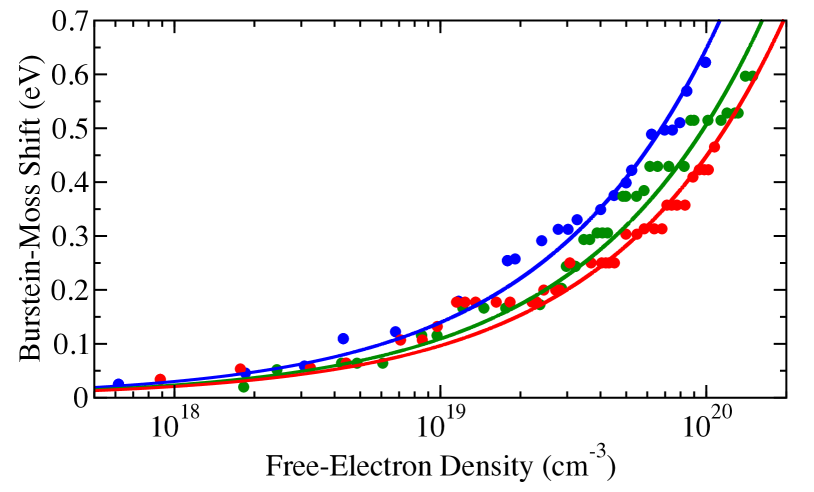
We first study how Burstein-Moss shift (BMS) and band-gap renormalization (BGR), i.e. two effects attributed to free electrons in the conduction band of C MAPbI3, affect the independent-quasiparticle optical spectrum (see top panel of Fig. 5). The predicted BMS due to Pauli blocking of optical transitions for a free-electron density of cm-3 is less than 2 meV and only reaches a value of about 10 meV for cm-3 (see Fig. 6). Realistic intrinsic or type shallow defect concentrations or free-electron-hole densities under illumination Manser and Kamat (2014) fall within the range of cm-3 to cm-3 and we conclude that for these BMS is only a minor factor. However, we note that high-intensity illumination has produced free-carrier concentrations around cm-3Manser and Kamat (2014). In Fig. 6 we show that in this regime BMS can be on the order of 0.1 eV and quickly increases thereafter, approximately following a dependence.
At the same time, Fig. 6 also illustrates that BGR is on the same order of BMS for C MAPbI3, but with an opposite sign. As a result, these two effects compensate each other to very high accuracy across an unusually large free-electron range, up to about cm-3. This explains why experimental observation of BMS+BGR at the absorption edge Manser and Kamat (2014); Fu et al. (2017) requires very high free-carrier concentrations: Valverde et al. do not explicitly report Valverde-Chávez et al. (2015) any effect of BMS or BGR at a free-carrier density of about cm-3. Manser et al. reportManser and Kamat (2014) a rise of the onset by about 0.08 eV for = cm-3, which is between our result for BMS and BMS+BGR.
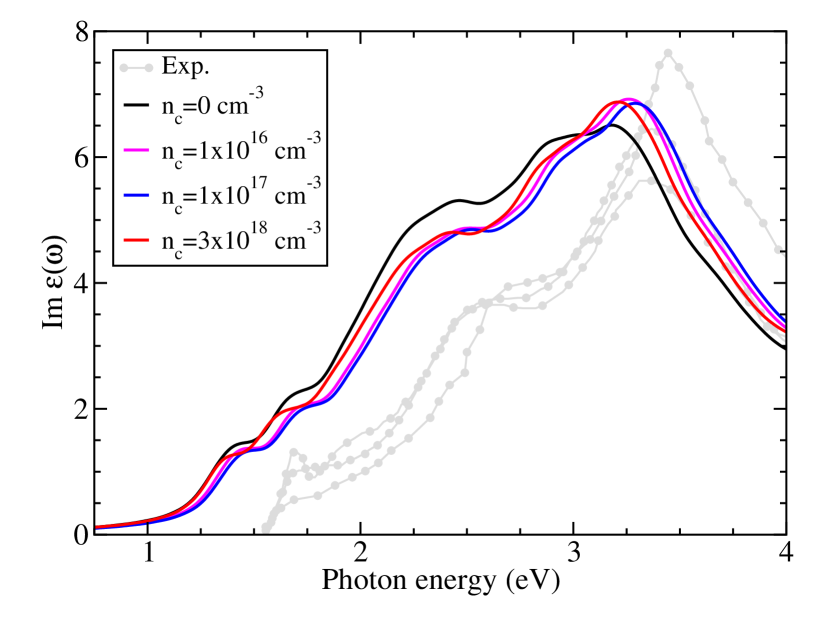
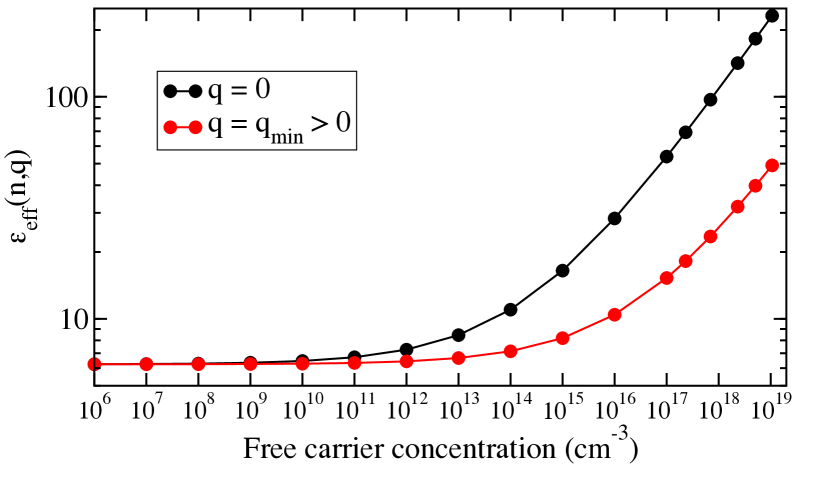
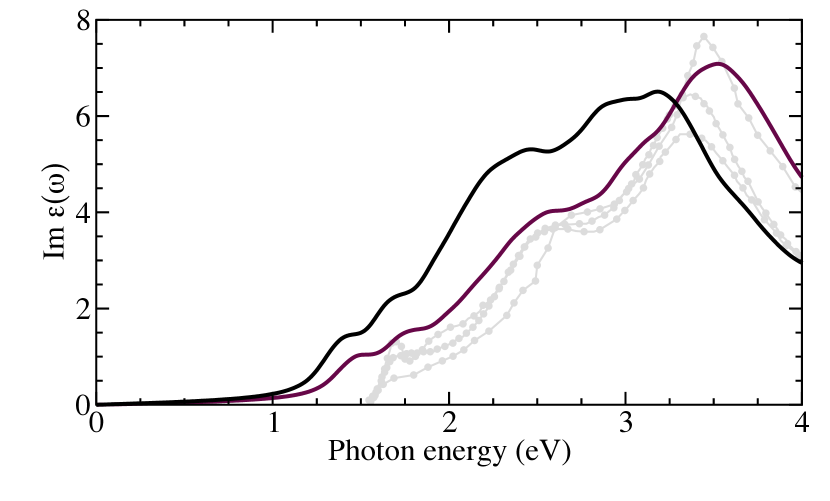
Next, in order to describe the influence of free electrons on the electron-hole interaction and, thus, excitonic effects, we describe electronic interband screening by a dielectric constant and include free-electron screening using Eq. (2) when solving the BSE. Figure 7 compares the resulting imaginary part of the dielectric function of C MAPbI3 without free electrons to results for three different free-electron concentrations. While we find a blue shift of about 0.2 eV for the main absorption peak around 3 eV, interestingly the absorption onset is almost unaffected by free electrons, both in terms of energy position and line shape. The energy position of the absorption onset barely changes since (i) BMS and BGR largely compensate each other over a large range of free-electron concentrations (see Fig. 6), and (ii) at the same time, the exciton binding energy is small already in the system without free-electrons. Hence, its reduction in the presence of free electrons and the formation of a Mahan exciton, does not lead to significant shifts of the absorption edge. Below we discuss that this Mahan exciton is also the reason why the absorption line shape barely changes in the system with free electrons.
In addition, in Fig. 7 we compare to three experimental results Löper et al. (2015); Chen et al. (2015); Shirayama et al. (2016). These show good consistency for the major spectral features, i.e. the onset at 1.55 eV, the shoulder at 2.62 – 2.69 eV, and the peak at 3.35 – 3.44 eV. These peaks and shoulders are reproduced well in our simulations. The only major difference is that the computed spectra appear red shifted with respect to experiment, which above we attributed to the difference of the single-QP band gaps (see Table 1). The optical absorption band width, captured by the energy difference of absorption onset and main peak, is 0.15 eV larger when free electrons are present and in slightly better agreement with experiment than the spectrum without free electrons. Also, the ratio of the dielectric function at the main peak and the shoulder at about 0.5 eV lower energies of 0.53, 0.58, and 0.66 in experiment Löper et al. (2015); Chen et al. (2015); Shirayama et al. (2016), improves from 0.82 without free electrons to about 0.7 when accounting for free electrons. Another notable feature is the narrowing of the spectral peak width when free electrons are included, improving agreement with experiment.
Finally, in the bottom panel of Fig. 5 we illustrate the Mahan-exciton character of the line shape of the absorption spectrum near the onset, for a high free-electron concentration of 1.11019 cm-3. To this end, the blue curves show BSE results with (dashed) and without (dot-dashed) the effect of Pauli blocking; both include free-electron screening of the electron-hole interaction as well as BGR. Comparing these two curves, shows that Pauli blocking turns the concave line shape (dot-dashed) into a steeper, more convex line shape (dashed) that resembles the case without free electrons much more closely (black dashed). Hence, this enhancement of the absorption edge can be attributed to the Fermi-edge singularity that only enters when Pauli blocking is included, which is a defining characteristic of the Mahan exciton Mahan (1967). In addition, we also compare to the result that accounts for lattice screening via the dielectric constant (violet curve) and find that in this case the line shape is again more concave. Thus, Fig. 5 shows that Mahan excitons are the reason that the convex line shape of the case without free electrons is largely preserved up to free-electron concentrations as large as 1.11019 cm-3. Results that neglect Pauli blocking or approximately capture lattice screening lead to more concave onsets.
III.6 Exciton binding energy
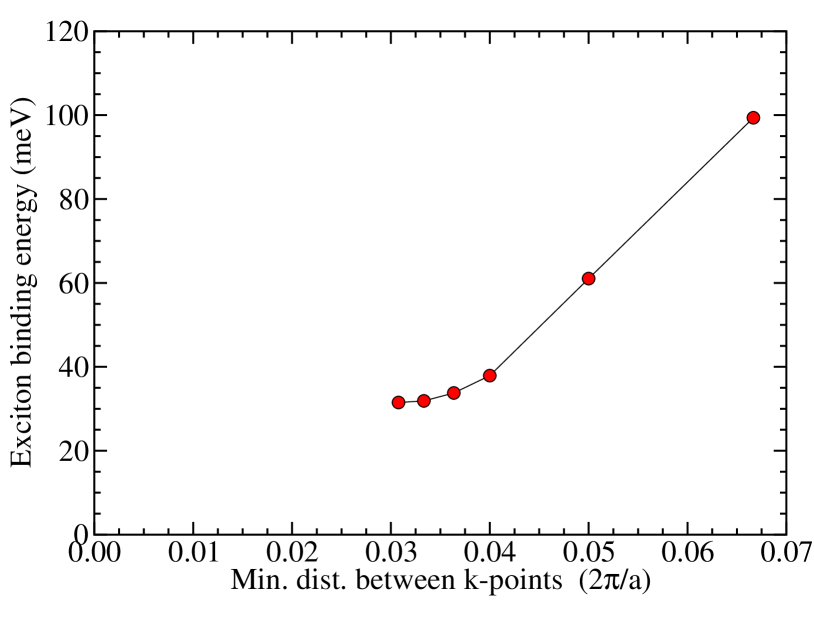
In order to show that the Mahan exciton indeed corresponds to a bound excitonic state that persists in the material despite the presence of free electrons, we computed converged exciton binding energies as the difference between the lowest eigenvalue of the excitonic Hamiltonian and the lowest single-QP excitation energy. It has been shown before that accurate k-point convergence of the lowest-exciton eigenvalue is challenging and requires dense sampling of the band extrema, in particular for Wannier-Mott type excitons Fuchs et al. (2008b). We use hybrid k-point meshes to accomplish this and systematically increase the sampling density (see Fig. S1 in the supplemental material). The densest grid used here samples the entire Brillouin zone by k points, but the inner third is replaced by a k-point mesh. The resulting mesh is shifted to center around the direct gap at the -point of the BZ of C MAPbI3.
The resulting value for the exciton-binding energy in C MAPbI3 without free-electrons is = meV. This is in good agreement with the highest values measured experimentally and other first-principles calculations: Umari et al. Umari et al. (2018) predicted 30 meV and Bokdam et al. report 45 meV for the tetragonal phase Bokdam et al. (2016). The degree of Rashba-Dresselhaus shift is also higher in our work due to a large inversion asymmetry of the relaxed pseudo-cubic phase, leaving fewer states closer to the band-edge.
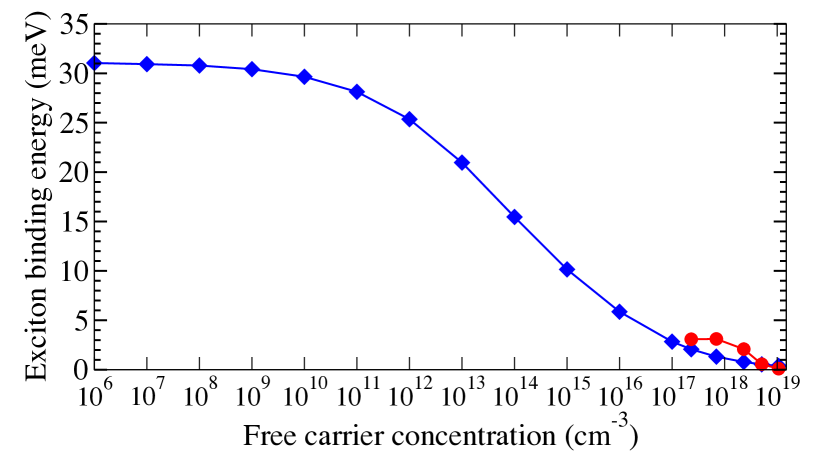
Next, we compute the change of the exciton binding energy of C MAPbI3 for finite free-electron concentrations in the conduction band, using BSE calculations that account for additional free-electron screening via Eq. (2). Figure 8 shows the resulting decrease of the exciton-binding energy. For free-electron concentrations around cm-3, which is comparable to concentrations of charged and shallow defects in highly pure, single-crystalline samples Shi et al. (2015), our results show that the exciton binding energy decreased from 31.9 meV to 28.13 meV. This is still above the thermal dissociation energy at room temperature and, thus, free-electron screening is not a critical factor. The data in Fig. 8 also shows a significant drop of the binding energy from 25.35 meV to 10.15 meV for free-electron concentrations of – cm-3. We note that this is the range where the term in Eq. (2) becomes significant and, thus, free-electron screening becomes the dominant mechanism over electronic interband screening. We illustrate this explicitly in Fig. S6 of the supplemental material. This results in the overall decline of the exciton binding energy with increasing free-electron concentration.
At even higher free-electron concentrations between and cm-3, corresponding to those observed in precursor mismatched samples Wang et al. (2014), the exciton-binding energy is very small, between 5.87 and 2.84 meV (see Fig. 8). Up to free-electron concentrations of cm-3, finite -point sampling prevents us from explicitly including Pauli blocking in the BSE calculations even for the most dense -point grid. Hence, we explore the effect of Pauli blocking due to filling of the conduction band only for higher free-electron concentrations. For these, Fig. 8 shows an increase of the binding-energy by up to 2 meV between = and 2.3 cm-3, compared to calculations that neglect Pauli blocking. This increase has been attributed to the Fermi-edge singularity that arises when Pauli blocking is taken into account and is a characteristic feature of Mahan excitons Mahan (1967). While the small increase of the exciton-binding energy itself is not significant enough to recover a bound exciton at room temperature in samples with a large concentration of free electrons, the Mahan exciton still dominates the line shape of the absorption edge in C MAPbI3, as we discussed above for Fig. 5.
IV Conclusions and Outlook
In this work we provide a thorough understanding of the absorption line shape and lowest exciton binding energy of MAPbI3. Using cutting-edge first-principles theoretical spectroscopy, based on density-functional and many-body perturbation theory, we obtain accurate results for atomic geometries, single-particle electronic structure, and two-particle optical absorption spectra. These results are a solid foundation for our analysis of free-electron induced effects. We show that Burstein-Moss shift and band-gap renormalization cancel each other across a large range of free-electron concentrations. By including these effects as well as free-electron induced dielectric screening when solving the Bethe-Salpeter equation, we explain strongly reduced exciton binding energies, compared to the material without the presence of free electrons. This elucidates how a wide range of intrinsic free-electron concentrations in MAPbI3 results in a range of exciton binding energies between 2 – 30 meV, granting insight into a potential source of variance in experimentally measured exciton binding energies.
Furthermore, we show that the excitons in the presence of free electrons arise from the Fermi edge singularity, proving their Mahan-exciton character. They determine the line shape of the absorption onset and as a result, the onset still resembles that of the system without free electrons up to very high free-electron concentrations. Hence, MAPbI3 largely maintains its excellent absorption properties in terms of energy position and line shape. This can explain why the material remains an excellent photovoltaic absorber even though in real samples free electrons will inevitably be present. More generally, our results make clear that additional screening of the electron-hole Coulomb interaction by free-electron effects is important in predicting accurate exciton binding energies in MAPbI3, illustrating that a deeper knowledge of electron-hole Coulomb interaction, beyond electronic interband screening, is required.
Acknowledgements.
This work was supported by the National Science Foundation under Grant No. CBET-1437230. This work made use of the Illinois Campus Cluster, a computing resource that is operated by the Illinois Campus Cluster Program (ICCP) in conjunction with the National Center for Supercomputing Applications (NCSA) and which is supported by funds from the University of Illinois at Urbana-Champaign. This research is part of the Blue Waters sustained-petascale computing project, which is supported by the National Science Foundation (awards OCI-0725070 and ACI-1238993) and the state of Illinois. Blue Waters is a joint effort of the University of Illinois at Urbana-Champaign and its National Center for Supercomputing Applications.References
- Green and Ho-Baillie (2017) M. A. Green and A. Ho-Baillie, ACS Energy Lett. 2, 822 (2017).
- Matas Adams et al. (2015) A. Matas Adams, J. M. Marin-Beloqui, G. Stoica, and E. Palomares, J. Mater. Chem. A 3, 22154 (2015).
- Lee et al. (2012) M. M. Lee, J. Teuscher, T. Miyasaka, T. N. Murakami, and H. J. Snaith, Science 338, 643 (2012).
- Ishihara (1994) T. Ishihara, J. Lumin. 60, 269 (1994).
- Saliba et al. (2016) M. Saliba, T. Matsui, K. Domanski, J.-Y. Seo, A. Ummadisingu, S. M. Zakeeruddin, J.-P. Correa-Baena, W. R. Tress, A. Abate, A. Hagfeldt, and M. Grätzel, Science 354, 206 (2016).
- Green et al. (2015) M. Green, K. Emery, Y. Hishikawa, W. Warta, and E. Dunlop, Prog. Photovolt. Res. Appl. 23 (2015).
- Zhou and Zhu (2016) Y. Zhou and K. Zhu, ACS Energy Lett. 1, 64 (2016).
- Deng et al. (2018) W. Deng, H. Fang, X. Jin, X. Zhang, X. Zhang, and J. Jie, J. Mater. Chem. C 6, 4831 (2018).
- Zhang et al. (2017) L. Zhang, X. Yang, Q. Jiang, P. Wang, Z. Yin, X. Zhang, H. Tan, Y. M. Yang, M. Wei, B. R. Sutherland, E. H. Sargent, and J. You, Nat. Comm. 8, 15640 (2017).
- Bin et al. (2016) A. R. Bin, M. Yusoff, and J. Jang, Chem. Commun. 52, 5824 (2016).
- Even et al. (2013) J. Even, L. Pedesseau, J.-M. Jancu, and C. K. Katan, J. Phys. Chem. Lett. 4, 2999 (2013).
- Mosconi et al. (2016) E. Mosconi, P. Umari, and F. De Angelis, Phys. Chem. Chem. Phys. 18, 27158 (2016).
- Gregg (2003) B. A. Gregg, J. Phys. Chem. B 107, 4688 (2003).
- Herz (2016) L. M. Herz, Annu. Rev. Phys. Chem. 67, 65 (2016).
- Chen et al. (2018) X. Chen, H. Lu, Y. Yang, and M. C. Beard, J. Phys. Chem. Lett. 9, 2595 (2018).
- Sestu et al. (2015) N. Sestu, M. Cadelano, V. Sarritzu, F. Chen, D. Marongiu, R. Piras, M. Mainas, F. Quochi, M. Saba, A. Mura, and G. Bongiovanni, J. Phys. Chem. Lett. 6, 4566 (2015).
- Galkowski et al. (2016) K. Galkowski, A. Mitioglu, A. Miyata, P. Plochocka, O. Portugall, G. E. Eperon, J. T.-W. Wang, T. Stergiopoulos, S. D. Stranks, H. J. Snaith, and R. J. Nicholas, Energy Environ. Sci. 9, 962 (2016).
- Yang et al. (2015a) Y. Yang, D. P. Ostrowski, R. M. France, K. Zhu, J. van de Lagemaat, J. M. Luther, and M. C. Beard, Nat. Photonics 10, 53 (2015a).
- D’Innocenzo et al. (2014) V. D’Innocenzo, G. Grancini, M. J. P. Alcocer, A. R. S. Kandada, S. D. Stranks, M. M. Lee, G. Lanzani, H. J. Snaith, and A. Petrozza, Nat. Comm. 5, 3586 (2014).
- Savenije et al. (2014) T. J. Savenije, C. S. Ponseca, L. Kunneman, M. Abdellah, K. Zheng, Y. Tian, Q. Zhu, S. E. Canton, I. G. Scheblykin, T. Pullerits, A. Yartsev, and V. Sundström, J. Phys. Chem. Lett. 5, 2189 (2014).
- Lin et al. (2014) Q. Lin, A. Armin, R. C. R. Nagiri, P. L. Burn, and P. Meredith, Nat. Photonics 9, 106 (2014).
- Miyata et al. (2015) A. Miyata, A. Mitioglu, P. Plochocka, O. Portugall, J. T.-W. Wang, S. D. Stranks, H. J. Snaith, and R. J. Nicholas, Nat. Phys. 11, 582 (2015).
- Sun et al. (2014) S. Sun, T. Salim, N. Mathews, M. Duchamp, C. Boothroyd, G. Xing, T. C. Sum, and Y. M. Lam, Energy Environ. Sci. 7, 399 (2014).
- Yang et al. (2017) Z. Yang, A. Surrente, K. Galkowski, N. Bruyant, D. K. Maude, A. A. Haghighirad, H. J. Snaith, P. Plochocka, and R. J. Nicholas, J. Phys. Chem. Lett. 8, 1851 (2017).
- March et al. (2016) S. A. March, C. Clegg, D. B. Riley, D. Webber, I. G. Hill, and K. C. Hall, Sci. Rep. 6, 39139 (2016).
- Wu et al. (2014) K. Wu, A. Bera, C. Ma, Y. Du, Y. Yang, L. Li, and T. Wu, Phys. Chem. Chem. Phys. 16, 22476 (2014).
- Bokdam et al. (2016) M. Bokdam, T. Sander, A. Stroppa, S. Picozzi, D. D. Sarma, C. Franchini, and G. Kresse, Sci. Rep. 6, 28618 (2016).
- Zhu et al. (2014) X. Zhu, H. Su, R. A. Marcus, and M. E. Michel-Beyerle, J. Phys. Chem. Lett. 5, 3061 (2014).
- Umari et al. (2018) P. Umari, E. Mosconi, and F. De Angelis, J. Phys. Chem. Lett. 9, 620 (2018).
- Ahmed et al. (2014) T. Ahmed, C. La-o-vorakiat, T. Salim, Y. M. Lam, E. E. M. Chia, and J.-X. Zhu, Europhys. Lett. 108, 67015 (2014).
- Frost et al. (2014) J. M. Frost, K. T. Butler, F. Brivio, C. H. Hendon, M. van Schilfgaarde, and A. Walsh, Nano Lett. 14, 2584 (2014).
- Even et al. (2014) J. Even, L. Pedesseau, and C. Katan, J. Phys. Chem. C 118, 11566 (2014).
- Menéndez-Proupin et al. (2015) E. Menéndez-Proupin, C. L. Beltrán Ríos, and P. Wahnón, Phys. Status Solidi R. 9, 559 (2015).
- Hakamata et al. (2016) T. Hakamata, K. Shimamura, F. Shimojo, R. K. Kalia, A. Nakano, and P. Vashishta, Sci. Rep. 6, 19599 (2016).
- Yin et al. (2014) W.-J. Yin, T. Shi, and Y. Yan, Appl. Phys. Lett. 104, 063903 (2014).
- Kim et al. (2014) J. Kim, S.-H. Lee, J. H. Lee, and K.-H. Hong, J. Phys. Chem. Lett. 5, 1312 (2014).
- Liu and Yam (2018) N. Liu and C. Yam, Phys. Chem. Chem. Phys. 20, 6800 (2018).
- Yang et al. (2015b) J.-H. Yang, W.-J. Yin, J.-S. Park, and S.-H. Wei, Sci. Rep. 5, 16977 (2015b).
- Wang et al. (2014) Q. Wang, Y. Shao, H. Xie, L. Lyu, X. Liu, Y. Gao, and J. Huang, Appl. Phys. Lett. 105, 163508 (2014).
- Dymshits et al. (2015) A. Dymshits, A. Henning, G. Segev, Y. Rosenwaks, and L. Etgar, Sci. Rep. 5, 8704 (2015).
- Guerrero et al. (2014) A. Guerrero, E. J. Juarez-Perez, J. Bisquert, I. Mora-Sero, and G. Garcia-Belmonte, Appl. Phys. Lett. 105, 133902 (2014).
- Schleife et al. (2011) A. Schleife, C. Rödl, F. Fuchs, K. Hannewald, and F. Bechstedt, Phys. Rev. Lett. 107, 236405 (2011).
- Kronenberger et al. (2012) A. Kronenberger, A. Polity, D. M. Hofmann, B. K. Meyer, A. Schleife, and F. Bechstedt, Phys. Rev. B 86, 115334 (2012).
- Kang et al. (2019) K. Kang, A. Kononov, C.-W. Lee, J. A. Leveillee, E. P. Shapera, X. Zhang, and A. Schleife, Comp. Mater. Sci. 160, 207 (2019).
- Mahan (1967) G. D. Mahan, Phys. Rev. 153, 882 (1967).
- Kohn and Sham (1965) W. Kohn and L. J. Sham, Phys. Rev. 140, A1133 (1965).
- Hohenberg and Kohn (1964) P. Hohenberg and W. Kohn, Phys. Rev. 136, B864 (1964).
- Blöchl (1994) P. E. Blöchl, Phys. Rev. B 50, 17953 (1994).
- Perdew et al. (2008) J. P. Perdew, A. Ruzsinszky, G. I. Csonka, O. A. Vydrov, G. E. Scuseria, L. A. Constantin, X. Zhou, and K. Burke, Phys. Rev. Lett. 100, 136406 (2008).
- Brivio et al. (2015) F. Brivio, J. M. Frost, J. M. Skelton, A. J. Jackson, O. J. Weber, M. T. Weller, A. R. Goñi, A. M. A. Leguy, P. R. F. Barnes, and A. Walsh, Phys. Rev. B 92, 144308 (2015).
- Whitfield et al. (2016) P. S. Whitfield, N. Herron, W. E. Guise, K. Page, Y. Q. Cheng, I. Milas, and M. K. Crawford, Sci. Rep. 6, 35685 (2016).
- Butler et al. (2015) K. T. Butler, J. M. Frost, and A. Walsh, Mater. Horiz. 2, 228 (2015).
- Targhi et al. (2018) F. F. Targhi, Y. S. Jalili, and F. Kanjouri, Results Phys. 10, 616 (2018).
- Gajdoš et al. (2006) M. Gajdoš, K. Hummer, G. Kresse, J. Furthmüller, and F. Bechstedt, Phys. Rev. B 73, 045112 (2006).
- Perdew et al. (1996) J. P. Perdew, K. Burke, and M. Ernzerhof, Phys. Rev. Lett. 77, 3865 (1996).
- Umari et al. (2014) P. Umari, E. Mosconi, and F. Angelis, Sci. Rep. 4, 4467 (2014).
- Steiner et al. (2016) S. Steiner, S. Khmelevskyi, M. Marsmann, and G. Kresse, Phys. Rev. B 93, 224425 (2016).
- Rohlfing and Louie (2000) M. Rohlfing and S. G. Louie, Phys. Rev. B 62, 4927 (2000).
- Fuchs et al. (2008a) F. Fuchs, C. Rödl, A. Schleife, and F. Bechstedt, Phys. Rev. B 78, 085103 (2008a).
- Bechstedt et al. (1992) F. Bechstedt, R. D. Sole, G. Cappellini, and L. Reining, Solid State Commun. 84, 765 (1992).
- Cappellini et al. (1993) G. Cappellini, R. Del Sole, L. Reining, and F. Bechstedt, Phys. Rev. B 47, 9892 (1993).
- Fuchs et al. (2008b) F. Fuchs, C. Rödl, A. Schleife, and F. Bechstedt, Phys. Rev. B 78, 085103 (2008b).
- Schleife (2011) A. Schleife, Electronic and optical properties of MgO, ZnO, and CdO (Südwestdeutscher Verlag für Hochschulschriften, 2011).
- Schleife (2010) A. Schleife, Exciting Imperfection: Real-structure effects in magnesium-, cadmium-, and zinc-oxide, Phd thesis, Friedrich-Schiller-Universität, Jena (2010).
- Berggren and Sernelius (1981) K. F. Berggren and B. E. Sernelius, Phys. Rev. B 24, 1971 (1981).
- Kresse and Joubert (1999) G. Kresse and D. Joubert, Phys. Rev. B 59, 1758 (1999).
- Kresse and Furthmüller (1996) G. Kresse and J. Furthmüller, Phys. Rev. B 54, 11169 (1996).
- Shishkin and Kresse (2006) M. Shishkin and G. Kresse, Phys. Rev. B 74, 035101 (2006).
- Rödl et al. (2008) C. Rödl, F. Fuchs, J. Furthmüller, and F. Bechstedt, Phys. Rev. B 77, 184408 (2008).
- (70) 10.18126/M2D64J.
- Ong et al. (2015) K. P. Ong, T. W. Goh, Q. Xu, and A. Huan, J. Phys. Chem. A 119, 11033 (2015).
- Kong et al. (2015) W. Kong, Z. Ye, Z. Qi, B. Zhang, M. Wang, A. Rahimi-Iman, and H. Wu, Phys. Chem. Chem. Phys. 17, 16405 (2015).
- Filip and Giustino (2014) M. R. Filip and F. Giustino, Phys. Rev. B 90, 245145 (2014).
- Thind et al. (2017) A. S. Thind, X. Huang, J. Sun, and R. Mishra, Chem. Mater. 29, 6003 (2017).
- Quarti et al. (2016) C. Quarti, E. Mosconi, J. M. Ball, V. D’Innocenzo, C. Tao, S. Pathak, H. J. Snaith, A. Petrozza, and F. De Angelis, Energy Environ. Sci. 9, 155 (2016).
- Filip et al. (2015) M. R. Filip, C. Verdi, and F. Giustino, J. Phys. Chem. C 119, 25209 (2015).
- Brivio et al. (2014) F. Brivio, K. T. Butler, A. Walsh, and M. van Schilfgaarde, Phys. Rev. B 89, 155204 (2014).
- Pérez-Osorio et al. (2015) M. A. Pérez-Osorio, R. L. Milot, M. R. Filip, J. B. Patel, L. M. Herz, M. B. Johnston, and F. Giustino, J. Phys. Chem. C 119, 25703 (2015).
- Sendner et al. (2016) M. Sendner, P. K. Nayak, D. A. Egger, S. Beck, C. Muller, B. Epding, W. Kowalsky, L. Kronik, H. J. Snaith, A. Pucci, and R. Lovrincic, Mater. Horiz. 3, 613 (2016).
- Poglitsch and Weber (1987) A. Poglitsch and D. Weber, J. Chem. Phys. 87, 6373 (1987).
- Feng and Xiao (2014) J. Feng and B. Xiao, J. Phys. Chem. Lett. 5, 1278 (2014).
- Giorgi et al. (2013) G. Giorgi, J.-I. Fujisawa, H. Seqawa, and K. Yamashita, J. Phys. Chem. Lett. 4, 4213 (2013).
- Pedesseau et al. (2016) L. Pedesseau, D. Sapori, B. Traore, R. Robles, H.-H. Fang, M. A. Loi, H. Tsai, W. Nie, J.-C. Blancon, A. Neukirch, S. Tretiak, A. D. Mohite, C. Katan, J. Even, and M. Kepenekian, ACS Nano 10, 9776 (2016).
- Park (2015) N.-G. Park, Mater. Today 18, 65 (2015).
- Etienne et al. (2016) T. Etienne, E. Mosconi, and F. De Angelis, J. Phys. Chem. Lett. 7, 1638 (2016).
- Mosconi et al. (2017) E. Mosconi, T. Etienne, and F. De Angelis, J. Phys. Chem. Lett. 8, 2247 (2017).
- Manser and Kamat (2014) J. S. Manser and P. V. Kamat, Nat. Photonics 8, 737 (2014).
- Shirayama et al. (2016) M. Shirayama, H. Kadowaki, T. Miyadera, T. Sugita, M. Tamakoshi, M. Kato, T. Fujiseki, D. Murata, S. Hara, T. N. Murakami, S. Fujimoto, M. Chikamatsu, and H. Fujiwara, Phys. Rev. Applied 5, 014012 (2016).
- Chen et al. (2015) C.-W. Chen, S.-Y. Hsiao, C.-Y. Chen, H.-W. Kang, Z.-Y. Huang, and H.-W. Lin, J. Mater. Chem. A 3, 9152 (2015).
- Löper et al. (2015) P. Löper, M. Stuckelberger, B. Niesen, J. Werner, M. Filipič, S.-J. Moon, J.-H. Yum, M. Topič, S. D. Wolf, and C. Ballif, J. Phys. Chem. Lett. 6, 66 (2015).
- Bechstedt et al. (2005) F. Bechstedt, K. Seino, P. H. Hahn, and W. G. Schmidt, Phys. Rev. B 72, 245114 (2005).
- Fu et al. (2017) J. Fu, Q. Xu, G. Han, B. Wu, C. H. A. Huan, M. L. Leek, and T. C. Sum, Nat. Comm. 8, 1300 (2017).
- Valverde-Chávez et al. (2015) D. A. Valverde-Chávez, C. S. Ponseca, C. C. Stoumpos, A. Yartsev, M. G. Kanatzidis, V. Sundström, and D. G. Cooke, Energy Environ. Sci. 8, 3700 (2015).
- Shi et al. (2015) D. Shi, V. Adinolfi, R. Comin, M. Yuan, E. Alarousu, A. Buin, Y. Chen, S. Hoogland, A. Rothenberger, K. Katsiev, Y. Losovyj, X. Zhang, P. A. Dowben, O. F. Mohammed, E. H. Sargent, and O. M. Bakr, Science 347, 519 (2015).
- Qian et al. (2016) X. Qian, X. Gu, and R. Yang, Appl. Phys. Lett. 108, 063902 (2016).
V Supplemental Information
| This Work | Ref. PBEsolBrivio et al. (2015); Qian et al. (2016) | Exp.Kong et al. (2015); Whitfield et al. (2016) | |
|---|---|---|---|
| Orthorhombic | (13 K) | ||
| 8.365 | 8.350 | 8.571 | |
| 9.073 | 9.040 | 8.855 | |
| 12.665 | 12.66 | 12.614 | |
| 961.27 | 955.63 | 957.35 | |
| Tetragonal | (180 K) | ||
| 8.711 | 8.700 | 8.970 | |
| 8.720 | 8.720 | – | |
| 12.846 | 12.830 | 12.768 | |
| 975.810 | 979.78 | 986.510 | |
| Cubic | 300 K – 350 K | ||
| 6.291 | 6.29 | 6.26-6.31 | |
| 6.253 | 6.23 | – | |
| 6.386 | 6.37 | – | |
| 251.12 | 246.62 | 245.31 – 251.24 |