SDSS–IV MaNGA : The Inner Density Slopes of nearby galaxies
Abstract
We derive the mass weighted total density slopes within the effective (half-light) radius, , for more than 2000 nearby galaxies from the SDSS-IV MaNGA survey using Jeans-anisotropic-models applied to IFU observations. Our galaxies span a wide range of the stellar mass ( M⊙) and the velocity dispersion (30 km/s 300 km/s). We find that for galaxies with velocity dispersion km/s, the density slope has a mean value and a dispersion , almost independent of velocity dispersion. A clear turn over in the relation is present at km/s, below which the density slope decreases rapidly with . Our analysis shows that a large fraction of dwarf galaxies (below M⊙) have total density slopes shallower than 1, which implies that they may reside in cold dark matter halos with shallow density slopes. We compare our results with that of galaxies in hydrodynamical simulations of EAGLE, Illustris and IllustrisTNG projects, and find all simulations predict shallower density slopes for massive galaxies with high . Finally, we explore the dependence of on the positions of galaxies in halos, namely centrals vs. satellites, and find that for the same velocity dispersion, the amplitude of is higher for satellite galaxies by about 0.1.
keywords:
galaxies: evolution – galaxies: formation – galaxies: kinematics and dynamics – galaxies: structure1 Introduction
Various N-body simulations have shown that the density structure of dark matter halos in a universe formed with pure cold dark matter follows a universal NFW form (Navarro et al., 1996, 1997). The density profile, , of a dark matter halo scales with for the inner part and scales with for the outer part, independent of the mass of the halo.
In the real Universe the inner density profile depends on both the dark matter and baryons. Baryons cool and condense at the center of dark matter halos and form galaxies. The baryons often contribute a significant amount of mass within the half-light radius (e.g. Courteau & Dutton, 2015). In addition, galaxy formation processes can modify the mass structure of dark matter halos. The baryonic matter can form a much more condensed density profile at the center of a dark matter halo, generating an adiabatic contraction effect (e.g. Blumenthal et al., 1986; Gnedin et al., 2004; Gustafsson et al., 2006). On the other hand, stellar and Active Galactic Nuclei (AGN) feedback can create rapid gas outflows which may induce an expansion effect at the halo center, resulting in a central core in the dark matter density profiles (Dehnen, 2005; Read & Gilmore, 2005; Duffy et al., 2010; Pontzen & Governato, 2012). Accurate measurement of density profiles of galaxies thus provides a critical constraint on galaxy formation models.
In observations, the inner density profile of galaxies are best measured through stellar kinematics and gravitational lensing effects (e.g. Koopmans et al., 2009; Auger et al., 2010; Cappellari et al., 2013; Sonnenfeld et al., 2013; Newman et al., 2015; Poci et al., 2017; Huang et al., 2018). The Sloan Lens Advanced Camera for Surveys (SLACS) project studied a sample of 73 galaxy-galaxy lensing systems with lens stellar masses M⊙ (Koopmans et al., 2009; Auger et al., 2010) and found that the mean of power-law density slope of the total mass within the Einstein radius to be , very close to a singular-isothermal-sphere profile111Note that throughout this paper we adopt the convention that density slopes are positive, i.e., .. The dark matter and baryon profiles have very different density slopes, so the close to the isothermal value implies that both baryons and dark matter contribute non-negligible fractions to the mass within the effective radii of massive elliptical galaxies. This is sometimes referred to as the “bulge-halo conspiracy" (Dutton & Treu, 2014).
Compared with rare strong lensing systems, dynamical modeling methods can be applied to much larger samples of galaxies. With recent developments in integral field unit surveys, e.g. ATLAS3D (Cappellari et al., 2011), CALIFA (Sánchez et al., 2012), MASSIVE (Ma et al., 2014), SAMI (Bryant et al., 2015) and SDSS-IV MaNGA (Bundy et al., 2015), accurate mass density profiles for large statistical samples of galaxies are becoming available. Cappellari et al. (2013) constructed anisotropic dynamical models for 260 early-type galaxies in the ATLAS3D sample. Follow-up analysis shows that the inner total density slopes of these early type galaxies have a mean value of , with a scatter of , which is slightly steeper than the SLACS strong lensing results. The total density slope is constant for galaxies with effective velocity dispersion km/s, and becomes shallower gradually with for galaxies with km/s. For massive clusters, recent observations combining stellar dynamics and gravitational lensing effects show that the total inner density slope drops gradually to 1.7 (Newman et al., 2015; Auger et al., 2010).
In this paper, we make use of IFU observations from the MaNGA survey to study the density slopes for nearby galaxies with a wider range of galaxy masses and morphologies than previous studies. We derive the galaxy density profiles using mass models of galaxies in MaNGA DR14 (Abolfathi et al., 2018), which are derived by Li et al. (2018) with Jeans anisotropic model(JAM, Cappellari, 2008), and investigate the relation between density slopes and the galaxy stellar mass, the stellar surface density, the velocity dispersion and other properties.
The structure of the paper is as follows: In Section 2, we outline the MaNGA data we use, in Section 3, we briefly introduce our dynamical modelling technique, and in Section 4, we present our main results, and finally in Section 5, we summarize our results and present a short discussion.
2 MaNGA galaxies
The galaxy sample of this project comprises 2778 galaxies from MaNGA survey in SDSS-IV DR14 (Abolfathi et al., 2018), covering a stellar mass range of M⊙, including both early type and late type galaxies. Throughout this work, we define early type galaxies as those with Sersic index , and the remainders as late type galaxies. Sersic indices are taken from the NASA-Sloan Atlas, NSA catalogue222Downloaded from https://academic.oup.com/mnras/article-abstract/476/2/1765/4848297 by National Astronomical Observatory user on 26 June 2018). From the DR14 sample, we exclude merging galaxies (or close galaxy pairs), galaxies with a significant disturbance, and galaxies with strong bars or strong spiral arms. We also exclude galaxies of low data quality, defined as having less than 100 Voronoi with S/N>10 bins. In total, we have 2110 galaxies in our final sample, with 952 early type galaxies and 1158 late type galaxies.
We use the IFU spectra extracted with the official data reduction pipeline (DRP Law et al., 2016) and the kinematic data extracted with the official data analysis pipeline (Westfall et al., 2019). The kinematic information are obtained by fitting absorption lines using the pPXF software (Cappellari & Emsellem, 2004; Cappellari, 2017).
In this paper, we derive the stellar mass of each galaxy by multiplying their total luminosity in SDSS r-band by their mean stellar mass-to-light ratio within the effective radius, , derived by Li et al. (2018, see online table), in which the mass-to-light ratio is obtained by fitting spectra with stellar population templates using pPXF software (Cappellari & Emsellem, 2004) with the MILES-based (Sánchez-Blázquez et al., 2006) SPS models of Vazdekis et al. (2010) and the Salpeter (1955) initial mass function. Before spectrum fitting, the data cubes are Voronoi binned to S/N=10 (Cappellari & Copin, 2003). In Appendix B, we show that for a given galaxy, the exact choice of the Voronoi bin number wont’ affect the results of the JAM model.
We refer readers to Li et al. (2018) for details of stellar mass calculation. For MaNGA related information, readers are referred to the following papers: SDSS-IV technical summary(Blanton et al., 2017), MaNGA instrumentation (Drory et al., 2015), observing strategy (Law et al., 2015), sample design (Wake et al., 2017), spectrophotometric calibration (Smee et al., 2013; Yan et al., 2016a), survey execution and initial data quality (Yan et al., 2016b), and a SDSS telescope introduction can be found in Gunn et al. (2006) .
3 Dynamical analysis
Our fiducial mass models of MaNGA galaxies are built by the method described in Li et al. (2018) with the multi-Gaussian Expansion (MGE Emsellem et al., 1994; Cappellari, 2002) technique, in conjunction with the Jeans Anisotropic Modelling (JAM Cappellari, 2008). MGE decomposes the r-band light distribution of the galaxy with a set of Gaussians, providing an analytical description of the observed surface brightness. The stellar mass distribution is assumed to follow the light distribution of the galaxy in the r-band with a mass-to-light ratio, , independent of the galaxy radius. The mass distribution of dark matter halos are assumed to follow gNFW profiles, where density can be written as:
| (1) |
where is the characteristic density, and is the scale radius. These two parameters are treated as free parameters during fitting.
JAM is then performed to compute the second moment of the velocity distribution based on the total mass model. Running JAM within an MCMC framework (emcee Foreman-Mackey et al., 2013), the best-fit mass model that matches the observed second velocity moment map is obtained. We refer the readers to (Li et al., 2018) for details of the mass model constructing. Previous simulations have shown that our method can provide a robust description for total mass profile of galaxies (Li et al., 2016).
In our fiducial model, we assume light traces mass strictly, i.e. the mass-to-light ratio for the stellar component is a constant, independent of the radius. In the real universe, this assumption is not strictly true (e.g. Poci et al., 2017; Li et al., 2018; Sonnenfeld et al., 2018; Wasserman et al., 2018). Specifically, in Li et al. (2018), we derived the average mass-to-light ratio gradient between and using SPS with a Salpeter IMF for MaNGA galaxies in SDSS DR14, and found that the mass-to-light ratio gradient varies from -0.2 for massive galaxies to 0.1 for low mass galaxies. In a recent research by Sonnenfeld et al. (2018) using gravitational lensing data, researchers also derived a mass-to-light ratio of -0.24 for early type galaxies in the SLACS sample.
If the mass-to-light ratio of a MaNGA galaxy is not constant, our best-fit dark matter density profile can be biased, but we still expect that the recovery of the total density profile will not be affected. A validation test is shown in the Appendix, where we assume that the total density profile follows a double power-law model with no prior knowledge for stellar mass distribution. The resulting slopes of the total density profile agree well with that derived from our fiducial model. In this paper, we always show the results using total mass density profile, thus our conclusions are not affected by the mass-to-light ratio gradient.
4 results
4.1 Inner density slopes
Following Dutton & Treu (2014), we define the mass weighted density slope within the effective radius as
| (2) |
where is total mass density of the galaxy and is the total mass enclosed in a sphere with radius .
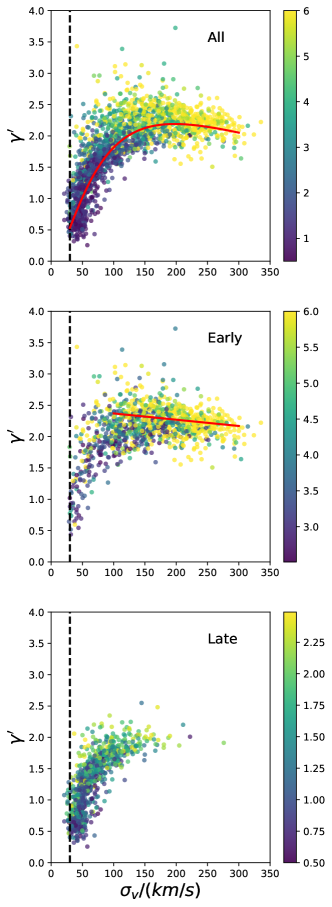
In the top panel of Fig. 1, we present for MaNGA galaxies as a function of , the luminosity weighted velocity dispersion within . The color of data points show the Sersic index of the light profiles. For galaxies with km/s, the density slope increases rapidly from 0.5 to 2, while for galaxies with km/s the inner density slopes stay roughly constant at a value of 2.24, slightly steeper than the isothermal slope (2). We find that the relation can be described with the following formula
| (3) |
with .
In the middle and bottom panels of Fig. 1, we divide our galaxies into early type and late type according to their Sersic index and show their relations, respectively. For early type galaxies () the inner density slope is almost a constant for galaxies with km/s. The mean value of the inner total density slope is , with a dispersion , agreeing well with previous observations from lensing and stellar dynamics. For those early type galaxies with low velocity dispersion, the total density slope increases rapidly with . For late type galaxies, the total also increases with , the behavior of which is similar to early type galaxies of the same range.
Note that, we don’t put any cut on the velocity dispersion for our sample selection. Westfall et al. (2019) estimates that the standard deviation of uncertainties on stellar velocity dispersion is for a Voronoi bin with S/N >10 and intrinsic stellar velocity dispersion of 35 km/s. In each panel of Fig.1, we plot a vertical line at 35 km/s. Almost all our galaxies have km/s.
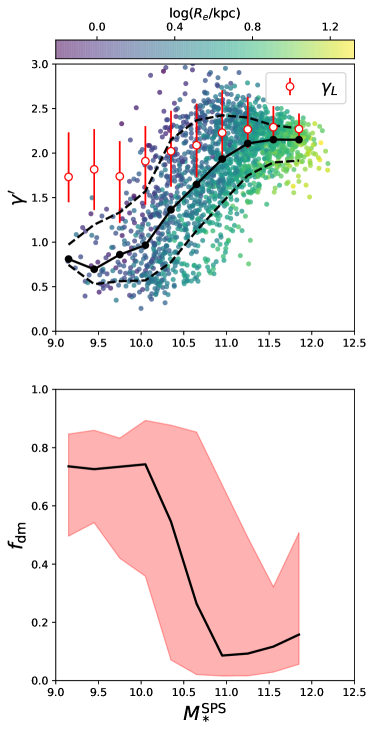
In Fig. 2, we show the relation between and the stellar mass . In the upper panel, we plot vs. for each MaNGA galaxy using scatter points. The colors of points represent the effective radius of each galaxy in kpc. The black solid circles represent the mean of the relation and the two dashed lines enclose 70% of the galaxies at each mass. For reference, we show the flux weighted r-band brightness slope of the stars, , as a function of stellar mass using red empty circles. The average slope of the luminous matter is always steeper than the average total mass slope, implying that the average total slope is an upper limit to the average density slope of the dark matter within the effective radius. In the lower panel of the figure, we plot , the dark matter to total mass fraction with , which is derived from JAM model. The density slope grows almost linearly with in the range of , while for the most massive galaxies, goes flat with stellar mass with a mean of .
One can find that the galaxies of larger sizes tend to have lower for the same stellar mass. Larger effective radii affect the total density slope in two ways: a more extended distribution of stellar mass which results in a shallower stellar density slope; more dark matter included into the calculation of , because the dark matter usually takes larger fraction of total mass at the outer part of a galaxy. Since the dark matter density slopes are much shallower than those of stellar mass, the latter effect also drives the total density slope to a lower value.
For galaxies more massive than , the amplitude of mean flattens. From the lower panel of Fig. 2, we find these galaxies contain little dark matter, thus their total density slopes are almost identical as their stellar density slopes, which is also roughly constant at this mass range (red empty circles in the upper panel of Fig. 2).
Interestingly, we find that the mean total density slopes for galaxies less massive than are below 1.0, while their luminosity profile slopes still possess a mean value of and the JAM modelling shows these galaxies are dominated by dark matter within the effective radius. A direct implication of these results is that many galaxies in this mass range reside in dark matter halos with shallow inner density slopes even shallower than 1. In the context of CDM, dissipationless simulations predict steeper slopes than 1, thus the shallow slopes we find for MaNGA dwarf galaxies implies their dark matter halos have expanded.
The gradient can also contribute to the shallow total density profile. However, Li et al. (2018) has shown that the gradient of MaNGA galaxies with is ( positive sign means the central value is higher). Thus the observed shallow total density profile are not likely to be explained purely by the gradient of .
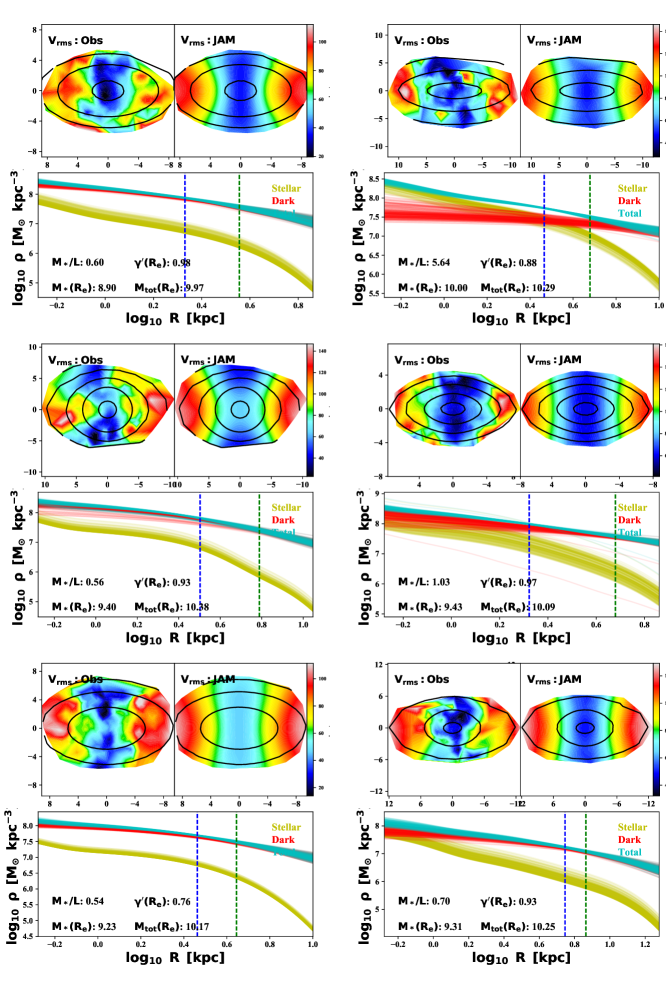
One caveat of the results is that the galaxies are all dwarf galaxies of relatively small physical size and luminosity, thus may suffer larger systematics in JAM modelling. However, we find the density slopes of the dwarf galaxies not correlating with their apparent sizes. Dwarf galaxies with relatively larger apparent size can still have shallow density slopes. In Fig.3, we show 6 examples of galaxies with total density slopes . In the upper panel of each subplot, we show the distribution of observed root-mean-squared velocity , and the reconstructed with the JAM. In the lower panels, we show the density profiles derived from the JAM model. For each galaxy, we randomly select 200 points from posterior distribution of model parameters and plot the density profiles calculated with these parameter combinations using solid thin lines. The yellow, red and blue lines show profiles of stellar, dark matter and total mass, respectively. For these examples, we can find they all have steep gradients of of , with high at and low at inner part, which requires flat total mass density slopes within .
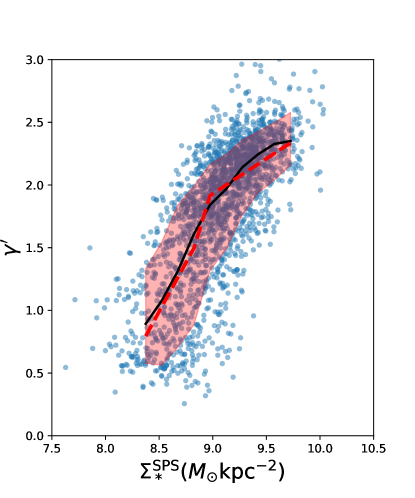
In Fig. 4, we show the relation between and , the stellar surface density averaged within . Blue points show the data of of each galaxy. The red shading shows the region enclosing 70% data points and the black line shows the mean of the relation. We find the relation between and changes slope at , and we can fit the relation with
| (4) |
where .
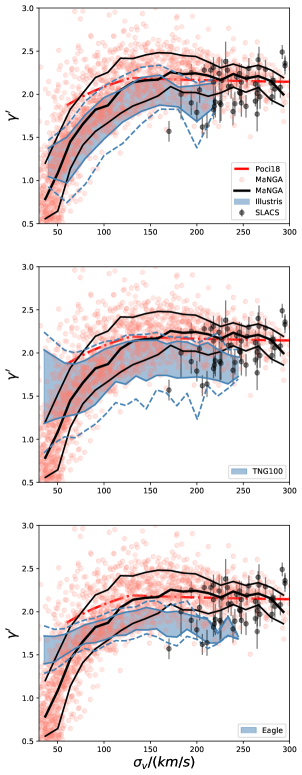
In Fig. 5, we compare our density slopes with predictions from hydrodynamical simulations: EAGLE (Schaye et al., 2015; Crain et al., 2015) and Illustris (Genel et al., 2014; Vogelsberger et al., 2014a, b) and IllustrisTNG project (Marinacci et al., 2018; Naiman et al., 2018; Nelson et al., 2018; Pillepich et al., 2018; Springel et al., 2018; Nelson et al., 2019). For IllustrisTNG simulations, we only use the simulation run in cubic volume of 100 Mpc side length (TNG100, hereafter). In these simulations we select all galaxies with stellar mass , and calculate their total within the 3D radius that equals to their projected half-light radius. To calculate the projected half-light radius, we assume a constant mass-to-light ratio.
In general, all simulations reproduce the total density slope of galaxies reasonably well. However, all of the simulations predicts a mean slightly smaller than 2 for the galaxies with high , which is shallower than the observed value of 2.24. At the low end, the Illustris simulation can reproduce the shallow density slopes in observations, while the total density slopes predicted by EAGLE simulation are significantly higher than the observed values. For the TNG100 simulation, the density slopes spread a wide range for low galaxies. The turn over of relation at km/s is recovered in the Illustris, while the EAGLE and the TNG100 simulation predict flat relations.
In this figure, we also plot the total density slopes from strong lensing of the SLACS (Auger et al., 2010) and the JAM modelling results for ATLAS3D early type galaxies (Poci et al., 2017). Our results are consistent with previous strong lensing observations and ATLAS3D results for early type galaxies with km/s. For galaxies with lower velocity dispersion, our analysis gives a lower mean than Poci et al. (2017), which mainly because our samples include late type galaxies which have lower total density slopes.
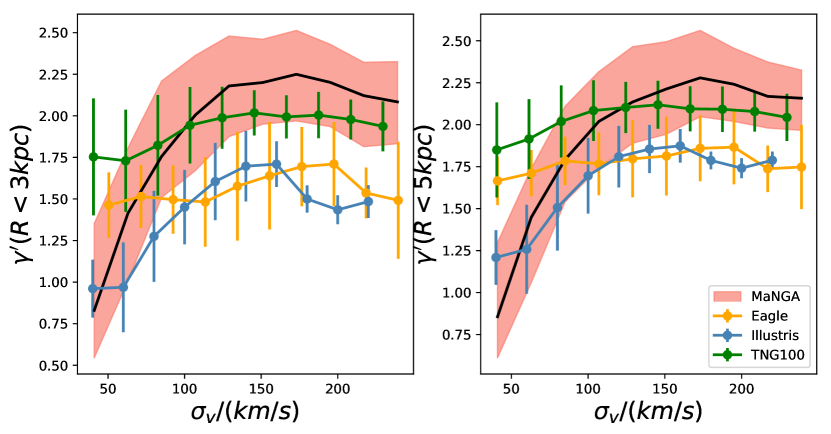
Since the hydrodynamical simulations may not reproduce perfectly the observed galaxy mass-size relation, the definition of half-light radius may not be referring to the same physical radius in observations and simulations. In Fig. 6, we further compare the total mass weighted density slope between simulated galaxies and our MaNGA sample within fixed radius of 3 kpc and 5 kpc. Again, for fixed radius of 3 kpc and 5 kpc, the simulations predict smaller for galaxies with higher . The differences are more significant for Illustris and EAGLE simulations than that for TNG100 simulation.
4.2 central vs satellite
In this project, we match the galaxies to the group catalog derived by Yang et al. (2007) (hereafter SDSSGC333http://gax.shao.ac.cn/data/Group.html). SDSSGC is constructed with the spectroscopic galaxy sample of SDSS DR7 (Abazajian et al., 2009) using an adaptive halo-based group finder. Each galaxy in SDSS DR7 is assigned to a group, and a halo mass is estimated for each group. We assume the central galaxy of each group is the one that has largest stellar mass.
For each galaxy in our MaNGA sample, we find its counter part in the SDSSGC. Therefore, we can obtain its host halo mass, and we can tell whether it is a central galaxy or a satellite galaxy.
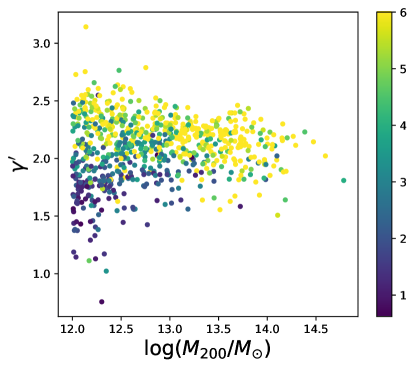
In Fig. 7, we select only the central galaxies from the MaNGA sample, and plot their total mass density slopes as a function of of the groups. For groups with mass larger than , their central galaxies are mostly early type whose total mass density slope has a mean value 2.08 and a scatter of 0.27. For the lower mass groups, the central galaxy could be either early type or late type, and their total slopes scatter in a broad range from 1.5 to 2.75.
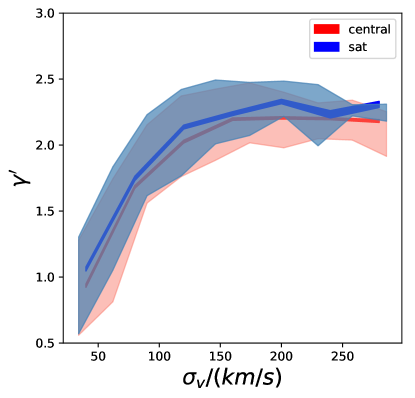
In Fig. 8, we show the total mass slope for central galaxies and satellite galaxies using red and blue lines, respectively. The overall dependence of on is similar for centrals and satellites. For galaxy with the similar , the amplitude of the mean for satellites is higher than that of central by , which maybe due to the fact that on average satellite galaxies form earlier in denser universe and have more concentrated stellar profiles.
5 Summary and discussion
In this paper, we investigate the inner density profile of more than 2000 nearby galaxies from the SDSS-IV MaNGA survey. Our sample of galaxies is the largest of its kind, spanning 3 decades of stellar mass, and includes both early type galaxies and late type galaxies. Using IFU observations we derive , the mass weighted total mass density slope within the effective radius, for these galaxies from the mass model built with the JAM method.
For galaxies with km/s, their mean density slopes hold almost a constant value of , decrease slowly with increasing of velocity dispersion, while for galaxies with km/s, the density slopes decrease rapidly with decreasing velocity dispersion.
We also investigate the relation between and the stellar mass derived using stellar population synthesis models. We find the density slopes increase linearly with in the mass range of , but is roughly constant for more massive galaxies at a value of about 2.15. For these most massive galaxies, we find they have little dark matter within , and their total density slopes are almost the same as their stellar mass density slopes.
For the same stellar mass, galaxies of larger sizes tend to have lower total density slopes. We find increases with average stellar density within Re, with slopes of 0.56 for galaxies with and 0.156 for galaxies .
Interestingly, we find that many of the galaxies less massive than have small total density slopes, even shallower than . In the context of cold dark matter, which predicts slopes of 1 in the absence of baryons, our results imply expansion of the dark matter halo. A recent paper by Benitez-Llambay et al. (2018) shows that shallow dark matter density profile at inner part of the halo closely relates to the star formation threshold density. A star formation threshold density higher than 1 cm-3 allows the gas to pile up at the center of halo, so that a energetic feedback afterwards can efficiently blow out the gas and flatten the inner dark matter profile (also see Bose et al., 2018; Dutton et al., 2018). A future detailed comparison of dwarf galaxy mass structures between observations and simulations may shed light on the subgrid feedback process in galaxy formation.
We compare our results with hydrodynamical simulations, EAGLE, Illustris and TNG100. In all simulations, the total density for galaxies with km/s are slightly below 2, shallower than our observed value of 2.24.
Finally, we explore the density slope dependence on their positions in groups/clusters, namely whether a galaxies is central galaxy or satellite galaxy. We divide our MaNGA galaxies into centrals and satellites using the SDSS group catalog by Yang et al. (2007). For early type central galaxies, the density slopes are about , and decreases slowly with increasing . For late type central galaxies, the density slope scatters in a wide range from 1.5-2.75. We also find that the amplitude of the relation for satellite galaxies is higher than that of centrals by 0.1.
Acknowledgements
We acknowledge National Natural Science Foundation of China (Nos. 11773032, 11390372, 1133303, 11821303, 11761131004), and National Key Program for Science and Technology Research and Development of China (2017YFB0203300). RL is supported by NAOC Nebula Talents Program and Newton mobility award. This work is partly supported by the National Key Basic Research and Development Program of China (No. 2018YFA0404501 to SM) SS is supported by grant ERC-StG-716532-PUNCA and STFC [grant number ST/L00075X/1, ST/P000541/1]
We performed our computer runs on the Zen high performance computer cluster of the National Astronomical Observatories, Chinese Academy of Sciences (NAOC), and the Venus server at Tsinghua University. This research made use of Marvin, a core Python package and web framework for MaNGA data, developed by Brian Cherinka, José Sánchez-Gallego, and Brett Andrews. (MaNGA Collaboration, 2017).
Funding for the Sloan Digital Sky Survey IV has been provided by the Alfred P. Sloan Foundation, the U.S. Department of Energy Office of Science, and the Participating Institutions. SDSS-IV acknowledges support and resources from the Center for High-Performance Computing at the University of Utah. The SDSS web site is www.sdss.org.
SDSS-IV is managed by the Astrophysical Research Consortium for the Participating Institutions of the SDSS Collaboration including the Brazilian Participation Group, the Carnegie Institution for Science, Carnegie Mellon University, the Chilean Participation Group, the French Participation Group, Harvard-Smithsonian Center for Astrophysics, Instituto de Astrofísica de Canarias, The Johns Hopkins University, Kavli Institute for the Physics and Mathematics of the Universe (IPMU) / University of Tokyo, Lawrence Berkeley National Laboratory, Leibniz Institut für Astrophysik Potsdam (AIP), Max-Planck-Institut für Astronomie (MPIA Heidelberg), Max-Planck-Institut für Astrophysik (MPA Garching), Max-Planck-Institut für Extraterrestrische Physik (MPE), National Astronomical Observatories of China, New Mexico State University, New York University, University of Notre Dame, Observatário Nacional / MCTI, The Ohio State University, Pennsylvania State University, Shanghai Astronomical Observatory, United Kingdom Participation Group, Universidad Nacional Autónoma de México, University of Arizona, University of Colorado Boulder, University of Oxford, University of Portsmouth, University of Utah, University of Virginia, University of Washington, University of Wisconsin, Vanderbilt University, and Yale University.
References
- Abazajian et al. (2009) Abazajian K. N., et al., 2009, ApJS, 182, 543
- Abolfathi et al. (2018) Abolfathi B., Aguado D. S., Aguilar G., Allende Prieto C., Almeida A., Tasnim Ananna T., Anders 2018, ApJS, 235, 42
- Auger et al. (2010) Auger M. W., Treu T., Bolton A. S., Gavazzi R., Koopmans L. V. E., Marshall P. J., Moustakas L. A., Burles S., 2010, ApJ, 724, 511
- Benitez-Llambay et al. (2018) Benitez-Llambay A., Frenk C. S., Ludlow A. D., Navarro J. F., 2018, preprint, (arXiv:1810.04186)
- Blanton et al. (2017) Blanton M. R., et al., 2017, AJ, 154, 28
- Blumenthal et al. (1986) Blumenthal G. R., Faber S. M., Flores R., Primack J. R., 1986, ApJ, 301, 27
- Bose et al. (2018) Bose S., et al., 2018, preprint, (arXiv:1810.03635)
- Bryant et al. (2015) Bryant J. J., Owers M. S., Robotham A. S. G., Croom S. M., Driver S. P., Drinkwater M. J., 2015, MNRAS, 447, 2857
- Bundy et al. (2015) Bundy K., Bershady M. A., Law D. R., Yan R., Drory N., MacDonald N., Wake D. A., Cherinka B., 2015, ApJ, 798, 7
- Cappellari (2002) Cappellari M., 2002, MNRAS, 333, 400
- Cappellari (2008) Cappellari M., 2008, MNRAS, 390, 71
- Cappellari (2017) Cappellari M., 2017, MNRAS, 466, 798
- Cappellari & Copin (2003) Cappellari M., Copin Y., 2003, MNRAS, 342, 345
- Cappellari & Emsellem (2004) Cappellari M., Emsellem E., 2004, PASP, 116, 138
- Cappellari et al. (2011) Cappellari M., Emsellem E., Krajnović D., McDermid R. M., Serra P., 2011, MNRAS, 416, 1680
- Cappellari et al. (2013) Cappellari M., Scott N., Alatalo K., Blitz L., Bois M., Bournaud F., Bureau M., 2013, MNRAS, 432, 1709
- Courteau & Dutton (2015) Courteau S., Dutton A. A., 2015, ApJ, 801, L20
- Crain et al. (2015) Crain R. A., et al., 2015, MNRAS, 450, 1937
- Dehnen (2005) Dehnen W., 2005, MNRAS, 360, 892
- Drory et al. (2015) Drory N., et al., 2015, AJ, 149, 77
- Duffy et al. (2010) Duffy A. R., Schaye J., Kay S. T., Dalla Vecchia C., Battye R. A., Booth C. M., 2010, MNRAS, 405, 2161
- Dutton & Treu (2014) Dutton A. A., Treu T., 2014, MNRAS, 438, 3594
- Dutton et al. (2018) Dutton A. A., Macciò A. V., Buck T., Dixon K. L., Blank M., Obreja A., 2018, arXiv e-prints, 1811.10625,
- Emsellem et al. (1994) Emsellem E., Monnet G., Bacon R., 1994, A&A, 285, 723
- Foreman-Mackey et al. (2013) Foreman-Mackey D., Hogg D. W., Lang D., Goodman J., 2013, PASP, 125, 306
- Genel et al. (2014) Genel S., et al., 2014, MNRAS, 445, 175
- Gnedin et al. (2004) Gnedin O. Y., Kravtsov A. V., Klypin A. A., Nagai D., 2004, ApJ, 616, 16
- Gunn et al. (2006) Gunn J. E., et al., 2006, AJ, 131, 2332
- Gustafsson et al. (2006) Gustafsson M., Fairbairn M., Sommer-Larsen J., 2006, Phys. Rev. D, 74, 123522
- Huang et al. (2018) Huang S., et al., 2018, arXiv e-prints, 1811.01139,
- Koopmans et al. (2009) Koopmans L. V. E., et al., 2009, ApJ, 703, L51
- Law et al. (2015) Law D. R., et al., 2015, AJ, 150, 19
- Law et al. (2016) Law D. R., Cherinka B., Yan R., Andrews B. H., Bershady M. A., Bizyaev D., Blanc G. A., Blanton 2016, AJ, 152, 83
- Li et al. (2016) Li H., Li R., Mao S., Xu D., Long R. J., Emsellem E., 2016, MNRAS, 455, 3680
- Li et al. (2018) Li H., et al., 2018, MNRAS, 476, 1765
- Ma et al. (2014) Ma C.-P., Greene J. E., McConnell N., Janish R., Blakeslee J. P., Thomas J., Murphy J. D., 2014, ApJ, 795, 158
- Marinacci et al. (2018) Marinacci F., et al., 2018, MNRAS, 480, 5113
- Naiman et al. (2018) Naiman J. P., et al., 2018, MNRAS, 477, 1206
- Navarro et al. (1996) Navarro J. F., Frenk C. S., White S. D. M., 1996, ApJ, 462, 563
- Navarro et al. (1997) Navarro J. F., Frenk C. S., White S. D. M., 1997, ApJ, 490, 493
- Nelson et al. (2018) Nelson D., et al., 2018, MNRAS, 475, 624
- Nelson et al. (2019) Nelson D., et al., 2019, arXiv e-prints, p. arXiv:1812.05609
- Newman et al. (2015) Newman A. B., Ellis R. S., Treu T., 2015, ApJ, 814, 26
- Pillepich et al. (2018) Pillepich A., et al., 2018, MNRAS, 475, 648
- Poci et al. (2017) Poci A., Cappellari M., McDermid R. M., 2017, MNRAS, 467, 1397
- Pontzen & Governato (2012) Pontzen A., Governato F., 2012, MNRAS, 421, 3464
- Read & Gilmore (2005) Read J. I., Gilmore G., 2005, MNRAS, 356, 107
- Salpeter (1955) Salpeter E. E., 1955, ApJ, 121, 161
- Sánchez-Blázquez et al. (2006) Sánchez-Blázquez P., et al., 2006, MNRAS, 371, 703
- Sánchez et al. (2012) Sánchez S. F., Kennicutt R. C., Gil de Paz A., van de Ven G., Vílchez J. M., Wisotzki L., 2012, A&A, 538, A8
- Schaye et al. (2015) Schaye J., et al., 2015, MNRAS, 446, 521
- Smee et al. (2013) Smee S. A., Gunn J. E., Uomoto A., Roe N., Schlegel D., Rockosi C. M., Carr M. A., Leger F., 2013, AJ, 146, 32
- Sonnenfeld et al. (2013) Sonnenfeld A., Treu T., Gavazzi R., Suyu S. H., Marshall P. J., Auger M. W., Nipoti C., 2013, ApJ, 777, 98
- Sonnenfeld et al. (2018) Sonnenfeld A., Leauthaud A., Auger M. W., Gavazzi R., Treu T., More S., Komiyama Y., 2018, MNRAS, 481, 164
- Springel et al. (2018) Springel V., et al., 2018, MNRAS, 475, 676
- Vazdekis et al. (2010) Vazdekis A., Sánchez-Blázquez P., Falcón-Barroso J., Cenarro A. J., Beasley M. A., Cardiel N., Gorgas J., Peletier R. F., 2010, MNRAS, 404, 1639
- Vogelsberger et al. (2014a) Vogelsberger M., et al., 2014a, MNRAS, 444, 1518
- Vogelsberger et al. (2014b) Vogelsberger M., et al., 2014b, Nature, 509, 177
- Wake et al. (2017) Wake D. A., et al., 2017, AJ, 154, 86
- Wasserman et al. (2018) Wasserman A., et al., 2018, ApJ, 863, 130
- Westfall et al. (2019) Westfall K. B., et al., 2019, arXiv e-prints,
- Yan et al. (2016a) Yan R., Tremonti C., Bershady M. A., Law D. R., Schlegel D. J., Bundy K., Drory N., MacDonald 2016a, AJ, 151, 8
- Yan et al. (2016b) Yan R., Bundy K., Law D. R., Bershady M. A., Andrews B., Cherinka B., Diamond-Stanic A. M., 2016b, AJ, 152, 197
- Yang et al. (2007) Yang X., Mo H. J., van den Bosch F. C., Pasquali A., Li C., Barden M., 2007, ApJ, 671, 153
Appendix A Dependence on the choice of parameterization
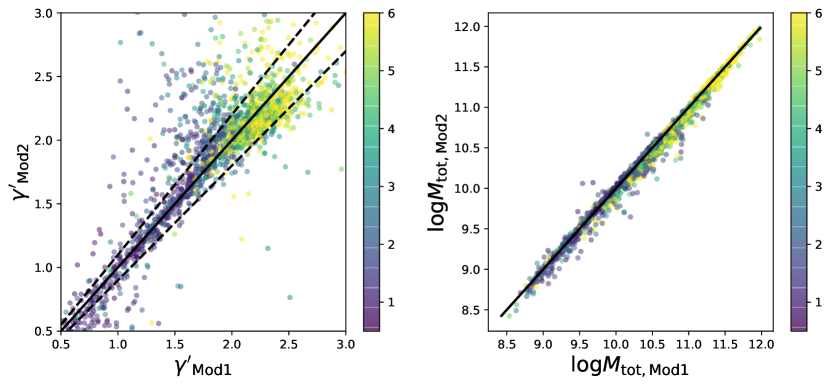
In our fiducial model, we assume the stellar mass distribution follows the light distribution and the dark matter halo follows a NFW profile. To explore whether our results depend on the choice of mass model, we perform JAM with an axisymmetric double power-law model
| (5) |
where the ellipsoid radius , where -axis is the symmetric axis, and is the transverse radius; Free parameters q, , and are the intrinsic axis ratio, scale radius, and density at the scale radius, respectively. In this model, we don’t split density into light and dark when calculating the gravitational potential. For light density tracer, we still use the same MGEs as our fiducial model.
In Fig. 9, we compare the mass weighted total density slope and the total mass within . One can find that the recovered values of total mass within the effective radius from two models agree well with each other. Two different mass models also produce consistent total density slope. Although the dispersion increases slightly for galaxies with , but the results for the majority of the galaxies still agree between the two models. Thus, we assert that our conclusions in this paper are not affected by the detailed choice of parameterization.
Appendix B Dependence on the number of Voronoi bins
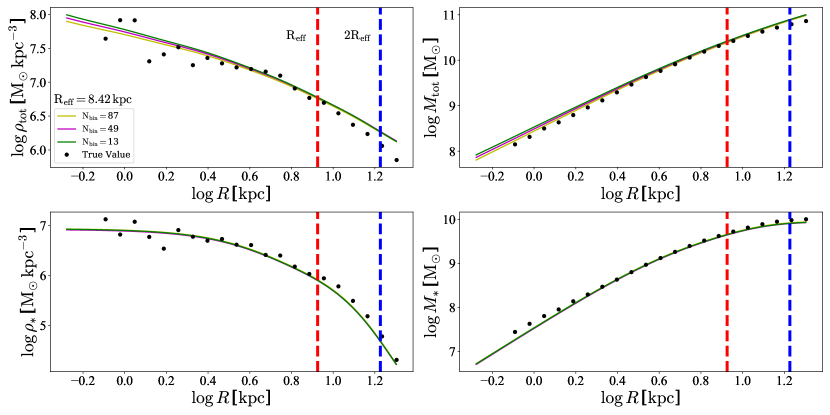
Before deriving the kinematic information from spectrum fitting, the MaNGA data cubes are Voronoi binned (Cappellari & Copin, 2003) to an S/N=10, which may introduce a spatial smoothing effect to the kinematic data. To test the dependence of results on the number of Voronoi bins, we have tried use a binned criteria of S/N=60, and find the results doesn’t change. To further explore the effect of binning, we run our JAM analysis on a simulated galaxy from Illustris simulation. We derive the brightness and velocity fields of the galaxy within on regular grids of kpc2, comparable to the physical size covered by a single MaNGA fibre. Then, we Voronoi bin the velocity grids with three different S/N criteria. The numbers of bins within are 13, 49 and 87. For each binned data set, we perform the JAM analysis. In Fig.10, we show the recovery of the total density profile (top left), the stellar density profile (bottom left), the total mass enclosed within R (top right), and the total stellar mass within R (bottom right) for different binning conditions. We find the recovery of the mass model of a galaxy are not affected by the choice of number of Voronoi bins.