The inflow and outflow rate evolution of local Milky Way-mass star-forming galaxies since
Abstract
We study the gas inflow rate () and outflow rate () evolution of local Milky Way-mass star-forming galaxies (SFGs) since . The stellar mass growth history of Milky Way-mass progenitor SFGs is inferred from the evolution of the star formation rate (SFR)stellar mass () relation, and the gas mass () is derived using the recently established gas scaling relations. With the growth curve, the net inflow rate is quantified at each cosmic epoch. At , is comparable with the SFR, whereas it rapidly decreases to SFR at . We then constrain the average outflow rate of progenitor galaxies by modeling the evolution of their gas-phase metallicity. The best-fit is found to be SFR. Combining and , we finally investigate the evolution of since . We find that rapidly decreases by 80% from to . At , continuously decreases but with a much lower decreasing rate. Implications of these findings on galaxy evolution are discussed.
1 Introduction
In the current galaxy formation paradigm, gas flows into and out of galaxies are key ingredients for driving galaxy evolution (Bouché et al., 2010; Davé et al., 2011, 2012; Lilly et al., 2013; Peng & Maiolino, 2014). Observational studies suggest that gas inflows are required for SFGs, as their gas depletion time scale is significantly shorter than that required to build up their stellar mass in both the low-redshift and high-redshift universe (Larson et al., 1980; Genzel et al., 2015; Tacconi et al., 2018). As an important feedback mechanism, gas outflows driven by star formation or active galactic nucleus (AGNs) can blow the metal-enriched gas out of a galaxy, regulating its chemical enrichment and star formation (Peeples & Shankar, 2011; Hopkins et al., 2012; Cicone et al., 2014; Geach et al., 2014).
Theoretical works have predicted that gas inflows are achieved in two different modes, which are termed as the “cold mode” and the “hot mode” accretion (e.g., Kereš et al., 2005; Dekel & Birnboim, 2006). In low-mass halos and high redshift universe, gas is acquired primarily through the cold mode accretion, by which cold gas flows can directly feed galaxies through cosmic filaments (Kereš et al., 2005; Dekel et al., 2009a, b; van de Voort et al., 2011). When a galaxy’s dark matter halo grows massive enough to support a stable shock, the infalling gas is first shock-heated to near the viral temperature (), then radiatively cools and settles into galaxies in a quasi-spherical manner. The transition of these two accretion modes is expected to occur near the critical halo mass, (Dekel & Birnboim, 2006). To justify this, it is important to investigate the behavior of gas accretion when a galaxy evolves across . Simulations suggest that the gas accretion behavior indeed changes near (Stewart et al., 2011), but observational confirmation of this is still lacking.
Observationally, gas flow signatures have been unambiguously detected in the high-quality spectra of SFGs (e.g., Heckman et al., 1990; Sato et al., 2009; Weiner et al., 2009; Genzel et al., 2014a; Rubin et al., 2014; Cicone et al., 2016). Nevertheless, the detailed properties of gas flows are still difficult to quantify directly. This is because gas flows can occur in multi-phase, and the global gas flow rates depend on the 3D motions and densities of the gas. Indirect methods are thus useful in studying gas flows. For example, early attempts have tried to set constraints on gas flows by modeling the chemical evolution of SFGs to match the observed mass-metallicity relation (Finlator & Davé, 2008; Spitoni et al., 2010; Lilly et al., 2013; Yabe et al., 2015; Spitoni et al., 2017).
The assembly history of Milky Way-mass (, see McMillan 2017) galaxies has recently attracted much attentions, since galaxies near appear quite typical and dominate the stellar mass budget in the local Universe (van Dokkum et al., 2013). Several works have tried to trace the evolution of star formation and morphology of progenitor galaxies back to (Patel et al., 2013; van Dokkum et al., 2013; Papovich et al., 2015). In this paper, we aim to study the gas inflow and outflow history of local SFGs using an indirect approach. In Section 2, we first use the technique developed by Leitner & Kravtsov (2011) to select progenitor SFGs up to . In Section 3, we infer the molecular gas mass () of progenitor galaxies using the scaling relation recently established by Tacconi et al. (2018), and the atomic gas mass () is inferred using the relation established at . In Section 4, we quantify the net inflow rate evolution of progenitor galaxies with the growth curve. In Section 5, we use an analytical chemical evolution model to set constraints on the outflow rate of progenitor galaxies. With the derived net inflow rate and outflow rate, we can investigate the gas inflow history of the local SFGs. In Section 6, we discuss the implication of our results. Finally, we summarize our findings in Section 7. Throughout this paper, we adopt a concordance CDM cosmology with , , Mpc-1 and a Chabrier (2003) initial mass function (IMF). All reported gas masses in this work include a correction of 1.36 to account for helium.
2 Stellar mass growth history of progenitor galaxies
We use the method developed by Leitner & Kravtsov (2011), namely the Main Sequence Integration (MSI) approach, to select progenitors of SFGs that with final stellar mass of log(. The philosophy of this method is simple: if SFGs assemble most of their stellar mass from in situ star formation, then for a given redshift interval, the new stellar mass added to the existing mass is computable based on the location of the galaxy on the SFR plane and mass loss from stellar evolution modeling. For local SFGs, this method should be valid as galaxies with stellar mass near or below assemble their mass mainly from in situ star formation, not from mergers (Qu et al., 2017; Behroozi et al., 2018). From the observational perspective, the assumption that local SFGs are always star-forming in the past is supported by the stellar population constituents of the Milky Way disk (Haywood et al., 2016). Details of the MSI approach can be found in Leitner & Kravtsov (2011).
The SFR relation we used is from the work of Speagle et al. (2014), in which the evolution of the SFR relation at is systematically investigated based on the compiled data from 25 studies. At each cosmic epoch, the SFR relation can be characterized by:
| (1) |
where is the age of the universe in Gyr. Note that at a given , the SFR relation is parameterized by a single power-law. This may be problematic since the SFR relation appears having different power-law indices in the low- and high- mass regimes, as reported in some recent studies (Whitaker et al., 2014; Lee et al., 2015; Schreiber et al., 2015; Tomczak et al., 2016). To investigate whether equation (1) is a good description of the star formation main sequence, we have compared the SFR relation of Speagle et al. (2014) with those of Whitaker et al. (2014) and Tomczak et al. (2016). At the same cosmic epoch, we find that these works report a remarkable consistent SFR relation at log, with a typical discrepancy of dex at fixed . Since in this work we only trace progenitor galaxies back to where they have a stellar mass of log, the stellar mass growth history inferred from equation (1) should be robust.
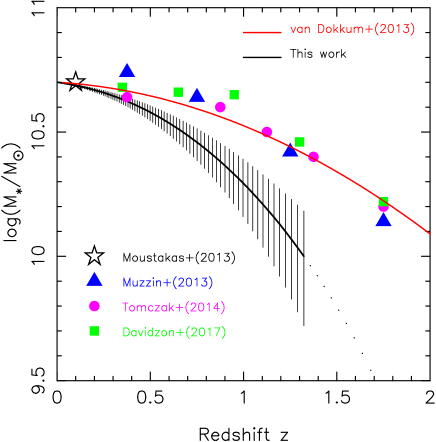
In Figure 1, we show the mass growth history of progenitor galaxies. To account for the uncertainty of the evolution of the main sequence, we arbitrarily allow a dex variation in the star formation rate (). The resulting uncertainty in the stellar mass growth history () is shown in the hatched region. When increasing to , increases by a factor of and at and , respectively. For comparison, we also show the mass growth history of Milky Way-mass galaxies presented by van Dokkum et al. (2013), who select progenitor galaxies with a constant cumulative comoving number density of . It is clear from Figure 1 that the number density selection method is always biased to select more massive galaxies. This is because van Dokkum et al. (2013) also select the progenitors of quiescent Milky Way-mass galaxies. With a same final mass, it is natural that the quiescent ones will always assemble much earlier than the star-forming ones. It is worthy to note that the inferred mass growth history of progenitor galaxies becomes increasingly uncertain towards high redshifts. Given this, in the following we only focus on the evolution of progenitor galaxies at .
3 The determination of cold gas mass
The cold gas component of a galaxy consists of molecular and atomic hydrogen ( and Hi). Thanks to the increasing galaxy sample collected by recent molecular gas surveys (e.g., Daddi et al., 2010; Tacconi et al., 2010, 2013; Saintonge et al., 2011, 2017; Combes et al., 2011), scaling relations between molecular gas mass (), redshifts and star formation rates for SFGs are now established. The seminal work of Genzel et al. (2015) compiled data from a number of molecular gas surveys at to establish scaling relations between (the depletion time scale, defined as SFR), , SFR and redshift , enabling the determination of for SFGs to an accuracy of 0.2 dex. Recently, Tacconi et al. (2018) updated and improved the scaling relations of Genzel et al. (2015) using a larger sample spanning . With the new scaling relations, it is possible to determine (or ) to an accuracy of dex or better for sample averages. For SFGs that lie on the ridge line of the SFR relation of Speagle et al. (2014), the dependence of on redshift can be characterized by:
| (2) |
where is redshift. As shown in Tacconi et al. (2018), shows no clear dependence on , at least at log. Therefore, we can infer the of progenitor galaxies at any cosmic epoch with:
| (3) |
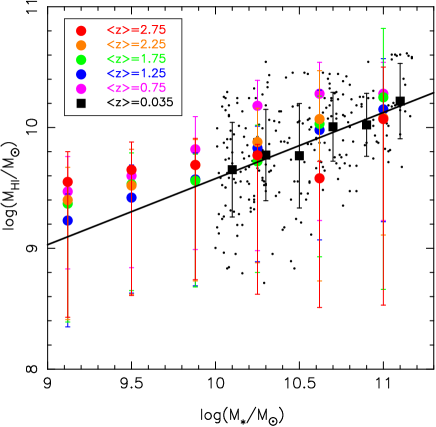

Direct determination of the Hi mass of galaxies () at is currently not realistic. Recently, Popping et al. (2015) used an indirect technique to infer the evolution of the cold gas of SFGs from to , finding that at fixed , the of SFGs shows no redshift dependence. In the local Universe, deep Hi surveys such as GASS (Catinella et al., 2010, 2013) have compiled a representative galaxy sample to enable a direct investigation of the Hi mass for typical massive SFGs. In Figure 2, we compare the relations of Popping et al. (2015) with that of the GASS sample. For the GASS galaxies, only those with both clear star formation (NUV) and Hi detection are selected. It can be seen that these two data sets show very good consistency. For the GASS galaxies, we fit the relation with:
| (4) |
as shown in the black solid line in Figure 2.
In what follows we assume that the relation has no evolution at , and is referred as .
4 The growth history of and the inferred net gas inflow rate
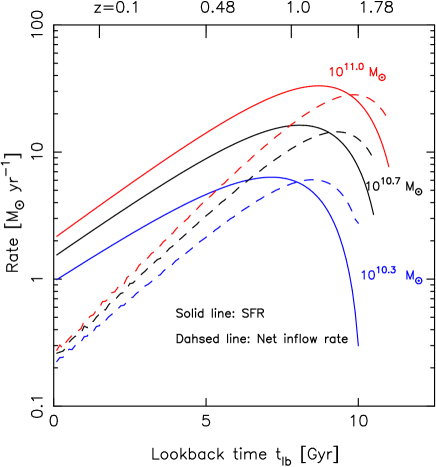
In the left panel of Figure 3, we show the growth curves of and for progenitor galaxies. It can be seen that grows much faster than . At , has assembled 90% of its final mass, whereas only 75% of the final stellar mass is assembled. Since contributes to the majority of the total baryonic budget at most epoches (), the uncertainty of the growth curve is thus dominated by the uncertainty in the determination, i.e, the star formation history.
With the growth curve of in hand, we can quantify the evolution of net inflow rate . In a specific time interval of , the net inflow mass is:
| (5) |
where and are the inflow and outflow mass during , respectively. From mass conservation it is straightforward that
| (6) |
Then the net inflow rate can be written as:
| (7) |
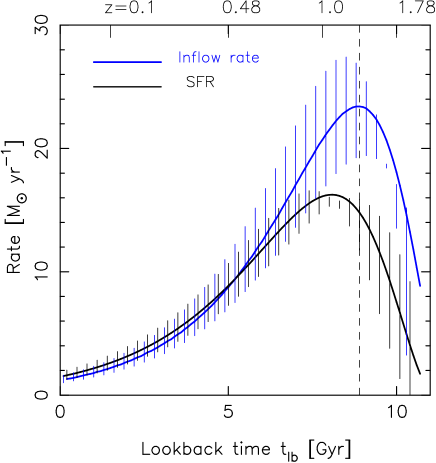
In a more standard form, the brackets of equation (6) and (7) should include the mass of ionized gas and dust. However, in SFGs the mass of dust and ionized gas are both around two orders of magnitude lower than the mass of cold gas (Wolfire et al., 2003; Rémy-Ruyer et al., 2014). Therefore, ignoring these two components should be safe. In the right panel of Figure 3, we show SFR and as functions of lookback time . Some interesting information can be read from this panel. First, the SFR reaches the peak value later than . This is comprehensible since to trigger star formation, the accreted gas needs to be further condensed. Second, the SFR declines by a factor from to , while at the same period declines by a factor of . At , such a low net inflow rate (SFR) is far from sufficient to sustain the observed SFR. The fuel required for star formation in the present-day SFGs is thus mostly from internal sources, such as the recycled gas (Leitner & Kravtsov, 2011) and the remaining gas reservoir.
We note that GASS is a very deep Hi survey, and the relation of GASS may be biased to gas-poor SFGs. To test how the relation impacts on our result, we have also applied the relation of the ALFALFA sample (Giovanelli et al., 2005) in our analysis. The ALFALFA survey is biased to Hi rich galaxies, as demonstrated in Huang et al. (2012). At log10.0, the ALFALFA galaxies are systematically around dex more rich in Hi mass than the GASS galaxies. When applying the relation of ALFALFA, we found that the results are not changed. This is because only contributes to the minority of the baryonic mass budget (¡30%) at log even when the relation of ALFALFA is applied, thus having little impact on the growth curve. We thus conclude that a slight modification on the relation will not have a significant impact on our results.
5 Constraining the inflow and outflow rates
The gas phase metallicity, , can provide valuable insights in constraining the outflow properties of galaxies (Finlator & Davé, 2008; Lilly et al., 2013; Belfiore et al., 2016). In this section we will compare the observed evolution of progenitor galaxies with that from a chemical evolution toy model to set constraints on the outflow rate . Once is known, then we can investigate the inflow rate of these galaxies as the net inflow rate has been determined.
For a galaxy that with a known growth history, its at different redshifts can be inferred by utilizing the observed relation (MZR)(Maiolino et al., 2008; Zahid et al., 2013, 2014). However, deriving the evolution in this way may suffer large uncertainties, since different authors derive the MZRs using different sample section criteria and metallicity calibrations. To derive in a consistent way across the probed redshift range, we infer utilizing the tight correlation between , and SFR established at . Based on the large SFG sample, Mannucci et al. (2010) found that there exists a tight correlation among these three quantities, which can be expressed as:
| (8) |
where .
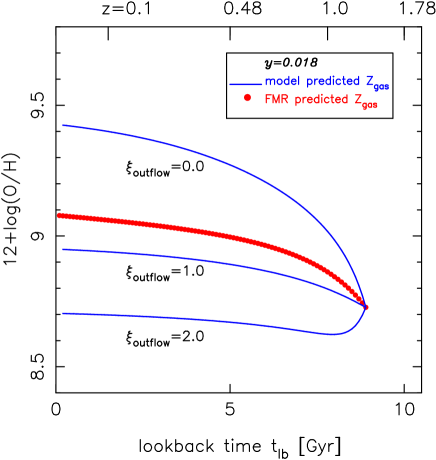
Mannucci et al. (2010) found that galaxies at appear all follow this relation, which they termed as the fundamental metallicity relation (FMR). There have been many recent studies investigating whether this relation evolves from high- to low-. At , the FMR seems do not evolve (Cresci et al., 2012; Yabe et al., 2014). At higher redshift, some studies report a same FMR as that established at (Henry et al., 2013; Maier et al., 2014), while some studies reported a possible redshift evolution in this relation (Salim et al., 2015; Sanders et al., 2015, 2018). Since this work focuses on the evolution of progenitor SFGs at , we assume that the FMR does not evolve during this epoch. Inserting the and SFR of progenitor galaxies into equation (8), we derive the evolution, as shown in the red symbols of Figure 4.
By making some simple assumptions, the evolution of can be derived analytically. By definition, , where is the mass of metals in the gas reservoir. For a given SFG, can increase by the input of metals from star formation and metal-enriched inflows, or it can decrease by gas outflows and the lockup of metals into long-live stars. Assuming the inflow gas has a metallicity and the metal produced by star formation is (where is the nucleosynthetic yield per stellar population), from the mass conservation of metals, the change of per unit time, , can be written as:
| (9) |
where and are gas inflow and outflow rate, and is the return mass fraction (defined as ), respectively. The last term represents the metal that locked in long-live stars. Following the definition of , then
| (10) |
Assuming that , , and SFR are all constant or only change slowly during the time interval , then the solution of equation (10) is:
| (11) |
as given by Peng & Maiolino (2014).
When presenting the outflow rate in units of SFR:
| (12) |
can be written as:
| (13) |
Since the SFR, and of progenitor galaxies have been derived in the above sections, given a starting and a set of input parameter , one can predict the evolution of at according to equation (11).
We first assume that the inflow gas is pristine, i.e., . This is a common assumption taken in most metallicity evolution models. The nucleosynthetic yield, , is taken as a fixed value depending on the adopted IMF. In literatures, is around (see Vincenzo et al. 2016, and references therein). The mass loading factor is dependent on stellar mass. However, in the mass range considered, i.e., log, the dependence of on mass is quite weak (Peeples & Shankar, 2011). We thus assume it to be a constant as well.

With these simplifications, we predict the evolution of progenitor galaxies at , with a time interval of Gyr. At where the progenitor galaxy has log, is log(O/H)+12=8.72 as predicted by the FMR. In Figure 4, we show three examples of the evolution curves predicted by our toy model, adopting and three different . A nucleosynthetic yield of is chosen because model predictions best match observations near this value, as shown below. As can be seen, the evolution predicted by our model is quite sensitive to .
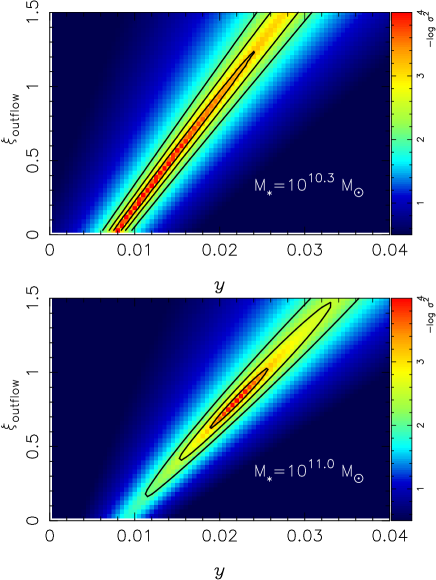
For a given parameter pair , we characterize the degree of the matching between model prediction and observation with:
| (14) |
In Figure 5, we show the map against and . As can be seen, the best-fit mass loading factor is . We insert the median value, , into equation (13) to derive the inflow rate . In Figure 6, we show the evolution of at . At first glance, the evolution of can be largely divided into two phases: a rapidly declining phase at , and a slowly evolving phase at . For comparison we also plot the evolution of SFR in Figure 6. At , is clearly higher than the SFR. This may correspond to the “gas accretion epoch” as predicted by theory (Kereš et al., 2005). At , the SFR largely mimics the evolution of , suggesting that the progenitor SFGs gradually enter a “quasi-steady” phase at late epoches during which their SFRs are self-regulated by the balance between gas inflows and outflows.
6 Discussion
Combining the observed evolution of the SFR and relation of SFGs, we constrain the gas flow histories of local Milky Way-mass SFGs since . Below we will compare our results with previous works and discuss the implications of these results.
At , we find that the net inflow rate reaches a level comparable to the SFR (right panel of Figure 3). Papovich et al. (2011) also reported a similar phenomenon for galaxies at constant number density of at (see their Figure 4). Recently, Scoville et al. (2017) investigated the evolution of for SFGs since . The authors found that the ratio between and SFR, /SFR, closely correlates with and :
| (15) |
where is the stellar mass in units of . According to equation (15), SFGs with log typically have /SFR0.85 at , which is in good agreement with ours.
At , we find a very low net inflow rate, SFR, for the Milky Way-mass SFGs. This is lower than that reported in Scoville et al. (2017), SFR. We emphasize that this discrepancy is largely due to the different treatments on mass loss rate applied in these two works. From equation (11) of Scoville et al. (2017), it is clear that the derived is directly coupled with the applied return mass fraction , in the sense that a large will yield a small . In Scoville et al. (2017), the authors used a constant return mass fraction of across . In this work, we use the full Main Sequence Integration approach, in which is not a constant but will increase towards low redshifts, because mass loss contributed from old stellar populations becomes increasingly important at late epochs. At , the MSI-based return mass fraction is , which in turn results in a reduction of SFR in compared to that of Scoville et al. (2017).
We find the best-fit mass loading factor is . Although this is quantitatively consistent with that found in some previous works (Lilly et al., 2013; Yabe et al., 2015; Belfiore et al., 2016), it is worthy to note that and are degenerated in our chemical evolution model, as shown in Figure 5 (also see Peeples & Shankar 2011). As such, the derived is highly sensitive to the choice of : one must know how many metals are produced before he/she can determine the level of outflows required to produce the evolution of . To set more stringent constraints on , complementary approaches are thus needed.
There appears to be a “turnover” in the gas inflow rate evolution curve at (Figure 6). Specifically, at , the change rate of , , is relatively stable with , whereas at this rate is only . What is the physics behind this phenomenon? Under the current framework of galaxy formation, we speculate that this turnover may reveal a switch from the “cold mode” to the “hot mode” accretion near the critical halo mass . Interestingly, at the “turnover” redshift the progenitor galaxies have log, corresponding to a halo mass of (Behroozi et al., 2013). This is well consistent with the prediction of the halo-shock heating scenario.
To investigate whether other galaxies also exhibit a similar turnover in at a same , we also study SFGs of two different stellar masses (see Figure 9 of the Appendix). For an SFG that with a final stellar mass of log, we find a similar turnover in its at , at which the stellar mass of the progenitor galaxy is around log. Since these two turnover redshifts are only slightly different, we apply a same relation to this galaxy, finding that the corresponding turnover halo mass is . We argue that the turnover in doesn’t occur at a same for different SFGs. Interestingly, we note that the evolution trend of is similar to that of 111 is the stellar mass at which the fraction of quenched galaxies reaches as reported in Haines et al. (2017) (see their Figure 4). This may suggest a connection between the cessation of star formation in galaxies and the significant change in their gas inflow behaviors, as we will argue below.
Although this work is focused on the gas flow behavior of SFGs, our results may provide some insights in interpreting the star formation quenching of galaxies near or above (“mass quenching”, see Peng et al. 2010). Since the tight SFR relation exists up to at least (Speagle et al., 2014; Tasca et al., 2015), the progenitors of massive quenched galaxies are expected to be normal SFGs before they get quenched. As such, a quenched galaxy should also experience a “rapidly declining phase” in during a certain epoch. When has significantly decreased, the impact of internal processes on galaxy evolution will become increasingly important. It has been suggested that violent bulge build-up processes are often accompanied with gas outflow driven by strong starburst or AGN activities (or both), which is expected to be capable in cleaning the gas reservoir in a relatively short time scale (Hopkins et al., 2006; Geach et al., 2014, 2018). Since has significantly decreased and the gas replenishment time scale is long, the removal of gas reservoir may drive the galaxy rapidly get quenched. Observationally, rapidly quenching systems (known as “post-starburst” galaxies) are found to be bulge-dominated and with a surprisingly high AGN fraction, supporting this scenario (Vergani et al., 2010; Yesuf et al., 2014; Baron et al., 2018). On the other hand, bar-driven bulge build-up processes may also play an important role in exhausting the cold gas reservoirs, although the timescale is relatively long (Masters et al., 2012; Wang et al., 2012; Cheung et al., 2013; Gavazzi et al., 2015; Lin et al., 2017).
When a prominent bulge has been formed, other internal processes may also play a role in further suppressing star formation. Using cosmological simulations, Martig et al. (2009) have illustrated that a prominent bulge is able to stabilize the gas disk against fragmentation to form stars. Recently, such kinds of dynamically driven star formation suppression are reported in observational studies (Davis et al., 2014; Genzel et al., 2014b). In addition, a bulge will play a role in preventing the the cooling of recycled gas. This is because in dispersion-supported (spheroidal) systems, a considerable fraction of the recycled gas will quickly mix with halo gas (Parriott & Bregman, 2008). By contrast, in disk-dominated galaxies the recycled gas can directly return to the co-rotating interstellar medium to form next-generation stars. Finally, winds driven by low-level AGNs appear capable in heating the surrounding gas to prevent star formation at the late epoches of galaxy evolution (Cheung et al., 2016; Weinberger et al., 2017, 2018; Li et al., 2018). In summary, we suggest that a significant decline in gas inflow rate is the first step required to quench a massive galaxy. Once this happens, bulge-related internal processes likely play an important role in quenching star formation, resulting in the strong correlation between sSFR and surface mass density (Bell, 2008; Franx et al., 2008; Bell et al., 2012; Cheung et al., 2012; Fang et al., 2013; Barro et al., 2017; Whitaker et al., 2017).
7 Summary and conclusions
In this paper, we study the gas flow histories for the progenitors of local Milky Way-mass star-forming galaxies out to . Assuming that the progenitor galaxies grow in their stellar mass mainly via star formation (not via mergers), then their stellar mass growth histories can be traced following the evolution of the SFR relation. Using the molecular gas scaling relations established by Tacconi et al. (2018), we derive the molecular gas mass of progenitor galaxies. The Hi gas mass is estimated based on the relation established at , assuming that this relation does not evolve out to . With the growth curve and chemical evolution modeling of progenitor galaxies, we have found the following:
1. From to , the net inflow rate decreases by a factor of 50, whereas the SFR decreases . At , is only SFR.
2. The mean outflow rate is .
3. The inflow rate experiences a “rapidly declining phase” at , during which decreases by %. At , continuously decreases but with a much lower decreasing rate.
We suggest that when the gas inflow rate has significantly decreased, bulge-related internal processes likely play an important role in quenching star formation.
We then model the evolution of these two galaxies with the same method described in Section 5. The beginning redshifts are selected at which the galaxy has log. These correspond to and for the low-mass and high-mass SFG, respectively. In Figure 8, we present the map against and . As shown in the upper panel, and can not be very well constrained for the low-mass galaxy, which is mainly due to the narrow redshift range available for the fitting procedure. For the high-mass galaxy, and are better constrained, with the best fit and . Note that both and are slightly higher than those derived for the SFG.
A comparison between Figure 5 and Figure 8 indicates that may be mass dependent. This conflicts with our model assumption, that is largely independent on stellar mass at log. We consider that this confliction may arise from the following aspects. First, the mass independence of at log is derived from the modeling of the mass-metallicity relation of low redshift SFGs (Spitoni et al., 2010; Peeples & Shankar, 2011). For a certain SFG, it is difficult to determine whether is roughly a constant during its evolution at log, because the relation may have evolved from high to low. Second, the uncertainties of all input parameters, such as , and SFR, will more or less contribute to the output of . Finally, the scatter of the FMR, which is at a level of log dex (Mannucci et al., 2010), is not taken into account during the fitting procedure. The combination of these factors may result in an offset between the output and the true value. It is thus important to access whether the output is reliable. When a same is adopted, the best-fit mass loading factor is and 0.5 for the low-mass and high-mass SFG, respectively. To our knowledge, the difference between these two values is not significant, and we think that our initial model assumption (i.e., ) is still valid. Fixing , we have also tried to use a mass-dependent , which is parameterized by , to set constraint on . We investigated the map against and and found that the best-match is always near , i.e., is indeed very weakly dependent on at log. In the following, we still assume that is a constant across the mass range of log and adopt a median value of =0.65.
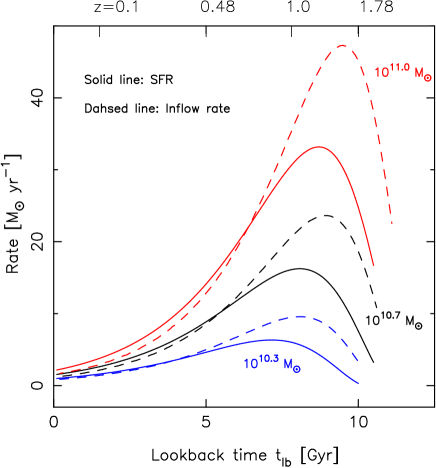
In Figure 9, we show the evolution of SFR and inflow rate for the three galaxies shown in Figure 7, adopting =0.65. As can be seen, the inflow rates of these galaxies all exceed the SFRs in their early assembly epochs, and the inflow rates reach the peak values earlier than the SFRs by Gyr. Similar to Figure 6, we define the epoch at which SFR as the “turnover” redshift. As can be seen, the turnover redshift is for the most massive SFG, at which the progenitor galaxy has log. At , the behaviors of are very close to the SFRs for all three SFGs.
References
- Baron et al. (2018) Baron, D., Netzer, H., Prochaska, J. X., et al. 2018, MNRAS, 480, 3993
- Barro et al. (2017) Barro, G., Faber, S. M., Koo, D. C., et al. 2017, ApJ, 840, 47
- Behroozi et al. (2013) Behroozi, P. S., Wechsler, R. H., & Conroy, C. 2013, ApJ, 770, 57
- Behroozi et al. (2018) Behroozi, P., Wechsler, R., Hearin, A., & Conroy, C. 2018, arXiv:1806.07893
- Belfiore et al. (2016) Belfiore, F., Maiolino, R., & Bothwell, M. 2016, MNRAS, 455, 1218
- Bell (2008) Bell, E. F. 2008, ApJ, 682, 355-360
- Bell et al. (2012) Bell, E. F., van der Wel, A., Papovich, C., et al. 2012, ApJ, 753, 167
- Bouché et al. (2010) Bouché, N., Dekel, A., Genzel, R., et al. 2010, ApJ, 718, 1001
- Catinella et al. (2010) Catinella, B., Schiminovich, D., Kauffmann, G., et al. 2010, MNRAS, 403, 683
- Catinella et al. (2013) Catinella, B., Schiminovich, D., Cortese, L., et al. 2013, MNRAS, 436, 34
- Chabrier (2003) Chabrier, G. 2003, PASP, 115, 763
- Cheung et al. (2012) Cheung, E, Faber, S., Koo, D., et al. 2012, ApJ, 760, 131
- Cheung et al. (2013) Cheung, E., Athanassoula, E., Masters, K. L., et al. 2013, ApJ, 779, 162
- Cheung et al. (2016) Cheung, E., Bundy, K., Cappellari, M., et al. 2016, Nature, 533, 504
- Cicone et al. (2014) Cicone, C., Maiolino, R., Sturm, E., et al. 2014, A&A, 562, A21
- Cicone et al. (2016) Cicone, C., Maiolino, R., & Marconi, A. 2016, A&A, 588, A41
- Combes et al. (2011) Combes, F., García-Burillo, S., Braine, J., et al. 2011, A&A, 528, A124
- Cresci et al. (2012) Cresci, G., Mannucci, F., Sommariva, V., et al. 2012, MNRAS, 421, 262
- Daddi et al. (2010) Daddi, E., Bournaud, F., Walter, F., et al. 2010, ApJ, 713, 686
- Davé et al. (2011) Davé, R., Finlator, K., & Oppenheimer, B. D. 2011, MNRAS, 416, 1354
- Davé et al. (2012) Davé, R., Finlator, K., & Oppenheimer, B. D. 2012, MNRAS, 421, 98
- Davis et al. (2014) Davis, T. A., Young, L. M., Crocker, A. F., et al. 2014, MNRAS, 444, 3427
- Dekel & Birnboim (2006) Dekel, A., & Birnboim, Y. 2006, MNRAS, 368, 2
- Dekel et al. (2009a) Dekel, A., Birnboim, Y., Engel, G., et al. 2009, Nature, 457, 451
- Dekel et al. (2009b) Dekel, A., Sari, R., & Ceverino, D. 2009, ApJ, 703, 785
- Fang et al. (2013) Fang, J. J., Faber, S. M., Koo, D. C., & Dekel, A. 2013, ApJ, 776, 63
- Finlator & Davé (2008) Finlator, K., & Davé, R. 2008, MNRAS, 385, 2181
- Franx et al. (2008) Franx, M., van Dokkum, P. G., Förster Schreiber, N. M., et al. 2008, ApJ, 688, 770-788
- Gavazzi et al. (2015) Gavazzi, G., Consolandi, G., Dotti, M., et al. 2015, A&A, 580, A116
- Geach et al. (2014) Geach, J. E., Hickox, R. C., Diamond-Stanic, A. M., et al. 2014, Nature, 516, 68
- Geach et al. (2018) Geach, J. E., Tremonti, C., Diamond-Stanic, A. M., et al. 2018, ApJ, 864, L1
- Genzel et al. (2014a) Genzel, R., Förster Schreiber, N. M., Lang, P., et al. 2014a, ApJ, 765, 7
- Genzel et al. (2014b) Genzel, R., Förster Schreiber, N. M., Lang, P., et al. 2014b, ApJ, 785, 75
- Genzel et al. (2015) Genzel, R., Tacconi, L. J., Lutz, D., et al. 2015, ApJ, 800, 20
- Giovanelli et al. (2005) Giovanelli, R., Haynes, M. P., Kent, B. R., et al. 2005, AJ, 130, 2598
- Haines et al. (2017) Haines, C. P., Iovino, A., Krywult, J., et al. 2017, A&A, 605, A4
- Haywood et al. (2016) Haywood, M., Lehnert, M. D., Di Matteo, P., et al. 2016, A&A, 589, A66
- Heckman et al. (1990) Heckman, T. M., Armus, L., & Miley, G. K. 1990, ApJS, 74, 833
- Henry et al. (2013) Henry, A., Scarlata, C., Domínguez, A., et al. 2013, ApJ, 776, L27
- Hopkins et al. (2006) Hopkins, P. F., Hernquist, L., Cox, T. J., et al. 2006, ApJS, 163, 1
- Hopkins et al. (2012) Hopkins, P. F., Quataert, E., & Murray, N. 2012, MNRAS, 421, 3522
- Huang et al. (2012) Huang, S., Haynes, M. P., Giovanelli, R., & Brinchmann, J. 2012, ApJ, 756, 113
- Kereš et al. (2005) Kereš, D., Katz, N., Weinberg, D. H., & Davé, R. 2005, MNRAS, 363, 2
- Larson et al. (1980) Larson, R. B., Tinsley, B. M., & Caldwell, C. N. 1980, ApJ, 237, 692
- Lee et al. (2015) Lee, N., Sanders, D. B., Casey, C. M., et al. 2015, ApJ, 801, 80
- Leitner & Kravtsov (2011) Leitner, S. N., & Kravtsov, A. V. 2011, ApJ, 734, 48
- Li et al. (2018) Li, Y.-P., Yuan, F., Mo, H., et al. 2018, ApJ, 866, 70
- Lilly et al. (2013) Lilly, S. J., Carollo, C. M., Pipino, A., Renzini, A., & Peng, Y. 2013, ApJ, 772, 119
- Lin et al. (2017) Lin, L., Li, C., He, Y., Xiao, T., & Wang, E. 2017, ApJ, 838, 105
- Maier et al. (2014) Maier, C., Lilly, S. J., Ziegler, B. L., et al. 2014, ApJ, 792, 3
- Maiolino et al. (2008) Maiolino, R., Nagao, T., Grazian, A., et al. 2008, A&A, 488, 463
- Mannucci et al. (2010) Mannucci, F., Cresci, G., Maiolino, R., Marconi, A., & Gnerucci, A. 2010, MNRAS, 408, 2115
- Martig et al. (2009) Martig, M., Bournaud, F., Teyssier, R., & Dekel, A. 2009, ApJ, 707, 250
- Masters et al. (2012) Masters, K. L., Nichol, R. C., Haynes, M. P., et al. 2012, MNRAS, 424, 2180
- McMillan (2017) McMillan, P. J. 2017, MNRAS, 465, 76
- Moster et al. (2013) Moster, B. P., Naab, T., & White, S. D. M. 2013, MNRAS, 428, 3121
- Papovich et al. (2015) Papovich, C., Labbé, I., Quadri, R., et al. 2015, ApJ, 803, 26
- Parriott & Bregman (2008) Parriott, J. R., & Bregman, J. N. 2008, ApJ, 681, 1215-1232
- Patel et al. (2013) Patel, S. G., Fumagalli, M., Franx, M., et al. 2013, ApJ, 778, 115
- Peeples & Shankar (2011) Peeples, M. S., & Shankar, F. 2011, MNRAS, 417, 2962
- Peng et al. (2010) Peng, Y.-j., Lilly, S. J., Kovač, K., et al. 2010, ApJ, 721, 193
- Peng & Maiolino (2014) Peng, Y.-j., & Maiolino, R. 2014, MNRAS, 443, 3643
- Papovich et al. (2011) Papovich, C., Finkelstein, S. L., Ferguson, H. C., Lotz, J. M., & Giavalisco, M. 2011, MNRAS, 412, 1123
- Popping et al. (2015) Popping, G., Caputi, K. I., Trager, S. C., et al. 2015, MNRAS, 454, 2258
- Rémy-Ruyer et al. (2014) Rémy-Ruyer, A., Madden, S. C., Galliano, F., et al. 2014, A&A, 563, A31
- Rubin et al. (2014) Rubin, K. H. R., Prochaska, J. X., Koo, D. C., et al. 2014, ApJ, 794, 156
- Saintonge et al. (2011) Saintonge, A., Kauffmann, G., Kramer, C., et al. 2011, MNRAS, 415, 32
- Saintonge et al. (2017) Saintonge, A., Catinella, B., Tacconi, L. J., et al. 2017, ApJS, 233, 22
- Salim et al. (2015) Salim, S., Lee, J. C., Davé, R., & Dickinson, M. 2015, ApJ, 808, 25
- Sanders et al. (2015) Sanders, R. L., Shapley, A. E., Kriek, M., et al. 2015, ApJ, 799, 138
- Sanders et al. (2018) Sanders, R. L., Shapley, A. E., Kriek, M., et al. 2018, ApJ, 858, 99
- Sato et al. (2009) Sato, T., Martin, C. L., Noeske, K. G., Koo, D. C., & Lotz, J. M. 2009, ApJ, 696, 214
- Schreiber et al. (2015) Schreiber, C., Pannella, M., Elbaz, D., et al. 2015, A&A, 575, A74
- Scoville et al. (2017) Scoville, N., Lee, N., Vanden Bout, P., et al. 2017, ApJ, 837, 150
- Speagle et al. (2014) Speagle, J. S., Steinhardt, C. L., Capak, P. L., & Silverman, J. D. 2014, ApJS, 214, 15
- Spitoni et al. (2010) Spitoni, E., Calura, F., Matteucci, F., & Recchi, S. 2010, A&A, 514, A73
- Spitoni et al. (2017) Spitoni, E., Vincenzo, F., & Matteucci, F. 2017, A&A, 599, A6
- Stewart et al. (2011) Stewart, K. R., Kaufmann, T., Bullock, J. S., et al. 2011, ApJ, 735, L1
- Tacconi et al. (2010) Tacconi, L. J., Genzel, R., Neri, R., et al. 2010, Nature, 463, 781
- Tacconi et al. (2013) Tacconi, L. J., Neri, R., Genzel, R., et al. 2013, ApJ, 768, 74
- Tacconi et al. (2018) Tacconi, L. J., Genzel, R., Saintonge, A., et al. 2018, ApJ, 853, 179
- Tasca et al. (2015) Tasca, L. A. M., Le Fèvre, O., Hathi, N. P., et al. 2015, A&A, 581, A54
- Tomczak et al. (2016) Tomczak, A. R., Quadri, R. F., Tran, K.-V. H., et al. 2016, ApJ, 817, 118
- Qu et al. (2017) Qu, Y., Helly, J. C., Bower, R. G., et al. 2017, MNRAS, 464, 1659
- van de Voort et al. (2011) van de Voort, F., Schaye, J., Booth, C. M., Haas, M. R., & Dalla Vecchia, C. 2011, MNRAS, 414, 2458
- van Dokkum et al. (2013) van Dokkum, P. G., Leja, J., Nelson, E. J., et al. 2013, ApJ, 771, L35
- Vergani et al. (2010) Vergani, D., Zamorani, G., Lilly, S., et al. 2010, A&A, 509, A42
- Vincenzo et al. (2016) Vincenzo, F., Matteucci, F., Belfiore, F., & Maiolino, R. 2016, MNRAS, 455, 4183
- Wang et al. (2012) Wang, J., Kauffmann, G., Overzier, R., et al. 2012, MNRAS, 423, 3486
- Weinberger et al. (2017) Weinberger, R., Springel, V., Hernquist, L., et al. 2017, MNRAS, 465, 3291
- Weinberger et al. (2018) Weinberger, R., Springel, V., Pakmor, R., et al. 2018, MNRAS, 479, 4056
- Weiner et al. (2009) Weiner, B. J., Coil, A. L., Prochaska, J. X., et al. 2009, ApJ, 692, 187
- Whitaker et al. (2014) Whitaker, K. E., Franx, M., Leja, J., et al. 2014, ApJ, 795, 104
- Whitaker et al. (2017) Whitaker, K. E., Bezanson, R., van Dokkum, P. G., et al. 2017, ApJ, 838, 19
- Wolfire et al. (2003) Wolfire, M. G., McKee, C. F., Hollenbach, D., & Tielens, A. G. G. M. 2003, ApJ, 587, 278
- Yabe et al. (2014) Yabe, K., Ohta, K., Iwamuro, F., et al. 2014, MNRAS, 437, 3647
- Yabe et al. (2015) Yabe, K., Ohta, K., Akiyama, M., et al. 2015, ApJ, 798, 45
- Yesuf et al. (2014) Yesuf, H. M., Faber, S. M., Trump, J. R., et al. 2014, ApJ, 792, 84
- Zahid et al. (2013) Zahid, H. J., Geller, M. J., Kewley, L. J., et al. 2013, ApJ, 771, L19
- Zahid et al. (2014) Zahid, H. J., Dima, G. I., Kudritzki, R.-P., et al. 2014, ApJ, 791, 130