Status of the Lunar Detection Mode for Cosmic Particles of LOFAR
Abstract
Cosmic particles hitting Earth’s moon produce radio emission via the Askaryan effect. If the resulting radio ns-pulse can be detected by radio telescopes, this technique potentially increases the available collective area for ZeV scale particles by several orders of magnitude compared to current experiments. The LOw Frequency ARray (LOFAR) is the largest radio telescope operating in the optimum frequency regime for this technique. In this contribution, we report on the status of the implementation of the lunar detection mode at LOFAR.
1 Introduction
The low fluxes of the particles of interest, which consequently require huge detectors at the highest energies, is one of the major challenges in astroparticle physics. As a possible solution it has already been proposed in the 1960s [1] to use the Moon as a particle detector by searching for the ns radio pulses generated by a charge excess in the shower developing in the lunar rock. Several searches for these signals have been conducted with earth-bound radio telescopes (see reference [2] for a review), but so far none of these searches has been sensitive enough to expect to detect the observed flux of charged cosmic rays. The main reason here is that most of these previous searches used telescopes operating at GHz frequencies. While the amplitude of the emitted pulse reaches a maximum in the GHz range, the effective area increases towards lower frequencies as the Cherenkov cone becomes broader and thus also inclined events become detectable. The resulting optimum frequency band for corresponding observations is found to be above approximately 100 MHz [3].
The currently largest telescope operating in this optimal frequency range is the LOw Frequency ARray (LOFAR) [4]. It is composed of more than 50 stations located throughout Europe with 24 stations placed in a dense core in the Netherlands. Each of these core-stations contains 768 high band antennas (HBA) operating in the frequency range organized in two fields of 24 tiles of 16 antennas each. The signal of the individual stations are filtered into sub-bands by a polyphase filter (PPF) and combined into a beam of approximately width at before it can be accessed by users of the telescope with dedicated observation pipelines.
2 The NuMoon Pipeline
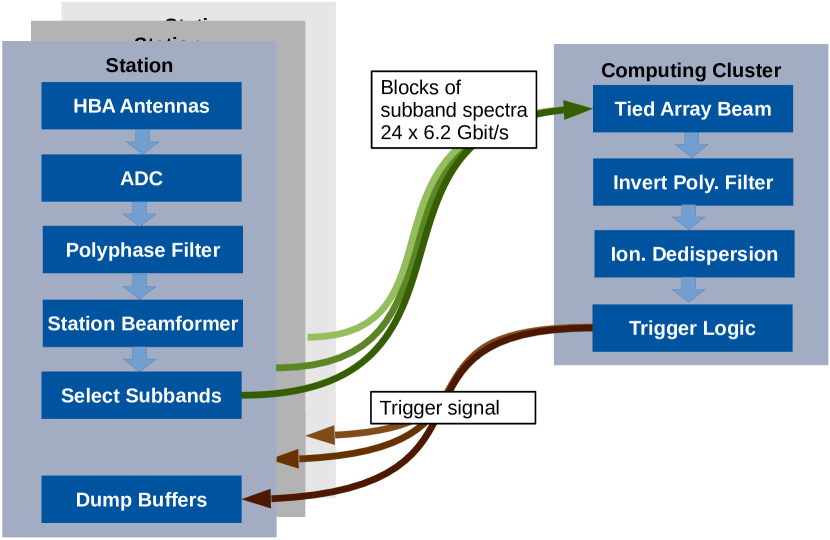
A pipeline to detect ns pulses with LOFAR has to perform three different tasks to reconstruct the pulses before triggering.
-
1.
Form tied array beams. To maximize the collective area, the signals of as many stations as possible have to be combined coherently. As this reduces the beam-width, several beams have to be formed to cover the surface of the Moon.
-
2.
Invert the PPF. The PPF on station level reduces the time resolution by a factor of 1024 from approximately ns to approx. s. To recover ns time resolution, the PPF has to be inverted.
-
3.
Ionospheric dedispersion. By travelling through Earth’s ionosphere, the signal is dispersed proportional to the electron content of the ionosphere. The amplitude of the pulse must consequently be reconstructed to detect the pulses.
The corresponding data processing procedure for LOFAR is sketched in fig. 1. In particular the inversion of the PPF is compute-intensive. A direct inversion of the PPF produces echos of short pulses as e.g. shown in [5] that limits the usability here, as we thus expect a large number of false triggers generated from RFI by this method. Instead, we use an iterative method that requires solving a linear system [6] which requires GFLOPs-1 of computing power [7] per beam.
The required computing resources are, unfortunately, not available on the default LOFAR computing system. Instead, we will use the DRAGNET cluster [8], a computing cluster build for realtime searches of pulsars located in the same computing center next to the default LOFAR facilities. DRAGNET is connected to the LOFAR network with a 56 Gbit/s Infiniband network only, that limits realtime processing of the data of about five stations. The selection of five out of the 24 stations is non-trivial as the geometry of the stations results in very different side lobe patterns of the final beams [9].
With five stations and the available processing power we expect to be able to cover the full Moon with a grid of up to 49 analysis beams. The data-stream in these will be constantly monitored for ns pulses during an observation and eventually trigger a read-out of the transient buffers of all core stations to obtain a large unfiltered data set for offline analysis.
3 Trigger Concept
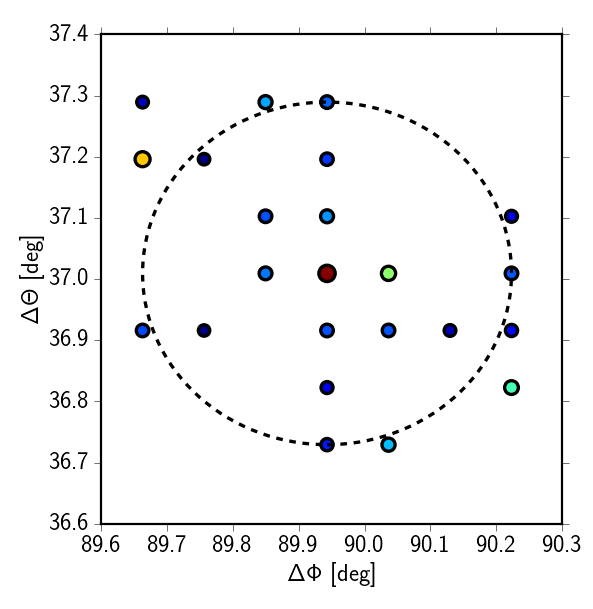
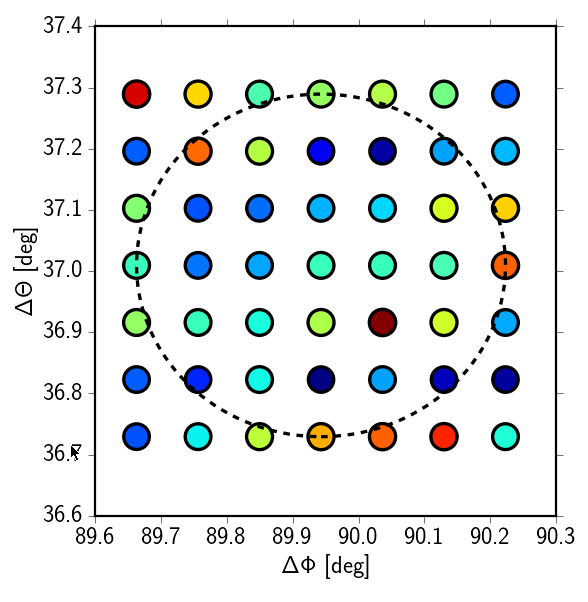
We expect the data to contain many RFI pulses originating from the horizon. A background pulse originating from the horizon will produce a signal in every analysis beam, while a signal pulse from the target direction on the sky will be, ideally, only visible in the beam pointing to the direction of its origin. RFI suppression can thus be, in principle, easily be achieved by requiring an anti-coincidence between the individual analysis beams. However, due to the circular geometry of the beams, and also due to side-lobes the beams overlap, which prevents a simple anti-coincidence and requires a more sophisticated trigger. An example for the reconstructed pulse amplitude for simulated signals originating from the Moon and the horizon are shown in figure 2.
We consequently implement the following prototype trigger strategy. First, the signal in individual analysis beams is monitored and a first level trigger is emitted when the signal passes a threshold corresponding to an acceptable trigger rate from thermal noise of one event per minute. The number of beams above threshold in a given time window, and the RMS of the signal amplitudes of all beams above threshold, is then used as second criterion for signal / background separation.
We evaluated this procedure using simulated events of varying strength originating from the horizon and from a random position on the Moon. For weak pulses that are visible in less than 10 beams we achieve a 90% efficiency and 90% purity using a simple cut on the normalized RMS of the amplitudes. For strong pulses that are visible in every analysis beam we achieve 100% efficiency at 95% purity. The anti-coincidence criterion thus does not limit the method to low energy events as has been previously remarked [2].
4 Expected Sensitivity
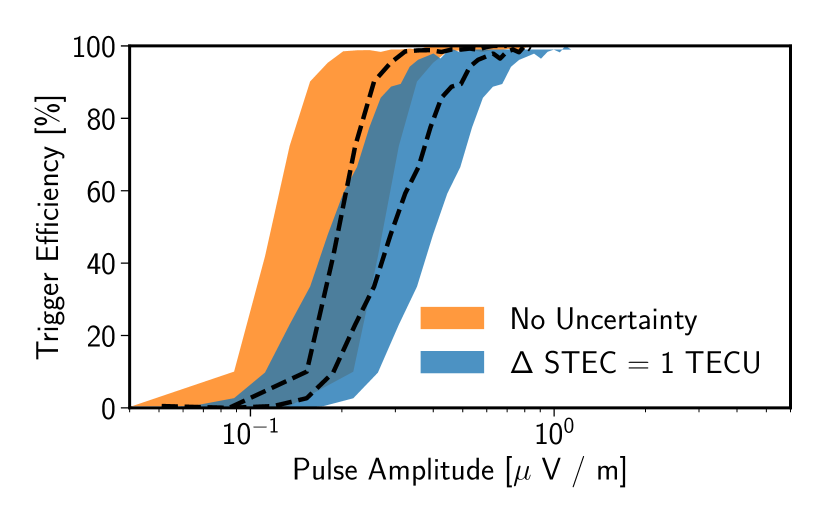
The expected sensitivity of the pipeline is estimated using simulated signal pulses of varying strength that are added to observed noise traces. The simulated pulses are dispersed assuming an exact slant total electron content (STEC) of 20 TECU, respectively a normal distributed STEC value centered around 20 TECU with width of 1 TECU to account for imperfect reconstruction. All traces were then processed by the observation pipeline with an dedispersion corresponding to 20 TECU. We require one sample above a threshold value in at least one out of 49 traces for analysis beams forming a grid covering the Moon as trigger condition. The threshold value is chosen to yield a trigger rate of from thermal noise only. The resulting trigger efficiency is shown in figure 3 as a function of the pulse amplitude. Full efficiency is reached for pulses with amplitude and approximately 20% efficiency is reached for pulses with if the STEC is known to 1 TECU.
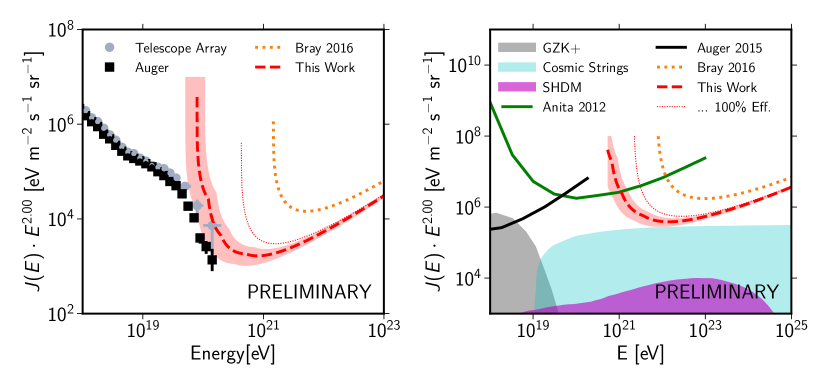
Following the procedure described in references [15, 2] we calculate the sensitivity to charged cosmic rays and neutrinos as shown in figure 4. For this calculation we assume that any reduction in observation time due to the RFI trigger rate is negligible. With the pipeline described here we expect an improved sensitivity compared to previous results [2], because we can use a lower trigger threshold and an increased band-width. With the full simulation we were also, for the first time, able to include the effect of the smooth cut-off of sensitivity to low amplitude pulses. This softens the low-energy cut off of the sensitivity compared to previous estimates.
5 Conclusion
We developed a complete prototype for the online and offline analysis pipeline for the Lunar detection of cosmic particles with the LOFAR radio telescope. For the first time the sensitivities of corresponding observations have been estimated based on full simulations of the radio telescope, data processing, and trigger. These simulations enabled design and evaluation of new trigger concepts and consequently lead to an improved estimated sensitivity to cosmic particles. Compared to previous semi-analytical estimates the full detector simulations reveal an increased sensitivity to low energetic particles of the prototype pipeline. However, with the available resources a detection of cosmic rays with LOFAR remains unlikely, but it will become possible by implementing the here described prototype at the upcoming SKA telescope. Preparations for first observations to demonstrate the capabilities of the prototype pipeline are currently ongoing.
Acknowledgements
The LOFAR cosmic ray key science project acknowledges funding from an Advanced Grant of the European Research Council (FP/2007-2013) / ERC Grant Agreement n. 227610. The project has also received funding from the European Research Council (ERC) under the European Union’s Horizon 2020 research and innovation programme (grant agreement No 640130). We furthermore acknowledge financial support from FOM, (FOM-project 12PR3041-3) and NWO (Top Grant 614- 001-454, and Spinoza Prize SPI 78-409). TW is supported by DFG grant WI 4946/1-1. LOFAR, the Low Frequency Array designed and constructed by ASTRON, has facilities in several countries, that are owned by various parties (each with their own funding sources), and that are collectively operated by the International LOFAR Telescope foundation under a joint scientific policy.
References
References
- [1] Askaryan G 1962 Sovjet Physics J.E.T.P 14 441
- [2] Bray J 2016 Astroparticle Physics 77 1–20 (Preprint 1601.02980)
- [3] Scholten O et al. 2006 Astroparticle Physics 26 219 – 229
- [4] van Haarlem M P et al. 2013 Astronomy and Astrophysics 556 A2 (Preprint 1305.3550)
- [5] Singh K et al. 2012 Nucl. Instrum. Meth. A664 171–185 (Preprint 1108.5745)
- [6] Winchen T et al. (LOFAR Cosmic Ray KSP) 2017 EPJ Web Conf. 135 04003 (Preprint 1609.06590)
- [7] Winchen T et al. 2016 22nd International Conference on Computing in High Energy and Nuclear Physics (CHEP 2016) (Preprint 1612.06592)
- [8] Hessels J 2015 DRAGNET: A high-speed, wide-angle camera for catching extreme astrophysical events URL http://www.astron.nl/dragnet
- [9] Winchen T et al. 2017 Proceedings of the 35th International Cosmic Ray Conference (ICRC) (Preprint 1711.07749)
- [10] Fenu F and for The Pierre Auger Collaboration 2017 Proceedings of the 35th International Cosmic Ray Conference (ICRC)
- [11] Ivanov D 2012 Energy Spectrum Measured by the Telescope Array Surface Detector Ph.D. thesis Rutgers, The State University of New Jersey
- [12] Roulet E, Sigl G, van Vliet A and Mollerach S 2013 Journal of Cosmology and Astroparticle Physics 1 028 (Preprint 1209.4033)
- [13] Berezinsky V, Sabancilar E and Vilenkin A 2011 Phys. Rev. D84 085006 (Preprint 1108.2509)
- [14] Aloisio R, Matarrese S and Olinto A V 2015 JCAP 1508 024 (Preprint 1504.01319)
- [15] Gayley K G, Mutel R L and Jaeger T R 2009 Astrophys. J. 706 1556–1570 (Preprint 0904.3389)