Resolved UV and [CII] structures of luminous galaxies within the epoch of reionisation
Abstract
We present new deep ALMA and HST/WFC3 observations of MASOSA and VR7, two luminous Ly emitters (LAEs) at , for which the UV continuum level differ by a factor four. No IR dust continuum emission is detected in either, indicating little amounts of obscured star formation and/or high dust temperatures. MASOSA, with a UV luminosity M, compact size and very high Ly EW Å, is undetected in [Cii] to a limit of L L⊙ implying a metallicity . Intriguingly, our HST data indicates a red UV slope , at odds with the low dust content. VR7, which is a bright (M) galaxy with moderate color () and Ly EWÅ, is clearly detected in [Cii] emission (S/N=15). VR7’s rest-frame UV morphology can be described by two components separated by kpc and is globally more compact than the [Cii] emission. The global [Cii]-UV ratio indicates , but there are large variations in the UV-[Cii] ratio on kpc scales. We also identify diffuse, possibly outflowing, [Cii]-emitting gas at km s-1 with respect to the peak. VR7 appears assembling its components at a slightly more evolved stage than other luminous LAEs, with outflows already shaping its direct environment at . Our results further indicate that the global [Cii]-UV relation steepens at SFR M⊙ yr-1, naturally explaining why the [Cii]-UV ratio is anti-correlated with Ly EW in many, but not all, observed LAEs.
1 Introduction
The advent of the Atacama Large Millimetre Array (ALMA) has enabled the first detailed studies of the interstellar medium (ISM) in various kinds of star-forming galaxies and quasar hosts within the epoch of reionization at (e.g. Wang et al., 2013; Maiolino et al., 2015; Willott et al., 2015; Inoue et al., 2016; Decarli et al., 2017; D’Odorico et al., 2018). ALMA also opened the opportunity of resolving internal structure at kiloparsec scales (e.g. Jones et al., 2017; Matthee et al., 2017b; Carniani et al., 2018b; Hashimoto et al., 2018a). Currently, ALMA observations of galaxies at focus on measuring the dust far-infrared (FIR) continuum and FIR fine-structure lines [Cii]158μm and [Oiii]88μm. The [Cii] line partly traces Hii regions and neutral gas (i.e. photo-dissociating regions; PDRs; Vallini et al. 2013), while the [Oiii] line only traces Hii regions. Combined with detailed photoionisation modelling, these lines can be used to constrain gas properties such as the metallicity and ionisation state (e.g. Olsen et al., 2017; Vallini et al., 2017).
While the dust continuum is typically undetected in galaxies selected through their UV or Ly emission (e.g. Capak et al. 2015; Bouwens et al. 2016b; Pentericci et al. 2016; Matthee et al. 2017b, but see Bowler et al. 2018; Hashimoto et al. 2018a; Tamura et al. 2018 for counter examples), the fine-structure lines are now routinely detected. Due to the low metallicity and higher ionisation state of the ISM in high-redshift galaxies, the [Oiii] line may be the strongest far infrared emission line (e.g. Ferkinhoff et al., 2010; Inoue et al., 2016), unlike at low-redshift, where [Cii] is typically the strongest (e.g. Stacey et al., 1991; Wolfire et al., 2003; Herrera-Camus et al., 2015). Indeed, recent studies have shown [Oiii] to be more luminous than [Cii] in objects for which both lines are constrained (Inoue et al., 2016; Carniani et al., 2017; Hashimoto et al., 2018a; Walter et al., 2018).
However, even though being potentially less luminous in high-redshift galaxies, the [Cii] line is more easily observed for the vast majority of galaxies currently known at . This is because [Cii] redshifts into favourable frequencies in ALMA bands 6 and 7 at , while this only happens at for [Oiii] (with the exception of a few narrow redshift windows around , e.g. Carniani et al. 2017, where the sensitivity to [Cii] is still a factor better). Therefore, practically, observations of the [Cii] line are still the least expensive for measuring systemic galaxy redshifts (c.f. Ly) and studying ISM properties and kinematics.
Some early ALMA observations of galaxies at (e.g. Capak et al., 2015) indicated relatively luminous [Cii] emission relative to the UV star formation rate (SFR), compared to the observed relation in the local Universe (De Looze et al., 2014). Several other searches at either found a moderate [Cii] deficit (Pentericci et al., 2016; Bradač et al., 2017) or report stringent upper limits on the [Cii] luminosity which would place these distant galaxies far below the local relation (e.g. Ouchi et al., 2013; Ota et al., 2014). Such deficit could potentially be due to the prerequisite of a known Ly redshift, which leads to a bias of observing young, metal-poor systems (e.g. Trainor et al., 2016). New observations of additional galaxies (e.g. Matthee et al., 2017b; Smit et al., 2018; Carniani et al., 2018b; Hashimoto et al., 2018a) and re-analysis of earlier ALMA data (Carniani et al., 2018a) indicate there is more scatter at high-redshift (Carniani et al., 2018b) instead of a strongly preferred low or high [Cii]-UV ratio. The [Cii]-UV ratio correlates with the relative strength of Ly emission (Carniani et al., 2018b; Harikane et al., 2018). These measurements are nonetheless complicated by the observation that [Cii] is often offset spatially from the UV emission and multiple components of [Cii] emission can be associated to UV components (e.g. Matthee et al., 2017b).
In this paper, we present new ALMA and HST observations of two very luminous LAEs at , named VR7 and MASOSA (Sobral et al., 2015; Matthee et al., 2017a), combined with a multi-wavelength analysis of archival data. While these galaxies have similar Ly luminosity, the UV continuum is very different, leading to a factor difference in the equivalent width (EW). What causes these differences in their Ly EWs? Are the SFRs, dust content and/or ages of the galaxies different? Are there any differences in their metallicities? To answer these questions, we focus on characterising the properties of the ISM (metallicity, kinematics, dust content) and the stellar populations (star formation rate and age), and compare these to other galaxies observed at .
Our targets resemble the Ly luminosity of the well-known LAEs Himiko and CR7 (Ouchi et al., 2013; Sobral et al., 2015) which are clearly resolved into several components separated by kpc in both the rest-frame UV and in [Cii] emission (e.g. Matthee et al., 2017b; Carniani et al., 2018b; Sobral et al., 2019). Do these luminous LAEs also consist of several components, which could indicate mergers are ubiquitous in the strongest Ly emitters? We address this with high spatial resolution observations in both rest-frame UV and [Cii] emission.
The structure of this paper is as follows. We present the new ALMA and HST/WFC3 observations and their data reduction in §2. §3 presents the rest-frame UV and Ly properties of both galaxies and compares them to the observed galaxy population at similar lookback time. We then investigate the FIR continuum data from ALMA to constrain the galaxies’ dust continuum emission in §4. In §5 we present integrated measurements of the [Cii] line, while we present the structure in VR7, resolved in both the spatial and spectral dimension in §6. In §7, we discuss the nature of MASOSA and which physical properties determine the [Cii]/UV ratio in high-redshift galaxies. Finally, we summarise our results in §8. We use a CDM cosmology with , and H km s-1 Mpc-1 and a Salpeter (1955) initial mass function. Throughout the paper, UV and IR luminosities are converted to SFR following Kennicutt (1998).
2 Observations & Data reduction
2.1 ALMA
We performed ALMA observations in band 6 of our targets aiming at detecting [Cii] line emission and FIR dust-continuum emission through ALMA program 2017.1.01451.S in Cycle 5. We observed in four spectral windows: two centred around redshifted [Cii]158μm emission at ( GHz) and two around 235 GHz, each with a bandwidth of 1875 MHz and 7.8 MHz ( km s-1) resolution. Both galaxies were observed with 43 antennas in configuration C43-4, allowing baselines from 15 to 783 m, leading to a natural resolution of . Each galaxy was observed for three executions that consisted of 49 minutes integration time on target, leading to a total on target exposure of 147 minutes.
MASOSA (Matthee et al., 2015; Sobral et al., 2015) was observed during three executions on March 23-24 2018 with precipitable water vapour (PWV) column of 0.9, 1.9 and 2.0mm, respectively. The quasar J1058+0133 was used as atmospheric bandpass and flux calibrator, while quasar J0948+0022 was used as phase calibrator. VR7 (Matthee et al., 2017a) was observed under good conditions (PWV column of 1.0, 1.0 and 0.7 mm, for each execution, respectively) on 6 and 7 September 2018. The quasars J2148+0657 and J2226+0052 were used for atmospheric bandpass and flux calibrator, and phase calibrator, respectively.
The data have been reduced and calibrated using Casa version 5.1.1-5 following the standard pipeline procedures. The final imaging was performed using the clean task, with different choices for weighting and tapering depending on the specific scientific question. In general, using natural weighting, we measure a background rms = 6 Jy beam-1 in the continuum and a background rms = mJy beam-1 in 18 km s-1 channels.
Our analysis and reduction strategy was as follows: we first reduced the data with natural weighting and a UV tapering of 650 k (corresponding to an on-sky FWHM of ) and by averaging over two velocity channels, leading to a data-cube with a beam FWHM and km s-1 velocity resolution. The tapering was used to optimise detectability of extended emission, while the typical [Cii] line with FWHM km s-1 would still be well resolved. This reduction was used for initial inspection. For detections, we then re-imaged the data with higher spatial resolution (through briggs weighting with robust parameter 0.5 and without tapering) and/or without channel-averaging, with specific parameters chosen optimised for the science question (and motivated in each relevant section independently and summarised in Table LABEL:tab:reductions). For non-detections, we test the robustness of not-detecting the line/continuum by changing the reduction method, and use the tapered reduction motivated by the properties of similar galaxies.
2.2 HST/WFC3
We present HST/WFC3 observations of MASOSA observed as part of HST program 14699 (PI: Sobral) on March 6 2018. Observations were performed for two orbits with the F110W and F160W filters. During each orbit, four exposures of s were taken following the standard WFC3/IR dither pattern. This results in total exposure times of 5.2ks. We acquire flat-fielded and calibrated flt images from the STScI server and fix the astrometric solution to the ground-based near-infrared data (that is fixed to GAIA DR2 astrometry). Then, after masking bad pixels and cosmic rays, we median combine individual exposures to a final image with 0.064′′ pixel scale with bilinear interpolation using Swarp (Bertin, 2010). We also apply this reduction strategy to the HST/WFC3 data on VR7 (originating from the same HST program) that was presented earlier in Matthee et al. (2017a). Compared to the previous reduction, the spatial resolution is increased slightly as the image is better sampled. We have verified that the integrated flux and sensitivity are consistent within %.
We use unsaturated, high S/N detections of stars to measure a resolution of FWHM=0.25, 0.28′′ in the F110W and F160W images, respectively. The depth is estimated by measuring the standard deviation of the total counts in 1000 apertures with 0.8′′ diameter placed in empty sky regions. We measure a 3 limit of F110W and F160W AB magnitude after correcting for aperture losses.
3 The properties of targeted galaxies
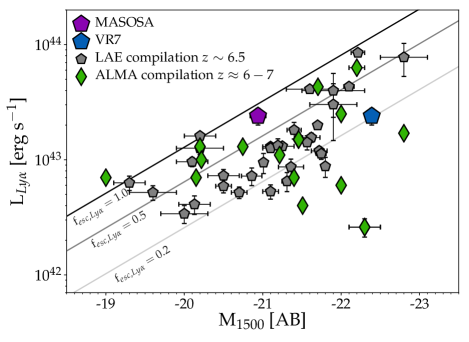
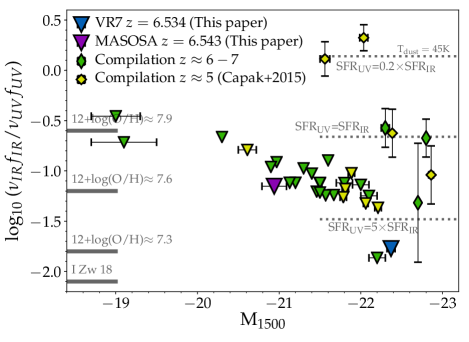
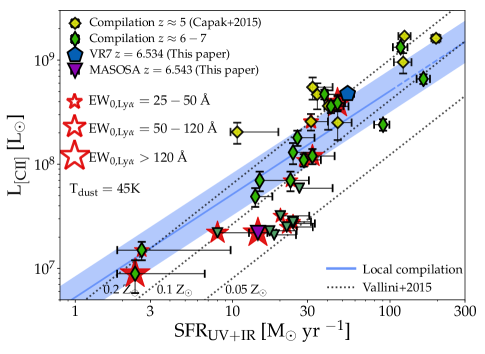
In this section, we present the general properties of the targeted galaxies based predominantly on Ly measurements and HST/WFC3 data. The measurements are summarised in Table LABEL:tab:global_properties. Our targets have been selected on their high Ly luminosity (; e.g. Matthee et al. 2015; Konno et al. 2018), a confirmed spectroscopic redshift and their observability with ALMA. The Ly luminosities of our targets are relatively high compared to the majority of earlier ALMA observations, but not extreme (Fig. 1).
MASOSA, at (Sobral et al., 2015), is located in the COSMOS field, such that there is Spitzer/IRAC data available through the SPLASH program (in particular in the [3.6] and [4.5] bands; Steinhardt et al. 2014). VR7, at (Matthee et al., 2017a), is located in the CFHTLS-W4/SA22 field where no deep Spitzer/IRAC data is available. Upper limits on rest-frame UV lines besides Ly based on X-SHOOTER observations (i.e. Civ, Heii, Ciii]) are presented for VR7 in Matthee et al. (2017a). The non-detections of high-ionisation lines and the narrow Ly line-widths ( km s-1) indicate that our targets are not powered by a strong active galactic nucleus (AGN; e.g. Sobral et al. 2018.)
3.1 Ly luminosity and rest-frame equivalent width
We measure the Ly flux using a combination of narrow-band (NB921) and broadband () imaging from Subaru/Suprime-Cam as described in Matthee et al. (2015). The transmission of the NB921 filter is not a perfect top-hat (which is assumed in the flux calculation in Matthee et al. 2015). Therefore, we correct the line-flux for the actual transmission at the specific wavelength where Ly is observed which is known thanks to spectroscopy. Our flux measurements are therefore not dependent on (assumptions on) slit losses or the flux calibration of spectra. VR7 and MASOSA have an almost identical integrated Ly luminosity, while their UV continuum luminosity differs by a factor (see the next subsection). Measurements of the UV continuum luminosity and the UV slope are used to constrain the continuum around Ly, and to estimate the EW. The Ly EW of VR7 is moderate (EW Å), while the EW of MASOSA is extremely high (albeit with large uncertainties; EW Å). The emission of both Ly lines consist of a single, clearly asymmetric red peak, with FWHM ranging from 340-390 km s-1 Sobral et al. (2015); Matthee et al. (2017a).
3.2 UV luminosity and colors
We measure the rest-frame UV luminosity using the HST/WFC3 F110W and F160W data. Measurements are performed with 1.2′′ diameter apertures to account for the objects sizes and include corrections for missing encapsulated flux based on the WFC3 manual. We correct the F110W photometry for the contribution from Ly emission based on the measured Ly luminosity and measure the UV slope using the F110W-F160W colors following Ono et al. (2010).
For MASOSA, we measure F110W and F160W. These measurements translate into an absolute UV luminosity M and a red UV slope ( magnitude brighter and if we would not correct for the Ly contribution). The potential red color is intriguing given the high Ly EW, as the Ly escape fraction is typically lower for red galaxies (e.g. Matthee et al., 2016). We discuss this in more detail in §7.1. MASOSA has Spitzer/IRAC magnitudes and (Laigle et al., 2016), resulting in a relatively blue color similar to other LAEs at (e.g. Harikane et al., 2018).
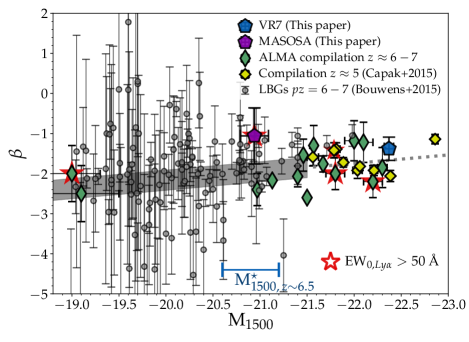
VR7 is very luminous in the rest-UV, with F110W and F160W, which translates in a UV luminosity M. VR7 is also relatively red, with , yet in agreement with the observed relation between UV slope and UV magnitude extrapolated to the luminosity of VR7 (Bouwens et al., 2012), see Fig. 2. Due to its lower EW, the correction for the Ly line has less impact ( magnitude and ).
3.3 Rest-frame UV sizes
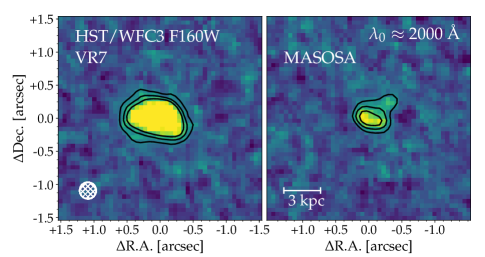
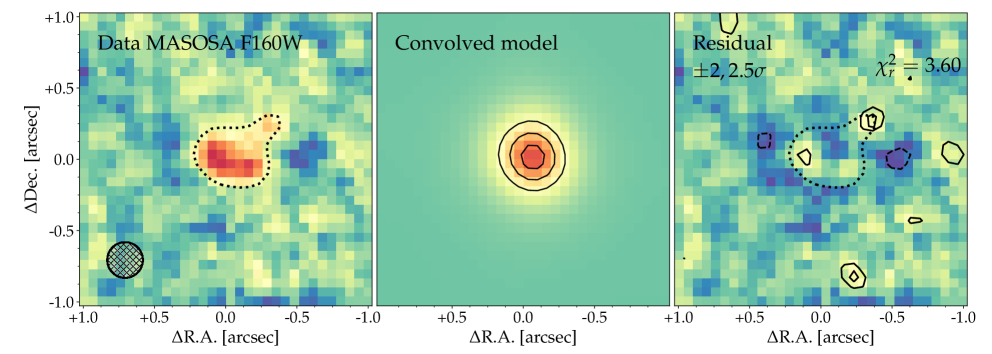
We measure the de-convolved UV-sizes of MASOSA and VR7 by modelling the light distribution with an exponential profile using the imfit software package (Erwin, 2015). The PSF image is created by averaging the (normalised) light-profiles of four nearby non-saturated stars and can be modelled accurately with a Moffat profile with FWHM=0.25′′. As the morphology in the F110W filter may be affected by Ly emission, we measure morphology in the F160W filter (see Fig. 3; Appendix B for details on the fitting). For MASOSA, we measure kpc (corresponding to FWHM=’ arcsec, so marginally resolved in the data) with an ellipticity and a position angle , meaning that the UV-light is almost spherically symmetric. We note that we would measure a slightly smaller size when allowing the Sérsic index to vary ( kpc for ) or when using the F110W filter ( kpc, indicating relatively compact Ly emission). While the F160W image hints towards a faint second clump, a two-component exponential does not provide a better fit to the data.
VR7 is well resolved and a single exponential model results in kpc with PA= and ellipticity . Relaxing the Sérsic index results again in a slightly smaller size ( kpc) with . In Appendix B we show that the HST data from VR7 is better described by two slightly smaller exponential components with a separation of (1.9 kpc), but we list the single component fit in Table LABEL:tab:global_properties for consistency with integrated [Cii] and UV luminosity measurements.
 |
 |
3.4 How do these galaxies compare to the general galaxy population?
We compare the UV and Ly luminosities of MASOSA and VR7 to other LAEs identified at and to other UV-selected galaxies at observed with ALMA at similar rest-frame frequency (see Appendix C). The latter sample mostly comprises galaxies for which the redshifts have previously been confirmed with (strong) Ly emission, as ALMA observations require that the redshift is precise to within , which is smaller than the typical uncertainty of photometric redshifts. A few notable exceptions include the galaxy B14-65666 at with faint Ly emission (Hashimoto et al., 2018a) and two Lyman-break galaxies at for which the photometric redshift could reliably be estimated (Smit et al., 2018), see Appendix C for a complete overview.
As shown in Fig. 1, VR7 is among the most luminous galaxies within the epoch of re-ionisation ever observed with ALMA. MASOSA has an M luminosity and is among the objects with the highest Ly EW. We note that the spatial resolution of the ALMA observations presented in this work is a factor higher than most previous observations, allowing more detailed investigation of dynamics and kinematics. The UV sizes of MASOSA and VR7 are comparable to the sizes of other galaxies with similar luminosity (e.g. Shibuya et al., 2015; Bowler et al., 2017).
4 The FIR continuum
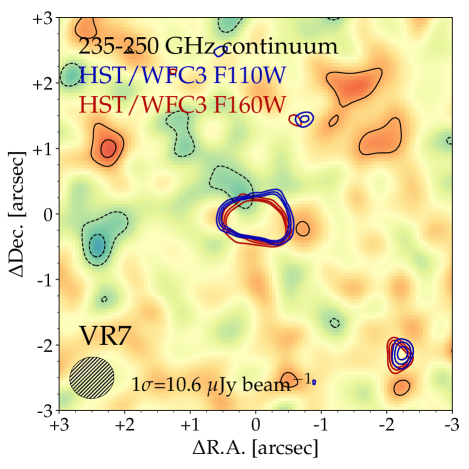
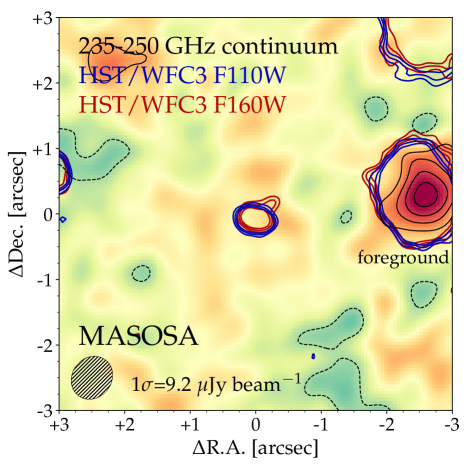
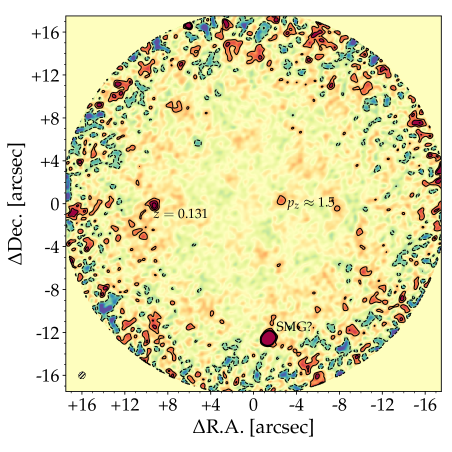
The ALMA data in the four spectral windows are combined to create 235-250 GHz (1.2 mm) continuum images centred on both objects. These continuum images constrain the FIR continuum luminosity. For VR7, we mask the frequencies where [Cii] is detected (see §5), while for MASOSA we use the full frequency range. Several foreground objects are identified in the continuum maps, which can all be associated to objects in either HST, Spitzer or VLT/MUSE data (Matthee et al. in prep). These objects lie in the foreground of our targets because of detections in images with filters blue-wards of the Lyman-break at . The foreground objects confirm that the relative astrometry between the ALMA and HST data and ground-based imaging is accurate to within . The general properties of these foreground objects and estimates of their redshifts are summarised in Table LABEL:tab:foreground_properties.
4.1 Upper limits at m
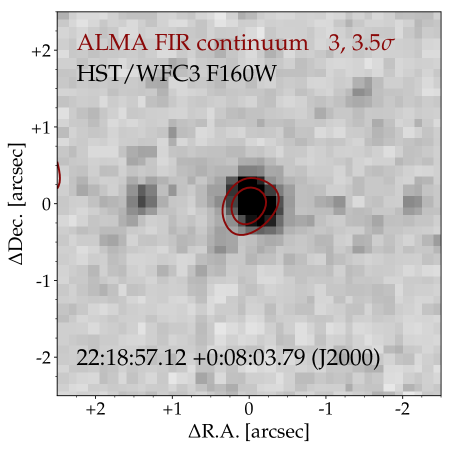
No FIR continuum emission is detected at the locations of VR7 or MASOSA (Fig. 4). This result does not depend on the weighting or tapering applied when imaging the visibility data from ALMA, meaning that it is unlikely that flux is resolved out. As source-sizes are (major axis) in the rest-frame UV, we use ALMA continuum images constructed with natural weighting and 650 k tapering (synthesized beam-FWHM ) to measure physically motivated and conservative upper limits. For VR7, we measure a 1 limiting Jy beam-1, while for MASOSA the 1 limit is Jy beam-1.
We compare our measured upper limits on the continuum flux density around m with those measured in other UV-selected galaxies at in Fig. 5. We show IR flux densities, instead of (temperature dependent) IR luminosities, but note that we corrected the flux density for CMB heating assuming a dust temperature K, leading to a median correction of dex (da Cunha et al., 2013). We also indicate the expected 1500Å/160m flux density ratios for local galaxies with extremely low metallicities as inferred from a compilation of galaxies in the local Universe by Maiolino et al. (2015). For comparison, we show the upper limiting flux density ratio for low-metallicity dwarf galaxy I Zw 18, that we determine using measurements from GALEX/NUV (Gil de Paz et al., 2007) and Herschel/PACS F160 (Rémy-Ruyer et al., 2015). This upper limit is comparable to the upper limit for VR7. The IR continuum sensitivity in both MASOSA and VR7 is higher than other galaxies of comparable UV luminosity. VR7 is the most-UV luminous galaxy for which the continuum around m is currently undetected. This extremely low 160m/1500Å ratio indicates that VR7 has a lower dust-to-gas ratio and/or higher dust temperature, compared to other luminous galaxies. The only other galaxy with even stronger limits on the 160m/1500Å flux density ratio is the luminous LAE CR7 (Matthee et al., 2017b).
4.2 IR luminosity and total SFR
In order to use these measurements to derive upper limits on the total IR luminosity (LIR), one has to make assumptions on the distribution of dust temperatures that combined result in a modified blackbody spectral energy distribution (SED), as an upper limit at a single frequency can not constrain the shape of this SED. Moreover, at the temperature of the cosmic microwave background is K, which contributes to the heating of dust grains (da Cunha et al., 2013). The choice of (luminosity weighted) dust temperature strongly impacts the integrated IR luminosity. For example, an increase in the dust temperature from 25 to 45 K decreases the limiting LIR by a factor when the continuum is constrained around m (e.g. Schaerer et al., 2015).
While dust temperatures in typical star-forming galaxies in the Universe are K (e.g. Rémy-Ruyer et al., 2013), it is plausible that the dust temperature is higher at higher redshifts, in particular in galaxies with hard ionising sources (i.e. early generations of stars) and a low metallicity (e.g. Cen & Kimm, 2014; Maiolino et al., 2015). While direct constraints on the dust temperatures in high-redshift galaxies require large investments of ALMA time (e.g. Bouwens et al., 2016b), Faisst et al. (2017) show that the luminosity-weighted dust temperature in high analogues at low-redshift may be as high as 70 K. Behrens et al. (2018) furthermore simulate that intense radiation fields in young galaxies could even result in dust temperatures as high as 90 K.
With these caveats and considerations in mind, we convert our upper limits for VR7 to a limiting L L⊙ and L L for MASOSA integrating an optically thin grey body between 8-1000m (see Table LABEL:tab:global_properties and Appendix C for details). We assume a dust temperature 45 K and power law exponent and correct for the heating from the CMB following Ota et al. (2014), although note these corrections are only a factor and are less important for higher dust temperatures (see Appendix C for more details). The assumed dust temperature is similar to the measured dust temperature in local low-metallicity galaxy I Zw 18 (Rémy-Ruyer et al., 2015). Assuming a dust temperature of 35 K would result in L L⊙ and L L⊙ for both sources, respectively.
 |
 |
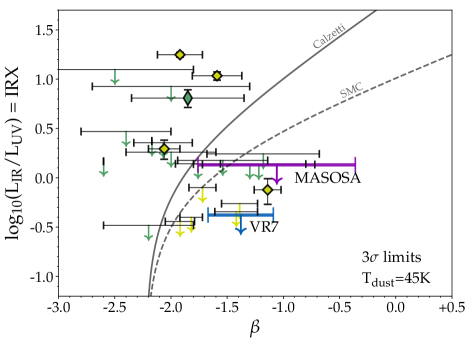
As the observed UV continuum slope correlates with the level of dust attenuation (e.g. Meurer et al., 1999), it is expected that the IR/UV luminosity ratio (the IRX ratio) depends on the UV slope, with the relation being dependent on the shape of the attenuation curve and the dust geometry (e.g. Faisst et al., 2017) and the intrinsic stellar SED (Reddy et al., 2018). We show the locations of VR7 and MASOSA on the IRX- plane in Fig. 6, together with our compilation of galaxies at , assuming a dust temperature of 45 K. VR7 and MASOSA both lie significantly below the commonly used SMC and/or Calzetti attenuation curves, which could indicate that the dust temperature is higher. Additionally, another explanation could be that dust particles reside relatively closer to the star-forming regions and hence maximise the reddening at fixed IR luminosity (e.g. Ferrara et al., 2017), particularly in compact galaxies.
The constraints on the IR continuum can be converted in an upper limit on the level of obscured star formation. Following Kennicutt (1998), we constrain SFR M⊙ yr-1 and SFR M⊙ yr-1 for VR7 and MASOSA at 1 respectively for a dust temperature of 45 K. Additionally, we can use the observed UV continuum luminosity as an indicator of the un-obscured SFR. Following again Kennicutt (1998), we measure SFR M⊙ yr-1 for VR7 and SFR M⊙ yr-1 for MASOSA. If we would use the classical method to correct the UV luminosity for dust attenuation based on the observed UV slope (e.g. Meurer et al., 1999), we find SFR M⊙ and SFR M⊙ yr-1 for both galaxies respectively. Such high SFRs are however ruled out by the non-detection of continuum emission in our ALMA observations, which indicate that the fraction of obscured SFR is %.111We calculate that the obscured SFR would be similar to the unobscured SFR in case the dust temperature is 65 K in MASOSA and 90 K in VR7. Compared to our fiducial calculations assuming T K, this would increase the upper limits on the IR luminosity by and dex, respectively. Therefore, combining the limiting obscured SFR as an upper bound to the unobscured SFR, we find SFR M⊙ yr-1 for VR7 and SFR M⊙ yr-1 for VR7 and MASOSA, respectively.
 |
 |
5 Integrated [Cii] emission properties
We now focus on the ALMA data around the redshifted [Cii]158μm frequency. While recent work showed that ALMA resolves [Cii] emission in multiple components for a large fraction of high-redshift galaxies (e.g. Matthee et al., 2017b; Carniani et al., 2018b; Hashimoto et al., 2018b), we focus first on the integrated [Cii] properties by using a low spatial-resolution reduction of our ALMA data (i.e. synthesized beam FWHM=0.7′′), and analyse a higher resolution reduction in §6.
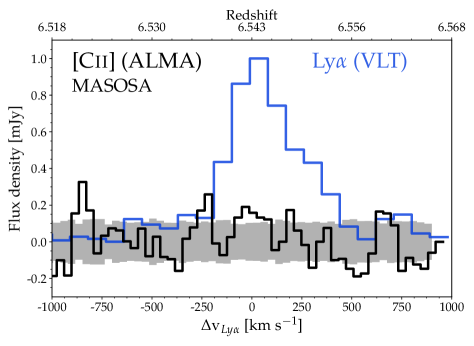
In order to search for [Cii] emission, we visually scanned the data-cube in slices of width 18 km s-1 from -1000 to +1000 km s-1 with respect to the Ly redshift, and searched for detections within a radius of 3′′ (15 pkpc at ). We illustrate the results of this scan in Figs. 7 and 8. Fig. 7 shows collapsed [Cii] narrow-band images zoomed at the positions of VR7 and MASOSA, while Fig. 8 shows 1D spectra extracted at the source location. Normalised Ly spectra are shown on the same barycentric vacuum velocity scale. We clearly detect [Cii] emission in VR7, while no [Cii] is detected in MASOSA.
5.1 Integrated [Cii] properties of VR7
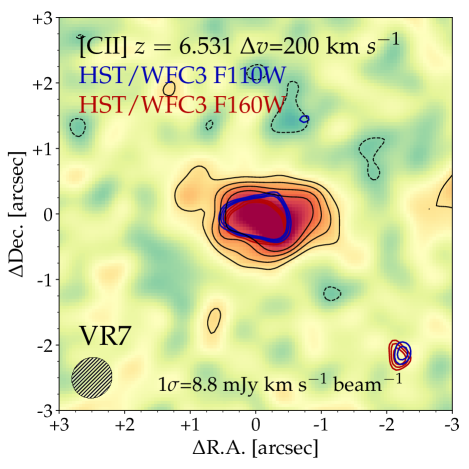
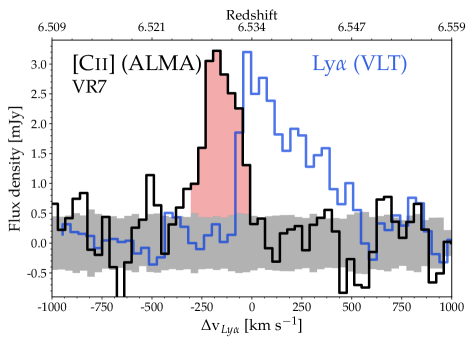
As shown in the left panels in Figs. 7 and 8, the [Cii] emission that is detected in VR7 is roughly co-located with the rest-frame UV emission and is slightly blue shifted with respect to Ly. The peak flux is detected with a S/N=9.4 in the collapsed [Cii] image, while the integrated S/N in the 1D extracted spectrum is .
We measure the redshift of peak [Cii] emission and the FWHM of the [Cii] line as follows. For 1000 iterations, we perturb each data-point in the 1D extraction with its associated uncertainty and measure the frequency where the flux density is highest, and the (linearly interpolated) frequencies where half of the peak flux density is observed. Then, we obtain the median and the 16, 84nd percentiles of those measurements, and find that the peak [Cii] flux is observed at . This means that the peak of the Ly emission-line is redshifted with respect to [Cii] by km s-1. The [Cii] FWHM is km s-1, which is a factor smaller than the Ly FWHM.
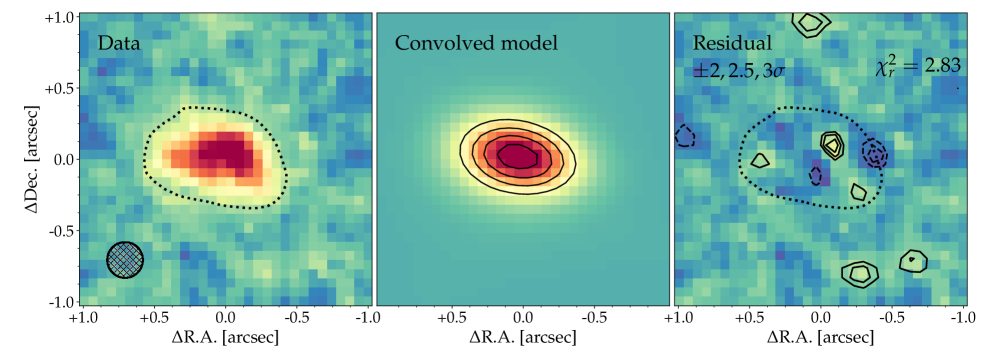
Next, we measure the integrated [Cii] luminosity by collapsing the primary-beam corrected cube over a wider range of frequencies (252.285 GHz - 252.519 GHz; corresponding to -20 to -320 km s-1 w.r.t. Ly; illustrated in Fig. 8). We use the imfit task in CASA, which fits an elliptical gaussian profile to the data. This results in a total flux of mJy km s-1 and a de-convolved source size (major/minor axis) with a position angle ( before deconvolution). Following Carilli & Walter (2013) this flux translates in a [Cii] luminosity L⊙, which is emitted over a region of kpc2. The integrated [Cii] measurements are summarised in Table LABEL:tab:global_properties. The [Cii] luminosity, line-width and velocity offset to Ly are similar to other galaxies at of comparable UV luminosity, and we will discuss this in more detail in §7.3. The major and minor axes of the [Cii] emission are larger than the axes of the rest-frame UV emission, which are kpc2 when the UV is modeled as a single component. This indicates [Cii] is more extended, similar to observations in quasar hosts (Cicone et al., 2015) and a stack of star-forming galaxies (Fujimoto et al., 2019). Moreover, Rybak et al. (2019) find that extended [Cii] emission may plausibly dominate the total [Cii] emission in high resolution observations of strongly star-forming galaxies at .
The line-width and size can be converted to an estimate of the total dynamical mass following Wang et al. (2013), which results in Mdyn/(sin ) M⊙ using the semi-minor or semi-major axis, respectively. This mass is a factor times the stellar mass estimated in Matthee et al. (2017a).
| Property | VR7 | MASOSA |
|---|---|---|
| R.A. (J2000) | 22:18:56.36 | 10:01:24.80 |
| Dec.. (J2000) | +00:08:07.32 | +02:31:45.34 |
| M1500 | ||
| reff,UV/kpc | ||
| LLyα/erg s-1 | ||
| EWLyα,0/ Å | ||
| zLyα | ||
| /km s-1 | ||
| - | ||
| [Cii] and IR properties | ||
| Sv /mJy km s-1 | ||
| L[CII],CASA/108 L⊙ | ||
| - | ||
| /km s-1 | - | |
| /km s-1 | - | |
| r1/2,major,[CII]/kpc | - | |
| r1/2,minor,[CII]/kpc | - | |
| /Jy beam-1 | ||
| Derived properties | ||
| SFR/M⊙ yr-1 | ||
| SFRUV,Meurer/M⊙ yr-1 | ||
| SFRUV+IR/ yr-1 | ||
| EW(H+[Oiii])/Å | - | |
| LL⊙ | ||
| SFR/M⊙ yr-1 | ||
| Mdyn/ 1010 M⊙ | - |
5.2 A physically motivated upper limit for the [Cii] luminosity in MASOSA
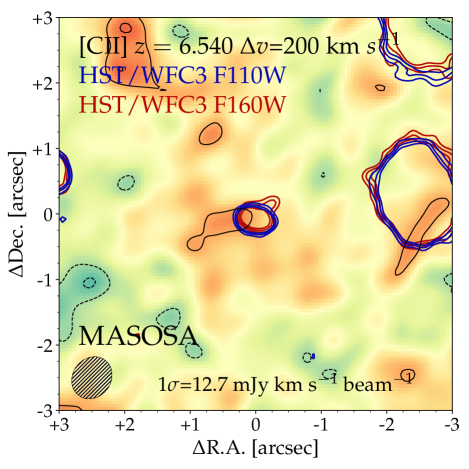
With the presented observations, no [Cii] emission is detected in the LAE MASOSA. Besides the [Cii] image collapsed over the frequency range used in Fig. 7, we have also inspected collapsed [Cii] images ranging from to km s-1 with respect to the Ly redshift and with widths ranging from km s-1, but none reveal a detection within 2′′ from MASOSA. We have also changed the reduction strategy including no UV tapering to a large UV taper of 200k, but none of our attempts resulted in a detection.
We measure the sensitivity of our observations using the r.m.s. value after masking out the position of detected foreground objects. We measure an r.m.s. of 12.7 mJy km s-1 beam-1 in a collapse of width 200 km s-1, which increases to 20.8 mJy km s-1 beam-1 collapsing channels over 400 km s-1. The noise increases by a factor when a UV taper of 300k is used instead of 650 k. As can be seen in Fig. 8, the noise per channel is relatively invariant of frequency, meaning that the sensitivity does not depend on central frequency. These two sensitivities correspond to 1 limiting [Cii] luminosities of L⊙.
Alternatively, we assess the significance of the non-detection of [Cii] in MASOSA by simulating how fake sources with known luminosity, source-size and width would appear in our data. We simulate point-sources with a range of [Cii] luminosities and line widths ranging from km s-1 in reductions with different beam sizes. We place these sources in 500 random positions in our collapsed images and measure the median peak S/N. For an object that is unresolved when imaged with a beam FWHM (corresponding to 3.8 kpc), we measure a S/N of 3 for a luminosity L⊙ for widths (100, 200, 400) km s-1, respectively. If an object is unresolved when imaged with a beam FWHM , a S/N of 3 is measured for L⊙ for each respective velocity width. Therefore, variations in the source-size and line width significantly influence the luminosity for which [Cii] emission can be detected.
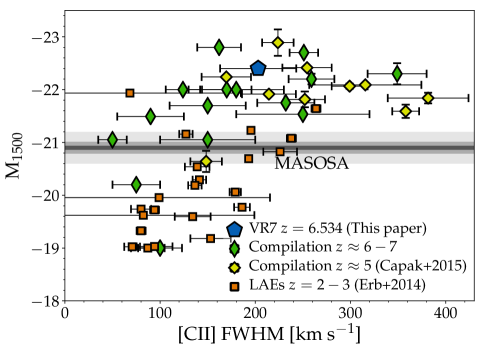
We show in Fig. 9 that the [Cii] line FWHM is correlated with the UV luminosity (with a Spearman rank of 0.46, P-value 98.5 % for data on their own), particularly when combined with data at . This correlation resembles the SFR - stellar mass ‘main sequence’, as the [Cii] line-width is expected to be a tracer of gravitational potential and hence mass and the UV luminosity is a proxy for SFR. Increasing scatter in [Cii] widths at the brightest UV luminosity could indicate dust attenuation, which could decrease the UV luminosity. MASOSA is among the galaxies with lowest UV luminosity currently targeted by ALMA at and is thus expected to have a [Cii] line width of about km s-1. Moreover, in galaxies for which both [Cii] and Ly are detected, the [Cii] width is typically a factor smaller than the Ly FWHM, likely because the Ly line width is affected by radiative transfer effects in the ISM and CGM of galaxies. This would point towards a [Cii] width of km s-1 for MASOSA.
The [Cii] half-light radius observed in galaxies at is typically kpc, a factor larger than the UV size of these galaxies measured with HST (Carniani et al., 2018b). As described above, the UV half-light radius of MASOSA is kpc. Therefore, a [Cii] half-light radius of about kpc is expected for MASOSA, which corresponds to a major axis of .
Combining the expected [Cii] extent and line width, the most realistic and conservative estimate of sensitivity of our observations is obtained by assuming a line width of 200 km s-1 and using a reduction with beam FWHM . This implies a 3 limit for the [Cii] luminosity from MASOSA of L⊙. We compare this upper limit with expectations from the UV luminosity and its implications in §7.1. For comparison, this value corresponds to L in the local Universe (Hemmati et al., 2017).
| Property ([Cii]) | Value |
|---|---|
| Flux1/mJy km s-1 beam-1 | 139.8 |
| Flux2/mJy km s-1 beam-1 | 43.1 |
| Flux2/(Flux1+Flux2) | 0.24 |
| /km s-1 | |
| /km s-1 | |
| FWHM1/km s-1 | |
| FWHM2/km s-1 |
6 The resolved structure of VR7
Thanks to the high S/N of the detected [Cii] line in VR7, we can reduce the ALMA data with a higher spatial resolution and/or relax the velocity-averaging compared to our analysis in §5. In this section, we first investigate the detailed 1D line-profile extracted over the full area over which [Cii] emission is detected and then focus on resolving structure spatially in both rest-frame UV and [Cii] emission.
6.1 1D line modelling
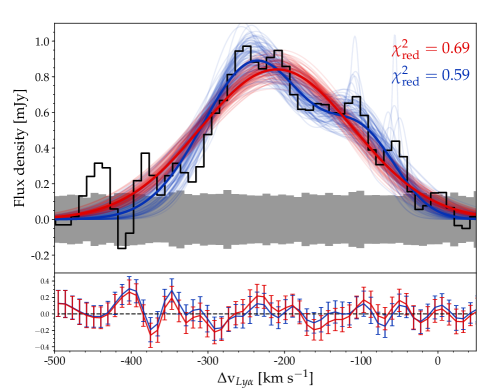
In Fig. 10 we show the 1D line-profile of VR7’s [Cii] line extracted with the native 9 km s-1 resolution and extracted over the full [Cii] spatial extent. The line-profile appears asymmetrically skewed towards the red, and is slightly better described by a two-component gaussian () than a single gaussian component (). The best-fitted values of the two-component gaussian fit are listed in Table LABEL:tab:twogauss_properties. The line-profile is characterised by a relatively broad (FWHM= km s-1) luminous component and a narrower (FWHM= km s-1) component that is a factor fainter. The narrow component is redshifted by compared to the more luminous component, but still blue-shifted by km s-1 compared to the peak of Ly emission.
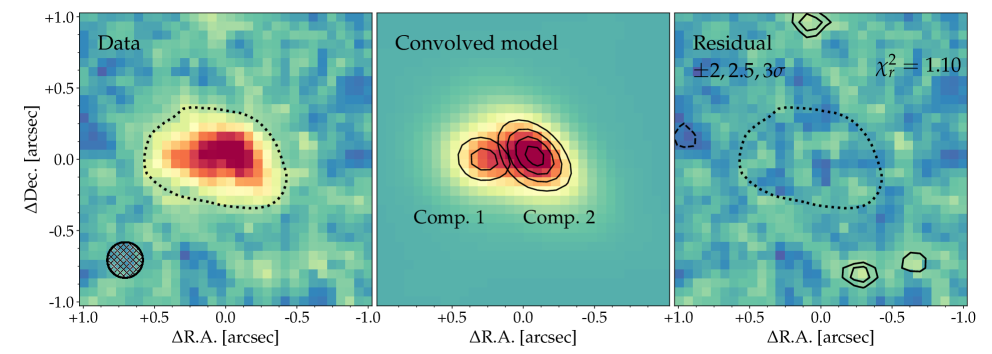
6.2 Two separate UV components
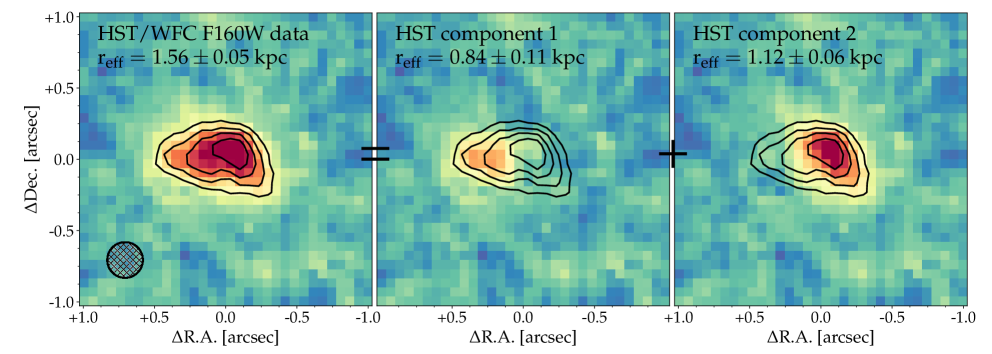
VR7’s rest-frame UV continuum emission is well resolved in the HST/WFC3 image, with a maximum extent of about 1.1′′ ( kpc) within the 2 contours. While in general the galaxy is elongated in the east-western direction, it also has a tail extending somewhat to the south-west (see the left panel of Fig. 11). Because of this tail, the rest-frame UV light-profile is better fitted by a two-component exponential model than a single component model (with reduced versus , detailed in Appendix B). The best-fitted double exponential model contains two components separated by ( kpc). We show the individual components in the middle and right panel of Fig. 11. The image for component 1 is created by subtracting the PSF-convolved model of component 2, and vice versa. We list their properties in Table LABEL:tab:twocomp_properties. Component 1 lies in the east and is relatively compact, while component 2 coincides with the peak UV emission and is elongated in the south-western direction. Component 2 is slightly larger and a factor more luminous, implying that both clumps have very similar SFR surface density. We note that we refrain from over-interpreting the colors of modelled components because of Ly emission possibly affecting the morphology in the F110W filter, but refer the reader to Appendix B for more details.
| Property | Component 1 | Component 2 |
|---|---|---|
| R.A. | ||
| Dec. | ||
| reff | kpc | kpc |
| PA | ||
| Ellipticity | ||
| Fraction of total flux | % | % |
6.3 Spatially resolved [Cii] and UV emission
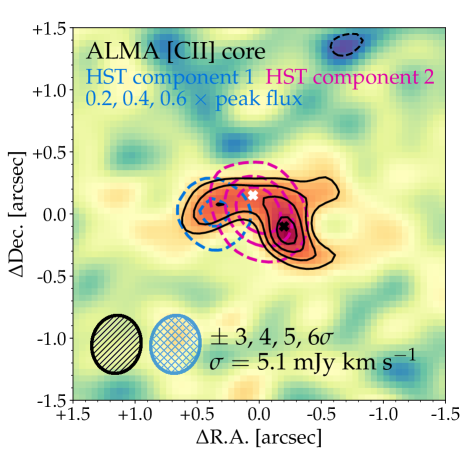
Now, we focus on spatially resolving the [Cii] emission using a high-resolution reduction ( beam; kpckpc), see Fig. 12. Extended [Cii] emission is observed over an area , with the largest elongation in the east-west direction, similar to what was found above in a lower resolution reduction. Interestingly, higher surface brightness contours are rotated by about clockwise, resembling component 2 in the rest-frame UV. Besides the peak [Cii] emission in the west, a hint of a second peak is seen in the east at from the image centre. Fig. 12 also compares the [Cii] map with the rest-frame UV components identified in the HST/WFC3 F160W imaging (Fig. 11). In general, the [Cii] morphology is similar to the rest-frame UV, with the major elongation in the east-western direction following the centers of both components. Intriguingly, the peak [Cii] emission extends towards the south-west, which is similar to the major direction of elongation of component 2 in the HST data.222The relative astrometry of the ALMA and HST data have been verified with only a single foreground object, meaning uncertainties on the order exist. However, the result that the position angles of high surface brightness regions of [Cii] and UV emission do not align is robust to these uncertainties.
 |
 |
 |
6.4 Resolved UV-[Cii] ratio
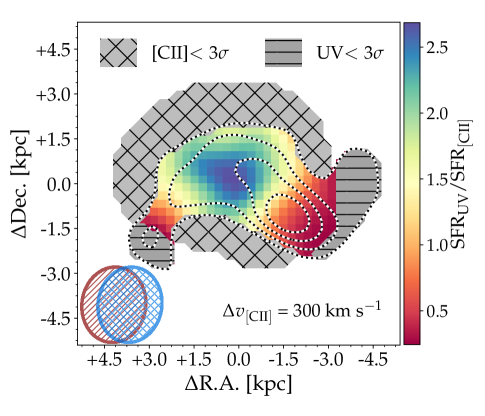
As a result of the differences in the UV and [Cii] morphologies, the UV-[Cii] ratio differs within the galaxy. We quantify the variation of the UV-[Cii] ratio by converting the luminosities to (unobscured) SFR surface densities following Kennicutt (1998) for the UV and the observed relation between [Cii] luminosity and SFR in the local Universe (De Looze et al., 2014) and illustrate the results in Fig. 13.
The average SFRUV/SFR[CII] ratio in the region where both UV and [Cii] are detected at is normal, with a mean ratio , but the scatter on kpc scales is large (). For example, the lowest SFRUV/SFR[CII] ratio, observed in the south-western part of the galaxy, is , while the highest ratio of about is only 2.8 kpc away. The region with peak [Cii] emission has a relatively low UV luminosity, potentially indicating obscured star formation (although no dust is detected in our ALMA observations, see §4) and/or a higher metallicity. We note that the UV colors of component 2 also indicate that it is older and more evolved (see Appendix B), although we stress these colors need to be interpreted cautiously. The central-eastern part of the galaxy has a relatively high UV-[Cii] ratio, indicating little obscuration and a low metallicity. No UV emission is detected at the position of the tentative [Cii] emitting component in the south-east. The outskirts of the galaxy tend to have a relatively high [Cii] luminosity, indicating a strong contribution from PDR emission instead [Cii] emission originating from Hii regions. This is consistent with measurements in local low-metallicity galaxies (Cormier et al., 2019) and the Milky Way (Pineda et al., 2013). Most observed [Cii] emission originates from PDR regions ( %; Pineda et al. 2013), but with other significant contributions from molecular hydrogen and cold atomic gas. Only a small fraction of the [Cii] (which decreases with decreasing metallicity; Cormier et al. 2019) originates from Hii regions. However, note that local galaxies are not affected by a strong CMB background that is present at high redshift.
6.5 Velocity structure
6.5.1 Moment maps
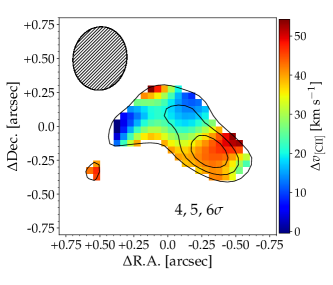
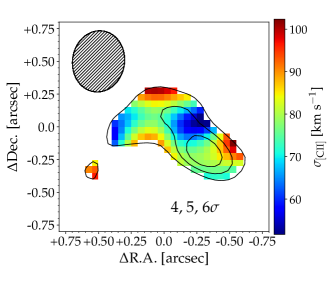
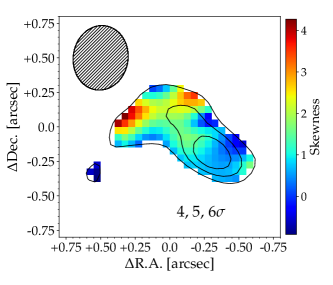
Here we explore the velocity structure of VR7 using the first, second and third moment maps of the [Cii] emission in the high resolution reduction, which can be interpreted as maps showing the peak velocity, velocity width and line skewness, respectively, see Fig. 14.333We note that the simple interpretation of the first and second moments may be somewhat confused by strong line skewness. For example, the first moment of a line-emitting region with fixed central velocity throughout the system, but with a red asymmetry in only part of the system, will show a slight gradient following the skewness gradient, as a red skewed line will result in a higher first moment.
The first moment map (left panel in Fig. 14) reveals that the peak velocity varies along the SW axis, the same position angle as component 2. While this pattern somewhat resembles rotation, the maximum velocity difference is only km s-1, which combined with the velocity dispersion of km s-1 results in a kinematic ratio . This indicates a dispersion dominated system (e.g. Förster Schreiber et al., 2009), unlike two luminous LBGs observed with ALMA in lower spatial resolution by Smit et al. (2018).
The second moment map (center panel in Fig. 14) shows variations in the velocity dispersion within a factor . The region with highest flux density has relatively low dispersion, while the north-east region has slightly broader line emission. It should be noted that the lowest dispersions in the second moment map are on the order of km s-1, which are similar to the line-width of the dominant (broader) component identified in our fit to the 1D spectrum. This could indicate that the second, narrow and slightly redshifted component identified from the 1D spectrum (Fig. 10) originates mostly from the north-eastern region of the galaxy. This is supported by the line skewness map (right panel of Fig. 14). While the highest skewness values that are found in regions where [Cii] is detected at significance should be interpreted with caution, the skewness still increases towards the north-east in the regions with high S/N.
6.5.2 Position-velocity diagrams
We also analyse position-velocity (PV) diagrams in order to study how the [Cii] line varies within VR7. We construct PV diagrams by averaging over a slit-width 1.5′′ around the center in the NS direction (PA=) using the CASA task impv. Fig. 15 shows the results for a reduction optimised for high spectral resolution (top row) and high spatial resolution (bottom row), where the first is achieved by reducing the data with normal weighting and UV tapering, while the latter is achieved with briggs weighting, but averaging over two velocity channels.
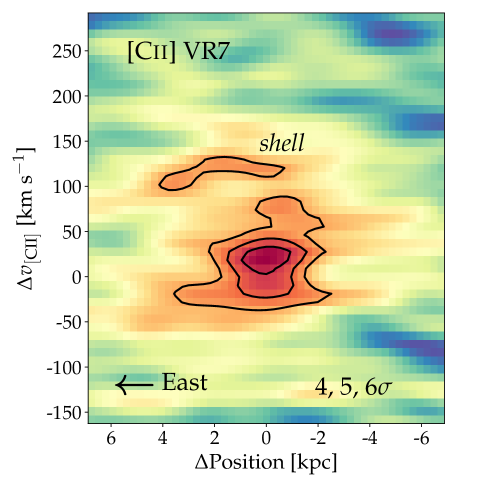
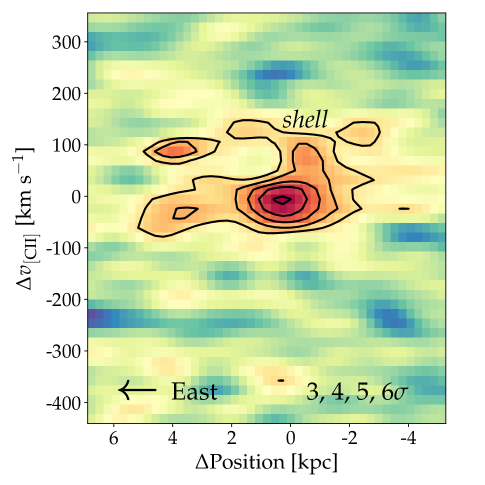
Fig. 15 confirms the result from the 1D analysis, which is that the [Cii] line profile is composed of (at least) two components: a central dominant component that is relatively compact and a redshifted extended component that has a narrower line-width, that we name the shell in the rest of the paper. The significance of the shell is in the reduction with low spatial resolution, but lower in the reduction with higher spatial resolution, which indicates that the [Cii] emission is somewhat diffuse and resolved out in the latter reduction. The shell is redshifted by km s-1 compared to the central component and is therefore consistent with the narrow gaussian component identified from the integrated 1D spectrum (see Table LABEL:tab:twogauss_properties). As the shell is chemically enriched, it is more likely to be outflowing than inflowing. While the flux from the shell extends over roughly the same spatial scales as the central component, the center is shifted slightly towards the north-east, consistent with the skewness map in Fig. 14. It is challenging to simultaneously show collapsed images of the core [Cii] emission and the shell because of the small separation and the extended nature of the shell. The positions of peak [Cii] flux are therefore indicated with crosses in Fig. 12, which shows that the separation is , or kpc.
Isolating the dominant component in the bottom panel of Fig. 15, we measure a size FWHM ranging from 0.35-0.50′′. As the beam major-axis is 0.46′′, this means that the central component is unresolved and has half-light radius kpc. Combined with the line-width of FWHM= km s-1, this results in an estimate of the dynamical mass Mdyn/(sin ) M⊙ (Wang et al., 2013; Matthee et al., 2017b). Besides the dominant component, the bottom panel of Fig. 15 also hints that there is a second fainter compact [Cii] emitting component at an offset of about 4 kpc to the east (see also Fig. 12, which shows that this component overlaps with one of the UV components). The peak flux of this component is a factor two lower than the dominant component and is detected at only significance.
7 Discussion
We now focus on interpreting the ALMA and HST observations and place them into the context of other observations. We first address the non-detections of [Cii] and IR continuum in MASOSA and discuss ways to reconcile this with the potentially red color in the UV (§7.1). Secondly, we discuss the nature of VR7 based on current data in §7.2 and we finally discuss the relation between [Cii] and UV emission in §7.3.
7.1 The nature of MASOSA: dusty? Metal poor?
MASOSA is not detected in [Cii] or FIR continuum emission. This may be explained by a higher dust temperature combined with a low dust mass and a relatively low metallicity. Such properties are indeed expected given MASOSA’s high-redshift and very high Ly EW (typically found in young, metal poor and dust-free galaxies; e.g. Sobral et al. 2015; Nakajima et al. 2016; Trainor et al. 2016; Sobral et al. 2018).
As illustrated in Fig. 16, the [Cii] luminosity limits implies that MASOSA is significantly [Cii]-deficient given its SFR, compared to the typical [Cii] luminosity found for star-forming galaxies in the local Universe (e.g. De Looze et al., 2014). This can be explained by a lower gas-phase metallicity (e.g. Vallini et al., 2015; Olsen et al., 2017). Following the relations derived by Vallini et al. (2015) based on radiative hydrodynamical simulations, the [Cii] upper limit in MASOSA implies a gas-phase metallicity Z⊙ (see Fig. 16) providing further evidence for the very low metallicity of this source as discussed in Sobral et al. (2015). An additional rough metallicity-estimate can be derived based on Spitzer/IRAC photometry. For the redshift of MASOSA, the [3.6] band is contaminated by H+[Oiii] line-emission, while the [4.5] band includes H emission (e.g. Schaerer & de Barros, 2009; Raiter et al., 2010a). Assuming a flat continuum in the rest-frame optical, MASOSA blue IRAC color () indicates an EW(H+[Oiii]) (e.g. Smit et al., 2014) and hence a gas-phase metallicity Z⊙ (Castellano et al., 2017). More detailed constraints on the gas-phase metal abundances in the ISM of MASOSA can be obtained from future deep (near-)infrared spectroscopy.
MASOSA’s possible red UV slope, , is relatively unexpected given the UV luminosity (; e.g. Bouwens et al. 2012 and Fig. 2), the high Ly EW (Hashimoto et al., 2017), the blue IRAC colors and the non-detection of dust continuum. Besides dust attenuation that we discussed in §4444Any significant amount of dust-obscuration in MASOSA would also imply a lower metallicity in order to explain the non-detection of the [Cii] line., a red UV slope could be reconciled with a young age in case of a combination of strong nebular continuum emission, strong UV emission lines besides and/or multiple clumps.
For example, Raiter et al. (2010b) show that strong nebular continuum free-free emission can redden the observed UV slope of low metallicity galaxies with hard ionising spectra up to at Å. The most likely emission line boosting the F160W magnitude (and hence the observed ) is Ciii]1909. Ciii]1909 is the strongest UV emission line in star-forming galaxies besides Ly (e.g. Shapley et al., 2003) and can have EW Å (e.g. Rigby et al., 2015; Stark et al., 2015; Maseda et al., 2017), particularly in galaxies with strong Ly emission (e.g. Le Fèvre et al., 2017). However, we calculate that correcting for a Ciii] EW of Å would imply a slope to , meaning that exceptionally strong lines would be required (see also Stroe et al., 2017). Moreover, MASOSA has a slightly different morphology in the reddest HST band (e.g. Fig. 3 and Fig. B.2), indicating the presence of a second, relatively faint red clump. Such a clump may be physically disconnected from the youngest stellar population. By fitting the F160W data with a combination of two point sources555The F160W data of MASOSA is described equally well by a single component within the uncertainties, see Appendix B, but we use the results from a two component fit to address the implication of this hypothesis., we find that the red clump contributes % of the flux. Reducing the F160W flux by 20 % results in , meaning that the main component of MASOSA can plausibly be ‘normally’ blue.
Concluding, MASOSA has common properties for galaxies with strong Ly emission (relatively compact, low metallicity and dust content) and is likely a young star bursting galaxy, with little evidence for being powered by an AGN. While MASOSA’s red UV color needs to be verified with deeper observations, a combination of a possible second component, relatively strong rest-frame UV lines such as Ciii] and strong nebular continuum emission could reconcile MASOSA’s relatively red color with being a young and relatively dust free galaxy.
 |
7.2 The nature of VR7: hot dust? merger?
VR7 is a large UV luminous star-forming galaxy with relatively strong Ly emission, relatively normal [Cii] emission. Remarkably, VR7 is the most UV-luminous SFG at for which no dust emission is detected at 160m. The limiting 160m/1500Å flux density ratio is extremely low and in the local Universe only seen for extremely metal poor systems as I Zw 18 (Fig. 5). The Ly EW implies a Ly escape fraction of % (Sobral & Matthee, 2019), which indicates that a significant fraction of Ly emission is destroyed by dust. Moreover, the moderate color also indicates dust attenuation. Therefore, it is likely that dust is present in VR7 at high temperatures (T K), which would also reconcile the limits on the 160m continuum flux density with common IRX- relations (Fig. 6 and e.g. Faisst et al. 2017). The non-detection of IR continuum emission, the narrowness of the [Cii] line and the UV morphology all indicate that VR7 is not powered by an AGN (e.g. Ota et al., 2014).
In §6, we showed that the [Cii] and rest-frame UV images clearly resolve the light from VR7, with clear indications of multiple components even though they are separated by only . This separation is a factor 2-3 smaller than the separation of individual components in other luminous Ly emitter at (e.g. Matthee et al., 2017b; Carniani et al., 2018b). Whether the components that are building up the VR7 galaxy are already at a smaller physical separation compared to other luminous LAEs (i.e. VR7 is in a more advanced stage of a merger), or whether this is a viewing angle/inclination effect, can not be addressed with the current data. Interestingly, among the luminous LAEs targeted with ALMA so far, VR7 has the lowest Ly EW, which could indicate it is in a slightly more evolved stage than LAEs with higher Ly EW. A slightly more evolved stage is also in line with its moderate UV slope, particularly since the other luminous LAEs have .
7.3 What determines the [Cii]/UV ratio
Here, we address the relative [Cii] and UV luminosities of galaxies at , compared to galaxies in the local Universe. Earlier work either found relatively high (Capak et al., 2015), moderately low (Pentericci et al., 2016) or extremely low [Cii] luminosities at fixed SFRUV (e.g. Ota et al., 2014). As detailed in Appendix C, we homogenise the measurements by converting all UV luminosities to SFRUV consistently and we revise upper limits following the method applied to MASOSA. Our results are compared to relations between [Cii] luminosity and SFR based on observations of galaxies in the local Universe (De Looze et al., 2014). Like our observations, we rescale the relation to the common SFR calibration of Kennicutt (1998). The results are shown in Fig. 16, where the left panel uses SFR estimated from only the UV, while the right panel uses the information on the dust continuum provided by ALMA to correct for obscured SFR.
While VR7 has an integrated [Cii]-SFRUV ratio that is very similar of other galaxies with similar SFR666We note that the global SFRUV and [Cii] surface densities of VR7 also agree with galaxies in the local Universe observed by De Looze et al. (2014)., MASOSA is [Cii] deficient, similar to several other galaxies with SFR M⊙ yr-1. There is significant dispersion in [Cii] luminosities at fixed SFRUV, particularly in the range SFR M⊙ yr-1 that includes most of the objects currently observed. A part of this dispersion is related to variation in relative strengths of Ly emission, since the SFR-[Cii] ratio is anti-correlated with the observed Ly EW (e.g. Carniani et al., 2018b; Harikane et al., 2018). Indeed, a large fraction of objects with [Cii] deficits are strong Ly emitters (Fig. 16). Furthermore, among the sample of luminous LAEs known at , MASOSA is at the higher end of the Ly EW distribution (e.g. Fig. 1), in agreement with this picture. On the other hand, Fig. 16 shows that several other strong Ly emitters, such as CR7 (Matthee et al., 2017b), have rather typical [Cii] luminosities given the SFR.
In the range SFR M⊙ yr-1, the detected galaxies at are roughly co-located with galaxies in the local Universe and follow a similar slope log10(L log10(SFR) once obscured SFR is accounted for. At SFRs below 30 M⊙ yr-1 the results are less clear, as the [Cii] line is undetected in a large fraction of galaxies, with a 1 limiting luminosity well below the local relation.
If relatively faint [Cii] lines are confirmed in these systems, it would imply that the relation between [Cii] luminosity and SFR steepens at low SFRs and that a larger fraction of the ISM is ionised. This potentially indicates a stronger correlation between gas-phase metallicity and SFR in lower mass galaxies. Alternatively, it could also indicate more bursty star formation in fainter galaxies (leading to a higher ionisation parameter) or other differences in ISM properties. Such a steepening is observed in the local Universe using a sample of low-metallicity dwarf galaxies (De Looze et al., 2014). Furthermore, such steepening would also explain why relatively low [Cii] luminosities are found among most strong Ly emitters, as the fraction of galaxies with strong Ly emission is higher at low SFRs in the observed sample (Fig. 16). This picture simultaneously allows higher [Cii] luminosities in the most luminous Ly emitters found in the large wide-field surveys (e.g. Matthee et al., 2017b; Carniani et al., 2018b).
8 Conclusions
In this paper, we have presented new deep follow-up observations of two luminous Ly emitters at with HST/WFC3 and ALMA with a resolution of 1.5-2 kpc. The HST data are used to characterise the strength and morphology of rest-frame UV emission, constraining the un-obscured SFR. ALMA data are used to constrain the level of FIR dust continuum emission and measure the strength and dynamics of the atomic [Cii]158μm fine-structure line. The targeted galaxies, VR7 and MASOSA (Sobral et al., 2015; Matthee et al., 2017a), have a high Ly luminosity, while their UV luminosity differs by a factor four. Table LABEL:tab:global_properties summarises our measurements. Our main results are the following:
-
1.
VR7 is among the most luminous and largest star-forming galaxies known at with an unobscured SFR=54 M⊙ yr-1 and an extent of kpc at the 2 level in the UV. VR7 has a typical moderate color given its high UV luminosity, , and moderate Ly EW Å. The HST/WFC3 rest-frame UV data of VR7 strongly prefers a two-component exponential model over a single component model. The individual components are separated by kpc and have sizes r kpc and r kpc. The larger component is a factor more luminous and is elongated in the south-western direction.
-
2.
MASOSA, which has a L⋆ UV luminosity (unobscured SFR=15 M⊙ yr-1) and a normal size (r kpc), is among the galaxies with highest Ly EW known at (EW Å). Surprisingly, MASOSA seems to have a relatively red UV continuum color , which could indicate strong Ciii] line-emission, nebular continuum emission and/or a multiple component nature.
-
3.
No dust continuum emission is detected in either VR7 or MASOSA (§4.2). Unless the dust temperature is very high (TK), this indicates little amounts of dust present in both systems. VR7 has an extremely low LIR/LUV ratio, similar to the ratio of the extremely metal poor dwarf galaxy I Zw 18 and the luminous LAE CR7 (Matthee et al., 2017b). Assuming TK, we find that the obscured SFR in both galaxies is a small fraction of the unobscured SFR ( % and %, respectively).
-
4.
Our ALMA data reveals a strong [Cii] emission detection in VR7 (S/N=15), but none in MASOSA (§5). VR7 has a typical integrated [Cii] luminosity relative to its SFR, indicating a metallicity Z⊙. For MASOSA, we derive a physically motivated [Cii] upper limit that results in a [Cii] deficit given the SFRUV and that implies a very low metallicity Z⊙. Combining our measurements with a large compilation, we find indications that the relation between [Cii] luminosity and SFR steepens at SFRs M⊙ yr-1, which could be explained due to a tighter correlation between SFR and metallicity in these galaxies compared to more luminous systems. Such a correlation naturally explains why most galaxies with high Ly EW have relatively low [Cii] luminosity.
-
5.
[Cii] emission in VR7 is extended (major/minor axes kpc2), a factor larger than the UV emission. The faint and low surface brightness [Cii] emission extends mostly in the east-west direction. The high surface brightness [Cii] emission also extends 45 towards to south-west (§6). We find that the UV-[Cii] ratio varies significantly within the galaxy (up to factors of on kpc scales). The dominant [Cii] emitting component is compact, with an estimated half-light radius kpc and being slightly offset from the peak UV emission. We find that some faint, diffuse [Cii] emission is redshifted by km s-1 with respect to the central component, possibly indicating an outflow and explaining the skewness and asymmetry seen in the 1D spectrum. Finally, we find indications for a second compact component at a 4 kpc separation.
Our observations show that there is little dust present in luminous Ly emitters at , unless the dust has very high temperatures ( K). Future ALMA surveys should therefore aim at observationally constraining these temperatures by performing deep observations at higher frequencies. There are large variations in the [Cii] luminosities of galaxies at which are strongly related to the SFRUV, albeit with significant scatter. Deep ALMA observations of galaxies with SFR M⊙ yr-1 (M) should test whether the relation between [Cii] luminosity and SFRUV indeed steepens at low SFRs. ALMA and HST are capable of resolving the most luminous systems at and reveal that they are actively assembling from multiple components with strong variations in the SFRUV-[Cii] ratio, while their environment is already being influenced by galactic outflows. In the future, resolved rest-frame optical spectroscopy using integral field unit spectroscopy on JWST will provide crucial complementary measurements of the ISM metallicity, the contribution from non-thermal emission and the masses, ages and metallicities of stellar populations.
Appendix A Continuum detections in the ALMA data
Besides our targets, our continuum maps reveal a number of detections, see Fig. A.1. Three objects are detected in the MASOSA pointing with S/N ranging from 5-56, while two objects with S/N 3.5-4.2 are (tentatively) detected in the VR7 pointing, see Table LABEL:tab:foreground_properties for details. In the MASOSA field, the highest S/N detection is likely a dusty and highly obscured star-forming galaxy, as it is not detected in optical imaging (limiting AB magnitudes ) nor in the HST/WFC3 data presented here. The object is detected in the MIR Spitzer/IRAC [3.6] and [4.5] bands, showing it is very red. No [Cii] or any other emission line is detected in the ALMA data, indicating it is not at similar redshift as MASOSA. The second most luminous continuum detection coincides with the centre of a face-on spiral galaxy with an SDSS-redshift of . The third continuum detection (with a S/N=5.0) is relatively near MASOSA (at , see also the right panel in Fig. 4), but coincides with a galaxy with photometric-redshift in the Laigle et al. (2016) catalogue. The continuum detections in the VR7 field are of lower significance. The detection with S/N=4.2 is shown in the left panel of Fig. A.1 and is co-located with a faint galaxy in the HST data. No emission-line is detected in our MUSE data (Matthee et al. in prep), suggesting that the galaxy is below (otherwise Ly could have been detected) and above (otherwise [Oii] could have been detected). The other continuum detection may be associated to a LAE at , although it is offset by 0.25′′ to the north-west.
| R.A. | Dec. | S/N | Comment | |
| (J2000) | (J2000) | (Jy beam-1) | ||
| 10:01:24.705 | +2:31:32.73 | 1212 | 56.0 | Dusty, highly obscured star forming galaxy with unknown photo. Detected in the Spitzer/IRAC [3.6] and [4.5] bands, but not detected in optical bands or our HST/WFC3 imaging data. |
| 10:01:25.427 | +2:31:45.23 | 138 | 8.2 | In the centre of a relatively nearby face-on spiral galaxy at with identifier SDSS J100125.41+023145.2. |
| 10:01:24.629 | +2:31:45.62 | 64 | 5.0 | Galaxy with photo and M M⊙, ID 810182 in Laigle et al. (2016) away from MASOSA. |
| 22:18:57.117 | +0:08:03.79 | 55 | 4.2 | Detected in HST/WFC3 with F110W=24.4. Marginally detected in a combined image. No emission-line detected in MUSE (Matthee et al. in prep). Likely photo-. |
| 22:18:57.143 | +0:08:18.29 | 79 | 3.5 | Associated(?) with a LAE identified in MUSE , offset 0.25′′ to the north-west |
 |
 |
Appendix B Fitting rest-frame UV sizes
Here we provide more details on the fitting of the HST/WFC3 data, in particular on fitting VR7 as a single component or a two component model and the fitting results for MASOSA.
B.1 Single component versus two component in VR7’s HST data
As described in the main text (§3.3), we find that the light profile of VR7 in the HST/WFC3 F160W data is better described by a combination of two exponential profiles than by a single exponential (or Sérsic) profile. The result of the fitting using imfit (Erwin, 2015) is shown in Fig. B.1. The residual map of the single-component fit shows clear structure at the level, while residuals of such strength are not seen in the more flexible two-component fit. We note that the F110W data (which morphology is possibly affected by Ly emission) is also better described by a two-component fit, although the relative flux and sizes of the two component reverse (i.e. a larger and more luminous component in the east and a smaller fainter component south-west). While this implies a color gradient, we note that these (and particularly their uncertainties) are challenging to quantify without strong priors such as assuming that the relative sizes, position angles and ellipticities are the same and assuming a homogeneously distributed Ly surface brightness. If we use the morphology of the individual components in the F160W data as a prior and assume Ly emission is homogeneously distributed, we measure that the flux fraction in component 1 (Fig. 11) is % and % in the F110W and F160W data, respectively. This implies component 1 has a UV luminosity and color M and , while component 2 has M and . Without subtracting Ly emission from the F110W flux density the UV slopes would be bluer, with .
B.2 Single component in MASOSA
We show our best fit single exponential model to the F160W from MASOSA in Fig. B.2. Due to the limited S/N of the galaxy the data can not reliably distinguish between a single component or a combination of two components, although visually a hint of a second component can be seen in the north-west of the galaxy. Deeper HST data is required to confirm this component.
Appendix C Compilation and homogenisation of measurements from galaxies at
In order to compare our measurements to earlier observations of galaxies at , we compile a sample of spectroscopically confirmed galaxies at for which the [Cii] line and adjacent continuum has been observed with ALMA. This compilation includes LAEs (Ota et al., 2014; Inoue et al., 2016; Matthee et al., 2017b; Carniani et al., 2018a), UV-selected galaxies confirmed through Ly emission (Maiolino et al., 2015; Willott et al., 2015; Pentericci et al., 2016; Carniani et al., 2018b; Hashimoto et al., 2018a), lensed UV-selected galaxies (Knudsen et al., 2016; Bradač et al., 2017) and UV-selected galaxies confirmed through [Cii] emission (Smit et al., 2018). We also include the sample of LBGs, LAEs and galaxies selected through their photometric redshift at from Capak et al. (2015) with updated measurements from Barisic et al. (2017). For a proper comparison, we collect observed properties (i.e. UV, [Cii] and Ly luminosity, line-widths and IR flux densities) and self-consistently convert these to derived properties (i.e. star formation rates and IR luminosities). Table C.1 shows the observed properties of the galaxies at , while Table C.2 lists derived properties. The Ly properties are listed in Table C.3.
We use published values of M1500 and wherever possible, but for several objects we calculated M1500 based on published photometry. When available, Ly luminosities have been computed using published line-flux measurements. For galaxies in which no [Cii] is detected, we measure the physically motivated upper limit similar to the procedure in §5.2. This means that we estimate the expected line-width based on the UV luminosity (typically 150-200 km s-1) and convert published noise values to this width assuming rms, where is the channel width over which the noise is measured. Measurements of/upper limits on the continuum flux at m (typically mm) have been converted to an FIR (m) and IR (m) luminosity following Ota et al. (2014), after correcting the contribution from CMB heating following da Cunha et al. (2013). We assume a modified blackbody of the form: B, where is the luminosity distance, the Boltzmann constant, the dust temperature, the dust mass, , where is the dust opacity at 850 m, which we assume is 0.077 m2 kg-1 similar to Ota et al. (2014) and is the grey-body power-law exponent, which we assume to be following Ota et al. (2014). Then, the obscured SFR is calculated following Kennicutt (1998): log10(SFRIR/M⊙ yr-1) = log10 (/erg s-1) - 43.48. M1500 is converted to an un-obscured SFRUV following Kennicutt (1998): log10(SFRUV/M⊙ yr-1) = -0.4 (M1500+18.03). The SFRs can be converted to the calibrations in Kennicutt & Evans (2012) that follow a Kroupa IMF by multiplying SFRUV by a factor 0.63 and multiplying SFRIR by a factor 0.86.
| ID | M1500 | f160μm/Jy | L L⊙ | /km s-1 | Reference | ||
|---|---|---|---|---|---|---|---|
| A383-5.1 | 6.029 | K16 | |||||
| NTTDF2313 | 6.07 | C18 | |||||
| WMH5 | 6.075 | W15 | |||||
| BDF2203 | 6.12 | C18 | |||||
| CLM1 | 6.176 | W15 | |||||
| GOODS3203 | 6.27 | C18 | |||||
| COSMOS20521 | 6.36 | C18 | |||||
| VR7 | 6.534 | This paper | |||||
| MASOSA | 6.543 | This paper | |||||
| UDS4821 | 6.56 | C18 | |||||
| Himiko | 6.595 | C18 | |||||
| CR7 | 6.604 | M17 | |||||
| COSMOS24108 | 6.629 | P16 | |||||
| UDS16291 | 6.638 | P16 | |||||
| NTTDF6345 | 6.701 | P16 | |||||
| RXJ13471216 | 6.765 | B17 | |||||
| COS-2987030247 | 6.807 | L17 | |||||
| SDF-46975 | 6.844 | M15 | |||||
| COS-3018555981 | 6.854 | S17 | |||||
| IOK-1 | 6.96 | O14 | |||||
| BDF-521 | 7.008 | M15 | |||||
| BDF-3299 | 7.109 | M15,C17 | |||||
| COSMOS13679 | 7.145 | P16 | |||||
| B14-65666 | 7.152 | B18,H18 | |||||
| SXDF-NB1006-2 | 7.212 | I16 |
References: B17 (Bradač et al., 2017); B18 (Bowler et al., 2018); C17 (Carniani et al., 2017); C18 (Carniani et al., 2018b); H18 (Hashimoto et al., 2018a); I16 (Inoue et al., 2016); K16 (Knudsen et al., 2016); L17 (Laporte et al., 2017); M15 (Maiolino et al., 2015); M17 (Matthee et al., 2017b); O14 (Ota et al., 2014); P16 (Pentericci et al., 2016); S17(Smit et al., 2018); W15 (Willott et al., 2015)
| ID | SFRUV/M⊙ yr-1 | L L⊙ | L L⊙ | SFRIR,Td=45K/M⊙ yr-1 |
|---|---|---|---|---|
| A383-5.1 | ||||
| NTTDF2313 | ||||
| WMH5 | ||||
| BDF2203 | ||||
| CLM1 | ||||
| GOODS3203 | ||||
| COSMOS20521 | ||||
| VR7 | ||||
| MASOSA | ||||
| UDS4821 | ||||
| Himiko | ||||
| CR7 | ||||
| COSMOS24108 | ||||
| UDS16291 | ||||
| NTTDF6345 | ||||
| RXJ13471216 | ||||
| COS-2987030247 | ||||
| SDF-46975 | ||||
| COS-3018555981 | ||||
| IOK-1 | ||||
| BDF-521 | ||||
| BDF-3299 | ||||
| COSMOS13679 | ||||
| B14-65666 | ||||
| SXDF-NB1006-2 |
| ID | L erg s-1 | EW0,Lyα/Å | /km s-1 |
|---|---|---|---|
| A383-5.1 | 7 | 138 | 9020 |
| NTTDF2313 | |||
| WMH5 | 13 | 26552 | |
| BDF2203 | 3 | ||
| CLM1 | 50 | 43069 | |
| GOODS3203 | 5 | ||
| COSMOS20521 | 3 | 10 | |
| VR7 | 24 | 34 | 21725 |
| MASOSA | 24 | 145 | |
| UDS4821 | 48 | ||
| Himiko | 43 | 65 | 14515 |
| CR7 | 83 | 211 | 16727 |
| COSMOS24108 | 10 | 27 | 2400 |
| UDS16291 | 0.8 | 6 | 1100 |
| NTTDF6345 | 4 | 15 | 1100 |
| RXJ13471216 | 6 | 26 | 2090 |
| COS-2987030247 | 5 | 16 | 32630 |
| SDF-46975 | 15 | 43 | |
| COS-3018555981 | |||
| IOK-1 | 42 | ||
| BDF-521 | 64 | ||
| BDF-3299 | 7 | 50 | 6410 |
| COSMOS13679 | 13 | 28 | 1350 |
| B14-65666 | 2.6 | 4 | 77245 |
| SXDF-NB1006-2 | 33 |
References
- Astropy Collaboration et al. (2013) Astropy Collaboration, et al. 2013, AAP, 558, A33
- Barisic et al. (2017) Barisic, I., et al. 2017, ApJ, 845, 41
- Behrens et al. (2018) Behrens, C., Pallottini, A., Ferrara, A., Gallerani, S., & Vallini, L. 2018, MNRAS, 477, 552
- Bertin (2010) Bertin, E. 2010, SWarp: Resampling and Co-adding FITS Images Together, Astrophysics Source Code Library, , , ascl:1010.068
- Bouwens et al. (2016a) Bouwens, R. J., Smit, R., Labbé, I., et al. 2016a, ApJ, 831, 176
- Bouwens et al. (2012) Bouwens, R. J., et al. 2012, ApJ, 754, 83
- Bouwens et al. (2015) —. 2015, ApJ, 803, 34
- Bouwens et al. (2016b) —. 2016b, ApJ, 833, 72
- Bowler et al. (2018) Bowler, R. A. A., Bourne, N., Dunlop, J. S., McLure, R. J., & McLeod, D. J. 2018, MNRAS, 481, 1631
- Bowler et al. (2017) Bowler, R. A. A., et al. 2017, MNRAS, 466, 3612
- Bradač et al. (2017) Bradač, M., et al. 2017, ApJL, 836, L2
- Capak et al. (2015) Capak, P. L., et al. 2015, Nature, 522, 455
- Carilli & Walter (2013) Carilli, C. L., & Walter, F. 2013, ARAA, 51, 105
- Carniani et al. (2018a) Carniani, S., Maiolino, R., Smit, R., & Amorín, R. 2018a, ApJL, 854, L7
- Carniani et al. (2017) Carniani, S., et al. 2017, AAP, 605, A42
- Carniani et al. (2018b) —. 2018b, MNRAS, 478, 1170
- Castellano et al. (2017) Castellano, M., et al. 2017, ApJ, 839, 73
- Cen & Kimm (2014) Cen, R., & Kimm, T. 2014, ApJ, 782, 32
- Cicone et al. (2015) Cicone, C., et al. 2015, AAP, 574, A14
- Cormier et al. (2019) Cormier, D., Abel, N. P., Hony, S., et al. 2019, arXiv e-prints, arXiv:1904.08434
- Curtis-Lake et al. (2012) Curtis-Lake, E., McLure, R. J., Pearce, H. J., et al. 2012, MNRAS, 422, 1425
- da Cunha et al. (2013) da Cunha, E., et al. 2013, ApJ, 766, 13
- De Looze et al. (2014) De Looze, I., et al. 2014, AAP, 568, A62
- Decarli et al. (2017) Decarli, R., et al. 2017, Nature, 545, 457
- D’Odorico et al. (2018) D’Odorico, V., et al. 2018, ApJL, 863, L29
- Erb et al. (2014) Erb, D. K., et al. 2014, ApJ, 795, 33
- Erwin (2015) Erwin, P. 2015, ApJ, 799, 226
- Faisst et al. (2017) Faisst, A. L., et al. 2017, ApJ, 847, 21
- Ferkinhoff et al. (2010) Ferkinhoff, C., Hailey-Dunsheath, S., Nikola, T., et al. 2010, ApJL, 714, L147
- Ferrara et al. (2017) Ferrara, A., Hirashita, H., Ouchi, M., & Fujimoto, S. 2017, MNRAS, 471, 5018
- Förster Schreiber et al. (2009) Förster Schreiber, N. M., et al. 2009, ApJ, 706, 1364
- Fujimoto et al. (2019) Fujimoto, S., Ouchi, M., Ferrara, A., et al. 2019, arXiv e-prints, arXiv:1902.06760
- Gil de Paz et al. (2007) Gil de Paz, A., et al. 2007, ApJS, 173, 185
- Harikane et al. (2018) Harikane, Y., et al. 2018, ApJ, 859, 84
- Hashimoto et al. (2017) Hashimoto, T., et al. 2017, MNRAS, 465, 1543
- Hashimoto et al. (2018a) —. 2018a, arXiv e-prints, arXiv:1806.00486
- Hashimoto et al. (2018b) —. 2018b, Nature, 557, 392
- Hemmati et al. (2017) Hemmati, S., Yan, L., Diaz-Santos, T., et al. 2017, ApJ, 834, 36
- Herrera-Camus et al. (2015) Herrera-Camus, R., et al. 2015, ApJ, 800, 1
- Hunter (2007) Hunter, J. D. 2007, Computing in Science and Engineering, 9, 90
- Inoue et al. (2016) Inoue, A. K., et al. 2016, Science, 352, 1559
- Jiang et al. (2013) Jiang, L., Bian, F., Fan, X., et al. 2013, ApJL, 771, L6
- Jones et al. (2001–) Jones, E., Oliphant, T., Peterson, P., et al. 2001–, SciPy: Open source scientific tools for Python, , . http://www.scipy.org/
- Jones et al. (2017) Jones, G. C., Willott, C. J., Carilli, C. L., et al. 2017, ApJ, 845, 175
- Kennicutt & Evans (2012) Kennicutt, R. C., & Evans, N. J. 2012, ARAA, 50, 531
- Kennicutt (1998) Kennicutt, Jr., R. C. 1998, ARAA, 36, 189
- Knudsen et al. (2016) Knudsen, K. K., Richard, J., Kneib, J.-P., et al. 2016, MNRAS, 462, L6
- Konno et al. (2018) Konno, A., et al. 2018, PASJ, 70, S16
- Laigle et al. (2016) Laigle, C., et al. 2016, ApJS, 224, 24
- Laporte et al. (2017) Laporte, N., et al. 2017, ApJL, 837, L21
- Le Fèvre et al. (2017) Le Fèvre, O., et al. 2017, arXiv e-prints, arXiv:1710.10715
- Maiolino et al. (2015) Maiolino, R., et al. 2015, MNRAS, 452, 54
- Maseda et al. (2017) Maseda, M. V., et al. 2017, AAP, 608, A4
- Matthee et al. (2017a) Matthee, J., Sobral, D., Darvish, B., et al. 2017a, MNRAS, 472, 772
- Matthee et al. (2018) Matthee, J., Sobral, D., Gronke, M., et al. 2018, AAP, 619, A136
- Matthee et al. (2016) Matthee, J., Sobral, D., Oteo, I., et al. 2016, MNRAS, 458, 449
- Matthee et al. (2015) Matthee, J., Sobral, D., Santos, S., et al. 2015, MNRAS, 451, 400
- Matthee et al. (2017b) Matthee, J., et al. 2017b, ApJ, 851, 145
- Meurer et al. (1999) Meurer, G. R., Heckman, T. M., & Calzetti, D. 1999, ApJ, 521, 64
- Nakajima et al. (2016) Nakajima, K., Ellis, R. S., Iwata, I., et al. 2016, ApJL, 831, L9
- Olsen et al. (2017) Olsen, K., Greve, T. R., Narayanan, D., et al. 2017, ApJ, 846, 105
- Ono et al. (2010) Ono, Y., Ouchi, M., Shimasaku, K., et al. 2010, ApJ, 724, 1524
- Ota et al. (2014) Ota, K., et al. 2014, ApJ, 792, 34
- Ouchi et al. (2013) Ouchi, M., et al. 2013, ApJ, 778, 102
- Pentericci et al. (2016) Pentericci, L., et al. 2016, ApJL, 829, L11
- Pineda et al. (2013) Pineda, J. L., Langer, W. D., Velusamy, T., & Goldsmith, P. F. 2013, AAP, 554, A103
- Raiter et al. (2010a) Raiter, A., Fosbury, R. A. E., & Teimoorinia, H. 2010a, AAP, 510, A109
- Raiter et al. (2010b) Raiter, A., Schaerer, D., & Fosbury, R. A. E. 2010b, AAP, 523, A64
- Reddy et al. (2018) Reddy, N. A., et al. 2018, ApJ, 853, 56
- Rémy-Ruyer et al. (2013) Rémy-Ruyer, A., et al. 2013, AAP, 557, A95
- Rémy-Ruyer et al. (2015) —. 2015, AAP, 582, A121
- Rigby et al. (2015) Rigby, J. R., Bayliss, M. B., Gladders, M. D., et al. 2015, ApJ, 814, L6
- Rybak et al. (2019) Rybak, M., et al. 2019, ApJ, 876, 112
- Salpeter (1955) Salpeter, E. E. 1955, ApJ, 121, 161
- Schaerer et al. (2015) Schaerer, D., Boone, F., Zamojski, M., et al. 2015, AAP, 574, A19
- Schaerer & de Barros (2009) Schaerer, D., & de Barros, S. 2009, AAP, 502, 423
- Shapley et al. (2003) Shapley, A. E., Steidel, C. C., Pettini, M., & Adelberger, K. L. 2003, ApJ, 588, 65
- Shibuya et al. (2015) Shibuya, T., Ouchi, M., & Harikane, Y. 2015, ApJS, 219, 15
- Shibuya et al. (2018) Shibuya, T., et al. 2018, PASJ, 70, S15
- Smit et al. (2018) Smit, R., Bouwens, R. J., et al. 2018, Nature, 553, 178
- Smit et al. (2014) Smit, R., et al. 2014, ApJ, 784, 58
- Sobral & Matthee (2019) Sobral, D., & Matthee, J. 2019, arXiv e-prints, arXiv:1803.08923
- Sobral et al. (2015) Sobral, D., Matthee, J., Darvish, B., et al. 2015, ApJ, 808, 139
- Sobral et al. (2018) Sobral, D., et al. 2018, MNRAS, 477, 2817
- Sobral et al. (2019) —. 2019, mnras, 482, 2422
- Stacey et al. (1991) Stacey, G. J., Geis, N., Genzel, R., et al. 1991, ApJ, 373, 423
- Stark et al. (2015) Stark, D. P., et al. 2015, MNRAS, 450, 1846
- Steinhardt et al. (2014) Steinhardt, C. L., et al. 2014, ApJL, 791, L25
- Stroe et al. (2017) Stroe, A., Sobral, D., Matthee, J., Calhau, J., & Oteo, I. 2017, MNRAS, 471, 2558
- Tamura et al. (2018) Tamura, Y., et al. 2018, arXiv e-prints, arXiv:1806.04132
- Taylor (2013) Taylor, M. 2013, Starlink User Note, 253
- Trainor et al. (2016) Trainor, R. F., Strom, A. L., Steidel, C. C., & Rudie, G. C. 2016, ApJ, 832, 171
- Vallini et al. (2017) Vallini, L., Ferrara, A., Pallottini, A., & Gallerani, S. 2017, MNRAS, 467, 1300
- Vallini et al. (2013) Vallini, L., Gallerani, S., Ferrara, A., & Baek, S. 2013, MNRAS, 433, 1567
- Vallini et al. (2015) Vallini, L., Gallerani, S., Ferrara, A., Pallottini, A., & Yue, B. 2015, ApJ, 813, 36
- Walter et al. (2018) Walter, F., et al. 2018, ApJL, 869, L22
- Wang et al. (2013) Wang, R., et al. 2013, ApJ, 773, 44
- Willott et al. (2015) Willott, C. J., Carilli, C. L., Wagg, J., & Wang, R. 2015, ApJ, 807, 180
- Wolfire et al. (2003) Wolfire, M. G., McKee, C. F., Hollenbach, D., & Tielens, A. G. G. M. 2003, ApJ, 587, 278