Triangle singularities in relevant to and
Abstract
and observed in by the Belle Collaboration are candidates of charged charmonium-like states that minimally include two quarks and two antiquarks. While and have been interpreted as tetraquark states previously, we propose a completely different scenario based on a kinematical effect called the triangle singularity. We demonstrate that the triangle singularities cause in the invariant mass distribution resonance-like bumps that fit very well the Belle data. If these bumps are simulated by the and resonance excitations, the spin-parity of them are predicted to be for and or for . The bump corresponding to has a highly asymmetric shape, which the Belle data exactly indicate. We show that the asymmetric shape originates from an interplay between the triangle singularity and the opening of the channel near the triangle-singularity energy. This characteristic lineshape could be used to discriminate different interpretations of . An interesting prediction from interpreting and as the triangle singularities is that similar bumps caused by the same mechanisms possibly appear also in data; the already observed corresponds to of .
I Introduction
and ( and in the Particle Data Group (PDG) notation pdg ) were observed in the Belle experiment as resonance-like structures in the invariant mass distribution of belle_z4050 111 We implicitly include the charge conjugate mode throughout. . It was not possible to determine the spin()-parity() of these states. The following analysis in the BaBar experiment babar_z4050 did not confirm them because the resonance-like signals were only barely discernible and insignificant. and are clearly candidates of charged charmonium-like states that minimally include four quarks and thus not belonging to the conventional quark model picture. In order to understand the QCD dynamics and its consequence in the non-perturbative regime, it is highly desirable to establish their existence with higher statistics data in the experimental side, and to clarify their identities such as tetraquark, hadron molecule, or kinematical effect in the theoretical side.
Previous theoretical interpretations of and are mainly categorized into tetraquark and hadron-molecule. Within the tetraquark picture: (1) a diquark-antidiquark state is [not] assigned to [] z4050_diquark1 ; (2) is described by a molecular-like tetraquark picture z4050_diquark2 ; (3) and are described with tetraquarks based on a color flux-tube model z4050_diquark3 ; (4) diquark-antidiquark state is not assigned to and using QCD sum rule (QCDSR) z4050_qcdsr1 ; (5) a tetraquark state is assigned to using QCDSR z4050_qcdsr2 . Meanwhile, within the hadron-molecule picture: (1) meson-exchange models disfavor hadron-molecule pictures for and z4050_molecule1 ; z4050_molecule2 ; z4050_molecule3 ; (2) molecule state is assigned to based on QCDSR z4050_qcdsr4 . For a more complete summary, see reviews review_chen ; review_raphael .
In this work, we propose a completely different interpretation of and . This is to associate and with triangle singularities (TS) landau ; coleman ; s-matrix , which is a kinematical effect, arising from triangle diagrams depicted in Figs. 1(a) and 1(b) (we refer to them as the triangle diagrams A and B hereafter), respectively. The diagrams consist of experimentally well-established hadrons including ( in the PDG). The TS can occur only when three particles in the loop go through a classically allowed kinematics (on-shell and collinear in the center-of-mass (CM) frame) at the same time, and can generate a resonance-like spectrum bump; see an illustrative discussion in Ref. TS-Pc2 for a mathematical detail. Applications of TS to phenomenology have become popular these days wu1 ; wu2 ; TS-Pc ; TS-Pc3 ; TS-Pc2 ; TS-a1 ; TS-a1-2 ; ts1 ; ts2 ; ts3 ; ts4 ; ts5 ; ts6 , such as explaining isospin violations in wu1 ; wu2 , and interpreting recently discovered hidden charm pentaquark TS-Pc ; TS-Pc3 ; TS-Pc2 and TS-a1 ; TS-a1-2 .
Recently we also applied TS ts_zc4430 to interpreting belle_z4430_2008 ; belle_z4430 ; lhcb_z4430 and belle_z4200 , charged charmonium-like state candidates, observed in and . We successfully explained their properties (, mass, width, Argand plot) extracted in the experiments. The presence [absence] of []-like contribution in lhcb_z4200_Lb was also explained in terms of the TS.
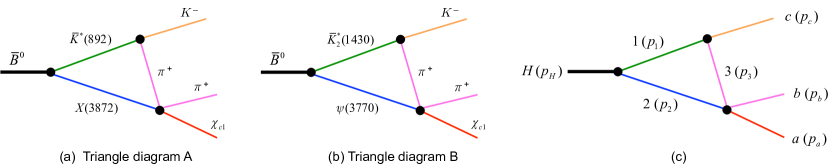
The present work shows that and can also be consistently interpreted as TS, provided the TS have experimentally detectable strengths. We demonstrate that the triangle diagram A [B] creates a []-like bump in the invariant mass () distribution of . Simulating the bumps with the and resonance excitations, and are predicted, respectively. The Breit-Wigner masses and widths fitted to the bumps agree very well with those of and from the Belle analysis belle_z4050 . The -like bump has a highly asymmetric shape as the Belle data exactly indicates. We clarify that the opening of the channel near the TS energy of GeV is responsible for it. This characteristic bump shape could discriminate different interpretations of . We point out that the triangle singularities for and could also generate similar bumps in ; the already observed corresponds to of .
II model
We calculate the decay amplitudes due to the triangle diagrams A and B of Fig. 1. A general formula for the decay amplitude is given by
| (1) | |||||
where we have used the particle labels and their momenta in Fig. 1(c). Spin states of the intermediate particles are implicitly summed. The total energy in the CM frame is denoted by , while the energy of a particle is with the mass , momentum , and width ; only for unstable intermediate particles 1 and 2. We use the mass and width values of the PDG average pdg . Because has a very small width ( MeV), we set it to zero in calculations.
The pion-charmonium interaction is denoted by in Eq. (1). The particles 2 is either [] or , the particle is , and the particles 3 and are pions. In calculating the triangle diagram A, we use an -wave interaction:
| (2) |
where polarization vectors for the particles and 2 are denoted by and , respectively. The quantities and are form factors that will be defined in Eq. (6); the momentum of the particle in the -CM frame is denoted by and . This interaction leaves an -wave pair in the final state. Therefore, if a spectrum bump is created by the triangle diagram A in the distribution and is simulated by a resonance-excitation, the resonance has .
Regarding for the triangle diagram B, where the intrinsic parity is different between the incoming and outgoing states, we use
| (3) |
which converts -wave into -wave . A resonance that simulates a spectrum bump from the triangle diagram B has . In Eqs. (2) and (3), the incoming 23-pair is in -wave and can create a sharp TS bump, being free from the centrifugal barrier. For the triangle diagram B, however, we also examine an interaction of -wave going to -wave because the threshold is rather below the TS energy ( GeV) and the centrifugal barrier would not be so effective. Such an interaction is
| (4) |
and the pair seems to be from a resonance.
The vertex function, in Eq. (1), is given by
| (5) | |||||
with being spherical harmonics. Clebsch-Gordan coefficients are in which the spin of a particle is denoted by and its -component . We use the form factor in the form of
| (6) |
which is parametrized with a coupling and a cutoff . For the and interactions, a nonzero value of is allowed for only one set of . While the actual values of for the processes can be determined using the and decay widths, experimental and Lattice QCD inputs are currently missing to determine the couplings for the interactions. Experimentally, has not yet been seen x3872_decay , perhaps because has a very small width and the phase-space for this final state is small; is not kinematically allowed. Here we assume that these couplings are strong enough and set them arbitrary.
Regarding the weak vertices for the decays, is allowed for several sets of but their values are currently difficult to estimate due to the lack of data. However, the details of these vertices would not be crucial in this work because the main conclusions are essentially determined by the kinematical effects once the structure of is fixed as Eqs. (2)-(4). Thus we assume simple structures and detectable strengths. We set only for (exception: when using Eq. (4)) and the lowest allowed ; for the other . We use the cutoff GeV in Eq. (6) throughout unless otherwise stated.
The interactions of Eqs. (2)-(5), evaluated in the CM frame of the two-body subsystem, are further multiplied by kinematical factors to account for the Lorentz transformation to the total three-body CM frame; see Appendix C of Ref. 3pi . The Dalitz plot distribution for is calculated with of Eq. (1) following the procedure detailed in Appendix B of Ref. 3pi .
III results
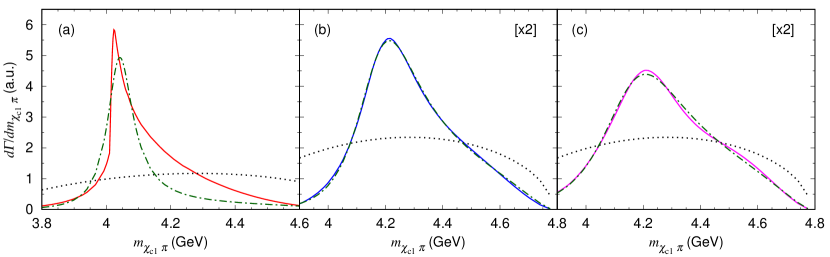
In Fig. 2, we present the invariant mass distributions for . The triangle diagram A [B] gives the red [blue and magenta] solid curve in Fig. 2(a) [2(b) and 2(c)]. We also show the phase-space distributions (black dotted curves). The triangle singularity creates clear resonance-like peaks at GeV in panel (a) and GeV in panels (b) and (c). It is interesting to observe in Fig. 2(a) that the bump has a significantly asymmetric shape.
We examine how the spectrum shapes shown in Fig. 2 depend on the cutoff of the form factor in Eq. (6). In Fig. 3, the spectrum shapes calculated with 1, 1.5, and 2 GeV are shown. The resonance-like peak structures due to the kinematical singularities are clearly stable over the reasonable cutoff range. In particular, the peak positions of the spectra from the triangle diagram A are, as in Fig. 3(a), almost the same; the width is somewhat broadened as increases. The peak position and width of the spectrum from the triangle diagram B are more dependent on . This would be related to the fact that the unstable particles in the triangle diagram B have wider widths than those in the triangle diagram A, thereby pushing the exact TS further away from the physical region.
Now we simulate the spectra using the conventional resonance-excitation mechanisms, and determine the masses and widths of the fake resonances. The Dalitz plot distributions from the triangle diagrams A and B are fitted with the mechanism of followed by . The Breit-Wigner form of Ref. belle_z4430 is used for the propagation. This -excitation mechanism includes fitting parameters such as the Breit-Wigner mass, width, and also the cutoff in Eq. (6) that describes the vertices. The kinematical region included in the fit covers the Dalitz plot distribution larger than 10% of the peak height. The obtained fits are shown by the green dash-dotted curves in Fig. 2. The highly asymmetric bump, the red solid curve in Fig. 2(a), is not well fitted with the Breit-Wigner form, while the bumps in Figs. 2(b) and 2(c) are reasonably fitted.
| Fig. 1(a) | Belle belle_z4050 | Fig. 1(b) | Belle belle_z4050 | |
|---|---|---|---|---|
We generate the Dalitz plot distributions for , and 2 GeV as in Fig. 3, fit them as described above, and present the resulting ranges of the Breit-Wigner parameters in Table 1 along with those of and from the Belle analysis belle_z4050 . The agreement is quite good for . Meanwhile, the mass and width from the Belle analysis have rather large errors, and thus our results for both assignments easily agree with them.
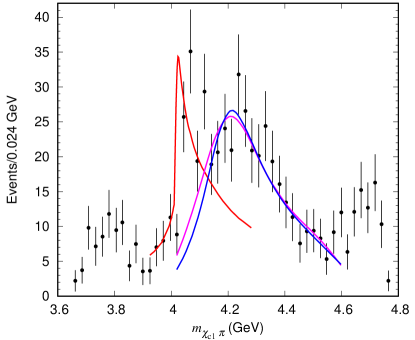
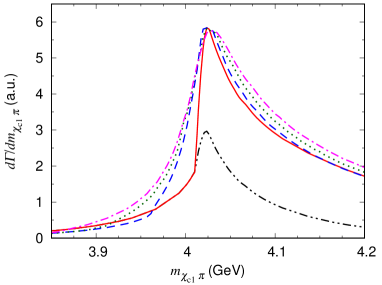
Let us superimpose the spectra from the triangle diagrams A and B on the Belle data (Fig. 14 of Ref. belle_z4050 ) as shown in Fig. 4. Although this is a qualitative comparison where any interferences among different mechanisms are not taken into account, the spectrum bumps from the triangle diagrams capture characteristic features of the data. In particular, the asymmetric shape from the triangle diagram A, which has a very sharp rise and a moderate fall-off, is exactly what the data show. In the Belle analysis belle_z4050 where the Breit-Wigner form was used to simulate this bump, their model does not seem to fit this sharp peak of the data very well, as seen in Fig. 14 of the reference, perhaps because the Breit-Wigner shape is not what the data call for. As seen in Fig. 2(a), the spectrum shape from the triangle diagram A is significantly different from the Breit-Wigner.
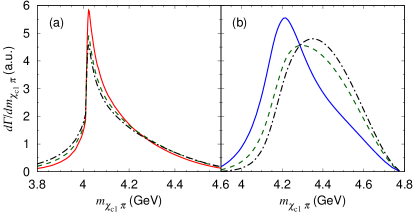
It would be worthwhile to address how this peculiar asymmetric shape comes about from the triangle diagram A. By closely observing the spectrum shown in Fig. 2(a) or an enlarged one shown by the red solid curve in Fig. 5, the sharp rise of the spectrum starts from an abrupt bend at GeV where the channel opens. This implies that the sharp rise is assisted by the opening of the channel. We indeed confirm this idea, as shown by the black dash-two-dotted curve in Fig. 5, by turning off the on-shell contribution arising from in the denominator of Eq. (1).
The proximity of the threshold to the TS energy ( GeV) is also important to create the large asymmetry. To see this, we change the and masses to lower the threshold while keeping the spectrum peak position almost the same. We use, in unit of MeV, =(3822, 1084), (3772, 1218), and (3722, 1330) to lower the threshold by 50, 100, and 150 MeV, respectively. The spectra calculated with these altered masses, presented in Fig. 5, show that the rise of the bump becomes significantly more moderate as the threshold is lowered. In this way, the -bump shape observed in the Belle data is explained with well-founded physics, TS and the channel opening near the TS energy, included in the triangle diagram A.
The asymmetric -bump shape could sensitively discriminate different interpretations of . A compelling model should explain not only the mass, width, and of , but also its characteristic spectrum shape. So far, only our model has successfully addressed this question. It is also highly desirable to establish the spectrum shape with higher statistics data, considering that the Belle data still have large error bars.
It would be interesting to discuss the possibility of finding and -like bumps in other processes. We point out that, actually, the ()-like bump in and the -like bump in belle_z4200 ; lhcb_z4200 can be created by the same TS ts_zc4430 from the triangle diagram B and thus are very similar. Meanwhile, if the -like bump in the data is generated by the triangle diagram A, the same diagram but replaced by should contribute to because the coupling is known to exist. We calculated the -like spectrum for using the modified triangle diagram A; the pion-charmonium interaction is now given by Eq. (3). The spectrum looks almost the same as the red solid curve of Fig. 2(a). While a -like bump has not yet been observed in belle_z4200 ; lhcb_z4200 , the quality of the current data still leaves a possibility of finding it in the spectrum data of higher statistics. Although the possibility certainly depends on competitions with other mechanisms, this is an interesting prediction from the TS-based interpretation of the bump.
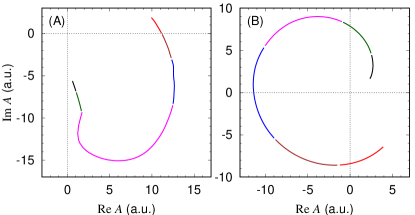
Finally, we present Argand plots from the triangle diagrams A and B; we use Eq. (3) for the diagram B. Because () and are relatively in -wave, the angle-independent part of the amplitude is:
| (7) |
with and 1 for the diagrams A and B, respectively; is the -component of the spin and the invariant mass. See Eq. (B3) of Ref. 3pi for the relation between the invariant amplitude and of Eq. (1). is shown in Fig. 6 as Argand plots. Both the triangle diagrams A and B create counterclockwise behaviors, seemingly similar to resonances.
IV conclusion
We demonstrated that triangle singularities (TS) from the triangle diagrams of Figs. 1(a) and 1(b) cause the bumps in the invariant mass distribution of , and that their positions and shapes, and thus Breit-Wigner parameters fitted to the bumps, agree very well with those found and named as and in the Belle experiment belle_z4050 . Within the resonance-based simulation of these bumps, is predicted for and or for . The highly asymmetric shape of -like bump found by the Belle is well reproduced by our model; the opening of the channel near the TS energy causes the abrupt increase of the spectrum. This characteristic lineshape, which could discriminate different interpretations of , is yet to be accounted for by any other hadron structure models. We also discussed the possibility of finding bumps, caused by the same TS for and , in ; found in can be identified with of . The kinematic effects, TS and the channel opening, essentially determine the shape and position of the spectrum bumps, once the spin-parity of the system is specified by Eqs. (2)-(4); the uncertainty of the remaining dynamical details would not largely change the presented results.
Acknowledgements.
This work is in part supported by National Natural Science Foundation of China (NSFC) under contracts 11625523.References
- (1) M. Tanabashi et al. (Particle Data Group), Phys. Rev. D 98, 030001 (2018).
- (2) R. Mizuk et al. (Belle Collaboration), Phys. Rev. D 78, 072004 (2008).
- (3) J.P. Lees et al. (BaBar Collaboration), Phys. Rev. D 85, 052003 (2012).
- (4) D. Ebert, R.N. Faustov, and V.O. Galkin, Eur. Phys. J. C 58, 399 (2008).
- (5) S. Patel, M. Shah, and P.C. Vinodkumar, Eur. Phys. J. A 50, 131 (2014).
- (6) C. Deng, J. Ping, H. Huang, and F. Wang, Phys. Rev. D 92, 034027 (2015).
- (7) Z.-G. Wang, Commun. Theor. Phys. 63, 466 (2015).
- (8) Z.-G. Wang, Eur. Phys. J. C 62, 375 (2009).
- (9) X. Liu, Z.-G. Luo, Y.-R. Liu, and S.-L. Zhu, Eur. Phys. J. C 61, 411 (2009).
- (10) Y.-R. Liu and Z.-Y. Zhang, Phys. Rev. C 80, 015208 (2009).
- (11) G.-J. Ding, Phys. Rev. D 79, 014001 (2009).
- (12) S.H. Lee, K. Morita, and M. Nielsen, Phys. Rev. D 78, 076001 (2008).
- (13) H.-X. Chen, W. Chen, X. Liu, and S.-L. Zhu, Phys. Rep. 639, 1 (2016).
- (14) R.M. Albuquerque, J.M. Dias, K.P. Khemchandani, A. Martinez Torres, F.S. Navarra, M. Nielsen, and C.M. Zanetti, arXiv:1812.08207 [hep-ph].
- (15) L.D. Landau, Nucl. Phys. 13, 181 (1959).
- (16) S. Coleman and R.E. Norton, Nuovo Cim. 38, 438 (1965).
- (17) R. J. Eden, P. V. Landshoff, D. I. Olive and J. C. Polkinghorne, The Analytic S-Matrix, (Cambridge University Press, Cambridge, England, 1966).
- (18) M. Bayar, F. Aceti, F.-K. Guo, and E. Oset, Phys. Rev. D 94, 074039 (2016).
- (19) J.-J. Wu, X.-H. Liu, Q. Zhao, and B.-S. Zou, Phys. Rev. Lett. 108, 081803 (2012).
- (20) F. Aceti, W.H. Liang, E. Oset, J.J. Wu, and B.S. Zou, Phys.Rev. D 86, 114007 (2012).
- (21) F.-K. Guo, U.-G. Meißner, W. Wang, and Z. Yang, Phys. Rev. D 92, 071502 (2015).
- (22) X.-H. Liu, Q. Wang, and Q. Zhao, Phys. Lett. B757, 231 (2016).
- (23) M. Mikhasenko, B. Ketzer, and A. Sarantsev, Phys. Rev. D 91, 094015 (2015).
- (24) F. Aceti, L.R. Dai, and E. Oset, Phys. Rev. D 94, 096015 (2016).
- (25) S. Sakai, E. Oset and W.H. Liang, Phys. Rev. D 96, 074025 (2017).
- (26) X.H. Liu and U.-G. Meißner, Eur. Phys. J. C 77, 816 (2017).
- (27) S. Sakai, E. Oset and A. Ramos, Eur. Phys. J. A 54, 10 (2018).
- (28) L.R. Dai, R. Pavao, S. Sakai and E. Oset, Phys. Rev. D 97, 116004 (2018).
- (29) Z. Cao and Q. Zhao, Phys. Rev. D 99, 014016 (2019).
- (30) J.J. Xie and F.K. Guo, Phys. Lett. B 774, 108 (2017).
- (31) S.X. Nakamura and K. Tsushima, arXiv:1901.07385.
- (32) S.K. Choi et al. (Belle Collaboration), Phys. Rev. Lett. 100, 142001 (2008).
- (33) K. Chilikin et al. (Belle Collaboration), Phys. Rev. D 88, 074026 (2013).
- (34) R. Aaij et al. (LHCb Collaboration), Phys. Rev. Lett. 112, 222002 (2014).
- (35) K. Chilikin et al. (Belle Collaboration), Phys. Rev. D 90, 112009 (2014).
- (36) R. Aaij et al. (LHCb Collaboration), Phys. Rev. Lett. 117, 082003 (2016).
- (37) V. Bhardwaj et al. (Belle Collaboration), Phys. Rev. D 93, 052016 (2016).
- (38) H. Kamano, S.X. Nakamura, T.-S.H. Lee, and T. Sato, Phys. Rev. D 84, 114019 (2011).
- (39) R. Aaij et al. (LHCb collaboration), Phys. Rev. Lett. 122, 152002 (2019).