Fermi-LAT Observations of Extreme Spectral Variability in IC 310
Abstract
We investigate the physical mechanisms of high-energy gamma-ray emission from the TeV-emitting misaligned active galactic nucleus IC 310. Eight years of data from the Fermi Large Area Telescope (Fermi-LAT) between 100 MeV and 500 GeV are reduced and analysed to study the temporal and spectral characteristics of IC 310. Point spread function-partitioned instrument response functions are used to improve the resolvability of IC 310 from nearby NGC 1275. Systematic effects due to this choice of instrument response functions and the proximity of NGC 1275 are investigated. We find strong spectral variability and detect the hard flaring state of IC 310 along with a previously undiscovered soft state in quiescent periods, and the first detection with Fermi-LAT below 1 GeV. This represents a shift in peak Compton energy of more than five orders of magnitude. Possible interpretations are discussed, but we lack the instantaneous sensitivity with Fermi to probe the underlying physics.
keywords:
galaxies: active – BL Lacertae objects: individual: IC 3101 Introduction
The active galaxy IC 310 has shown substantial flux variability from GeV to TeV energies on time-scales around of its central black hole’s radius (Aleksić et al., 2014b). First detected at TeV energies during a MAGIC study of nearby NGC 1275 (Mariotti, 2010; Aleksić et al., 2010), IC 310 is a strong probe of the gamma-ray emission processes around galaxy cores.
Originally classified as a head-tail radio galaxy from its radio morphology (Sijbring & de Bruyn, 1998), more recent observations with the European VLBI Network have shown blazar-like characteristics in the inner jet. Schulz et al. (2015) used the absence of a detectable counter-jet to place an upper limit of on the viewing angle. Small angles are also ruled out to constrain the deprojected length of the jet. Its intermediate jet angle has led to IC 310’s classification as a radio galaxy along with M87, Centaurus A and NGC 1275 in Fermi-LAT source catalogues (Nolan et al., 2012; Acero et al., 2015; Gasparrini et al., 2015), all of which are also Very High Energy (VHE; GeV) emitters.
Neronov et al. (2010) confirmed the presence of IC 310’s emission above 100 GeV using two years of Fermi Large Area Telescope (Fermi-LAT) data. During VHE outbursts in October 2009 and February 2010, the Fermi-LAT detector in conjunction with uncontemporaneous X-ray observations constrained IC 310’s broadband spectral energy distribution (SED) (Aleksić et al., 2014b). These X-ray observations found substantial spectral variability, with the X-ray spectral index ranging from 1.76 to 2.55 throughout piecemeal observations over 4 years (Aleksić et al., 2014b). Given the hard emission at TeV energies and above, IC 310 has now been re-classified as an AGN of unknown type Rieger & Levinson (2018), with the synchrotron component peaking in the X-ray regime (though not directly observed). The peak of the VHE emission was not found within the energy regime measured by MAGIC (when EBL deabsorbed) in either the high- or low-activity state by Aleksić et al. (2014b), a difference characterised by an order of magnitude in flux. With additional MAGIC observations outside of the flaring period, Ahnen et al. (2017) found a softer state as yet undetected with Fermi-LAT.
Spectral variability within AGN has been observed at X-ray (Sobolewska & Papadakis, 2009) and gamma-ray wavelengths (Abdo et al., 2010b, section 4.2). During AGN flaring periods a strong correlation between spectral hardness and flux is often observed, commonly referred to as ‘harder when brighter’ behaviour (e.g. Brown & Adams, 2011). This spectral variability can be explained in simple homogeneous acceleration and cooling scenarios as shown by Kirk et al. (1998).
IC 310’s broadband spectral energy distribution (SED) has been modelled to some success using synchrotron self-Compton (SSC) models at varying assumed jet viewing angles. Ahnen et al. (2017) found that a single-zone SSC model could not explain the TeV flare due to Klein-Nishina suppression at such high energies. It also found that the second hump’s peak had moved more than two orders of magnitude in energy during the TeV flaring period. Further modelling with multi-zone leptonic SSC models and hadronic components suggests that purely leptonic models may be disfavoured, as they require minimum Lorentz factors greater than (Fraija et al., 2017).
In this paper we take advantage of the improvements in effective area and angular resolution afforded by Fermi’s PASS 8 data to investigate IC 310’s gamma-ray properties. In particular, we analyse the first eight years of Fermi-LAT observations, utilising an improved point spread function (PSF) and updated analysis tools. Section 2 describes the data selected for our analysis. We found that several checks for systematic effects caused by our assumptions and reliance on the third Fermi point source catalog (3FGL, Acero et al. (2015)) were required, which are performed in Sect. 3 and Sect. 4. We discuss the ramifications of such a model in Sect. 5 and present our conclusions in Sect. 6.
2 Data Reduction
| Point Source | RA (J2000) | Dec. (J2000) | Offset | TS |
|---|---|---|---|---|
| (degrees) | (degrees) | (degrees) | ||
| PS J0312.8+4121 | 48.21 | 41.35 | 0.716 | 42.07 |
| PS J0355.3+3910 | 58.82 | 39.16 | 7.680 | 39.79 |
| PS J0302.5+3353 | 45.63 | 33.88 | 7.958 | 51.36 |
| PS J0257.1+3360 | 44.28 | 33.99 | 8.289 | 30.12 |
| PS J0344.6+3433 | 56.15 | 34.55 | 8.725 | 36.32 |
| PS J0233.0+3740 | 38.25 | 37.66 | 9.181 | 40.86 |
| PS J0410.7+4218 | 62.68 | 42.30 | 10.107 | 74.66 |
| PS J0344.2+3202 | 56.04 | 32.04 | 10.795 | 34.55 |
| PS J0359.4+5052 | 59.86 | 50.87 | 12.055 | 359.99 |
Approximately eight years of Fermi-LAT data from 2008-08-04 15:43:38 UTC until 2016-08-08 06:01:06 UTC (239557417 to 492328870 MET) are used in this analysis. All analysis was performed using version v10r0p5 of the Fermi-LAT Science Tools, with P8R2 events and instrument response functions (IRFs). The region radially surrounding IC 310 (RA, Dec (J2000): 49.16458∘, 41.32947∘) was extracted from the Fermi-LAT data server with energies in the range MeV–GeV. The size of this region ensures that low-energy photons from nearby sources were entirely contained within the region of interest (ROI). We performed a standard binned Fermi-LAT analysis using the python tool fermipy111http://fermipy.readthedocs.io/en/latest/, keeping all photons with event class SOURCE or better (evclass=128). A zenith cut was applied along with the time selection filter (DATA_QUAL>0)&&(LAT_CONFIG==1). The energy range is split into 10 logarithmically spaced bins per decade for analysis.
The PSF event types (evtype=4,8,16,32) were used to apply the appropriate IRF and isotropic background model to the data according to their PSF reconstruction quality. It was decided to work with the PSF IRFs and a summed likelihood method due to the proximity of IC 310 to NGC 1275, a bright gamma-ray source only away. These IRFs provide a far better ability to discriminate between photons originating from NGC 1275 and IC 310 but result in an increased systematic error on the effective area of the LAT ( as opposed to when using the FRONT and BACK event types at the highest energies).
We use the standard definition of the likelihood ratio test statistic (TS) to assess the significance of a source:
| (1) |
where and are the maximum likelihood of the best-fit sky model with and without the source in question. This statistic is approximately distributed as a when only the normalisation of the source is left to vary using an assumed power-law spectrum (Mattox et al., 1996). For all values quoted in this paper, we assume that this approximate distribution is correct and thus use the simplification that a model is preferred to where unless specified otherwise. Particular care was taken to refit the normalisation of NGC 1275 when evaluating the TS of IC 310 as its proximity caused a substantial systematic error if this was neglected (as might be introduced when naïvely using the Ts function within the Fermi-LAT python tools).
The 4-year Fermi-LAT point source catalog (3FGL, Acero et al. (2015)) was used to seed a preliminary sky model along with the galactic diffuse model gll_iem_v06.fits and the appropriate isotropic diffuse model of the form iso_P8R2_SOURCE_V6_PSF(x)_v06.txt, where x denotes the PSF classes 0 to 3, before examining the residual map for undetected point sources. The analysis itself was performed using the fermipy routine optimize followed by the deletion of weak (TS ) sources from the sky model and refitting of bright (TS ) sources. The shape parameters of all bright sources are allowed to vary except that of IC 310, which is kept fixed to its 3FGL shape. In addition to the detailed analysis of IC 310 and NGC 1275 presented in this paper, nine new sources with were discovered within the ROI using an iterative TS map peak finding technique. Their properties are listed in Table 1.
Power law and log parabolas are used as phenomenological spectral models to perform the maximum likelihood fit as a function of energy in this work. The power law model is defined as:
| (2) |
where is the overall normalisation factor to scale the observed brightness of a source, is a scale energy (held fixed at its 3FGL value), and is the power law index controlling the hardness of the source. Similarly, the log parabola model:
| (3) |
has an overall normalisation factor () and fixed scale energy (), but the spectral scaling contains an energy dependent term along with an energy-independent term .
3 Results
3.1 IC 310
Using the 3FGL spectral parameters of IC 310, we find the source is detected with a TS of 64.4 ( with 1 degree of freedom) between 100 MeV and 500 GeV. When allowing the index of IC 310 to vary, the spectral index softens significantly (2.34)to from the 3FGL value of (before the background is investigated further). By comparing the when allowing the index to vary, we find that the softer index is preferred with , which corresponds to a superior fit to the data with a preference of . This softer spectrum contrasts with the previous spectral studies of IC 310 Neronov et al. (2010), though we use an expanded data set.
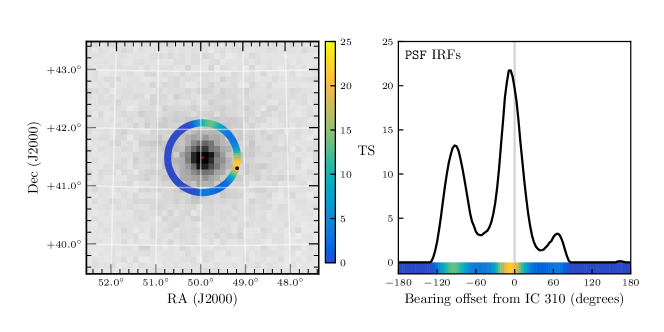
Given that we are observing significant low-energy emission from IC 310 with a bright source with strong spectral curvature only away, the model of IC 310 may be attributing some of NGC 1275’s emission to itself at low energies. The PSF of the Fermi-LAT instrument is on the order of at MeV. To investigate this possibility, in Figure 1 we test the TS at 120 positionings at various bearings from NGC 1275 on a circle with radius around the 3FGL position of NGC 1275 (corresponding to a change of in bearing between each test point). We constrain the energy range for this analysis to ensure all signal is associated with the low-energy behaviour. We choose a lower energy bound of 578.5 MeV by calculating the 95% containment region on PSF3 class photons calculated for our ROI using the gtpsf tool, and choose 3 GeV as the upper energy bound as the approximate upturn of the SED found in Section 2. We find a very strong peak (TS=21.73) in the direction of IC 310, along with two smaller peaks (TS = 13.2 and 3.3) at approximately (RA, Dec): (49.403∘, 41.948∘) and (50.279∘, 40.964∘) respectively. While this strong peak can be interpreted as the low-energy emission of a quiescent IC 310, the provenance of the two weak peaks is unclear. Given their angular offset (slightly less than ) and the fact that extended emission has been observed in the radio galaxies Centaurus A and Fornax A (Abdo et al., 2010a; Ackermann et al., 2016), we investigate the prospect of extended emission in Sect. 4.1. Dark matter present in the Perseus cluster could cause some extended emission, but the peaked nature of this emission contrasts with the large-scale smooth emission expected from DM annihilation in galaxy clusters (see e.g. Han et al., 2012, Fig. 1).
3.2 Integrated spectral energy distribution
| Name | Model | TS | Signif. | AIC | ||
|---|---|---|---|---|---|---|
| A | IC 310 Catalog Index | 1886808.45 | 0 | - | - | - |
| B | IC 310 Power Law (PL) | 1886805.72 | 1 | 5.47 | 2.34 | -3.46 |
| C | IC 310 Log Parabola (LP) | 1886798.19 | 2 | 20.52 | 4.14 | -16.52 |
| D | IC 310 (PL) + PS (PL, Index=2.0) | 1886791.06 | 4 | 34.79 | 5.02 | -26.78 |
| E | IC 310 (PL) + PS (PL, Index Free) | 1886789.63 | 5 | 37.66 | 5.05 | -27.64 |
| F | IC 310 (LP) + PS (PL, Index=2.0) | 1886784.43 | 5 | 48.04 | 5.91 | -38.04 |
| G | IC 310 (LP) + PS (PL, Index Free) | 1886784.20 | 6 | 48.50 | 5.74 | -36.5 |
Due to the proximity of the source PS J0312.8+4121, we optimise a series of different models that could fit the emission in the surrounding region of IC 310. By inspecting the SED of IC 310 one discovers an upturn at low energies. In fact, this so heavily weights the SED that, when freed, the best-fit index has a value of . Given that IC 310 is a TeV-emitting source this would be very unusual, though spectral hardenings towards the high end of the Fermi-LAT energy range are not unheard of (see Brown et al., 2017). MAGIC measured its spectrum consistently emitting with an index of -1.9 over several nights, and hardening to -1.3 during its brightest flare (Eisenacher Glawion et al., 2015). We thus consider a log parabolic model which finds a negatively curved spectrum with a of 20.52 when compared with the catalogue index (with varying normalisation), and when compared to the softer index. In each case, the scale energy of the log parabola was kept fixed at the lower end of the observed energy range as recommended by Massaro et al. (2004).
We provide a comparison of a set of feasible hypotheses in Table 2.
The models considered are as follows:
-
•
Model A: The model for IC 310 is a power law with the index fixed to its 3FGL value. This serves as the reference model for our work compared to the null hypothesis, which in this case is the 3FGL.
-
•
Model B: The spectral index parameter for IC 310 is varied in addition to its normalisation.
-
•
Model C: Spectral curvature is introduced by substituting a log parabola spectral model for the power law description of IC 310. These models are nested and so can provide a direct comparison. The between models C and B is the as defined in the 2FGL (Nolan et al., 2012), though distinct from Signif_Curve as we do not take into account systematic uncertainties.
-
•
Model D: We now add the point source PS J0312.8+4121 to model B. The spectral model is assumed to be a power law with spectral index 2.0. In this model, we have also allowed the spectral index of IC 310 to vary. This results in 4 additional degrees of freedom from model A, namely the spectral index of IC 310, and the normalisation and position (RA and Dec.) of PS J0312.8+4121. The 3 parameters associated with PS J0312.8+4121 are not nested (there is a degeneracy when the normalisation of the source is zero), however, assuming the calibration performed by Mattox et al. (1996) persists, all significance test values remain accurate.
-
•
Model E: The spectral index of PS J0312.8+4121 is allowed to vary from model D. The additional free parameters are now the two spectral indices, and the normalisation and position of PS J0312.8+4121.
-
•
Model F: IC 310 is now replaced with the log parabola spectral model from model C, along with a fixed power law spectral model for PS J0312.8+4121 as in model D.
-
•
Model G: The spectral index of PS J0312.8+4121 in model E is now allowed to vary. This was the first additional parameter that did not result in an overall increase in significance.
It should be noted that only models (A, B, C) and (D, E, F, G) are truly comparable in terms of . This is because the position was not optimised in each case for models D, E, F, and G. As the parameter was not truly free, the different TS values are only approximations. As the models may not be fully optimised, the TS may be lower than the fully optimised values. We can at least be assured that the optimal value would result in larger TS values, not smaller ones (when directly compared to model D). Comparisons between models E, F, and G assume the position of PS J0312.8+4121, and may be larger or smaller when the position is minimised (unlike comparisons with model D), as the relative changes in are not calculated.
The summary in Table 2 shows model F to be the most likely model given the observed data. In each case the sky model was optimised and the log likelihood extracted. Each additional degree of freedom must decrease the by 1.0 to improve the significance, the relationship defining the Akaike Information Criterion (AIC, Akaike, 1974). We also include the AIC as an independent test of significance assuming that approximate nesting is insufficient. The significance (in units of ) is calculated as:
| (4) |
where erf-1 is the inverse error function, is the cumulative distribution function of a -distributed statistic at a value of with degrees of freedom, and refers to one standard deviation of a normal distribution.
The AIC is defined as:
| (5) |
where is the number of degrees of freedom in the model, and is defined as above. The model with the minimum AIC value is the preferred model. Appendix Fermi-LAT Observations of Extreme Spectral Variability in IC 310 contains the optimised spectral parameter values for each model tested in this Section.
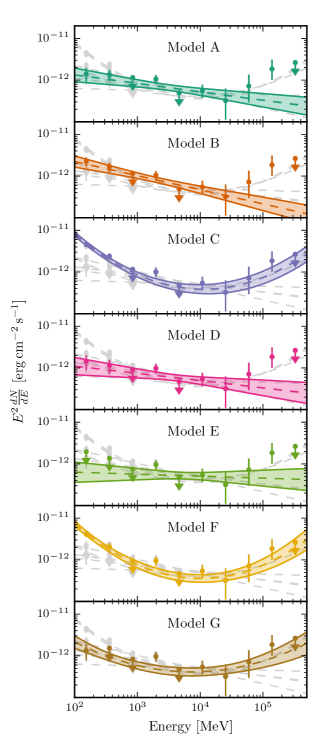
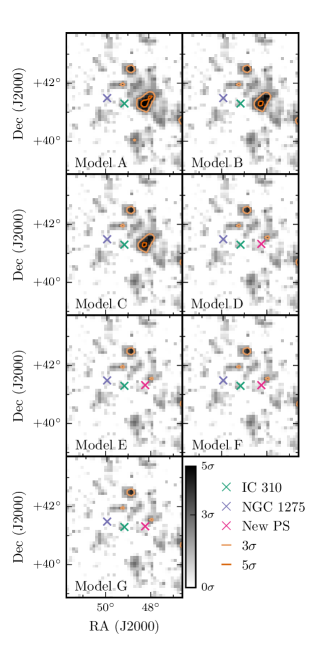
The best-fit model (both when assuming nesting and the AIC) is shown to be that with IC 310 with negative , preferred by 3 over a power law with index 2.01. In all cases, a negatively-curved spectrum is preferred for IC 310 over any models without such curvature. Curvature in IC 310 is preferred to a softer spectrum of PS J0312.8+4121 by calculating the difference between models D and E, and models F and E. It should be noted that with its index left to vary, PS J0312.8+4121 does not achieve 5 significance (a TS of 28.744) with 2 degrees of freedom between models G and C. Due to these facts, and the overall significance of each model, we find that model F allows the greatest overall significance given the number of parameters introduced. Freeing the index of PS J0312.8+4121 between models F and G is shown to be overfitting, reducing the overall significance of the model in both statistical metrics. The SED of IC 310 given each model is shown in Figure 2. Similarly, we plot the TS map of the ROI for each of the models discussed in this Section in Figure 3, which shows a convincing case for localised excess emission in the region of PS J0312.8+4121, and thus the necessity of including this source in our models.
3.3 Temporal Evolution
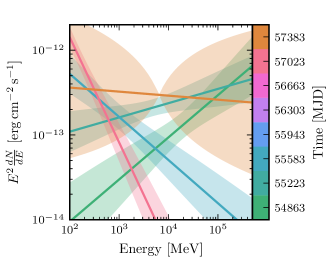
IC 310 is highly variable, not just in terms of flux, but also spectrally. This was noted by Ahnen et al. (2017) at VHE energies, but this should also be the case within the Fermi-LAT energy range. To establish the temporal effects of integrating over quiescent and flaring periods observed by MAGIC, we can break the SED from Sect. 2 down into smaller time periods. Using 360-day bins, we re-fit Model E from Sect. 3.2 to the data. This model was used in preference to Model F, as in only two of the eight time bins was Model F preferred to Model E at the 3 level. We plot these SEDs in Figure 4, which clearly shows the variation in power-law index with time. Once again, close attention was paid to ensure that NGC 1275 and PS J0312.8+4121 are jointly optimised with IC 310. The parameter space is quite broad and some bins show only upper limits in flux. While the parameter space investigated is not large enough to fully encompass some of the time bins, it does show that in several periods IC 310 is incompatible with the harder emission previously detected.
3.4 Investigating the spectral parameter space
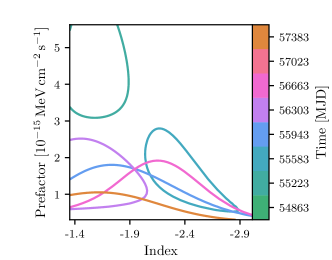
If we want to compare the spectra in each bin, it is more useful to look at a grid scan of the two spectral parameters in each case. This is performed by exhaustively calculating the likelihood given all combinations of parameter values. The parameter space plotted in Figure 5, which shows a strong separation between hard and soft states. The limits on the parameter space grid scan were prescribed as half the minimum value of the parameter in the integrated fit and double the maximum value of the parameter in the integrated fit. In each case, the parameter value is set within the pyLikelihood instance of our total model fit and the ROI accordingly optimised with background sources free. This variation in spectral index is a convincing origin of the curved shape of the overall spectrum found in Sect. 3.2.
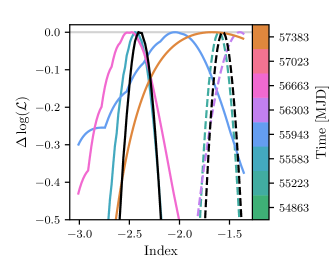
Finding the maximum likelihood in each normalisation slice of this parameter space leads to a profile of the index parameter for IC 310. These profiles are shown in Figure 6, and by summing the profiles with and without VHE flare detection from MAGIC (as shown in black), we find a distinct bimodality in index.
| Start [ISO (MJD)] | End [ISO (MJD)] | Index | TS | VHE Detection |
|---|---|---|---|---|
| 2001-08-04 (54682.66) | 2009-07-30 (55042.66) | -1.50 | 27.45 | – |
| 2009-07-30 (55042.66) | 2010-07-25 (55402.66) | -1.84 | 57.78 | Aleksić et al. (2010) |
| 2010-07-25 (55402.66) | 2011-07-20 (55762.66) | -2.71 | 25.82 | – |
| 2011-07-20 (55762.66) | 2012-07-14 (56122.66) | -2.53 | 25.03 | – |
| 2012-07-14 (56122.66) | 2013-07-09 (56482.66) | -1.65 | 9.68 | Cortina (2012) |
| Ahnen et al. (2017) | ||||
| 2013-07-09 (56482.66) | 2014-07-04 (56842.66) | -2.55 | 19.37 | – |
| 2014-07-04 (56842.66) | 2015-06-29 (57202.66) | -2.05 | 20.37 | – |
| 2015-06-29 (57202.66) | 2016-06-23 (57562.66) | -1.57 | 26.84 | – |
4 Systematic Checks
As in any analysis, there is a wide array of systematic effects that are introduced by our modelling methods. These range from specifics about how certain sources are treated in the sky model (both spectrally and spatially) to the choices we have made in Sect. 2 regarding the IRFs, cuts and large-scale sky models. In this section, we shall focus on a few of the areas which we believe to contribute the largest systematic uncertainties to our results in Sect. 3. A further check for correlation between the flux in IC 310 and NGC 1275 due to mismodelling of NGC 1275 (and resultant spurious flux associated with IC 310) was investigated in Appendix B, with no significant effect found.
4.1 Extended emission from NGC 1275
Source confusion between IC 310 and NGC 1275 presents a problem in our analysis given their separation. Especially at low energies where the LAT’s PSF is larger, this may present problems if NGC 1275 is spatially resolvable (as mentioned in Sect. 3, other radio galaxies have shown significant extension).
We thus search for extension in the point source of NGC 1275 by replacing it with a flat disc of various radii in the range – . The disc model is defined as:
| (6) |
As shown by Lande et al. (2012), both disc and Gaussian extension templates provide minimal bias when the size of the model is comparable to the size of the Fermi-LAT point spread function. Again, following Lande et al. (2012), we assess the significance of extension using the statistic:
| (7) |
which was found to follow a distribution. It should be noted that this distribution was only validated up to a TS of 16 (a limitation due to statistics), thus we extrapolate no significance beyond for greater TS values. Radial extension from 0.01∘ up to were fitted, with a TS of 0.006 and an upper limit of 0.03∘ extension. This is well within the Fermi-LAT point spread function, even at the highest energies, and rules out any significant extension in NGC 1275. There are no significant point sources (at the level of 5 standard deviations) immediately surrounding NGC 1275 that could bias this result.
At other wavelengths, far higher resolution studies of NGC 1275 could reveal the directionality of any existing extension. Previous radio observations (e.g. Lister et al. (2013)) finds that the inner jet axis is aligned in the North-South plane, incompatible with asymmetric extension in a westerly direction that could explain residual emission towards IC 310. This independent evidence suggests that extension is unlikely to be the cause of our signal.
4.2 Localisation of NGC 1275
Alternatively, asymmetry as shown in Figure 1 could be symptomatic of poor localisation of NGC 1275. We perform a maximum likelihood position estimation on NGC 1275 after removing IC 310 from the model. While this may bias us towards IC 310’s position, the resulting error is far smaller than assuming IC 310’s low-energy presence given the dominance of NGC 1275’s photon statistics. Such a procedure finds a shift towards IC 310 of only 0.004∘ which is well within the 0.1∘ pixel size used in this analysis.
Using this updated position, the preference of an integrated log parabola model over a power-law remains unaltered, though the localisation was not repeated in each time bin as a priori we assume this will remain unaltered.
4.3 Choice of IRFs
As noted in Sect. 2, in order to decouple IC 310’s emission from that of NGC 1275, we chose to use the PSF IRFs. This choice increased our systematic error on the effective area, especially at the extreme ends of the Fermi-LAT energy range, by around a factor of two. Our analysis is inherently spectral, so there is also an argument that the EDISP IRFs (in which the energy dispersion is minimised) would be appropriate. Alternatively, the combined FRONT and BACK IRFs could have provided a suitable middle-ground between energy dispersion and point spread function. In each case we will reanalyse this data while choosing a different set of IRFs and using the TS of IC 310’s soft spectral state as our figure of merit (as the hard spectral state has been independently studied by Neronov et al. (2010)). Table 4 shows the effect on the significance of the soft state with each set of IRFs.
| IRF | Event Types | TS | TS |
|---|---|---|---|
| PSF | (4 + 8 + 16 + 32) | 24.22 | 21.68 |
| EDISP | (64 + 128 + 256 + 512) | 2.15 | |
| FB | 3 |
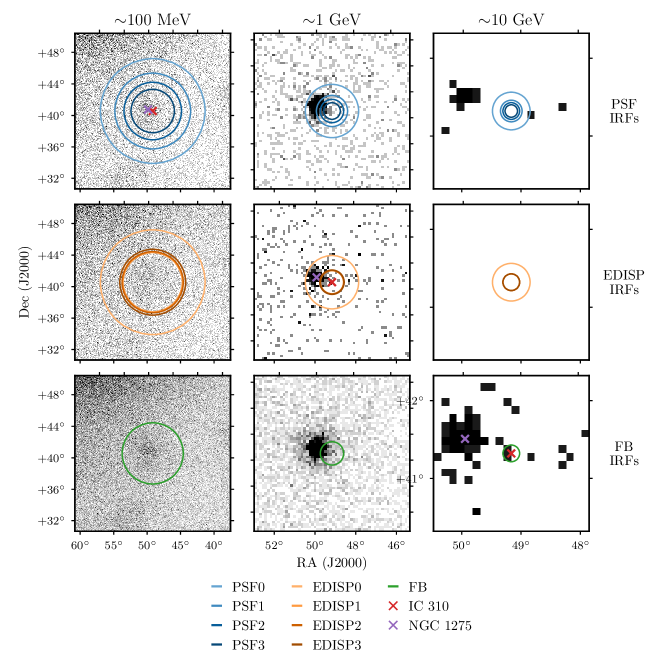
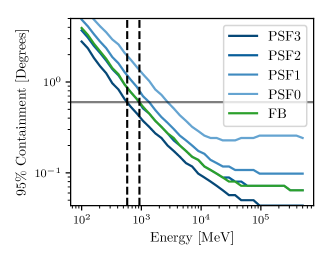
The significance of the result drops significantly as the PSF of the set of IRFs increases. This is due to the inability to differentiate between IC 310 and NGC 1275 with a degraded PSF. While this vindicates our decision to use the PSF-partitioned IRFs, it does show that this analysis is sensitive to our choice of IRFs. This is not a cause for concern as the PSF partitioned IRFs have been well-validated, but should be noted in any case. As a visual representation of the PSF of the LAT instrument at various energies, Figure 7 shows the variation of PSF (and data) with IRF choice. Figure 8 further shows that the energy at which the 95% containment radius exceeds 0.6∘ (the separation between NGC 1275 and IC 310) is severely reduced using the PSF3 IRFs. With the FB IRFs this energy is 928.6 MeV, but with PSF3 IRFs, this is reduced to only 578.5 MeV, almost a factor of two improvement.
5 Discussion
We have reported the detection of a soft emission state in addition to the very energetic emission commonly associated with IC 310. While noted for these bright flaring periods, by inspecting the SED of IC 310 over the lifetime of Fermi to date we find this soft emission is concentrated between periods in which strong flares have been observed.
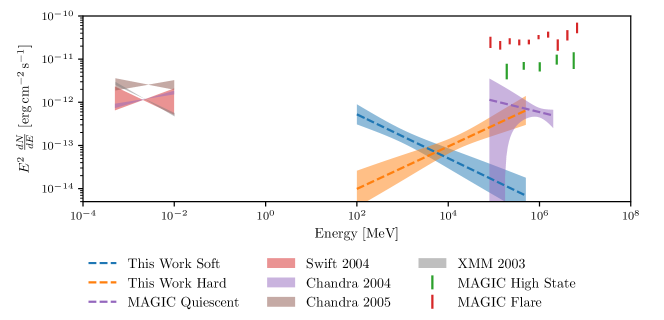
The two states, flaring and quiescent, are most recognisably distinct in their spectra. The peak of the inverse-Compton peak during flaring periods was undetected even above 10 TeV, while our analysis has found the inverse-Compton peak to be lower than 100 MeV during quiescent flux states under the assumption of a synchrotron self-Compton model. This represents an increase of more than 5 orders of magnitude in inverse-Compton peak energy on time-scales of a year. Similar spectral variance has been seen over multiple X-ray observations as shown in Figure 9, which could represent the same behaviour for the synchrotron peak.
Without simultaneous multiwavelength observations to constrain the broadband SED it is almost impossible to make conclusions as to how this bimodal behaviour can be modelled. Recent simultaneous observations by Ahnen et al. (2017) find that a simple SSC model can sufficiently explain the broadband behaviour of IC 310 using different viewing angle estimates. Interestingly, the spectral indices of the analysis presented in this paper and the index of the VHE quiescent emission detected by Ahnen et al. (2017) are consistent. However they predict a peak IC energy around 80 GeV, which would disagree with the downward-going spectrum detected here with Fermi-LAT. It should be noted that the measurements presented in this work and in Ahnen et al. (2017) are not contemporaneous, so cooling of the electron population could explain this change in peak energy.
To gain simultaneous observations of the Compton and inverse-Compton peaks, X-ray instruments must integrate exposure on IC 310 over the year-long time periods necessary for significant detection using Fermi. Assuming the SSC paradigm, we can make some physical inferences. The cooling time-scales of the electrons emitting gamma-rays at GeV energies are far shorter than the time periods (year-long bins) that we consider, and the flares could be explained (at least in the Fermi energy range) by a Doppler factor increase due to changes in the jet. Without simultaneous broadband observations, however, these inferences remain speculation but can be explained by a plausible mechanism.
Whilst we have shown that the integrated spectrum of IC 310 does indeed show a negative parameter, this should not be interpreted as an intrinsic property of the electron energy distribution of IC 310. This would have to result from an upturn in energy spectrum of accelerated particles moving down the jet, an unlikely prospect at the level required for these results. This is unambiguously an artefact of time integration.
6 Conclusions
We have discovered a quiescent state in the Fermi-LAT spectrum of IC 310, which is spectrally distinct from the flaring state that has been previously studied. Whilst an analysis of the 8-year data set results in a strongly curved spectrum (an upturn with increasing energy), we conclude that this is an artefact of integrating a hard, flaring state and a soft, quiescent state. Between the two spectral states, the power law index hardens from to .
Ahnen et al. (2017) found that the peak energy of the second SED hump extended from below 100 GeV to over 10 TeV, a jump of two orders of magnitude. This work pushes the peak energy of this hump below even 100 MeV, resulting in a jump of over 5 orders of magnitude in peak energy.
To fully understand the emission processes responsible for IC 310’s SED and these large changes in injected particle energy, it will be necessary to undertake further simultaneous broadband observations, ideally with good instantaneous sensitivity. Forthcoming instruments such as the Cherenkov Telescope Array (Actis et al., 2011) observing simultaneously with NuSTAR (Harrison et al., 2013) at hard X-ray wavelengths would substantially constrain the quiescent spectrum in preparation for follow-up of future flaring activity.
7 Acknowledgements
JG is supported by an STFC studentship, grant reference ST/N50404X/1. AMB and PMC are supported by the STFC Consolidated Grant, reference ST/P000541/1. This work has made use of the NASA/IPAC Extragalactic Database (NED), which is operated by the Jet Propulsion Laboratory, Caltech, under contract with the National Aeronautics and Space Administration. This paper makes use of publically available Fermi-LAT data provided online by the Fermi Science Support Center.
References
- Abdo et al. (2010a) Abdo A. A.,et al., 2010a, The Astrophysical Journal, 719, 1433
- Abdo et al. (2010b) Abdo A. A., et al., 2010b, The Astrophysical Journal, 710, 1271
- Acero et al. (2015) Acero F., et al., 2015, The Astrophysical Journal Supplement Series, 218, 23
- Ackermann et al. (2016) Ackermann M., et al., 2016, The Astrophysical Journal, 826, 1
- Actis et al. (2011) Actis M., et al., 2011, Experimental Astronomy, 32, 193
- Ahnen et al. (2017) Ahnen M. L., et al., 2017, Astronomy and Astrophysics, 603, A25
- Ajello et al. (2016) Ajello M. et al. 2016, Physical Review Letters, 116, 161101
- Akaike (1974) Akaike H., 1974, IEEE Transactions on Automatic Control, 19, 716
- Aleksić et al. (2010) Aleksić J., et al., 2010, The Astrophysical Journal Letters, 723, L207
- Aleksić et al. (2014a) Aleksić J., et al., 2014a, Science, p. 1256183
- Aleksić et al. (2014b) Aleksić J., et al., 2014b, Astronomy and Astrophysics, 563, A91
- Atwood et al. (2013) Atwood W., et al., 2013, preprint (arXiv:1303.3514)
- Brown & Adams (2011) Brown A. M. & Adams J., 2011, Monthly Notices of the Royal Astronomical Society, 413, 2785
- Brown et al. (2017) Brown A. M., et al., 2017, Phys. Rev. D, 95, 063018
- Carpenter et al. (2014) Carpenter B., et al., 2014, The Astronomer’s Telegram, 5838
- Cortina (2012) Cortina J., 2012, The Astronomer’s Telegram, 4583
- Eisenacher Glawion et al. (2015) Eisenacher Glawion D., et al., 2015, preprint (arXiv:1508.05031)
- Fraija et al. (2017) Fraija, N., Marinelli A., Galván-Gámez A., & Aguilar-Ruiz E., 2017, Astroparticle Physics, 89, 14
- Gasparrini et al. (2015) Gasparrini D., et. al., 2015, preprint (arXiv:1508.05301)
- Han et al. (2012) Han, J., Frenk, C. S., Eke, V. R., et al. 2012, MNRAS, 427, 1651
- Harrison et al. (2013) Harrison F. A., et al., 2013, The Astrophysical Journal, 770, 103
- Kirk et al. (1998) Kirk J. G., Rieger F. M., & Mastichiadis A. 1998, Astronomy and Astrophysics, 333, 452
- Lande et al. (2012) Lande J., et al., 2012, The Astrophysical Journal, 756, 5
- Lister et al. (2013) Lister M. L., et al., 2013, The Astronomical Journal, 146, 120
- Mariotti (2010) Mariotti M., 2010, The Astronomer’s Telegram, 2510
- Massaro et al. (2004) Massaro E., et al., 2004, Astronomy and Astrophysics, 413, 489
- Mattox et al. (1996) Mattox J. R., et al., 1996, The Astrophysical Journal, 461, 396
- Neronov et al. (2010) Neronov A., Semikoz D., & Vovk I., 2010, Astronomy and Astrophysics, 519, L6
- Nolan et al. (2012) Nolan P. L., et al., 2012, The Astrophysical Journal Supplement Series, 199, 31
- Petropoulou et al. (2014) Petropoulou M., 2014, Astronomy & Astrophysics, 562, A12
- Rieger & Levinson (2018) Rieger, F. M., & Levinson, A. 2018, (arXiv:1810.05409)
- Schulz et al. (2015) Schulz R., et al., 2015, preprint (arXiv:1502.03559)
- Sijbring & de Bruyn (1998) Sijbring D., & de Bruyn A. G., 1998, Astronomy and Astrophysics, 331, 901
- Sobolewska & Papadakis (2009) Sobolewska M. A., & Papadakis I. E. 2009, Monthly Notices of the Royal Astronomical Society, 399, 1597
Appendix A Spectral parameters of IC 310
The spectral parameters of each model evaluated in Sect. 2 are listed in Table 5. In each case, the entire region of interest was independently fit after any change to the spectral or spatial model. Power law and log parabola models refer to the spectral models defined by Equations 2 and 3.
| Power Law Models | ||||
|---|---|---|---|---|
| Model | Prefactor | Index | Scale | |
| (MeV cms-1) | (MeV) | |||
| A | ||||
| B | ||||
| D | ||||
| E | ||||
| Log Parabola Models | ||||
| Model | Prefactor | Alpha | Beta | Eb |
| (MeV cms-1) | (MeV) | |||
| C | ||||
| F | ||||
| G | ||||
Appendix B Degeneracy with NGC 1275
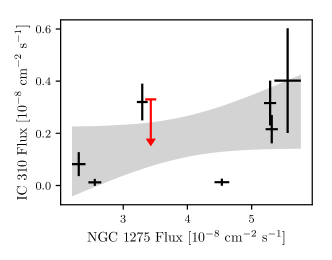
Many of the concerns in Section 4 relate to systematic bias on soft flux becoming associated with IC 310 due to the proximity of NGC 1275. If systematic errors in the PSF event classes used in this analysis were to wrongly associate low energy events (associated with a larger PSF) from NGC 1275 to IC 310 due to inaccurate PSF reconstruction, any increase in flux in NGC 1275 would result in an increase in flux in IC 310. Figure 10 shows the flux of both sources in each temporal bin used in Section 3.3. These data show no significant correlation in the soft-spectrum bins of IC 310 in which we claim a detection. A linear fit to these data of the form with best-fit parameters ph cm-2 s-1 and , fully consistent with no dependence.
Over the 8-year period considered in our analysis, NGC 1275 has increased in flux by a factor of two, and yet we find only an upper limit in our analysis of IC 310. This behaviour is inconsistent with a systematic error introduced by our use of the PSF instrument response functions mis-attributing flux between objects. A log-parabolic model of NGC 1275 was used for this investigation and spectrally fit in each bin. It is possible that deviations from this phenomenological model could provide a further systematic concern, but this has not been previously observed in NGC 1275. Indeed, many studies (Ajello et al., 2016, e.g.) assume that there is no significant spectral deviation from a log parabola in 8 years of integrated data.