Assessing Disk Galaxy Stability through Time
Abstract
N-body simulations have shown that the bar can be triggered by two processes: (1) by own instabilities in the disk, or (2) by interactions with other galaxies. Both mechanisms have been widely studied. However, the literature has not shown measurements of the critical limits of the Disk Stability Parameters, DSP. We showed measurements of those parameters through whole evolution in isolated disk models finding that the initial rotation configuration of those models is saved in the stable or unstable regimen from the initial to the final evolution. Then, we perturbed such isolated models to study the evolution of DSP under perturbation. We find that the critical limits of DSP are not much affected in barred models, however, when the bar is triggered by the perturbation, the disk fall in the unstable regimen. We show in our models that the bar triggered by a light perturbation grows into two phases: first, the bar appears as slow rotator, then it evolves toward fast rotator; second, when the perturbation is far from the target galaxy, the bar evolves from fast to slow rotator. Nevertheless, when the bar is triggered by a heavy perturbation, it appears as fast rotator and evolves toward slow rotator similar to classical bar models.
1 Introduction
Evaluate the stability of a disk galaxy as well as to disentangle the formation and evolution of a barred galaxy from the observations is a difficult task. Analytical works and N-body simulations are alternatives to study its dynamics and bar evolution. The analyzes of the stabilities are based on the determination of the dispersion relations and then investigate the unstable modes. If the size of the perturbation is much smaller than the size of the disk, the perturbation is cataloged as local stability. The Toomre stability criterion play an important role in the formation of spiral arm fragmentation to local scale. But, if the size of the perturbation is comparable with the size of the disk, the perturbation is classified as global stability; however, it is very difficult to write down a universal dispersion relation stability criterion. In the cosmological context, where the halo is much larger than the disk, the bar perturbation can not classified as a global perturbation rather is a central characteristic of full galaxy.
On the other hand, the bar formation in disk galaxies has been studied for several decades. Basically, the bar-like structure is triggered by two processes: (1) those which stem from internal causes, e.g., dynamical instabilities within individual galaxies and (2) those which are produced by external (e.g., tidal) influences.
Lynden-Bell (1996) and Polyachenko & Polyachenko (2004) reviewed five different mechanisms for the bar formation in isolated galaxies: (a) Since real bars have internal stream motions, Freeman’s picture of bar formation tried to associate these motions with incompressible Jacoby and Rieman fluids. (b) Two density waves are reflected in the center of the galaxy and amplified via Toomre’s swing mechanism when the disk has not Inner Lindblad Resonace(ILR). (c) The Contopoulos’s picture shows that the bar is a result of the distortion of circular orbits into eccentric orbits when the bar potential is already formed. (d) Kalnajs (1971, 1977) made a full stability analysis which led to an eigenvalue problem for normal modes of an axisymmetric stellar disk. The self-gravity of an ensemble of orbits (lobes) cooperate with one other to generate a disk instability radial orbits, which results in the formation of slow Lynden-Bell bars. In practice, it has been proved to be very difficult to find eigenvalues (Sellwood & Wilkinson, 1993). Lynden-Bell (1979) suggested that bars may grow slowly through the gradual alignment of eccentric orbits. In addition, Polyachenko & Polyachenko (2004) discuss the formation of galactic structures viewed as low-frequency normal modes in disk consisting of precessing stellar orbits. Studying the properties of an integral equation via the Lynden-Bell derivate of the distribution function, which depends on the variation of angular momentum. They found that if such derivate is positive, the bar mode can form; otherwise, the derivate is negative, then spiral modes growth. The mechanism of bar formation constraints on the angular velocity of the mode, which should be larger than the angular velocity of the orbital precession for fast bars or should be similar for slow bars (Polyachenko & Polyachenko, 2003). Then, the bar mode develops as a result of azimuthal tunning orbits in a massive disk. However, the wave decay in a light disk due to the wave mode meets the ILR. (e) A statistical focus that examines the bar formation from the rotating initial configurations when its spin parameter is lower than some critical limit.
These channels of bar formation are all connected by the change of angular momentum. It has shown that the formation and evolution of bars in isolated disk galaxies depends on the angular momentum exchange between their resonances and components (halo, disk, or bulge) (Athanassoula, 2002, and references therein). Therefore, a study of the spin parameter which is a measure of specific angular momentum, and its Critical Limit can assess the stability in situ of a disk model, and diagnosing the growth of a bar instability as well. These parameters can be related to an empirical stability parameter of Efstathiou et al. (1982) (hereafter EF82), which only depends on the rotation curve, disk mass, and the disk radius scale, and it is relatively easy to obtain in real observed galaxies . This parameter can evaluate roughly the stability of a disk because it is indirectly related to the exchange of angular momentum. In other words, the angular momentum exchange can be more efficient when the velocity dispersion is low and affects the mass distribution of the disk, halo or bulge, which in turns affect the rotation curve and the scale radius of a disk. Therefore, our goal is to figure out the critical limit of the spin parameter which relates the energy, the mass distribution and the angular momentum of the a disk galaxy by using N-body simulations to show the utility of for diagnosing the disk stability in N-body simulations. Furthermore, we claim the possibility of use to give a rough estimation of the stability in a real galaxy, since getting the angular momentum or spin parameter from a real galaxy is very difficult task.
The Mo et al. (1998) (hereafter MO98) models let us manipulate the spin parameter directly and get a maximum and sub-maximum disk with the same ratio. These models can be stable or unstable to the bar formation, depending on the disk stability parameters (hereafter DSP). Therefore, to accomplish our goal, we generate models with the same ratio, but with different initial disk stability parameters to be stable or unstable to the bar formation, and then we follow these parameters through the time, since a follow-up of over time has not been done. Likewise, we obtain measures of parameter through the time to show and connect its behavior to the bar instability.
We know that the galaxies in the universe are not isolated; in fact, they are interacting. Thompson (1981) showed that there are a large fraction of barred galaxies in the core of the Coma cluster indicating that tidal interactions can trigger bar-formation. Elmegreen et al. (1990) studied binary galaxy samples to search for possible correlations between the bar and the Hubble type founding that binary systems have a factor of 2 excess of barred galaxies. Andersen (1996) made a study of the velocity distribution of disk galaxies in the Virgo cluster, with the result that only the barred spiral galaxies in the core of the Virgo Cluster may have been triggered by interactions. Marinova et al. (2011) investigated the properties of bright barred and unbarred galaxies in the Abell 901/902 cluster explaining that high-velocity dispersion in the core regions benefits flyby interactions, which may increase the bar fraction, while preserving intact the galaxy disk.
N-body simulations have shown that a bar in a disk galaxy can be triggered by interactions (Noguchi, 1987; Gerin et al., 1990; Sundin et al., 1993; Miwa & Noguchi, 1998, and reference therein). Gerin et al. (1990), and Sundin et al. (1993) showed that tidal effects can increase or decrease the strength of the bar, which depends on the mass implicated, the pericentre distance, and the relative phase between the bar and the companion. Miwa & Noguchi (1998) simulated close encounters showing that bar generated by these encounters are confined to the Inner Lindblad Resonance, producing slow bars; it depends on the mass of the perturber. Recently, Moetazedian et al. (2017) showed how encounters with low-mass satellite galaxies may cause a delay in the bar formation compared to the isolated case. Instead, they can cause an advance in the bar formation after a small bar is already formed in the center, but its amplitude is still insignificant. They explain that the spiral wave created by the perturbation can interfere positively or negatively via Swing Amplification to form a bar. Likewise, Martinez-Valpuesta et al. (2017) showed that the evolution of the bar parameters (strength, length, and pattern speed) in disk galaxies, which forms a bar-like structure in isolation, are not much affected, while such parameters triggered by a perturbation show some difference with its counterpart. The angular velocity of the bar which was triggered by a flyby is slower than such structure formed by a self-instability of the disk. Besides, they showed that a slow flyby has a greater effect on the target galaxy.
Moreover, cosmological simulations show that bars form, and then destroy in a response of asymmetric halos and interactions with substructure (Romano-Díaz et al., 2008). Lang et al. (2014) used N-body simulations to investigate the ability of galaxy flyby interactions to form bars founding that the mass ratio between the main galaxy and the perturbation determines some properties of the bar in the target galaxy. This type of encounters can be as strong as minor merger (Vesperini & Weinberg, 2000) and therefore change the properties of the disk as well as the Disk Stabilities, transforming the galaxy in a permanent way.
Therefore, flyby encounters appear in both simulations and observations and such interactions may change the properties of the model and in turn the DSP; then the disk might fall in the instability regimen so it triggers the bar growth. Hence, the another goal is to study the behavior of the DSP and the experimental parameter as the bar or spirals structures evolve in our models, now under perturbation, and prove they keep in the stability or instability regimens.
The growth of a barred galaxy has three main phases (Martinez-Valpuesta et al., 2006), which are characterized by three main observational parameters: length, strength and pattern speed. The first phase corresponds to the bar formation and extends for Gyr; the bar strength and the bar length grow quickly. The second phase is the buckling of the bar where the vertical symmetry in the bar is broken weakening the bar. In this phase, the amplitude m=2 of the Fourier Transform reach a maximum saturating the bar (Martinez-Valpuesta et al., 2006).
The final phase of the bar is the secular evolution. Sellwood (1981) showed that the bar grows slowly by increasing its strength and length, Combes & Sanders (1981), on the other hand, reported that bars tend to weaken in the long term. The rate at which bar parameters change depends on the properties of the model. Debattista & Sellwood (1998) showed that the bar slows by dynamical friction in a dense dark matter halo, while Athanassoula et al. (2013) found that higher is the gas content on the disk, slower is the growth of the bar. They also found that the halo triaxiality triggers the bar formation earlier, and leads to considerably less increase of the bar strength. On the other hand, the pattern speed of the bar slows down during all these phases (Weinberg, 1985; Little & Carlberg, 1991; Athanassoula, 2003).
2 THEORETICAL INPUT
We have performed collisionless N-body simulations with Gadget-2 code (Springel et al., 2001; Springel, 2005). We present here fifteen simulations of fully self-consistent models, all of them with a live exponential disk and live dark matter (DM) halo. The live halo ensures disk-halo angular momentum exchange, which plays an important role in the formation and evolution of bars as discussed by Athanassoula (2002). We simulated barred and unbarred models aiming to monitor the disk stability parameters of the disk.
2.1 Models of disk galaxies
The initial conditions were set down following the methodology delineated by Springel & White (1999) (hereafter SW99) and Springel et al. (2005) which is based on the analytic model of Mo et al. (1998) (hereafter MO98).
The dark matter mass distribution was modeled with a Hernquist (1990) profile,
| (1) |
with cumulative mass profile . This profile has the same dark matter to NFW profile (Navarro et al., 1996, 1997) within the radius ( is the radius of which the mean enclosed dark matter density is 200 times the critical density, i.e., it contains the virial mass). The NFW profile is often given in terms of the concentration index , defined as , where is the scale length of the NFW halo. We then have the relation
| (2) |
Furthermore, let’s define
| (3) |
to be the circular velocity at the virial radius.
The stellar component is modeled with an exponential surface density profile of scale length , i.e.
| (4) |
where . The vertical mass distribution is given by an isothermal sheet with a radially constant vertical scale length . Therefore, three-dimensional stellar density in the disk is
| (5) |
A self-gravitating model is the one in which the initial kinetic energy of the spherically symmetric halo may be computed by assuming that all particles move around the center on circular orbits, with speed equal to the circular velocity (SW99 and MO98), so that , where
| (6) |
which comes from the change in the total energy resulting from the different density profile.
The total angular momentum of the halo with total energy is often characterized by the dimensionless spin parameter
| (7) |
The disk has a structure of a thin exponential disk, and it is cold and centrifugally supported. The mass disk is a fraction of
| (8) |
In a similar way, the angular momentum of the disk is a fraction of
| (9) |
Consequently, the spin parameter of the disk is
| (10) |
From this equation, we then determine the scale radius of the disk (MO98), given by
| (11) |
where
| (12) |
Note that in practice the scale length in the initial disk is determined iteratively in order to satisfy equations (13) and (17) from Springel & White (1999).
2.2 Criterion of Instability
Instabilities play a very important role in transforming and regulating the properties of disk galaxies. Local stabilities are affected by perturbations with lengths much smaller than the size of the disk. They can be transient and can regulate the evolution of a disk by driven features as transient spiral structures and star formation due to the fragmentation and collapse of gas clouds. On the other hand, large disk instabilities (LDI), which are comparable to the size of the disk, can cause a significant transformation of the overall disk. Whenever a disk galaxy has LDI, it will evolve towards a new stable configuration, erasing information about the initial conditions under which the system was formed (Mo et al., 2010).
We first focus on disk instabilities that can trigger a bar in an isolated disk galaxy. For that purpose, the most relevant studies are those of EF82 and MO98. EF82 used N-body techniques to investigate disk instabilities of exponential disks embedded in a variety of halos and found that the bar instability for a stellar disk is characterized by the parameter :
| (13) |
They found that if then the disk is unstable to bar formation. Else, if , then the disk is stable, but this parameter seems not to work well (Saha & Naab, 2013; Athanassoula, 2008). However, MO98 and SW99 show that disk stability is characterized by a lower limit of disk spin parameter , then they obtain a relation of this critical limit with the help of , but they use an approximation of the in their models; we use the obtained directly from the N-body simulation and we deduce a similar relation to MO98 of . Thus, following the same methodology as MO98, we use the formula together with equation 11 and establishing for the disk stability; then, we obtain a relation of lower limit of disk spin parameter, as follow:
| (14) |
where is the maximum circular velocity, is the mass disk, and is an integral which depends on , is the circular velocity, is the circular velocity given by equation 3, and is a function which depends of the concentration of the halo. Thus, we can find a disk stable against bar formation if , otherwise it is unstable. It is:
| (15) |
This parameter has the advantage that depends on the angular momentum exchange, and the mass distribution of the components, concentration and scale radius. In addition, it also depends on the velocity dispersion due that for higher the particles have less time to exchange energy and angular momentum, and therefore, varies fewer. To prove this criterion, we set down four isolated disk models and these model were subjected to other eleven interactions.
3 METHODOLOGY
This section includes a description of the initial conditions of the models, which consist of a disk and a Dark Mater halo, the interactions, and the tools we develop to analyze the models.
3.1 Isolated models setup
The initial conditions are generated following the methodology delineated in SW99 and MO98 as described before. Our models have been evolved from 0 to 6 Gyr. In the four models we present here, only one initial parameter was modified: the spin parameter . Most of the structural parameters are given in Figure 1. It shows models from disk dominate to halo dominate ones. We remark that these models were generated with the same ratio, changing then the disk radial scale length, central surface density and the Toomre parameter as well. The Toomre parameter increases according to the spin parameter in the initial conditions (Fig. 2).


| Models | Final Status | |||
|---|---|---|---|---|
| A | 0.03 | 0.052 | 0.76 | Strong bar |
| A | 0.04 | 0.055 | 0.86 | Barred |
| A | 0.05 | 0.056 | 0.95 | Weak bar |
| 0.05 | 0.056 | 0.95 | Weak bar | |
| A | 0.06 | 0.057 | 1.03 | Unbarred |
The isolated models have particles: to simulate the disk and to simulate the halo. We ensured that the mass of the halo particles is not larger than 8 times the mass of the disk particles.
The simulations were performed with the Gadget2 code (Springel, 2005) with its default units, where the velocity unit is equal to 1km/s, the length unit is equal to 1kpc and the mass unit is equal to . The gravitational forces were computed with a hierarchical multipole expansion, which short-range forces are computed with the ‘tree’ method while long-range forces are determined with Fourier techniques with a tolerance parameter . The softening length for the disk particles is and for the halo ones is . They are chosen so that the maximum inter-particle force shall not exceed the typical mean-field strength (Dehnen & Read, 2011). Thus, we ensure that two-body relaxation will not artificially induce chaotic orbits. Time integration is based on a quasi-symplectic scheme where long-range and short-range forces can be integrated with different time-steps given by where and is the acceleration of the last time-step. With these parameters, we ensure that the energy conservation was better than . We assessed the numerical robustness by experiment with less number of particles and bigger softening according to Dehnen & Read (2011), getting similar results.
3.2 Setting up the encounters
We use the models setted up in 3.1 to subject them to a perturbation. In 3.1, we modeled four disk galaxies where we only change the spin parameter to get two classical models; two models where the disk dominates, another one where the halo dominates and another one where the disk and the halo have the same contribution in the inner region of the rotation curve.
| Group | Models | Status at the Pericenter | Final Status | ||||||||
| Strong bar | 2.6 | 51.1 | 23.8 | 2.95 | 18.99 | 34.03 | -8.37 | -19976 | Strong bar | ||
| Pw | Weak bar | 2.6 | 51.1 | 23.8 | 2.95 | 17.56 | 37.12 | -78.53 | -20747 | Strong bar | |
| Unbarred | 2.6 | 51.1 | 23.8 | 2.95 | 17.21 | 37.64 | 76.42 | -21320 | Barred | ||
| Unbarred | 2.6 | 51.1 | 23.8 | 2.95 | 17.65 | 37.01 | 27.39 | -20642 | Barred | ||
| Unbarred | 2.6 | 51.1 | 23.8 | 2.95 | 17.63 | 37.35 | 25.70 | -20519 | Barred | ||
| Strong bar | 2.6 | 51.1 | 47.6 | 2.92 | 17.28 | 34.43 | -47.98 | -31235 | Strong bar | ||
| Weak bar | 2.6 | 51.1 | 47.6 | 2.95 | 17.56 | 37.12 | -76.79 | -30963 | Strong bar | ||
| Pm | Unbarred | 2.6 | 51.1 | 47.6 | 2.92 | 15.78 | 38.32 | 49.53 | -32492 | Barred | |
| Unbarred | 2.6 | 51.1 | 47.6 | 2.92 | 16.12 | 37.61 | 17.47 | -31563 | Barred | ||
| Strong bar | 2.6 | 51.1 | 95.2 | 2.92 | 16.94 | 40.70 | -57.19 | -46415 | Strong bar | ||
| Weak bar | 2.6 | 51.1 | 95.2 | 2.92 | 15.85 | 44.75 | 70.91 | -47123 | Strong bar | ||
| Ps | Unbarred | 2.6 | 51.1 | 95.2 | 2.92 | 15.47 | 44.88 | 42.33 | -47484 | Strong bar | |
| Unbarred | 2.6 | 51.1 | 95.2 | 2.92 | 15.72 | 44.93 | 11.97 | -46217 | Barred |
We use an Hernquist profile to built the stellar and the halo component of the perturbation using the methodology established by Springel & White (1999) and Springel et al. (2005). We set up three groups of encounters where we change the mass of the perturbed to have different tidal forces at the pericentre; table 2 enlist such interactions. The first group (Pw) are interactions where the total mass of the perturber is approximately half of the total mass of the target model, the second group (Pm) are interactions where the total mass of the perturber is similar to the total mass of the target model, and finally, the last one (group Ps) are interactions where the the total mass of the perturber is almost two times the total mass of the target model.
Later in the article, we will show that isolated models form a bar at different times, e.g. in model A03 after the first gigayear, in model A04 after the second gigayear, and in model A05 at the end of the simulation while model A06 does not form a bar-like structure. We set up the interactions from the second gigayear in isolated models, and we calculate the passage at around the third gigayear to analyze the tidal perturbation at different stages of the bar as well as the growth of the bar in the stable model.
The interactions follow a coplanar, prograde and hyperbolic orbit around the disk reaching the pericentre at the first gigayear of its evolution (third gigayear in our interactions). We set the pericentre distance for all interactions approximately to , where is the radius containing the 75% of the disk mass of model A03.
Due to our experience, we use the mass contained up to the radius of target galaxy and perturbation galaxy as a point mass to calculate an approximation of the orbit that the perturbation will trace like two bodies; where
| (16) |
and
| (17) |
where the subscripts , , and mean the halo, disk, and spherical components.
The dark matter mass distribution was modeled with an Hernquist (1990) profile (eq. 1), this profile has the same dark matter to NFW profile (Navarro et al., 1996, 1997), i.e.
| (18) |
within the radius to be related to cosmological halos ( is the radius of which the mean enclosed dark matter density is 200 times the critical density , i.e. it contains the virial mass). The NFW profile is often given in terms of the concentration index , defined as , where is the scale length of the NFW halo, and the characteristic over-density is
| (19) |
Then, the mass within radius for the halos and is:
| (20) |
where .
The stellar component of the perturbation was modeled with an Hernquist profile ; therefore the mass contained at radius is
| (21) |
where is the total mass of the stellar component for the perturbation galaxy, and the mass within radius of the exponential disk is then
| (22) |
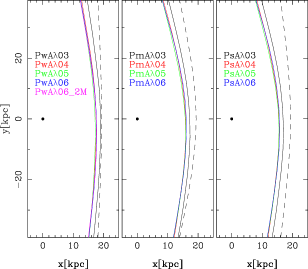
Then, we get the position and the initial velocity of the perturber to get that orbit from the motion equations of two bodies. Obviously, this theoretical orbit is slightly different from the simulated orbit. Figure 3 compare the theoretical and the simulated orbits.
The target models are , , and , the perturbation model have particles: to simulate the stellar component (it is a Hernquist profile), and to simulate the halo. The simulations were performed with the Gadget2 code(Springel, 2005) where the tolerance parameter is , and the softening length is . In the same form as we mention in section 3.1, we assessed the numerical robustness by experiment with less number of particles and bigger softening according to Dehnen & Read (2011), getting similar results.
3.3 Measurement of parameters
We determine the spin parameters using equation 7 and equation 10 from the phase space of the simulation. The was calculated performing equation 14. First, we calculate the potential as function of radius, then we determine the derivative of this curve to get the rotation curve for a snapshot, and so we obtain the . To calculate , we fit the halo profile to the NFW profile to determine the scale radius of the halo and the radius , then we calculate the halo concentration using the equation 2. Finally, we fit the profile of the disk to the exponential disk (eq. 4) to obtain the scale length radius of the disk, then we calculate the integral (eq 12). Also, we use these parameters to calculate the experimental stability parameter . It should be mentioned that we calculate all these parameters using the phase space for each saved snapshot of the simulations.
As we said before, the bars are characterized by three main observational parameters: length, strength and pattern speed. In order to measure these parameters, we compute Fourier coefficients for modes from to in the disk particles and monitor their amplitudes and phases variation across the disk as a function of time. We use the amplitude of to measure the strength and the growth rate of the bar which is being formed in the disk. The phase of of the Fourier coefficients also was used to calculate the instantaneous angular velocity of the bar , and then, it was used to fix the bar reference frame. From the bar reference frame, we calculate the bar axes length by providing a density threshold to define the bar limits. In order to measure the size of the bar; first, we obtain a profile of the bar along with both the major and minor axes dividing them into cells and then calculating their surface density; so, the limits of the bar were calculated using the density threshold provided. The next step was to change iteratively the size or number of cells until to get a convergence of on the length of bar axes.
4 RESULTS FOR ISOLATED MODELS
In this section, we describe the growth of the bar, the calculations of the disk instabilities through the time, and the results from the Fourier Transform analysis.
4.1 Stability criterion through the time
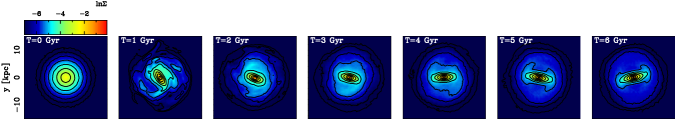
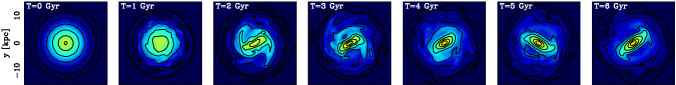
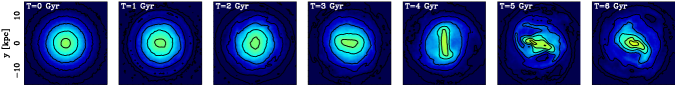
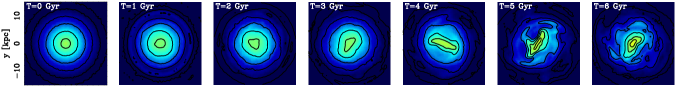
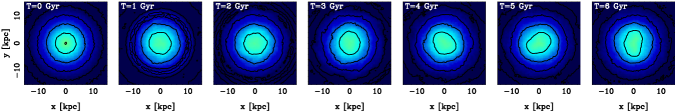
Figure 4 shows the face-on logarithm surface density maps for all of our models, at times of 0, 1, 2, 3, 4, 5, 6 Gyr. Model on top row has the lowest value of and being (see Figure 5), this model maintains for the full evolution. This model forms a bar very quickly and it is kept during all the evolution. Model is shown in the second row; it also has and (see Figure 6), and it forms the bar around two to three Gyr, and it is also maintained during the entire evolution. The third row shows the model ; this model has and a little less than unity (see table 1). It forms a weak bar perturbation around the fourth Gigayear; The last row present the model ; this model has and . This model is stable and shows some weak spiral waves.
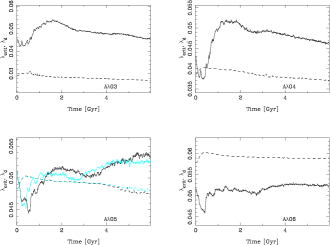
Figures 5 show the evolution of the DSP (, and ) for our simulations. Model , in upper left panel of figure 5, begins with and this configuration is maintained in the entire simulation despite the formation of the bar. The model presents a similar behavior as mentioned above (see upper right panel of Figure 5). The (black lines) and _M14 models (cyan lines) in bottom left panel, start with , but once the bar begins to form, becomes smaller than and remains like that to the end of the simulation. The model , in bottom right panel, shows that the spin parameter is larger than the critical spin parameter during the whole evolution.
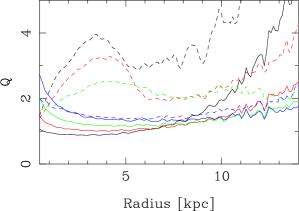
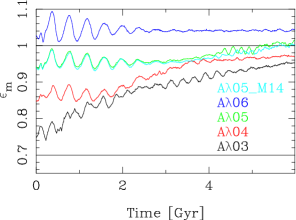
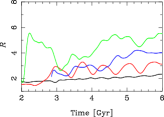
The experimental stability parameter, , is plotted in Figure 6. This Figure shows the evolution of for all of the models. The black line depicts the model, red line depicts the model, green line shows the model, and blue line depicts the model . While the evolution of parameter shows values in the range from 0.7 to 1 for barred models, the evolution of for the model displays values larger than one. Furthermore, the parameter for the models and show an increase during the evolution, but not exceed the unity while for the models fluctuates around the unity at the end of simulation.
4.2 Growth of the bar
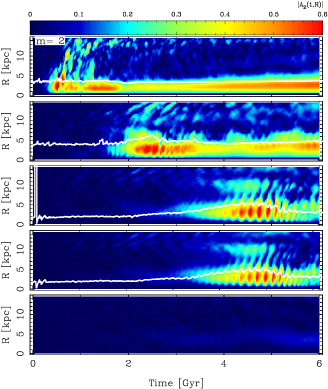
The evolution of the bar and the spiral structure is shown in Figure 7, in which we plot the Fourier Amplitude for the mode, . For model (top panel), we observe that the rapid growth of the bar is followed by spiral waves up to the reaches a maximum; after that, the disk rises its velocity dispersion maintaining the bar perturbation, and some weak spiral waves are driven transiently by the bar (Athanassoula, 1980; Salo et al., 2010). The second panel, model , the bar growts at around 2-3 Gyr, and the spiral structures generated here are stronger than those generated in model . Models (third panel) show that the bar growts at around 4-5 Gyr and the saturation at around 6 Gyr; this these panels show the bar growth accompanied by some strong bi-symmetrical structures at larger radii. Finally, model (bottom panel) only shows weak and transient waves in the mode. The white line in these panels represent the radius of the bar, which is half of the length of the bar (second panel of Figure 10).
| Model | |
|---|---|
| A03 | 3.82 |
| A04 | 0.84 |
| A05 | 0.39 |
| 0.40 | |
| A06 | 0.14 |
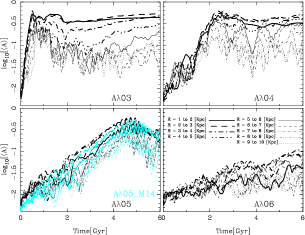
Figure 8 shows the amplitude for mode Fourier coefficient for different radii as a function of time. As we show in Valencia-Enríquez et al. (2017), these plots can be understood as growing curves of the structures that are being assembled. It means they represent the strength of the structures that are developing in the disk. In these curves, we can identify the three main phases of the bar growth by the amplitude curves taking from the inner radii; the first phase, the growth of the bar, corresponds to an exponential rise of its amplitude, from which we can get the growth rate of the bar (see table 3); the second phase corresponds to saturation of its amplitude (around the maximum amplitude); and the final phase, the secular evolution, corresponds to flattening of its curve (bar saturation).
In Figure 8, model , in the upper left panel, shows the fastest growth rate of the bar, , the maximum amplitude is reached around 0.5 to 1.5 Gigayear (Gyr), and after the second Gyr the bar saturates. Model , in the upper right panel, presents a growth rate of , the second phase is around 2 to 3 Gyr, and the bar saturates after the fourth Gyr. The (black lines) and _M14 (cyan lines) models, in the bottom left panel, reach the maximum amplitude after the fourth Gyr, and the growth rate is around of . Finally, model , in the bottom right panel, shows weak bi-symmetrical structures that evolve with a very slow growth rate of . We have found a relation between the measure growth rate and the initial in the form (figure 9).

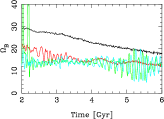
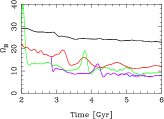
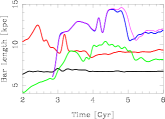
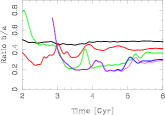
Some other measurements were made to characterize the bar. In Figure 10 we present the instantaneous angular velocity , length of the bar , axial ratio , and the ratio , where and are the corotation radius and bar length, respectively. This parametrization permits a classification of bars into “fast” () or “slow” () (Debattista & Sellwood, 2000; Athanassoula, 1992). Model , depicted with black line, shows a constant decrease of the angular velocity approximately from 30 to 20 . For model (red line), this decreasing starts from 20 to 12 . The length of the bars is kept almost constant for both models as well as the ratio between their axes. Furthermore, in their evolution the bars change from almost fast () to slow () as we observe in the rightmost panel of Figure 10. The and _M14 models, depicted with green and cyan lines, respectively, show an angular velocity around of . For these models, the bar grows in size until it achieves the longest length of 11 kpc . Afterwards, the bar shrinks to 7 kpc at the maximum amplitude phase (around T=5 Gyr). However, the bar seems to be destroyed after that, and the measurements of bar parameters is more difficult and less precise.
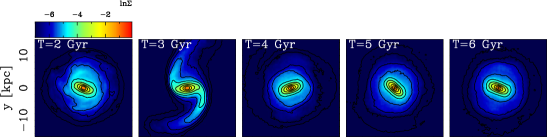
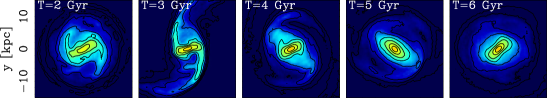
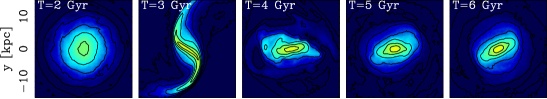
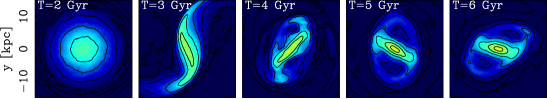
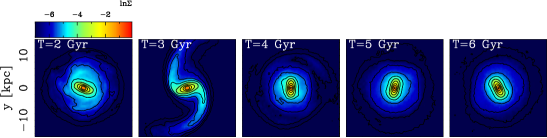
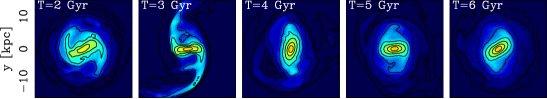
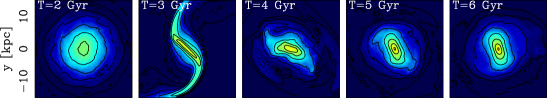
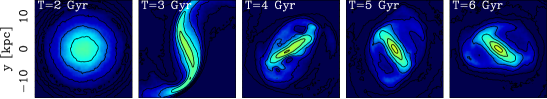
5 RESULTS FOR INTERACTIONS
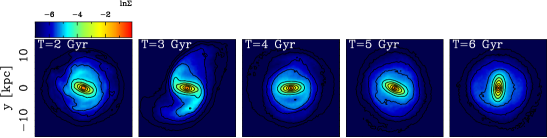
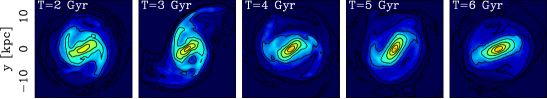
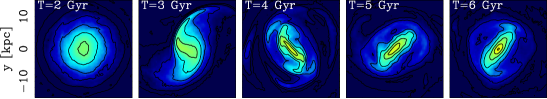
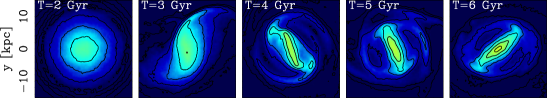
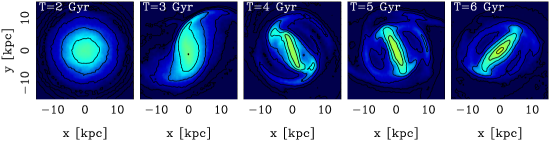
Figures 11, 12, 13 show the face-on logarithm surface density maps for all of our interacting models at times of 2, 3, 4, 5, and 6 Gyr; The simulations start from the second gigayear; therefore the pericentre passages in all encounters are around the third gigayear (second column of these figures); and we have to bear in mind that all encounters pass around of , therefore the duration of interaction is similar in all encounters. We can observe that those tidal interactions produce well defined strong spiral arms and extended tidal features, such as bridge and tail, that are all transient, but distinct in nature (Toomre & Toomre, 1972; Oh et al., 2008). The models in which the bar is already formed show strong spiral structure, but the bar seems not to be affected; while models where the bar is not created yet show a thin and durable oval triggered by the strong tidal pull. Figure 11 shows the interactions of group Pw; the tidal pull is the lightest, hence, these interactions generate wide spirals in all models, and a wide oval in simulations where the bar is not formed yet. Figure 12 shows the interactions of group Pm; the tidal pull is relatively strong; not only these interactions generate narrow spirals in all models, but also they generate a thin central oval in the disk, where the bar is not form yet. Finally, Figure 13 shows the interactions of group Ps; the tidal pull is the strongest, generating the thinnest spirals and oval of all interactions. Observing these interactions, we can notice while stronger the interaction thinner the spiral structure in the target model.
5.1 Disk Instabilities through the time
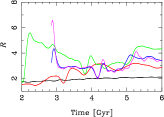
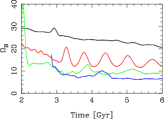
In Figure 14, first column, plots 14a and 14d, depicts the interactions with the lightest companion (Pw); , the second column depicts the interactions with the companion that has a similar mass to the target galaxy (Pm) and the last column depicts the interactions with the heaviest perturbation (Ps). The measurements of the Disk Stability Parameters (DSP), Figures from 14a to 14c, show similar behavior in all interactions. In these figures, the spin parameter are drawn as solid lines, while the is depicted as dashed lines. On the other hand, the experimental stability parameter is displayed in Figures from 14d to 14f.
In general, at the time of encounter, the impulse on particles of the target galaxy given by the perturbation makes that the spin parameter and the critical spin parameter increases and decreases, respectively, and the stability parameter decrease as well. After the perturbation passes and is far from the studied galaxy, tends to come back to values it had before the flyby while tends to increase to higher values than causing the disk becomes unstable. The parameter is set down almost constant by the rest of the simulation.
The change of DSP depends on the mass, distance, and velocity around the pericentre which means that the growth of spirals and bar properties evolve different (Noguchi, 1987; Gerin et al., 1990; Sundin & Sundelius, 1991; Miwa & Noguchi, 1998; Oh et al., 2008; Martinez-Valpuesta et al., 2017; Moetazedian et al., 2017). For our purpose, we only experiment with the mass of the perturbation setting down almost constant the pericentre distance and the angular velocity of the perturbation.
5.2 Evolution of bar parameters
Since the bar and tidal pull produce strong features in the mode of the Fourier component, we measure such amplitude and display it in Figure 15 for all our interactions. Figures 15a to 15c show the amplitude in color scale, and Figures 16a to 16c show curves of that amplitude for different radii. The passing of the perturbation causes that the amplitude increase strongly and transiently from the outer to the middle region of the disk. From there, substantial amplitudes move towards the inner part of the disk in all interactions.
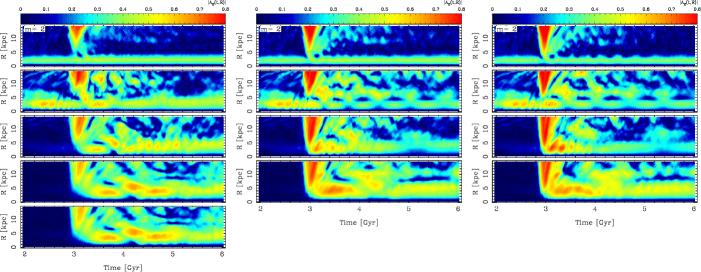
Models , and (111Models ; the asterisk refers to models , and . We write the asterisk when refers to models with the same initial parameter from PI) represented in the top panels of Figures 15a, 15b and 15c, respectively, show the evolution of bar in the inner region of disk, which is almost constant through the time, and it appears not to be affected by the interaction (see also upper left panels of Figures 16a, 16b, and 16c). Besides, in the outer part of the disk, the “growing curves” (Figures 16a, 16b, and 16c) show that the amplitude of transient tidal spirals is higher than the one in the bar at the interaction time. Then, after the perturbation is far from the target galaxy, some spiral can survive transiently, while other weaker spiral wave may be driven temporarily by the bar.
In Models , and (), the perturbation passes when the bar gets a maximum amplitude for mode (MA phase) which causes the MA phase finish quickly saturating the inner part of the disk (see second panels of Figures: 15a, 15b and 15c, and upper right panels of Figures 16a, 16b and 16c), and strong tidal spirals can survive for more time than those of models .
Before the perturbation passes, models , and () in both third panels of Figures 15a, 15b and 15c, and bottom left panels of Figures 16a, 16b and 16c, respectively, do not form a bar yet. Thus, the interaction happens before the MA phase, causing high amplitudes of mode which grow first in the outer region of the disk, and then less strong amplitudes grow in the inner region of the disk, then accelerating the formation of a larger narrow bar. Tidal spirals can survive for more time and it seems to be connected to the bar transiently. In particular, interaction , which has the heaviest perturbation, shows this behavior more conspicuous than the others.
Models , and (), shown in both last panels of Figures 15a, 15b and 15c, and bottom right panels of Figures 16a, 16b and 16c, respectively, show similar behavior to models . As we show before, model is stable against bar formation; however, when it is subjected to a perturbation, the DSP parameters fall below the stability limits (see Figures 14a, 14b and 14c) causing the bar formation (see the snapshots and measurements of the Fourier Transform).
Additionally, from the “growing curves” we calculated the growth rate of spirals and bar, which is depicted with a straight red line in panels of Figure 16a, 16b and 16c. For models and the bar is already formed, thus we calculated the growth rate of strong spirals that was triggered by the interaction. For the other models, we calculated the growth rate of the bar. We summarize in table 4 the growth rate of tidal spirals (bold numbers) and the growth rate of the bar.
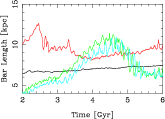
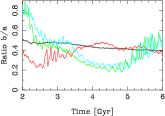
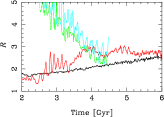
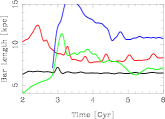
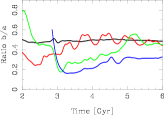
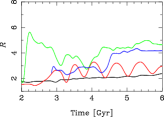
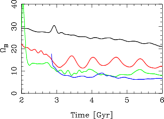
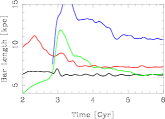
Figure 17 shows the growth of the bar which is characterized by their observational parameters. From the top row to the last one, we display the evolution of the bar for models of groups Pw, Pm, and Ps, respectively. We can observe in all encounters that at the time of interaction the measurements of and show a bump due to the impact given by the perturbation.
The evolution of bar for models (black lines), and (red lines) are not much affected by the perturbation. They evolve similarly to their isolated counterpart (see Figure 10). However, there is a slight difference in the bar axis length, e.g., while model shows an increase around of one during the interval from two to six , perturbed models do not present such increment and after the perturbation passes, the bar seems to maintain the same size throughout the evolution. On the other hand, the slowdown of the bar for model falls at a constant rate from 21 to 12 while such slowdown seems to stop after the perturbation overfly, decreasing it and keeping it around of 12 . Particularly, the for model still oscillating between 10 and 16 during the rest of simulation.
The interactions (green lines), the third row of Figure 17, cause that the bar formation starts earlier than in the isolated model . While the bar angular velocity of model is around of 12 , this, for perturbed models, changes from 12 at the beginning to 9 when the perturbation is far away. Moreover, the bar reaches its maximum length at the MA phase: e.g. for model is around 11 at 4-5 Gyrs, for model is around 10 at 3-5 Gyrs, for models and are around 11 at 3 Gyrs. These variations cause that the parameter also gets large changes: e.g. the bar of models and appears as slow rotators and tends to become fast rotators.
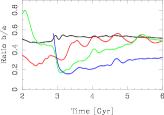
We can observe clearly the bar formation of models (blue lines) which was triggered by the perturbation. After the perturbation passes, the bar appears with the lowest angular velocity, which is around of 9 and it stays with such speed throughout the evolution. Besides, the bar length in these models reach the largest radius in both the MA phase and after that event as well, and the bar in these models are the most narrow (see the ratio between the axes of the bar, blue lines in the third column of Figure 17). Particularly, the bar in the and _M2 models, which is the lightest interaction, appears as slow rotator and evolves toward fast rotator; then when the perturbation is far away, the bar evolves from fast to slow rotator. In contrast, heavier interactions (, and ) the bar appears as fast and evolves towards slow rotator.
| Model | A | Pw | Pm | Ps |
|---|---|---|---|---|
| 3.82 | 4.24 | 6.87 | 6.10 | |
| 0.84 | 2.97 | 6.47 | 6.07 | |
| 0.39 | 1.94 | 4.06 | 5.81 | |
| 0.14 | 2.63 | 5.64 | 6.27 | |
| – | 2.65 | – | – |
6 DISCUSSION
6.1 Discussion of Isolated models
In the set-up of the isolated models, we only changed the spin parameter to generate disk dominate and halo dominate models and we study the DSP and the properties of the bar through the time.
Disc dominated models form a bar relatively quickly while a halo dominated ones do not form such structure. It has shown that the growth of a bar in a disk galaxy is more efficient when the rotation curve is dominated by the disk due to the exchange of angular momentum between e.g. halo and disk (Athanassoula, 2013). Thus, the rate at which bar parameters change depends on the properties of the model, as well as the initial parameter. The local stability, Toomre parameter, keep almost constant in model , however this parameter increase with the growth of the bar in the other models (see Figure 2). Although this parameter is a good indicator to know if a model is susceptible to the bar formation at the beginning of its evolution, the grow of the bar makes that this parameter increase leaving thus unknown what is the stability limits. However, MO98 and SW99 showed that disk stability possesses a lower limit on its spin parameter to get a stable disk, but it remains unclear what is this limit and how these disk stabilities behave during the evolution of a disk. In other words, are the DSP maintained ( or )?, or do they change like to the parameter?
We get a stable disk against bar formation when the model begins with the spin parameter greater than its critical spin parameter; the model start with that configuration () which is kept during the whole simulation and the model does not form a bar (see bottom right panel of Figure 5). On the other hand, we obtain an unstable disk to bar formation when its spin parameter is less than its critical spin parameter; models and start with that configuration (); although the models change and during the evolution of the simulation, they conserve their configuration (see upper panels of Figure 5).
The growth of the bar for all barred models shows some differences due to the central properties of the model. For model, the growth rate of the bar is higher, its spirals are weaker (figures 7 and 8), the instantaneous angular velocity of the bar is higher, and its length is shorter (see figure 10) than those parameters for model . We also noticed that the parameter evolves from slow to fast for both models and , (see last panel of figure 10) similar to classical bars showed in different works. The observational parameters of the bar, for model , are very diffuse because the bar is just forming at the end of the simulation. In fact, At the beginnings this model seems to be stable; but after the fourth Gyr, the model starts to form a bar structure when becomes higher than reaching the second phase of its growth at the end of the simulation.
Unlike Saha & Naab (2013) and Athanassoula (2008), the parameter save the conditions established by EF82 in our models. The model present , which is stable against bar formation, while the other models show which are unstable to bar formation. This parameter seems to work well in our models, which has a larger halo with a NFW profile.
6.2 Discussion of the interactions
We measured the evolution of the Disk Stability Parameters on isolated models to characterize the properties of a galactic disk to be stable or unstable to bar formation. We showed that the DSP configuration of an initial disk susceptible to bar formation keeps such configuration below the stability limits through the entire evolution; in contrast, a stable disk holds such DSP above the stability limits. The growth rate of the bar depends of how close the DSP are from the stability limits showing that if the DSP are below and far from the stability limits, the growth rate of the bar is higher.
In this work, we subjected the isolated models to different perturbations in coplanar hyperbolic orbit to examine the evolution of their DSP and how this affects the growth of bar in models stable and unstable to the bar formation; we do not take care of the evolution of the perturbation. The perturbations were modeled by an extended live spherical halo and stellar components with an Hernquist profile, respectively, so that the interactions are more realistic. Using a spherical galaxy as a perturbation permits that the pull given by this one is smoother than if the perturbation were a point of mass.
We explore the interactions only changing the mass of the perturbation where the total mass of the perturbation is half (Pw), similar (Pm), and two times (Ps) the total mass of the target galaxy. Therefore, the interaction force at the pericentre is stronger with heavier perturbations (see table 2). The different perturbations affect similarly the DSP and the bar parameters; however, stronger are the interactions, more noticeable are the changes in the measurements of the parameters.
The flyby of the perturbation causes a bump in the spin parameter and then when the perturbation is far from the target galaxy, it tends to returns to similar values. Conversely, the critical spin parameter decreases slightly at the time of interaction and then it increases overtaking during the simulation the previous values that it had before the interaction. The increment on is because the scale radius of the halo shrink a larger percentage of distance than the radius ; thus the halo becomes more concentrate. Likewise, the parameter decrease abruptly. This fall is due to that the pass of the perturbation causes a vigorous exchange of angular momentum between resonances and components (halo and disk), and then the disk also changes the radial scale . Nevertheless, the small decrease of does not affect much the parameter . We notice that the DSP of perturbed models have the same behavior to that of isolated models, as well as the experimental stability parameter. For example, the parameter for interactions , which is stable to bar formation in isolation, overtakes the spin parameter after the moment of interaction, as well as the parameter is set to the range ; then it makes that the model is identified as unstable to bar formation.
Although the parameter is a simple comparison of the rotation curve and the circular velocity of an hypothetical particle subject to a point-mass potential which has a mass equal to that of the disk seems to work well in our interacting models. Therefore, it could be a good indicator to assess the stability of a disk at least approximately, and also it could be used in real galaxies to assess and restrict some parameter of a disk galaxy.
Toomre & Toomre (1972) demonstrated that tidal perturbations distort extended portions of a disk to produce elongated and narrow features, phenomenologically called bridge and tail. The bridge is built on the near side of the disk toward the perturber, while the tidal tail, or counter stream, forms on the far side (Oh et al., 2008). Together, these two features generate high amplitudes in the Fourier Transform of mode . Such amplitude illustrates the dynamical responses of disks to a tidal perturbation. Figures 15 show that the tidal pull evolves from the outer to the inner region of the disk generating a vigorous spiral wave which excites the epicycle orbits of individual particles. Therefore, this triggers the bar formation rapidly in the disk without a bar. However, the bar already developed in a disk is marginally affected; e.g. we observe that the bar becomes slightly oval, but the axes ratio is almost constant during the evolution of the simulation (see Figure 17). After the perturbation is far, the tidal tail and bridge dissipate quickly, but some spirals growth transiently. These spirals are stronger and longer in models without bar before the perturbation passes.
On the other hand, the perturbation does not affect much the observational parameters in barred models. In contrast, when the perturbation trigger the bar, the observational parameters appear with less angular velocity, longer and shorter major and minor axis of the bar, respectively, and when the perturbation is heavy (e.g., Pm and Ps groups) the bar rotates from fast to slow, but when the perturbation is light, the bar grows in two phases: first appears as slow rotator and evolve toward fast rotator, then it evolves from fast toward slow rotator (see models ).
Finally, different to other results, e.g., Martinez-Valpuesta et al. (2017), we find that the bar growth, which is triggered by a light interaction, develops into two phases; the bar grows from slow to fast rotator; however, when the value of is close to one, the growth changes from fast to slow rotator.
7 CONCLUSIONS
In this work, we have followed for the first time in N-body simulations the critical spin parameter and the experimental stability parameter to characterize the stability of a disk galaxy model. We get an unstable isolated model to bar formation setting up (its rotation curve is dominated by the disk), while a stable model against bar formation is achieved setting up (its rotation curve is dominated by the halo). Moreover, we show that the configuration of stability e.g or is saved for long time no matter what structure is forming in the disk. Following the same line of research, we perturbed the isolated models to understand the nature of the formation and evolution of a bar in disk galaxies. There, we illustrate how the DSP are affected when the models are subjected to a perturbation. We reported one of the most important conclusion of the whole work, which in general is:“the bar in our disk galaxy models are formed below the stability limits in both isolated and perturbed disk, and this depends on how close are the parameters of their critical values”.
The growth rate of the bar in our models depends on the configuration of the DSP (, ). We have found that the growth rate is high if the spin parameter of the disk is lower than the stability limit , as well as is far from the unity. The model shows that the bar starts to evolve when the stability limit overtake the spin parameter , i.e., even if the initial configuration sets a model as stable, its own evolution with exchanges of angular momentum between the disk and halo can place it in the unstable regime. The stability parameter increases during the evolution; in contrast, we have found that the models maintain their initial configuration on DSP (unstable or stable regime), except when the initial Disk Stabilities Parameters are close to the critical stability limits, e.g. model .
With respect to observational parameters of the bar, we show that the evolution of those parameters mainly depend on the central properties of the model. A more concentrate mass distribution in a disk generates a shorter bar that rotates faster than a more extended mass distribution model in both isolated and perturbed models.
Acknowledgements
D.V.E and I.P. thanks the Mexican Foundation Conacyt for grants that support this research. I.R. thanks the Brazilian agency CNPq (Project 311920/2015-2). Part of the numerical work was developed using the Hipercubo Cluster (FINEP 01.10.0661-00, FAPESP 2011/13250-0 and FAPESP 2013/17247-9) at IP&D–UNIVAP.
References
- Aguerri (1999) Aguerri, J. A. L. 1999, A&A, 351, 43
- Andersen (1996) Andersen, V. 1996, AJ, 111, 1805
- Athanassoula (1980) Athanassoula, E. 1980, A&A, 88, 184
- Athanassoula (1992) Athanassoula, E. 1992, MNRAS, 259, 345
- Athanassoula (2002) Athanassoula, E. 2002, ApJ, 569, L83
- Athanassoula (2003) Athanassoula, E. 2003, MNRAS, 341, 1179
- Athanassoula (2008) Athanassoula, E. 2008, MNRAS, 390, L69
- Athanassoula (2013) Athanassoula, E. 2013, Secular Evolution of Galaxies, 305
- Athanassoula et al. (2013) Athanassoula, E., Machado, R. E. G., & Rodionov, S. A. 2013, MNRAS, 429, 1949
- Combes & Sanders (1981) Combes, F., & Sanders, R. H. 1981, A&A, 96, 164
- Debattista & Sellwood (1998) Debattista, V. P., & Sellwood, J. A. 1998, ApJ, 493, L5
- Debattista & Sellwood (2000) Debattista, V. P., & Sellwood, J. A. 2000, ApJ, 543, 704
- Dehnen & Read (2011) Dehnen, W., & Read, J. I. 2011, European Physical Journal Plus, 126, 55
- Efstathiou et al. (1982) Efstathiou, G., Lake, G., & Negroponte, J. 1982, MNRAS, 199, 1069
- Elmegreen et al. (1990) Elmegreen, D. M., Elmegreen, B. G., & Bellin, A. D. 1990, ApJ, 364, 415
- Gerin et al. (1990) Gerin, M., Combes, F., & Athanassoula, E. 1990, A&A, 230, 37
- Hernquist (1990) Hernquist, L. 1990, ApJ, 356, 359
- Kalnajs (1971) Kalnajs, A. J. 1971, ApJ, 166, 275
- Kalnajs (1977) Kalnajs, A. J. 1977, ApJ, 212, 637
- Lang et al. (2014) Lang, M., Holley-Bockelmann, K., & Sinha, M. 2014, ApJ, 790, L33
- Little & Carlberg (1991) Little, B., & Carlberg, R. G. 1991, MNRAS, 250, 161
- Lynden-Bell (1979) Lynden-Bell, D. 1979, MNRAS, 187, 101
- Lynden-Bell (1996) Lynden-Bell, D. 1996, Lecture Notes in Physics, Berlin Springer Verlag, 474, 7
- Marinova et al. (2011) Marinova, I., Jogee, S., Heiderman, A., et al. 2011, Memorie della Societa Astronomica Italiana Supplementi, 18, 61
- Martinez-Valpuesta et al. (2006) Martinez-Valpuesta, I., Shlosman, I., & Heller, C. 2006, ApJ, 637, 214
- Martinez-Valpuesta et al. (2017) Martinez-Valpuesta, I., Aguerri, J. A. L., González-García, A. C., Dalla Vecchia, C., & Stringer, M. 2017, MNRAS, 464, 1502
- Miwa & Noguchi (1998) Miwa, T., & Noguchi, M. 1998, ApJ, 499, 149
- Mo et al. (1998) Mo, H. J., Mao, S., & White, S. D. M. 1998, MNRAS, 295, 319
- Mo et al. (2010) Mo, H., van den Bosch, F. C., & White, S. 2010, Galaxy Formation and Evolution, by Houjun Mo , Frank van den Bosch , Simon White, Cambridge, UK: Cambridge University Press, 2010,
- Moetazedian et al. (2017) Moetazedian, R., Polyachenko, E. V., Berczik, P., & Just, A. 2017, A&A, 604, A75
- Navarro et al. (1996) Navarro, J. F., Frenk, C. S., & White, S. D. M. 1996, ApJ, 462, 563
- Navarro et al. (1997) Navarro, J. F., Frenk, C. S., & White, S. D. M. 1997, ApJ, 490, 493
- Noguchi (1987) Noguchi, M. 1987, MNRAS, 228, 635
- Oh et al. (2008) Oh, S. H., Kim, W.-T., Lee, H. M., & Kim, J. 2008, ApJ, 683, 94-113
- Polyachenko & Polyachenko (2003) Polyachenko, V. L., & Polyachenko, E. V. 2003, Astronomy Letters, 29, 447
- Polyachenko & Polyachenko (2004) Polyachenko, V. L., & Polyachenko, E. V. 2004, Astronomy Reports, 48, 877
- Prieto et al. (1997) Prieto, M., Gottesman, S. T., Aguerri, J.-A. L., & Varela, A.-M. 1997, AJ, 114, 1413
- Romano-Díaz et al. (2008) Romano-Díaz, E., Shlosman, I., Heller, C., & Hoffman, Y. 2008, ApJ, 687, L13
- Saha & Naab (2013) Saha, K., & Naab, T. 2013, MNRAS, 434, 1287
- Salo et al. (2010) Salo, H., Laurikainen, E., Buta, R., & Knapen, J. H. 2010, ApJ, 715, L56
- Sellwood & Wilkinson (1993) Sellwood, J. A., & Wilkinson, A. 1993, Reports on Progress in Physics, 56, 173
- Sellwood (1981) Sellwood, J. A. 1981, A&A, 99, 362
- Springel & White (1999) Springel, V., & White, S. D. M. 1999, MNRAS, 307, 162
- Springel et al. (2001) Springel, V., Yoshida, N., & White, S. D. M. 2001, New A, 6, 79
- Springel (2005) Springel, V. 2005, MNRAS, 364, 1105
- Springel et al. (2005) Springel, V., Di Matteo, T., & Hernquist, L. 2005, MNRAS, 361, 776
- Sundin & Sundelius (1991) Sundin, M., & Sundelius, B. 1991, A&A, 245, L5
- Sundin et al. (1993) Sundin, M., Donner, K. J., & Sundelius, B. 1993, A&A, 280, 105
- Thompson (1981) Thompson, L. A. 1981, ApJ, 244, L43
- Toomre & Toomre (1972) Toomre, A., & Toomre, J. 1972, ApJ, 178, 623
- Valencia-Enríquez et al. (2017) Valencia-Enríquez, D., Puerari, I., Chaves-Velasquez, L. 2017, Rev. Mexicana Astron. Astrofis., 53, 257.
- Vesperini & Weinberg (2000) Vesperini, E., & Weinberg, M. D. 2000, ApJ, 534, 598
- Weinberg (1985) Weinberg, M. D. 1985, MNRAS, 213, 451