Swift, NuStar and XMM-Newton observations of the NLS1 galaxy RX J2317.8–4422 in an extreme X-ray low flux state
Abstract
We report the discovery of RX J2317.8–4422 in an extremely low X-ray flux state by the Neil Gehrels Swift observatory in 2014 April/May. In total, the low-energy X-ray emission dropped by a factor 100. We have carried out multi-wavelength follow-up observations of this Narrow-Line Seyfert 1 galaxy. Here we present observations with Swift, XMM-Newton, and NuSTAR in October and November 2014 and further monitoring observations by Swift from 2015 to 2018. Compared with the beginning of the Swift observations in 2005, in the November 2014 XMM-Newton and NuSTAR observation RX J2317–4422.8 dropped by a factor of about 80 in the 0.3-10 keV band. While the high-state Swift observations can be interpreted by a partial covering absorption model with a moderate absorption column density of cm-2 or blurred reflection, due to dominating background at energies above 2 keV the low-state XMM-Newton data can not distinguish between different multi-component models and were adequately fit with a single power-law model. We discuss various scenarios like a long-term change of the accretion rate or absorption as the cause for the strong variability seen in RX J2317.8–4422.
keywords:
galaxies: Seyfert - quasars: individual: RX J2317.8–4422 - galaxies: nuclei1 Introduction
Extremes of AGN variability provide us with a powerful tool of understanding the physics of the central engine of Active Galactic Nuclei (AGN). While AGN typically vary on all time scales by factors of a few, some of these exhibit dramatic drops in their X-ray fluxes by factors that can exceed 100. The cause of these transitions into deep minimum X-ray flux states in AGN can be associated with (a) dramatic changes in the accretion rate onto the central supermassive black hole (SMBH), (b) changes in absorption, or (c) changes in (relativistically blurred) reflection of coronal X-ray photons off the accretion disc, for instance in response to changes in the lamppost height or luminosity. All three of these types of events have been identified in the past. A good example of an AGN that has exhibited a dramatic change in its accretion rate is the Seyfert 1.9 galaxy IC 3599 (Grupe et al., 1995a; Brandt et al., 1995; Komossa & Bade, 1999; Grupe et al., 2015). X-ray reflection has been suggested to be the cause of the strong X-ray flux changes in AGN which we have examined in the past based on XMM-Newton observations of AGN such as Mkn 335 (Grupe et al., 2008a, 2012; Gallo et al., 2013; Komossa et al., 2014; Gallo et al., 2015, 2018; Wilkins et al., 2015) and 1H0707–495 (Fabian et al., 2012). The third explanation of huge flux changes in AGN is absorption, in particular partial-covering absorption in X-rays (e.g. Komossa & Fink, 1997; Guainazzi et al., 1998; Gallagher et al., 2004; Risaliti et al., 2005; Bianchi et al., 2009; Mizumoto et al., 2014; Parker et al., 2014; Yamasaki et al., 2016; Zhang et al., 2017; Turner et al., 2018).
Perhaps the best example of an extreme X-ray absorption event is the Narrow Line Seyfert 1 galaxy (NLS1) WPVS 007 (Grupe et al., 1995, 2013). While the cause of the dramatic X-ray drop in this NLS1 had been a mystery for a decade, it became clear from FUSE observations, that this low-luminosity, low black hole mass AGN shows extremely strong broad absorption line troughs in the UV (Leighly et al., 2009). Observations by Swift, HST, and Chandra suggest that we most likely see the AGN through and above a patchy, dusty torus (Leighly et al., 2015).
We have an ongoing fill-in program with the Neil Gehrels Gamma-Ray Burst Explorer Mission Swift (Swift throughout the paper, Gehrels et al., 2004) to check on the X-ray flux of a sample of AGN (Grupe et al., 2010). In addition, AGN that go through extreme flux changes have been discovered through the XMM-Newton Slew Survey (Saxton et al., 2008). These programs have led to the discovery of several AGN that undergo transitions into deep minimum X-ray flux states or display dramatic flux increases allowing us to trigger XMM-Newton and NuSTAR observations.
Besides Mkn 335 and 1H0707–495, we also successfully observed Mkn 1048, PG 0844+349, PG 0043+039, PG 2112+059, PG 1535+547, and HE 1136–2304 (Parker et al., 2014; Gallo et al., 2011; Kollatschny et al., 2015, 2016; Schartel et al., 2007, 2010; Ballo et al., 2008; Parker et al., 2016; Komossa et al., 2017; Zetzl et al., 2018) with XMM-Newton and NuSTAR. One of the most recent AGN discovered as part of this survey was RX J2317.8–4422 ( = 23h 17m 50s, = –44∘ 22 27, z=0.134). RX J2317–4422 was first detected as a bright X-ray AGN during the ROSAT All-Sky Survey (RASS, Voges et al., 1999; Schwope et al., 2000) and was found to be an AGN with a very steep X-ray spectrum with =2.50.8 (Grupe et al., 1998). From its optical spectrum it was identified to be a NLS1 (Grupe et al., 1999) with a black hole mass of (see Sect. 3.4) accreting near the Eddington limit. A follow-up observation with ROSAT in 1997 May did not suggest any dramatic changes in its X-ray flux (Grupe et al., 2001).
Swift started observing RX J2317–4422 in 2005 May as a calibration target (Grupe et al., 2010). Swift continued to observe RX J2317–4422 several times as part of various fill-in programs. While none of these observations suggested anything special about this NLS1, an observation in April 2014 revealed that it had dropped its X-ray flux dramatically by a factor of more than 30 compared to the previous Swift observations within less than a year. After the discovery of this very low X-ray flux, we performed additional Swift observations, confirming the low flux state. This confirmation allowed us to trigger a 20 ks initial XMM-Newton observation in 2014 October to obtain a preliminary low state spectrum, which then led to an additional 100ks ToO observation with XMM-Newton in conjunction with NuSTAR in 2014 November. These XMM-Newton and NuSTAR observations are the main focus of our paper.
The outline of this paper is as follows: in § 2 we describe the data reduction of the Swift , XMM-Newton and NuSTAR observations. In § 3 we present the results from the analysis of the light curves and X-ray spectroscopy, and in § 4 we provide a discussion of the nature of the X-ray low-state of RX J2317–4422. Throughout the paper spectral indices are denoted as energy spectral indices with . Luminosities are calculated assuming a CDM cosmology with =0.286, =0.714 and a Hubble constant of =70 km s-1 Mpc-1. This results in a luminosity distance =631 Mpc using the cosmology calculator by Wright (2006). All uncertainties are 1 unless stated otherwise. The Galactic foreground absorption in the direction of RX J2317–4422 has a column density of cm-2 (Kalberla et al., 2005). For all statistical analysis we use the R package, version 3.2.4 (e.g., Crawley, 2009).
2 Observations and Data Reduction
2.1 Swift
Table 1 lists the Swift observations of RX J2317–4422 starting with the first observation in May 2005. The Swift X-ray telescope (XRT; Burrows et al., 2005) was operating in photon counting mode (Hill et al., 2004). Source counts were selected in a circle with a radius of 23.6 and background counts in a nearby circular region with a radius of 235.7. The 3 upper limits and the count rates of the detections were determined by applying the Bayesian method by Kraft et al. (1991). Some of the detections allowed a spectral analysis using Cash statistics (Cash, 1979). For all spectra we used the most recent response file swxpc0to12s6_20130101v014.rmf. The X-ray spectra were analyzed using XSPEC version 12.9.1p (Arnaud, 1996).
In case spectra could not be extracted from the data we converted the count rates or upper limits with an energy conversion factor of 3.61 W m-2 (counts s which was derived from the early observations when RX J2317–4422 was in a high state. Note that the spectrum most likely changed. However, due to the low count rate of RX J2317–4422 no spectral information could be derived from the Swift XRT data during the low state since 2014.
The UV-optical telescope (UVOT; Roming et al., 2005) data of each segment were coadded in each filter with the UVOT task uvotimsum. Source counts in all 6 UVOT filters were selected in a circle with a radius of 7 and background counts in a nearby source free region with a radius of 20. The background corrected counts were converted into magnitudes and fluxes by using the calibration as described in Poole et al. (2008) and Breeveld et al. (2010). UVOT Vega magnitudes and fluxes were measured with the task uvotsource. The UVOT data were corrected for Galactic reddening (; Schlegel et al., 1998). The correction factor in each filter was calculated according to equation (2) in Roming et al. (2009) who used the standard reddening correction curves by Cardelli et al. (1989).
Note that the 7" source extraction radius, which is larger than the standard 5" radius, was necessary because during several observations the Swift star tracker was unable to lock onto the target and Swift started to drift causing the image to be smeared out. This drift has two major effects: 1) enhanced background in the source extraction region, and 2) possible host galaxy contamination of the central source. However, at the redshift of RX J2317–4422 we do not expect the contribution of widely extended host emission at these radii. A point-like host contribution cannot be excluded, and may be part of the reason why the amplitude of variability is smaller at optical wavelengths (see below). We have tested different source extraction radii (7, 5 and 3 arcsec), and the difference in the derived magnitudes is less than the standard deviation in each filter of about 0.15 mag. The smaller extraction radius was accounted for by setting the uvotsource parameter apercorr to curveofgrowth. However, we also note that in our optical spectrum of RXJ2317.8–4422 (Grupe et al., 2004) no host absorption features are detected, arguing against the dominance of host emission in the optical.
| ObsID | Segment | T-start1 | T-stop1 | MJD | |||||||
|---|---|---|---|---|---|---|---|---|---|---|---|
| 56630 | 003 | 2005 May 26 08:08 | 2005 May 26 10:09 | 53516.380 | 1085 | — | — | — | 2445 | — | — |
| 35310 | 001 | 2006 Apr 18 00:18 | 2006 Apr 18 23:02 | 53843.444 | 7022 | 677 | 677 | 673 | 1343 | 1746 | 2745 |
| 002 | 2006 Apr 20 05:18 | 2006 Apr 20 23:04 | 53845.340 | 3212 | 264 | 264 | 264 | 529 | 717 | 1075 | |
| 91650 | 001 | 2013 May 03 13:41 | 2013 May 03 13:52 | 56415.574 | 185 | 61 | 61 | 61 | 122 | 38 | 244 |
| 003 | 2013 Jul 23 05:21 | 2013 Jul 23 15:09 | 56496.413 | 3000 | 266 | 266 | 266 | 539 | 789 | 1079 | |
| 91886 | 001 | 2014 Apr 20 05:26 | 2014 Apr 21 08:49 | 56767.802 | 1577 | 11 | 137 | 715 | 777 | — | 239 |
| 002 | 2014 May 01 16:32 | 2014 May 01 19:58 | 56778.760 | 1086 | 72 | 104 | 104 | 207 | 200 | 415 | |
| 35310 | 004 | 2014 Sep 24 00:55 | 2014 Sep 24 01:12 | 56924.044 | 944 | 80 | 80 | 80 | 159 | 238 | 319 |
| 005 | 2014 Oct 20 10:12 | 2014 Oct 20 18:28 | 56950.594 | 562 | 82 | 82 | 82 | 204 | 249 | 327 | |
| 008 | 2014 Oct 29 22:48 | 2014 Oct 29 23:01 | 56959.955 | 687 | 59 | 59 | 59 | 119 | 147 | 238 | |
| 80853 | 001 | 2014 Nov 16 17:44 | 2014 Nov 17 22:43 | 56978.260 | 1644 | 134 | 134 | 134 | 268 | 372 | 536 |
| 35310 | 009 | 2015 Apr 15 07:11 | 2015 Apr 15 12:11 | 57127.403 | 4845 | 125 | 125 | 125 | 3501 | 377 | 499 |
| 010 | 2015 Aug 19 21:12 | 2015 Aug 19 21:34 | 57253.889 | 1271 | 105 | 105 | 105 | 209 | 332 | 420 | |
| 011 | 2015 Aug 24 21:13 | 2015 Aug 24 22:55 | 57258.917 | 1151 | 136 | 136 | 136 | 275 | 446 | 551 | |
| 012 | 2016 Apr 05 20:20 | 2016 Apr 05 23:55 | 57483.920 | 4500 | 127 | 127 | 127 | 3178 | 373 | 507 | |
| 013 | 2016 Dec 20 03:35 | 2016 Dec 20 08:34 | 57742.250 | 3544 | 40 | 117 | 117 | 153 | 122 | 259 | |
| 014 | 2016 Dec 24 03:21 | 2016 Dec 24 03:41 | 57746.147 | 455 | 96 | 96 | 96 | 192 | 255 | 385 | |
| 93134 | 001 | 2017 Apr 19 13:02 | 2017 Apr 19 13:13 | 57862.547 | 649 | 52 | 52 | 52 | 103 | 160 | 207 |
| 002 | 2017 Apr 25 06:11 | 2017 Apr 25 06:21 | 57868.260 | 569 | 43 | 43 | 43 | 85 | 149 | 172 | |
| 35310 | 015 | 2018 May 27 06:38 | 2018 May 27 10:07 | 58265.351 | 4443 | 254 | 362 | 225 | 725 | 634 | 545 |
| 016 | 2018 Dec 28 05:59 | 2018 Dec 28 09:36 | 58480.326 | 4765 | 391 | 391 | 391 | 783 | 1108 | 1036 |
1Start and end times are given in UT
2Observing time given in s
2.2 XMM-Newton
XMM-Newton (Jansen et al., 2001) visited RX J2317–4422 twice. The first observation was performed on 2014 October 29 (MJD 56960) for a total of 16.9 ks (Table 2). This observation was an initial observation to check on the state of the source and to obtain a low state spectrum. After this observation confirmed the low state we triggered a second, 104 ks, observation starting on 2014 November 16 22:48 UT (MJD 56978). This observation was performed simultaneously with NuSTAR (see below) and Swift.
The EPIC pn camera (Strüder et al., 2001) was operating in Full Frame mode with a thin UV-blocking filter. Only PATTERN 0-4 (single and double events) were accepted for further analysis. Due to high energy background flares, part of the observations had to be discarded leaving net exposure times of 14900 s and 89081 s, respectively. The EPIC MOS 1 and 2 cameras (Turner et al., 2001) were operated in FullWindow mode with the thin filters. The exposure times were 16472s and 102954s for MOS 1 and and 16441s and 102988s for MOS2, respectively. For the event selection, only PATTERN 0-12 (single to quadruple events) were accepted. In all three instruments source counts were selected in a circle with a radius of 32. The background counts were selected from a nearby source-free region with a radius of 64. The spectral data were binned with 20 counts per bin. In order to increase the statistical significance of the spectral fits, the data of all three instruments were analyzed simultaneously with XSPEC version 12.9.1p (Arnaud, 1996).
| Mission | ObsID | T-start1 | T-stop1 | MJD | ||
|---|---|---|---|---|---|---|
| XMM-Newton | 0740040101 | 2014-10-29 22:30 | 2014-10-30 02:41 | 56960.024 | 16911 | 14900 |
| 0740040301 | 2014-11-16 22:48 | 2014-11-18 03:16 | 56978.585 | 90998 | 89081 | |
| NuSTAR | 800001030002 | 2014-11-16 16:51 | 2014-11-18 10:41 | 56978.587 | 148161 |
1Start and end times are given in UT
2Observing time ( and the effective exposure time (eff) after correcting for times of high background flares are given in s. These are the times schedules and used for the EPIC pn.
2.3 NuSTAR
RX J2317–4422 was observed with NuSTAR (Harrison et al., 2013) for 150 ks from 2014 November 16, 17:25 UT (Table 2). We reduced the NuSTAR data using the NuSTAR Data Analysis Software (NuSTARDAS) version 1.5.1 and CALDB version 20150904. We filtered for background flares, and found clean on-source exposure times of 83.6 ks and 83.4 ks for FPMA and FPMB (the two NuSTAR focal plane modules), respectively. This is roughly half the duration of the observation, due to NuSTAR’s low-Earth orbit. We extracted source photons from a 30′′ circular region, centered on the source coordinates, and background photons from a 100′′ circular region on the same chip. The background is non-uniform across the detectors in this observation, so we position the background region as close as possible to the source region (we choose not to use an annular region, as it would overlap with the gap between chips). We combined the spectra from FPMA and FPMB using the addspec FTOOL. The spectrum is background-dominated over the full band, and RX J2317.8-4422 is only marginally detected at a 2.3 level. The 3 upper limit is 0.0013 counts s-1 which corresponds to a 3-79 keV flux of 9 W m-2. per detector. Due to the low number of counts we did not perform a spectral analysis of these data.
3 Results
3.1 X-ray and UV Variability
The upper panel of Figure 1 displays the long-term 0.2-2.0 keV light curve of RX J2317–4422 starting with the RASS observation in November 1990 (MJD 48208). RX J2317–4422 was only observed once again by ROSAT with the High Resolution Imager in May 1997 (MJD 50575). The observation appeared to be a factor of 2 fainter compared with the RASS observation (Grupe et al., 2001). However, this is within the normal variability range of an AGN. RX J2317–422 was not observed again by another X-ray observatory until May 2005 (MJD 53516) when it was observed by Swift as an X-ray calibration target. All Swift observations since May 2005 are listed in Table 1. It was only observed twice again as a fill-in target in April 2006 (Grupe et al., 2010) until we started revisiting RX J2317–4422 with further guest investigator (GI) fill-in programs to study the long-term X-ray and UV variability of AGN in general. Absorption/reddening corrected fluxes in the 0.3-10 keV band (see Sect. 2.1) and in all 6 UVOT filters of all Swift observations are listed in Table 3. Note that the observed X-ray band corresponds to 0.34 - 11.34 keV in the rest-frame. Due to the low redshift and relatively low reddening in the direction of the AGN no k-correction was applied. While it still appeared to be in its "normal" state during the observation on 2013-July 23, it dropped significantly by a factor of at least 8 by 2014 April/May where only a 3 upper limit was determined at a level of 2 W m-2. Another Swift observation in 2014 September suggested a drop by factor of 12 when compared with the last detection in 2013 July. This drop by a factor of 10 motivated us to trigger pre-approved XMM-Newton and NuSTAR observations. The flux levels of the two XMM-Newton observations in the 0.2-2.0 keV band are displayed as open triangles in Figure 1. The 0.3-10 keV fluxes during the XMM-Newton observations were about W m-2 and 2.5 W m-2, respectively. During both observations, the count rate in the Swift XRT was too low to obtain a detection. During most low-state observations Swift was unable to detect the AGN and only 3 upper limits were obtained. Nevertheless, we got Swift XRT detections several times including the most recent observation on 2018-May-27 and December-28 when it was found at a level of about W m-2 in the 0.3-10 keV band.
The UVOT W2 light curve is displayed in the lower panel of Figure 1. The light curves of the UVOT U, W1, M2, and W2 filters are shown in Figure 2. Table 3 also lists the mean, median and standard deviation values of the fluxes in the 0.3-30 keV band as well as all 6 UVOT filters. Clearly the strongest variability can be seen in X-rays, while the variability in the UVOT filters is lower, but still significant. The standard deviation in magnitudes is about 0.15 mag in each filter. While the long-term as well as the Swift XRT and UVOT light curves suggest strong variability in RX J2317–4422, the short-term light curve obtained during the 100 ks XMM-Newton pn observation in November 2014 shows constant emission. The XMM-Newton pn light curve is shown in Figure 3 using a bin size of 2000s.


| ObsID | Segment | MJD | V | B | U | UVW1 | UVM2 | UVW2 | |
|---|---|---|---|---|---|---|---|---|---|
| 56630 | 003 | 53516.380 | 3.140.34 | — | — | — | 5.380.26 | — | — |
| 35310 | 001 | 53843.444 | 2.110.09 | 4.220.19 | 4.000.13 | 4.260.18 | 4.210.22 | 4.770.15 | 4.810.19 |
| 002 | 53845.340 | 0.440.13 | 4.430.28 | 4.250.19 | 4.450.22 | 4.430.28 | 4.690.17 | 4.780.21 | |
| 91650 | 001 | 56415.574 | 1.132 | 4.050.49 | 4.510.35 | 4.850.33 | 3.600.33 | 4.910.59 | 5.220.29 |
| 003 | 56496.413 | 1.710.12 | 4.660.24 | 4.570.17 | 4.960.22 | 4.710.28 | 5.140.17 | 5.160.21 | |
| 91886 | 001 | 56767.802 | 0.212 | — | 3.380.23 | 3.900.18 | 3.160.22 | — | 3.160.21 |
| 002 | 56778.760 | 0.202 | 3.240.38 | 3.650.23 | 3.700.26 | 3.320.28 | 3.560.25 | 3.390.21 | |
| 35310 | 004 | 56924.044 | 0.150.01 | 3.250.37 | 3.600.25 | 4.190.29 | 3.370.29 | 3.830.22 | 3.790.23 |
| 005 | 56950.594 | 0.372 | 4.040.38 | 3.540.25 | — | 3.410.28 | 4.130.25 | 3.870.23 | |
| 008 | 56959.955 | 0.512 | 4.050.46 | 4.710.32 | 4.120.33 | 3.740.33 | 4.370.30 | 3.830.25 | |
| 80853 | 001 | 56978.260 | 0.252 | 3.830.31 | 3.760.21 | 3.450.21 | 3.340.25 | 2.930.20 | 3.560.19 |
| 35310 | 009 | 57127.403 | 0.102 | 3.280.42 | 3.020.26 | 1.680.17 | 2.650.14 | 3.230.17 | 2.870.17 |
| 010 | 57253.889 | 0.110.07 | 4.380.36 | 4.090.23 | 4.590.26 | 3.850.53 | 4.460.22 | 4.120.21 | |
| 011 | 57258.917 | 0.120.08 | 4.330.32 | 4.000.21 | 4.370.26 | 3.900.28 | 4.500.20 | 3.790.19 | |
| 012 | 57483.920 | 0.0400.026 | 4.510.42 | 3.920.25 | 4.560.26 | 4.130.22 | 4.670.21 | 4.310.21 | |
| 013+014 | 57744.146 | 0.122 | 4.130.76 | 4.300.30 | 4.010.22 | 3.850.22 | 4.270.30 | 4.300.19 | |
| 93134 | 001+002 | 57865.375 | 0.382 | 3.71 1.01 | 3.420.44 | 3.790.40 | 3.040.30 | 3.660.27 | 3.330.23 |
| 35310 | 015 | 58265.351 | 0.0330.016 | 3.990.30 | 3.710.13 | 2.920.13 | 3.180.14 | 3.390.12 | 3.100.11 |
| 016 | 58480.326 | 0.0380.018 | 2.950.17 | 2.850.14 | 3.260.11 | 2.990.11 | 3.490.10 | 3.330.10 | |
| mean | 0.714 | 3.921 | 3.840 | 3.911 | 3.967 | 4.109 | 3.926 | ||
| median | 0.120 | 4.045 | 3.760 | 4.065 | 3.505 | 4.200 | 3.830 | ||
| standard deviation | 1.088 | 0.509 | 0.528 | 0.813 | 0.688 | 0.677 | 0.731 | ||
1All fluxes are given in units of 10-15 W m-2. The UVOT fluxes are corrected for reddening with =0.037 given by Schlegel et al. (1998). The X-ray fluxes are in the 0.3-10 keV range and are corrected for Galactic absorption Kalberla et al. (2005).
23 upper limit determined using the Bayesian method as described in Kraft et al. (1991).

3.2 X-ray spectral analysis
3.2.1 High State 1990-2013
During the RASS observation in 1990 November the X-ray spectrum in the 0.1-2.4 keV band appeared to be very steep with an energy spectral index of =2.50.8 (Grupe et al., 2001). This spectral slope is consistent with those obtained from the Swift observations in 2005 May and 2013 July with =2.340.35 and =2.340.29, respectively. All these observations indicate a very steep X-ray spectrum during the high state consistent with the AGN operating at a high ratio (see also Grupe et al., 2010).
In order to obtain a higher significance of the fit, we combined all Swift data during the high state from 2005 to 2013 which resulted in a total exposure time of 14.4 ks. Due to the relatively low number of counts (about 180) we did not bin the spectrum and instead applied Cash statistics (Cash, 1979) when fitting the data. All spectral fits were performed with the absorption parameter at z=0 fixed to the Galactic value. All spectral fit results are summarized in the upper part of Table 4.
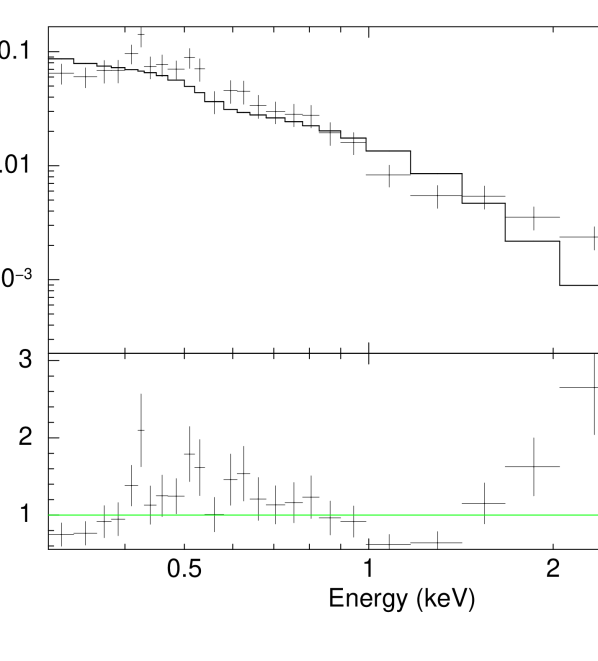
We started fitting the data with a simple absorbed power law model which resulted in a steep spectrum with a spectral index = 2.320.13. However this fit deviates strongly for energies above 1.5 keV as displayed in Figure 4 and the C-statistic value over the degrees of freedom is 225/171. Note that for display purposes we binned the spectrum shown here with 20 counts per bin. Next step was a fit with a combined blackbody plus power law spectrum. This model significantly improved the fit. We found a blackbody temperature of 99 eV and an underlying hard power law spectrum with =0.88. The C-stat value here is 169/169. The unfolded spectrum of this fit, again using for display purposes a binning of 20 counts per bin, is shown in Figure 5. Although this is a phenomenological model, it fits the spectrum quite well. What this model may suggest is the presence of an underlying starburst.
A deviation from a simple power law model is typically a sign of the presence of a partial covering absorber or X-ray reflection (Gallo, 2006). 111We checked the background level from this combined data set and the contribution of background even at higher energies is negligible. The source counts account for 96.6% of the total number of counts extracted at the source position. Next, we applied both a redshifted neutral partial covering absorber and an ionized partial covering absorber model. Both model fits resulted in similar C-stat values of 194/169 and 198/170, respectively. While the neutral pc models showed an absorption column density of 5.5 cm-2, the absorption column density of an ionized partially-covering absorber was cm-2. The ionization parameter was fixed to 10 (in units of or ). The underlying power law emission spectrum (=2.82) results in a flux in the 0.3-10 keV band of 3.5 W m-2.
Often reflection models also provide good solutions for spectra like this. Fitting with reflionx (Ross et al., 1999; Ross & Fabian, 2005) and the blurred accretion disc model kdblur did result in a good fit with a C-stat value of 175/173. The partial covering absorber models and the reflection model produce similar fit results.

3.2.2 Low State after 2013
Due to the low X-ray flux state combined with the small effective area of the Swift XRT and the relatively short exposure times, none of the Swift observations during the low state allowed any kind of spectral analysis. Fluxes were determined by the count rate to flux conversion factor described in section 2.1. The spectral information of RX J2317–4422 can be obtained only from the XMM-Newton observations in 2014 October and November. For the spectral analysis the absorption column density was set to the Galactic value and the results of all spectral fits are listed in Table 4. The low X-ray flux of RX J2317–4422 in combination with the detector noise in the EPIC pn and MOS cameras made the data above 2 keV significantly background dominated. Therefore we restricted our analysis of the XMM-Newton low state data to the 0.2-2.0 keV energy range. As a consequence, complex spectral models like partial covering absorber or reflection models could not be applied.
For the XMM-Newton spectral data analysis we use a combined fit to all pn and MOS spectra where we organized the spectra into two data groups by the October and November 2014 spectra. We linked the fit parameters together except the normalizations. All results of the spectral fits to the XMM-Newton spectra are summarized in Table 4. Due the the background domination of the data above 2 keV no complex spectral analysis appears to be reliable. There is simply no handle on the data at higher energies which define parameters required to describe the partial covering absorber and reflection models. The only model, besides the standard single power law model, that we applied additionally to the data, was the black body plus power law model which results in a good fit. This fit is slightly better than that of the single power law model (T-test with T-value = 10.89 and P=0.001). What is interesting to note is that the blackbody component remains basically constant between the October and November observations, while the power law component drops by a factor of about 2.
| Model | kT1 | cstat/dof or | ||||||
|---|---|---|---|---|---|---|---|---|
| High State, Swift, Combined 2005-2013 | ||||||||
| po | 2.320.14 | — | — | — | — | 2.42 | — | 225/171 |
| bb + po | 0.870.34 | 997 | — | — | — | 2.48 | 1.14 | 169/169 |
| zpcfabs * po | 2.740.20 | — | 5.4 | 0.87 | — | 1.73 | — | 194/169 |
| zxipcf * po | 2.82 | — | 13.7 | 0.95 | 10 | 4.47 | — | 198/170 |
| po + kdb * refl 5 | 1.37 | — | — | — | 220 | 1.09 | 1.44 | 175/173 |
| Low State, XMM-Newton , 2014-October-30 and November-17 | ||||||||
| 9.69 | ||||||||
| po | 2.650.16 | — | — | — | — | 5.55 | — | 202.7/173 |
| 1.44 | 7.94 | |||||||
| bb + po | 2.61 | 122 | — | — | — | 1.27 | 4.01 | 190/172 |
1kT given in units of eV
2The intrinsic absorption column density at the redshift of the AGN is given in units of cm-2. Note if no uncertainty is given for the covering fraction then it was fixed to the given value.
3 is the ionization parameter given in units of or .
4the Normalizations and for the first and second model are given in units of photons m-2 s-1 keV-1 at 1 keV. For the low state data, the first row corresponds to the October 2014 XMM-Newton data and the second row to the November 2014 spectra.
5po + reflionx * kdblur model. The energy index for the reflionx model was fixed to the energy index of the power law model. For the inner radius we assume a moderately rotating black hole with . For the kdblur model the emissivity index was fixed to 5.0 and the inclination angle to 30∘.
The 2014 November XMM-Newton observation was performed simultaneously with NuSTAR. However, due to the low flux in the NuStar 5-79 keV band we could only obtain a upper limit at a flux level of 9 W m-2. Assuming the power law model found from the XMM-Newton data with a spectral slope = 2.65, this corresponds to a flux in the 5-79 keV band of 4 W m-2, which is consistent with the 3 level derived from the NuSTAR data.
3.3 UVOT data
The UVOT W2 light curve is displayed in the lower panel of Figure 1 and it suggests significant variability in the UVOT filters. This variability may suggest color changes between different UVOT bands. We computed B-V, U-B, W2-U, and W2-W1 colors. The Spearman rank order correlation coefficients of the W2-U and W2-W1 colors are =0.63 and 0.56 with probabilities of a random distribution of P=0.015 and 0.028, respectively. A correlation analysis of the optical color shows that they are clearly uncorrelated.
Another question is, are the color changes in W2-U and W2-W1 colors correlated with the X-ray fluxes. Due to the small number of X-ray detections during the low state, this only allows a very limited analysis. Figure 6 displays the W2-U color vs. the 0.3-10 keV X-ray flux of RX J2317–4422. Although this plot suggests that the AGN has a blue UV spectrum when it is brighter in X-rays, due to the small number of data points any correlation analysis will be rather meaningless. Nevertheless we can apply a 22 contingency table. From these data we find that there is a 27% chance that the AGN is bright in X-rays and blue in the UV and a 73% chance that is it faint in X-rays and red in the UV. The chances of being faint in X-rays and blue in the UV and bright in X-rays and red in the UV are both 0.

3.4 Spectral Energy Distribution
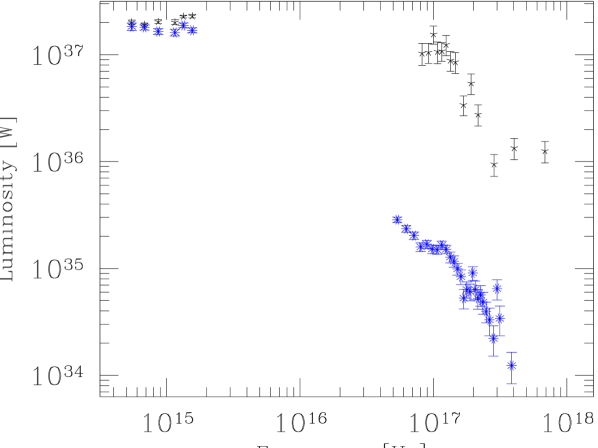
Figure 7 displays the spectral energy distributions during the high state seen in 2006 and the low state during the XMM-Newton and NuSTAR observation in November 2014. The high state is shown with the black stars and and is based on the Swift observations. The low state data from November 2014 are using the Swift UVOT in the optical/UV and the XMM-Newton EPIC pn data for the X-ray range.
The high state X-ray spectrum seen in RX J2317–4422 is very soft suggesting a high ratio. We went back to the original optical spectrum (Grupe et al., 2004) and re-calculated the black hole mass of RX J2317–4422 using the FWHM(H) and the luminosity at 5100Å as described in Kaspi et al. (2000). We found that in Grupe et al. (2004) the black hole mass was underestimated by a factor of two. We found that the black hole mass is about 7.5.
The optical to X-ray spectral slope 222=; Tananbaum et al. (1979) changes from = 1.45 during the high state in 2006 to =2.07 in the low state in November 2014. Given the luminosity density at 2500Å of log()=22.24 and following the -relation given in Grupe et al. (2010), the expected value is 1.36. The value during the high state is comparable with the expected value. The UV/Optical part of he SED as shown in Figure 7 appears to be rather flat and may suggest that the optical continuum has a significant host contribution, or is still dominated by the AGN which, however, suffers some extinction. The UV spectral slope =2.0 (Grupe et al., 2010) is rather red in particular for a NLS1. This may suggest intrinsic reddening and not a significant contamination by the host. As mentioned earlier, there are no obvious stellar absorption line features in the optical spectrum (Grupe et al., 2004) which also argues from reddening of the AGN emission rather than host galaxy contamination.
RX J2317–4422 is not detected in the Parkes-MIT-NRAO (PMN) radio survey at 4.85 GHz (Wright et al., 1994). Considering that the upper limit in the Southern survey is at 20 mJy (2 W m-2 Hz-1) and that the flux in the Swift UVOT B-band is of the order of 3.6 W m-2 or flux density of 0.5 mJy results in an upper limit of the radio loudness of R applying the definition by Kellermann et al. (1989).
4 Discussion
4.1 On the nature of the X-ray low-state of RX J2317–4422
While almost all AGN are variable in X-rays, drops by factors 100 or more are relatively rare. These strong changes, along with spectral complexity, provide us with important insights in the physics of the innermost central region of AGN. Variability and spectral complexity is often strongest in the class of NLS1 galaxies (review by Gallo, 2018), of which RX J2317–4422 is a member. The majority of (radio-quiet) AGN with dramatic flux changes has been explained by one of the following mechanisms:
-
•
A change in the accretion rate, for instance through an accretion disc instability or a tidal disruption event.
-
•
Changes in the effects of (relativistically blurred) reflection of coronal X-ray emission off the accretion disc.
-
•
Changes in (neutral or ionized) absorption along our line of sight, partially or fully covering the continuum source.
We now comment on (variants of) each of these mechanisms in application to RX J2317–4422.
4.1.1 TDE-like accretion event.
Most events of stellar tidal disruptions (TDEs) by SMBHs have been observed in non-active galaxies, and their X-ray emission rapidly fades away on the timescale of months to years (review by Komossa, 2017). Recently, several long-lasting, decade-long events have been identified (Lin et al., 2017), which share with RX J2317–4422 the spectral softness at high-state and evidence for near- or super-Eddington accretion. However, RX J2317–4422 has been in its bright state for decades, implausibly long for a TDE, and also shows a classical NLR, indicating long-lasting classical AGN activity.
4.1.2 Long-term changes in accretion rate.
On timescales of years or decades, changes in the accretion rate can lead to fading of the (X-ray and UV) continuum emission (e.g. Noda and Done, 2018; Dexter and Begelman, 2018; Lawrence, 2018; Ross et al., 2018, and references therein). In recent years, several such AGN have been found that seem to be slowly switching off, i.e., decreasing their accretion rates on the timescale of decades. The best of these cases show a systematic fading of their broad emission lines, implying a corresponding true intrinsic decrease in the ionizing (EUV) continuum emission (e.g. Denney et al., 2014). RX J2317–4422 likely does not fall in this category, since its X-ray light-curve does not show a slow fading, but a rather abrupt drop from a (long-lasting) high-state into a (still ongoing) deep low-state.
4.1.3 Reflection models.
When we see a strong hardening of the X-ray spectrum towards higher energy, a possible explanation is reflection of X-ray photons on the accretion disc (Ross et al., 1999; Ross & Fabian, 2005, e.g.,). Although these models can be successfully applied to the Swift high-state data, due to the dominating background in the XMM-Newton and NuSTAR observations during the low state, no conclusions can be drawn from these data. A deep long-duration observation with XMM-Newton, as recently carried out for IRAS 13224–3809 (Parker et al., 2017) would be required to break model degeneracies, and constrain the reflection (and any other model) components.
4.1.4 Absorption along our line of sight with or without starburst component.
Changes in our line of sight (cold or ionized) absorption are known to have strong effects on the observed soft X-ray spectra, and can therefore cause high-amplitude X-ray variability. High-amplitude absorption variability has been identified in intermediate-type Seyfert galaxies and BAL quasars, for instance (e.g. Gallagher et al., 2004; Risaliti et al., 2005; Bianchi et al., 2009). In several systems, simultaneous UV and X-ray absorption has been detected (e.g. Mkn 1048: Parker et al., 2014; Ebrero et al., 2016). In the extreme case of WPVS 007, an X-ray drop by a factor of several hundred was accompanied by extremely strong broad absorption line troughs in the UV (Grupe et al., 1995, 2013; Leighly et al., 2015). Gallo (2006) distinguished between two types of NLS1 X-ray spectra, “simple systems” where we have a relatively direct view onto their accretion disc with little spectral complexity, and “complex systems”. Jin et al. (2017) suggested that those are systems where our line of sight passes through a clumpy accretion-disc wind. RX J2317–4422 might be in the second class of NLS1 galaxies. We have tested, whether all X-ray variability of RX J2317–4422 can be due to absorption. For the combined high-state Swift data we derived a column density of about 5 cm-2. However, due to the low number of source counts above 2 keV during the low state, no parameters of the partial covering absorber could be determined reliably.
We have also tested, whether the soft X-ray emission during low-state can be due to an additional starburst component, which is barely detected during high-state, but becomes visible during low-state because of the faintness of the AGN emission. Such a model fits the low-state data well, and NLS1 galaxies are known to show strong starburst components (e.g. Sani et al., 2010). A (0.3-10) keV X-ray luminosity in the starburst component of W is then required, which is relatively luminous, but still a factor of 10 below the most X-ray luminous starbursts (e.g. Komossa et al., 2003).
Acknowledgements
We thank our referee, Chris Done, for useful comments and suggestions that improved this paper. We would like to thank Neil Gehrels and Brad Cenko for approving our ToO requests and the Swift team for performing the ToO observations of RX J2317–4422. We also want to thank our Morehead State University students Mason Bush, Chelsea Pruett, Sonny Ernst, and Taylor Barber for looking through the Swift data to find AGN in low X-ray flux states. This research has made use of the NASA/IPAC Extragalactic Database (NED) which is operated by the Jet Propulsion Laboratory, Caltech, under contract with the National Aeronautics and Space Administration. Based on observations obtained with XMM-Newton, an ESA science mission with instruments and contributions directly funded by ESA Member States and NASA. This research has made use of the XRT Data Analysis Software (XRTDAS) developed under the responsibility of the ASI Science Data Center (ASDC), Italy. ACF acknowledges ERC Advanced Grant 340442.
References
- Arnaud (1996) Arnaud, K. A., 1996, ASP Conf. Ser. 101: Astronomical Data Analysis Software and Systems V, 101, 17
- Ballo et al. (2008) Ballo, L.; Giustini, M.; Schartel, N.; Cappi, M.; Jimenez-Bailon, E.; Piconcelli, E.; Santos-Lleo, M.; Vignali, C., 2008, A&A, 483, 137
- Bianchi et al. (2009) Bianchi, S., et al., 2009, ApJ, 695, 781
- Brandt et al. (1995) Brandt, W.N., Pounds, K.A., & Fink, H., 1995, MNRAS, 273, L47
- Breeveld et al. (2010) Breeveld, A.A., et al., 2010, MNRAS, 406, 1687
- Burrows et al. (2005) Burrows, D., et al., 2005, Space Science Reviews, 120, 165
- Cardelli et al. (1989) Cardelli, J.A., Clayton, G.C., Mathis, J.S., 1989, ApJ, 345, 245
- Cash (1979) Cash, W., 1979, ApJ, 228, 939
- Crawley (2009) Crawley, M.J., 2009, The R Book, John Wiley & Sons, Chichester, England
- Denney et al. (2014) Denney, K.D., et al., 2014, ApJ, 796, 134
- Dexter and Begelman (2018) Dexter, J., Begelman, M., 2018, MNRAS, 483, L17
- Ebrero et al. (2016) Ebrero, J., Kriss, G.A., Kaastra, J.S., Ely, J.C., 2016, A&A, 586, 72
- Fabian et al. (2012) Fabian, A.C., et al., 2012, MNRAS, 419, 116
- Gallagher et al. (2004) Gallagher, S.C., et al. 2004, ApJ, 603, 425
- Gallo (2006) Gallo, L.C., 2006, MNRAS, 368, 479
- Gallo et al. (2011) Gallo, L.C., Grupe, D.; Schartel, N.; Komossa, S.; Miniutti, G.; Fabian, A. C.; Santos-Lleo, M., 2011, MNRAS, 412, 161
- Gallo et al. (2013) Gallo, L.C., et al. 2013, MNRAS, 438, 1191
- Gallo et al. (2015) Gallo, L.C., et al., 2015, MNRAS, 446, 633
- Gallo et al. (2018) Gallo, L.C., Blue, D,M., Grupe, D., Komossa, S., & Wilkins, D.R., , 2018, MNRAS, 478, 2557
- Gallo (2018) Gallo, L., 2018, Proceedings of Science, PoS (NLS1-2018) 034
- Gehrels et al. (2004) Gehrels, N., et al., 2004, ApJ, 611, 1005
- Grupe (2004) Grupe, D., 2004, AJ, 127, 1799
- Grupe et al. (1995a) Grupe, D., et al., 1995a, A&A, 299, L5
- Grupe et al. (1995) Grupe, D., Beuermann, K., Mannheim, K., Thomas, H.-C., de Martino, D., & Fink, H.H., 1995, A&A, 300, L21
- Grupe et al. (1998) Grupe, D., Beuermann, K., Thomas, H.-C., Mannheim, K., & Fink, H.H., 1998, A&A 330, 25
- Grupe et al. (1999) Grupe, D., Beuermann, K., Mannheim, K., & Thomas, H.-C., 1999, A&A, 350, 805
- Grupe et al. (2000) Grupe, D., Leighly, K.M., Thomas, H.-C., & Laurent-Muehleisen, S.A., 2000, A&A, 356, 11
- Grupe et al. (2001) Grupe, D., Thomas, H.-C., & Beuermann, K., 2001, A&A, 367, 470
- Grupe et al. (2004) Grupe, D., Wills, B.J., Leighly, K.M., & Meusinger, H., 2004, AJ, 127, 156
- Grupe et al. (2008a) Grupe, D., Komossa, S., Gallo, L.C., Fabian, A.C., Larsson, J., Pradhan, A.K., Xu, D., & Miniutti, G., 2008, ApJ, 681, 982
- Grupe et al. (2008b) Grupe, D., Leighly, K.M., & Komossa, S., 2008, AJ, 136, 2343
- Grupe et al. (2010) Grupe, D., Komossa, S., Leighly, K.M., & Page, K.L., 2010, ApJS, 187,64
- Grupe et al. (2012) Grupe, D., Komossa, S., Gallo, L.C., Longinotti, A.L., Fabian, A.C., Pradhan, A.K., Gruberbauer, M, & Xu, D., 2012, ApJS, 199, 28
- Grupe et al. (2013) Grupe, D., Komossa, S., Scharwächter, J., Dietrich, M., Leighly, K.M., Lucy, A., & Barlow, B.N., 2013, AJ, 146, 78
- Grupe et al. (2015) Grupe, D., Komossa, S., & Saxton, R., 2015, ApJ, 803, L28
- Guainazzi et al. (1998) Guainazzi, M., et al., MNRAS, 301, L1
- Harrison et al. (2013) Harrison, F.A., et al., 2013, ApJ, 770, 103
- Hill et al. (2004) Hill, J.E., et al., 2004, SPIE, 5165, 217
- Jansen et al. (2001) Jansen, F., et al., 2001, A&A, 365, L1
- Jin et al. (2017) Jin C., Done C., Ward M., Gardner E., 2017, MNRAS, 471, 706
- Kalberla et al. (2005) Kalberla, P.M.W., et al., 2005, A&A, 440, 775
- Kaspi et al. (2000) Kaspi, S., Smith, P.S., Netzer, H., Moaz, D., Jannuzi, B.T., & Giveon, U., 2000, ApJ, 533, 631
- Kellermann et al. (1989) Kellermann, K.I., Sramek, R., Schmidt, M., Shaffer, D.B., & Green, R., 1989, AJ, 98, 1195
- Kraft et al. (1991) Kraft, R.P., Burrows, D.N., & Nousek, J.A., 1991, ApJ, 374, 344
- Kollatschny et al. (2015) Kollatschny, W.; Schartel, N.; Zetzl, M.; Santos-Lleo, M.; Rodriguez-Pascual, P. M.; Ballo, L., 2015, A&A, 577, 1
- Kollatschny et al. (2016) Kollatschny, W.; Schartel, N.; Zetzl, M.; Santos-Lleo, M.; Rodriguez-Pascual, P. M.; Ballo, L.; Talavera, A., 2016, A&A, 585, 18
- Komossa & Bade (1999) Komossa, S.; Bade, N., 1999, A&A, 343, 775
- Komossa & Fink (1997) Komossa, S.; Fink, H., 1997, A&A, 327, 483
- Komossa et al. (2003) Komossa, S., et al., 2003, ApJ, 582, L15
- Komossa et al. (2014) Komossa, S.; Grupe, D.; Saxton, R.; Gallo, L., 2014, PoS(SWIFT 10)143
- Komossa (2017) Komossa, S., 2017, AN, 338, 256
- Komossa et al. (2017) Komossa, S.; Grupe, D.; Schartel, N.; Gallo; L., Gomez, J.L.; et al., 2017, IAUS, 324, 168
- Lawrence (2018) Lawrence, A., 2018, NatAs, 2, 102
- Laor (1991) Laor, A., 1991, ApJ, 376, 90
- Leighly et al. (2009) Leighly, K.M., Hamann, F, Casebeer, D.A., & Grupe, D., 2009, ApJ, 701, 176
- Leighly et al. (2015) Leighly, K.M., Cooper, E., Grupe, D., Terndrup, D.M., & Komossa, S., 2015, ApJ, 809, L13
- Lin et al. (2017) Lin, D., et al., 2017, NatAs, 1, 33
- Magdziarz & Zdziarski (1995) Magdziarz, A., & Zdziarski, A.A., 1995, MNRAS, 273, 837
- Mason et al. (2001) Mason, K.O., et al., 2001, A&A, 365, L36
- Mizumoto et al. (2014) Mizumoto, M., et al., 2014, PASJ, 66, 122
- Noda and Done (2018) Noda, H., Done, C., 2018, MNRAS, 480, 3898
- Park et al. (2006) Park, T., Kashyap, V.L., Siemiginowska, A., van Dyk, D.A., Zezas, A., Heinke, C., & Wargelin, B.J., 2006, ApJ, 652, 610
- Parker et al. (2014) Parker, M.L., Schartel, N., Komossa, S., Grupe, D., Santos-Lleó, M., Fabian, A.C., & Mathur, S., 2014, MNRAS, 445, 1039
- Parker et al. (2016) Parker, M.L., et al., 2016, MNRAS, 461, 1927
- Parker et al. (2017) Parker, M., et al., 2017, Nature, 543, 83
- Poole et al. (2008) Poole, T.S., et al., 2008, MNRAS, 383, 627
- Poutanen & Svensson (1996) Poutanen, J., & Svensson, R., 1996, ApJ, 470, 249
- Risaliti et al. (2005) Risaliti, G., et al., 2005, ApJ, 623, L93
- Roming et al. (2005) Roming, P.W.A., et al., 2005, Space Science Reviews, 120, 95
- Roming et al. (2009) Roming, P.W.A., et al., 2009, ApJ, 690, 163
- Ross & Fabian (2005) Ross, R.R. & Fabian, A.C., 2005, MNRAS, 358, 211
- Ross et al. (1999) Ross, R., Fabian, A.C., & Young, A.J., 1999, MNRAS, 306, 461
- Ross et al. (2018) Ross, N., et al., 2018, arXiv1805.06921
- Sani et al. (2010) Sani, E., et al., 2010, MNRAS, 403, 1246
- Saxton et al. (2008) Saxton, R.D., Read, A.M., Esquej, P., Freyberg, M.J., Altieri, B., Bermejo, D., 2008, A&A, 480, 611
- Schartel et al. (2007) Schartel, N.; Rodriguez-Pascual, P. M.; Santos-Lleo, M.; Ballo, L.; Clavel, J.; Guainazzi, M.; Jimenez-Bailon, E.; Piconcelli, E., 2007, A&A, 474, 431
- Schartel et al. (2010) Schartel, N., Rodriguez-Pascual, P. M., Santos-Lleo, M., Jimenez-Bailon, E., Ballo, L.; Piconcelli, E. 2010, A&A, 512, 75
- Schlegel et al. (1998) Schlegel, D. J., Finkbeiner, D. P., & Davis, M. 1998, ApJ, 500, 525
- Schwope et al. (2000) Schwope, A., et al., 2000, AN, 321, 1
- Strüder et al. (2001) Strüder, L., et al., 2001, A&A, 365, L18
- Tananbaum et al. (1979) Tananbaum, H., et al., 1979, ApJ, 234, L9
- Turner et al. (2001) Turner, M.J., et al., 2001, A&A, 365, L27
- Turner et al. (2018) Turner, T.J.; Reeves, J.N.; Braito, V.; Costa, M., 2018, MNRAS, 476, 1258
- Voges et al. (1999) Voges, W., Aschenbach, B., Boller, T., et al., 1999, A&A, 349, 389
- Wilkins et al. (2015) Wilkins, D.R., Gallo, L.C., Grupe, D., Bonson, K., Komossa, S., & Fabian, A.C., 2015, MNRAS, 454, 4440
- Wright et al. (1994) Wright, A.E., Griffith, M.R., Burke, B.F., & Ekers, R.d, 1994, ApJS, 91, 111
- Wright (2006) Wright, E.L., 2006, PASP, 118, 1711
- Yamasaki et al. (2016) Yamasaki, H.; Mizumoto, M.; Ebisawa, K.; Sameshima, H., 2016, PASJ, 68, 80
- Zetzl et al. (2018) Zetzl, M., Kollatschny, W., Ochmann, M., Grupe, D., Haas, M., Ramolla, M., Chelouche, D., Kaspi, S., & Schartel, N., 2018, A&A, 618, 83
- Zhang et al. (2017) Zhang, F.; Yu, Q.; Lu, Y., 2017, ApJ, 845, 88