An accreting supermassive black hole irradiating molecular gas in NGC 2110
Abstract
The impact of Active Galactic Nuclei (AGN) on star formation has implications for our understanding of the relationships between supermassive black holes and their galaxies, as well as for the growth of galaxies over the history of the Universe. We report on a high-resolution multi-phase study of the nuclear environment in the nearby Seyfert galaxy NGC 2110 using the Atacama Large Millimeter Array (ALMA), Hubble and Spitzer Space Telescopes, and the Very Large Telescope/SINFONI. We identify a region that is markedly weak in low-excitation CO emission from cold molecular gas, but appears to be filled with ionised and warm molecular gas, which indicates that the AGN is directly influencing the properties of the molecular material. Using multiple molecular gas tracers, we demonstrate that, despite the lack of CO line emission, the surface densities and kinematics of molecular gas vary smoothly across the region. Our results demonstrate that the influence of an AGN on star-forming gas can be quite localized. In contrast to widely-held theoretical expectations, we find that molecular gas remains resilient to the glare of energetic AGN feedback.
1 Introduction
Stars form exclusively in the cold, dense molecular interstellar medium (ISM; Kennicutt, 1989; Bigiel et al., 2008). Active Galactic Nuclei (AGN) alter the excitation and chemistry of cold molecular gas, an important pathway that can suppress future star formation in galaxies (Sternberg et al., 1994; Usero et al., 2004; Krips et al., 2008) and establish a co-evolutionary connection between black hole and galaxy growth (Alexander & Hickox, 2012; Kormendy & Ho, 2013; Heckman & Best, 2014). Molecular spectroscopy has uncovered indirect evidence that AGN can alter central molecular gas, usually from the enhanced intensity of the rotational lines of the HCN and HCO+ molecules in active nuclei (Kohno et al., 2003; Usero et al., 2004; Krips et al., 2011; Kohno et al., 2008; Izumi et al., 2013; García-Burillo et al., 2014; Querejeta et al., 2016; Imanishi et al., 2016). However, conditions unrelated to the AGN can also boost these lines, such as high gas densities, high molecular abundances, and infrared pumping (Sternberg et al., 1994; Izumi et al., 2013, 2016).
Here we present evidence for localised transformation of molecular gas through direct impact from the AGN’s radiation field in the nearby Seyfert 2 galaxy NGC 2110 (luminosity distance Mpc, km s-1). In Section 2, we present the various high-resolution and ancillary datasets used in this work, followed by an imaging and spectroscopic analysis, including a modeling of molecular lines, that reveals the interaction and its properties.
2 Observations and data preparation
Table 1 summarises the multi-wavelength data used for this study. Unless otherwise specified, we employed standard pipelines to reduce these data, adopting parameters recommended by the respective observatories. The various images used in this work are brought together for context in Figure 1.
2.1 ALMA spectroscopy
From the reduced ALMA dataset, we used CLEAN to generate a 1mm continuum map and a CO 21 cube with a velocity resolution of 5 km s-1, both with a common restoring beam of (PA of ). We resampled these maps to square spaxels for our final measurements.
We obtained a CO 21 map by integrating the cube in velocity across a 900 km s-1 window centred on the systemic velocity of the galaxy (Figure 1a). We also measured CO 21 kinematics directly from the cube by fitting a single gaussian to the line in each spaxel with an integrated S/N , using the Python package LMFIT.
2.2 Optical and near-infrared (NIR) HST imaging
We used narrow-band images (FR680P15) covering the H and [N II] emission line complex from which we scaled and subtracted an associated line-free optical broad-band image (F791W), to generate a pure emission line map of the circumnuclear region (Figure 1a, Figure 3).
We produced a color map (Figure 1c) by dividing the F791W image by the deep NIR image (F200N). The smooth stellar light profile of NGC 2110 makes the NIR image an ideal backdrop for the dust features that stand out in the optical. However, the nucleus of NGC 2110 emits continuum at 2 m from hot nuclear dust ( K) that is invisible at optical wavelengths (Burtscher et al., 2015). This produces a nuclear red excess in the color map of the size of the PSF of NIR image (FWHM ). This region of anomalous color is disregarded in our analysis.
| Telescope/Instrument | Filter/Band | Program ID |
|---|---|---|
| ALMA | Band 6 | 2012.1.00474.S |
| HST/WFPC2 | FR680P15 | 8610 |
| HST/WFPC2 | F791W | 8610 |
| HST/NICMOS (NIC3) | F200N | 7869 |
| VLT/SINFONI (AO) | K | 086.B-0484(A) |
| VLT/SINFONI (AO) | J | 060.A-9800(K) |
| Spitzer/IRS | SH+LH | AOR: 4851456 |
2.3 VLT/SINFONI integral field unit (IFU) spectroscopy
Using a custom pipeline, we reduced both SINFONI datasets to cubes with a plate scale of to take full advantage of the resolution offered by Adaptive Optics (AO).
We used the K-band cube to measure the strength and kinematics of the H2 1–0 S(1) line at 2.12 m, modelled in each spaxel as a single gaussian with an underlying linear continuum. A telluric residual from the reduction, masked appropriately in these fits, prevented accurate line measurements in a few spaxels immediately around the continuum-bright nucleus. The apparent central hole in the H2 S(1) maps of Figures 1b & 5 are the consequence of this: the measurements in those spaxels have been excluded from any analysis.
From the J-band cube, we assessed the spatial structure of the [Fe II] 1.25 m emission line (Figure 3). We fit this line using the same procedure as the 2.12 m H2 S(1) line, but without the need to mask the central spaxels.
2.4 Image registration and astrometry
The ALMA are astrometrically calibrated to the International Celestial Reference System (ICRS) with an accuracy mas. We have adopted the VLA radio core as the coordinates of the nucleus (R.A.(J2000) 5:52:11.379, Dec.(J2000) -7:27:22.52), and verified that it lies within 30 mas of the peak of the unresolved nuclear core at 1 mm.
The HST images have accurate relative astrometry, but their absolute astrometry is noticeably incorrect. We derived a simple shift correction to the astrometric frame of the optical and NIR continuum images based on the difference between the centroidal positions and the absolute GAIA positions of two stars that lie within 20” of the galaxy centre. We visually verified that the peak of the NICMOS image lines up within 50 milliarcseconds of the radio nuclear position after we applied these astrometric corrections.
We obtained NIR continuum maps directly from the SINFONI cubes, both of which show clear peaks. We registered the SINFONI cubes by tying the centroids of the continuum maps to the radio nuclear position. The relative astrometry of SINFONI across its small field-of-view (FoV) is accurate enough for our purposes.
2.5 Spitzer/IRS high-resolution spectroscopy
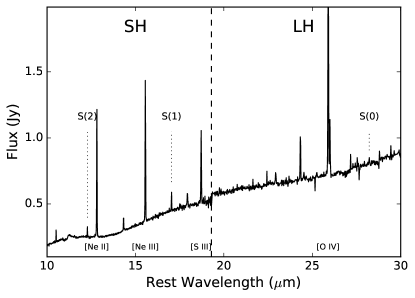
We downloaded fully reduced, background-subtracted, optimally-extracted mid-infrared (MIR) spectra of NGC 2110 from the CASSIS value-added database (Figure 2).
We measured the fluxes of the MIR molecular hydrogen (H2) 0–0 rotational lines at 28.2 m [S(0)], 17.0 m [S(1)], and 12.3 m [S(2)], modeling each line as the combination of a single gaussian profile and an underlying linear continuum. The S(1) and S(2) lines are both well-detected with S/N , while the S(0) line is marginally-detected with a S/N.
The spectra from CASSIS are extracted following the spatial profile of the nuclear point source. The S(1,2) lines from the Short-High module (FWHM of – ) are extracted over an area close to the SINFONI FoV, so aperture mismatch does not drastically affect our comparisons of these lines to the integrated H2 1–0 line emission (Section 3.2). The PSF in the Long-High module at the S(0) line is considerably larger (FWHM of ), and covers almost all of the detected CO emission seen in the ALMA maps.
3 Direct evidence for AGN feedback on molecular gas in NGC 2110
3.1 A localised lack of cold molecular gas emission
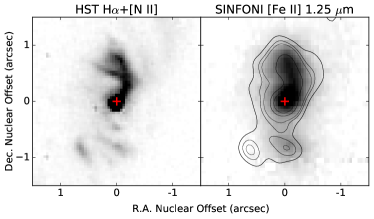
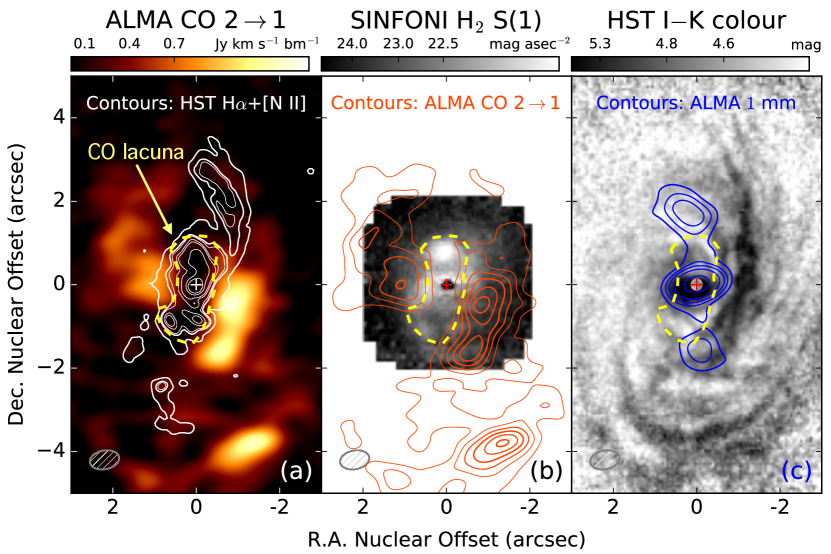
Figure 1a shows the ALMA CO 21 map in the centre of NGC 2110. This emission is distributed in an inhomogeneous spiral pattern suggestive of a circum-nuclear disc. Many of the bright arms of the CO disc are aligned with dark dust lanes seen in the HST color map (Figure 1c). For example, the brightest CO emission west of the nucleus is co-spatial with the dusty spiral arm on the near side of the galaxy (e.g., Section 6 of Rosario et al., 2010). Bordering this arm, one finds a conspicuous lack of CO emission in an extended linear structure passing through the nucleus at PA , particularly within a few arcseconds of the nucleus, where it bisects a region of high CO surface brightness, but it also extends to the SE and NW of the nucleus. Henceforth, we use the term “lacuna” to identify this feature.
The lacuna is well-resolved, and therefore unlikely to arise from CO 21 line absorption against the nuclear mm continuum in the galaxy (Tremblay et al., 2016), which is dominated by the well-known radio jet (compare blue contour in Figure 1c to VLA 3.6 cm map in Figure 7 of Nagar et al., 1999). NGC 2110 does not display a well-defined bi-symmetric pattern (; grand design spiral or stellar bar), so the separation of the two peaks of CO emission on either side of the lacuna cannot be easily attributed to stalling at an Inner Lindblad Resonance, as has been noted in some barred galaxies (Kenney et al., 1992).
An examination of other excited ISM phases reveals a more intimate connection to the lacuna. The 2.12 m H2 1–0 S(1) line, produced by hot excited molecular hydrogen, is located almost completely within the region (Figure 1b). A similar anticorrelation between hot and cold molecular phases has been noted in other systems (e.g. Davies et al., 2004, 2014; Mezcua et al., 2015; Espada et al., 2017). Over the CO 21 map in Figure 1a, we have overlaid the contours from the H+[N II] emission line map. Studies have established this gas is ionised either by photoionisation from nuclear ultra-violet and X-ray light, or via shocks from a fast wind with velocities of several 100 km s-1 (Ferruit et al., 1999; Rosario et al., 2010; Schnorr-Müller et al., 2014). The narrow bi-polar shape may be due to the anisotropic illumination of the circum-nuclear disk by the AGN (e.g., Figure 7 of Rosario et al., 2010).
Figure 1a reveals a close spatial association between the CO lacuna and the AGN-ionised emission line gas. The two structures are highly co-spatial, and the CO emission is noticeably weaker along the axis of the ionised gas. Within an arcsecond of the nucleus, the inner edges of the lacuna are defined by bright CO features which mirror the outer edges of the emission line region.
The cold, dusty gas that produces CO 21 could potentially shape the observed optical emission line structure through selective extinction, resulting in an apparent anti-correlation between the two phases. We test this by examining a map of the 1.25 m [Fe II] line, which is also excited by the AGN, but is less extinguished by dust than H+[N II]. The similarity of the two maps (Figure 3) confirms that the intrinsic structure of the AGN-ionised region is accurately represented by the contours in Figure 1a. NIR hydrogen recombination lines, such as Br at 2.17 m, also share the same basic size and structure (Diniz et al., 2015).
Interestingly, the HST color map (Figure 1c) also reveals considerable dusty gas within the lacuna which is not visible in CO 21. At larger nuclear distances, the ionised gas traces spiral features visible in the HST dust map, yet the CO emission here also remains weak.
3.2 Associated enhancement in warm molecular gas emission
Fundamental insight into the nature of the lacuna comes from the modeling of the molecular line sequence of warm H2 from Spitzer/IRS spectroscopy.
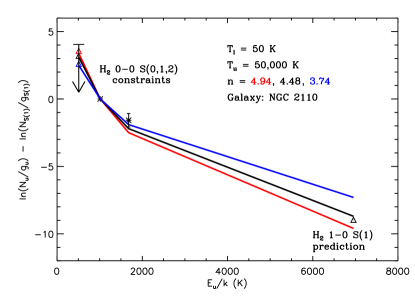
In the complex environment of a galaxy nucleus, a few discrete temperature components do not adequately describe the excitation of H2 gas. Adopting the approach of Togi & Smith (2016), we assume a uniform power law model of the distribution of H2 temperatures, with the form dN T-n dT, where dN is the column density of molecules in the temperature range T—T+dT. The two free parameters are the power law index and the lower temperature Tℓ respectively. The upper temperature of the distribution is fixed at K, though realistically the fraction of molecular mass with temperatures a few 1000 K is negligible.
Figure 4 shows an H2 excitation diagram that illustrates the constraints offered by the measured H2 rotational lines (including limits), and the associated uncertainties on the power law index. In the diagram, we plot the column density of molecules populated by the upper level of a transition (Nu) divided by its statistical weight (gu), against the energy level of the transition (Eu). We follow the custom of normalising the excitation to the 0–0 S(1) line (Togi & Smith, 2016). Extrapolating the power-law model to temperatures K gives an estimate of the flux of the 1–0 S(1) line at 2.12 m, which also serves as a constraint. The hot H2 gas that emits this line is a very small fraction (typically %) of the total molecular mass (Mmol), therefore this extrapolation is strictly contingent on the continuity of the power law distribution of temperatures beyond several 100 K. The similarity of the rotational and vibrational temperatures derived from NIR H2 lines implies that even the hot molecular material is in thermal equilibrium (Diniz et al., 2015), lending some support to this assumption.
Fixing the model to the formally measured flux of the S(0) line, we obtain (black line in Figure 4). This value is towards the upper end of the range found among star-forming galaxies in the Spitzer Infrared Nearby Galaxies Survey (Togi & Smith, 2016). Such a shallow temperature distribution arises from a higher mass fraction of warm H2 than typically found in galaxy environments. Considering temperatures as low as K to include the cold component that emits CO 21, we calculate M M⊙, including the contribution of helium and heavier elements
From Figure 4, it is clear that the adopted strength of the 0–0 S(0) line strongly influences the determination of and therefore the final estimate of Mmol. A nominal uncertainty of 0.3 dex for the line flux implies a mass in the range of – M⊙. The estimated mass is correlated with : a larger proportion of molecules at high temperatures (lower ) results in a lower estimate of Mmol. In addition, the S(0) constraint should be formally considered an upper limit since the aperture used for the measurement of this line covers a substantially larger area than the lacuna itself; the arrow in Figure 4 shows the equivalent 3 limit on the line. Therefore, the molecular mass associated with the lacuna could be even smaller than the range calculated above.
However, in this regard, the 2.12 m 1–0 S(1) provides a measure of discriminatory power. Figure 4 shows that a single power-law model tied to the formal flux of the S(0) line can reproduce the fluxes measured in all four H2 lines quite well. This suggests that the S(0) line flux is not very extended, but mostly concentrated within the lacuna and its immediate surroundings.
We can also estimate the total molecular gas mass directly from the CO 21 line over the same region ( Jy km s-1from a 4” circular aperture centered on the nucleus). Following Solomon & Vanden Bout (2005):
| (1) |
assuming a certain CO-to-H2 conversion factor () and a CO 10 to CO 21 brightness temperature ratio (). Taking and in the range of 1.5 – 3, consistent with observations of the centers of nearby galaxies (Sandstrom et al., 2013), we obtain M M⊙. This is considerably lower than Mmol estimated from the MIR H2 lines.
We postulate that the molecular mass invisible in CO 21 has been heated beyond the temperature at which it efficiently emits low-order CO lines, and this material is concentrated in the lacuna and shares the spatial distribution of the NIR H2 S(1) line, a circular region of 0.34 kpc2. From the difference M⊙, we infer a molecular gas surface density of 650 M⊙ pc-2. If we treat the S(0) line as a formal limit, and take M⊙, at the low end of the estimated range, the surface density drops to 180 M⊙ pc-2. These calculations may be compared to the molecular gas surface density of – M⊙ pc-2 inferred using Equation 1 in the bright CO knots around the edges of the lacuna.
The similarity of these two estimates, certainly within the systematic uncertainties of our modeling, suggests that the central molecular disk extends into the lacuna, despite its apparent CO deficiency.
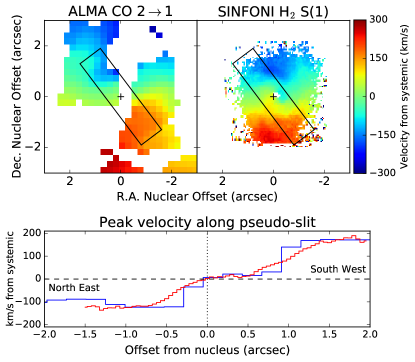
Additional support comes from the comparison of the two-dimensional velocity fields of the CO 21 line and the H2 1–0 S(1) line (Figure 5). Despite differences in the temperature and excitation of these molecular species, both lines independently trace an inclined rotating disc with the same strong kinematic asymmetry and non-circular motions as have been found previously from ionised gas studies (González Delgado et al., 2002; Ferruit et al., 2004; Schnorr-Müller et al., 2014; Diniz et al., 2015). From the continuity in the rotation fields of the cold and warm molecular gas, we infer that these two phases are connected and share the same circum-nuclear dynamics.
3.3 AGN feedback suppresses CO 21 emission
Based on the evidence developed above, the most likely explanation for the CO lacuna is that the energy liberated by the central AGN is directly influencing the molecular gas within the region and actively suppressing the emission of the CO 21 line. This “AGN feedback” can proceed in two possible ways. Strong far-ultraviolet and X-ray radiation from the AGN penetrates past the ionised outer layers of dense clouds in the lacuna, heating the molecular gas within. This alters its chemistry, while photo-excitation and dissociation of CO suppresses the emission of the CO 21 line. Alternatively, slow shocks ( km s-1) arising from the interaction between molecular gas and an AGN wind or radio jet depletes CO while boosting the emission of the warm molecular hydrogen lines. The molecular gas diagnostics currently available do not strongly discriminate between these mechanisms. The relative strengths of the rotational and ro-vibrational H2 lines (Rodríguez-Ardila et al., 2005; Diniz et al., 2015) can be achieved with models that feature either shock and X-ray excitation (Maloney et al., 1996; Rigopoulou et al., 2002; Flower & Pineau Des Forêts, 2010).
However, the entire optical and NIR line spectrum of NGC 2110, including the warm molecular lines, can be self-consistently reproduced by photoionisation of metal-rich dusty gas ( the solar metal abundance) by a nuclear source with the known power of the AGN (Rosario et al., 2010; Dors et al., 2012). In light of this, the close relationship between the structure of the ionised gas, the warm H2, and the CO lacuna supports radiative feedback as the principal cause for the transformation of the molecular gas.
Regardless of the primary process that suppresses the CO emission, our study concludes that an AGN can directly influence the local emissive and thermal properties of circum-nuclear molecular gas. This is the first time such a strong association has been noted with such clarity. Querejeta et al. (2016) have reported a similar connection in M51, though the conclusion is limited by the resolution of their CO data. In NGC 1068, the archetypical local Seyfert, the CO emission appears to be decoupled from its well-known ionisation cone (e.g., Figure 6 in García-Burillo et al., 2014). NGC 5643 may show some evidence in an extended arm of CO emission intersecting the ionisation cone (e.g., Figure 1 in Alonso-Herrero et al., 2018).
An important corollary worth highlighting is that such interaction could be quite localised. There is considerable molecular material in the vicinity of the nucleus of NGC 2110 which remains free of any obvious nuclear impact. Even within the lacuna, we find that molecular material can remain resilient to the mechanical effects of radiation pressure or AGN winds. This has important implications for the role of AGN feedback in regulating and suppressing star-formation in galaxies. NGC 2110 will serve as a valuable laboratory to explore this key process that underpins our modern theoretical view of galaxy evolution.
References
- Alexander & Hickox (2012) Alexander, D. M., & Hickox, R. C. 2012, New A Rev., 56, 93
- Alonso-Herrero et al. (2018) Alonso-Herrero, A., Pereira-Santaella, M., García-Burillo, S., et al. 2018, ApJ, 859, 144
- Bigiel et al. (2008) Bigiel, F., Leroy, A., Walter, F., et al. 2008, Astron. J., 136, 2846
- Burtscher et al. (2015) Burtscher, L., Orban de Xivry, G., Davies, R. I., et al. 2015, A&A, 578, A47
- Davies et al. (2004) Davies, R. I., Tacconi, L. J., & Genzel, R. 2004, ApJ, 602, 148
- Davies et al. (2014) Davies, R. I., Maciejewski, W., Hicks, E. K. S., et al. 2014, ApJ, 792, 101
- Diniz et al. (2015) Diniz, M. R., Riffel, R. A., Storchi-Bergmann, T., & Winge, C. 2015, MNRAS, 453, 1727
- Dors et al. (2012) Dors, Jr., O. L., Riffel, R. A., Cardaci, M. V., et al. 2012, MNRAS, 422, 252
- Espada et al. (2017) Espada, D., Matsushita, S., Miura, R. E., et al. 2017, ApJ, 843, 136
- Ferruit et al. (2004) Ferruit, P., Mundell, C. G., Nagar, N. M., et al. 2004, Mon. Not. Royal Astron. Soc., 352, 1180
- Ferruit et al. (1999) Ferruit, P., Wilson, A. S., Whittle, M., et al. 1999, ApJ, 523, 147
- Flower & Pineau Des Forêts (2010) Flower, D. R., & Pineau Des Forêts, G. 2010, MNRAS, 406, 1745
- García-Burillo et al. (2014) García-Burillo, S., Combes, F., Usero, A., et al. 2014, Astron. Astrophys., 567, A125
- González Delgado et al. (2002) González Delgado, R. M., Arribas, S., Pérez, E., & Heckman, T. 2002, ApJ, 579, 188
- Heckman & Best (2014) Heckman, T. M., & Best, P. N. 2014, Ann. Rev. Astro. Astrophy., 52, 589
- Imanishi et al. (2016) Imanishi, M., Nakanishi, K., & Izumi, T. 2016, AJ, 152, 218
- Izumi et al. (2013) Izumi, T., Kohno, K., Martín, S., et al. 2013, PASJ, 65, 100
- Izumi et al. (2016) Izumi, T., Kohno, K., Aalto, S., et al. 2016, ApJ, 818, 42
- Kenney et al. (1992) Kenney, J. D. P., Wilson, C. D., Scoville, N. Z., Devereux, N. A., & Young, J. S. 1992, ApJ, 395, L79
- Kennicutt (1989) Kennicutt, Jr., R. C. 1989, Astrophys. J., 344, 685
- Kohno et al. (2003) Kohno, K., Ishizuki, S., Matsushita, S., Vila-Vilaró, B., & Kawabe, R. 2003, PASJ, 55, L1
- Kohno et al. (2008) Kohno, K., Nakanishi, K., Tosaki, T., et al. 2008, Ap&SS, 313, 279
- Kormendy & Ho (2013) Kormendy, J., & Ho, L. C. 2013, ARA&A, 51, 511
- Krips et al. (2008) Krips, M., Neri, R., García-Burillo, S., et al. 2008, Astrophys. J., 677, 262
- Krips et al. (2011) Krips, M., Martín, S., Eckart, A., et al. 2011, ApJ, 736, 37
- Maloney et al. (1996) Maloney, P. R., Hollenbach, D. J., & Tielens, A. G. G. M. 1996, ApJ, 466, 561
- Mezcua et al. (2015) Mezcua, M., Prieto, M. A., Fernández-Ontiveros, J. A., et al. 2015, MNRAS, 452, 4128
- Nagar et al. (1999) Nagar, N. M., Wilson, A. S., Mulchaey, J. S., & Gallimore, J. F. 1999, ApJS, 120, 209
- Querejeta et al. (2016) Querejeta, M., Schinnerer, E., García-Burillo, S., et al. 2016, Astron. Astrophys., 593, A118
- Rigopoulou et al. (2002) Rigopoulou, D., Kunze, D., Lutz, D., Genzel, R., & Moorwood, A. F. M. 2002, A&A, 389, 374
- Rodríguez-Ardila et al. (2005) Rodríguez-Ardila, A., Riffel, R., & Pastoriza, M. G. 2005, MNRAS, 364, 1041
- Rosario et al. (2010) Rosario, D. J., Whittle, M., Nelson, C. H., & Wilson, A. S. 2010, Mon. Not. Royal Astron. Soc., 408, 565
- Sandstrom et al. (2013) Sandstrom, K. M., Leroy, A. K., Walter, F., et al. 2013, ApJ, 777, 5
- Schnorr-Müller et al. (2014) Schnorr-Müller, A., Storchi-Bergmann, T., Nagar, N. M., et al. 2014, MNRAS, 437, 1708
- Solomon & Vanden Bout (2005) Solomon, P. M., & Vanden Bout, P. A. 2005, ARA&A, 43, 677
- Sternberg et al. (1994) Sternberg, A., Genzel, R., & Tacconi, L. 1994, Astrophys. J. Lett., 436, L131
- Togi & Smith (2016) Togi, A., & Smith, J. D. T. 2016, ApJ, 830, 18
- Tremblay et al. (2016) Tremblay, G. R., Oonk, J. B. R., Combes, F., et al. 2016, Nature, 534, 218
- Usero et al. (2004) Usero, A., García-Burillo, S., Fuente, A., Martín-Pintado, J., & Rodríguez-Fernández, N. J. 2004, Astron. Astrophys., 419, 897