The Effect of Disordered Substrate on Crystallization in 2D
Abstract
In this work the effect of amorphous substrate on crystallization is addressed. By performing Monte-Carlo simulations of solid on solid models we explore the effect of the disorder on crystal growth. The disorder is introduced via local geometry of the lattice, where local connectivity and transition rates are varied from site to site. A comparison to an ordered lattice is accomplished and for both, ordered and disordered substrates, an optimal growth temperature is observed. Moreover, we find that under specific conditions the disordered substrate may have a beneficial effect on crystal growth, i.e., better crystallization as a direct consequence of the presence of disorder.
pacs:
PACSI introduction
Controlling self-organization of two dimensional crystals is very instrumental due to their potential applications in low-dimensional semiconductors and optoelectronic devices Novoselov and Neto (2012); Putkonen et al. (2005); Wu et al. (2019); Chen et al. (2011a). For example, self-organization of a quantum dot Nurminen et al. (2000), graphene sheet Tetlow et al. (2014) or transition metal dichalcogenides Wu et al. (2019) affects their optical, electrical, magnetic and mechanical properties. Two-dimensional crystals can be also assembled in three-dimensional hetero-structures that do not exist in nature and have tailored properties Novoselov and Neto (2012).
This explains the considerable interest in studying metallic and semiconductor crystal growth. A promising technological development is to grow two-dimensional crystals on a substrate. The most studied two-dimensional crystal is graphene. Graphene has a wide range of interesting properties such as extremely large charge motilities, unprecedented mechanical strength, remarkable heat conduction at room temperature and a uniform absorption of light across the visible and near-infrared parts Novoselov and Neto (2012). Growth rates of two-dimensional crystals, such as graphene are limited by surface diffusion or attachment, that is, by the rate at which deposited atoms jump towards the growing crystal or the rate at which these atoms attach to the crystal. Different parameters such as flux of atom deposition on the surface, temperature, and the nature of the substrate on which the crystal grows, influence the speed of crystal growth as well as the quality of the obtained crystal Wu et al. (2019); Levi and Kotrla (1997); Tetlow et al. (2014); Jourdain and Bichara (2013). Most theoretical studies that are aimed at providing a better understanding of a crystal growth have used Molecular Dynamics (MD) L. Meng and Ding (2012); Tetlow et al. (2014); Shibuta and Maruyama (2003) or Kinetic Monte Carlo (KMC) methods Tetlow et al. (2014); Nurminen et al. (2000); Zhang et al. (2004). MD simulation (MDS) describes the diffusion of atoms according to the forces acting on them. The MDS approach involves the description of all the atomistic details Tetlow et al. (2014); Tang et al. (1992); Ratsch and Venables (2003); Biehl (2005a) and crystal growth is associated with many local events. In this study we concentrate on KMC simulations, that in general, go beyond atomistic details. These methods are based on coarse-graining of “molecular” growth models. Coarse-grained methods take into consideration “important” processes and neglect other details Tetlow et al. (2014); Battaile and Srolovitz (2002); Chatterjee and Vlachos (2007). For example when describing crystallization on substrate one can look at jumps of absorbed atom (adatom) between neighbouring cites of immovable lattice that represent the substrate. In reality, the substrate rearranges and reacts to adatom movement but as long as the substrate movement has a negligible impact on the adatom energy, this movement can be neglected Biehl (2005a). This kind of KMCs describing crystal growth as adatom moving on a lattice, is called solid on solid (SOS) simulations Chatterjee and Vlachos (2007); Pyziak et al. (2004); Biehl (2005a) . In SOS simulations, adatoms are deposed randomly on a site and then jump to a neighbor site according to a microscopic model (see Fig. 2).
The effects of substrate on nucleation and crystal growth have been previously investigated Nurminen et al. (2000); Chen et al. (2011a) using SOS simulations. These models usually use a square lattice and add energetic barriers to specific sites. Specifically, in Nurminen et al. (2000) a patterned substrate was considered for the nucleation process. In order to introduce a substrate pattern, the lattice is divided into square-shaped domains and the adatom energy is a function of its location on the lattice. Nurminen et al. Nurminen et al. (2000) found that patterned substrate affects the nucleation process on the substrate. In Chen et al. (2011a) point defects were introduced and it was found that this addition, at a certain temperature of the substrate material, improves the nucleation and increases the average crystal size. While these studies show that patterning, or addition of local disorder to the substrate, have a good impact on crystal size (increased average island size) it is not clear what happens when the underlying lattice is not ordered, i.e., amorphous substrate. Moreover, experiments K. (2013) show that substrate composition and surface crystallinity also influence crystal growth. Recently, amorphous substrates such as liquid substrate, have been experimentally used for crystal growth, the lack of a crystallographic substrate have been observed to have a good impact on crystallization, i.e. enlarge crystal size. Zeng et al. (2014); Boeck et al. (2017); Zhang et al. (2018). When taking into account this experimental observation, it becomes interesting to explore the effect of substantial substrate disorder on crystal growth. Of special interest is the case when the substrate geometry is sufficiently altered and can’t represent an ordered lattice anymore, i.e., the case of amorphous substrate.
The effects of temperature on crystal growth has been previously addressed in L. Meng and Ding (2012); Zhang et al. (2004); Chen et al. (2011a); Meixner et al. (2001); Pyziak et al. (2004). In L. Meng and Ding (2012) an optimal growth temperature for graphene growth on Ni is found by molecular dynamics simulations. An optimal temperature, at which the surface roughness is minimized, was recently obtained Zhang et al. (2004) using a 3D KMC simulation. Experiments show that at a relatively low temperature, temperature increase has a beneficial impact on crystal growth K. (2013); Loginova et al. (2008); et al. (2013); Chen et al. (2011b) while, at higher temperatures, an opposite effect is found Rafik et al. (2012).
In this work crystallization is studied on two types of latices; square (ordered) and random (amorphous). We use a vectorizable random lattice (VRL) in order to simulate an amorphous substrate. VRL is a lattice with sites that compose a set of randomly chosen points with uniform distribution Moukarzel and Herrmann (1992a). In Bunimovich and Khlabystova (2001) a VRL was used for the study of Lorentz gas. In Schwarcz et al. (2016) one of us used a VRL in order to simulate a semi-solid substrate (agar substrate) that does not posses a crystal order. Here we present two SOS models. Model A in which the interaction energy between adatoms depends only on the number of neighboring adatoms and model B where the interaction energy between adatoms depends on the local substrate geometry. We compare the results obtained on both substrates, for both models, and the effect of temperature is also presented. Interestingly enough, it is found that not only that there is an optimal temperature, but also the amorphous nature of the substrate has a beneficial effect on crystallization.
This paper is organized as follows. In Sec. (II) the models and computational methods are presented. The effects of temperature variation on crystallization and comparison of ordered and amorphous substrate are presented in Sec. (III). In Sec. (III) we also discuss the possible explanation for the beneficial impact of amorphous substrate. The summary is in Sec. IV.
II Models and methods
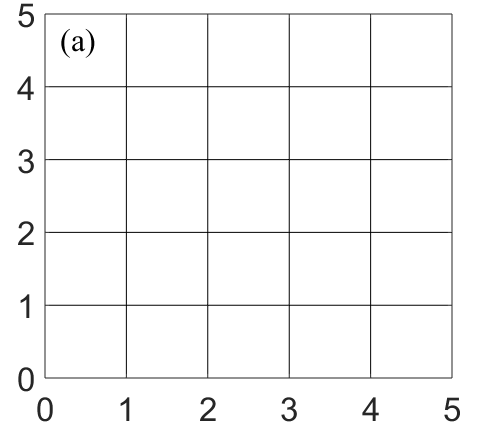
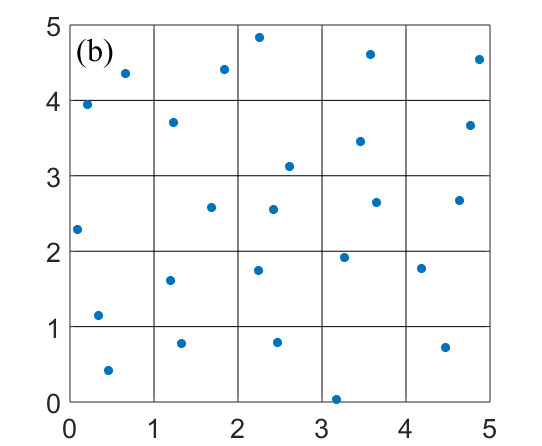
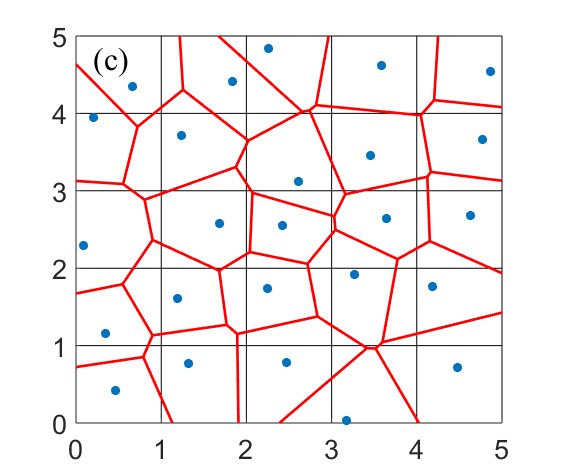
In order to describe crystal growth on an amorphous substrate by a SOS model one first needs to create a lattice that represent an amorphous substrate. In order to achieve this goal we use a Vectorizable Random Lattice (VRL), VRL is a lattice that consists of random sites that are uniformly distributed in space Moukarzel and Herrmann (1992b); Schwarcz et al. (2016). During the construction of a VRL following steps are performed: I: A square lattice of cells is defined, this lattice is called the reference lattice, as shown in Fig. (1) (a). II: A random point is chosen in each cell of the reference lattice (with uniform distribution), while keeping a minimum distance between points as presented in Fig. (1) (b). Any two points that are closer than , are re-allocated. controls the degree of randomness of the lattice. These points constitute the VRL sites. III: The Voronoi cell for each lattice site is produced Fig. (1) (c). Voronoi cell is defined as a set of all points that are closer to a given lattice site, than to any other lattice site Vieira et al. (2001). The simulations presented in this work were carried out on a reference lattice of cells (), the edge length of the reference square lattice was set to be while is set at . Special care was taken in order to enable periodic boundary conditions of the VRL. In the following we describe the dynamics of adatoms on top of a VRL and an ordered square lattice.
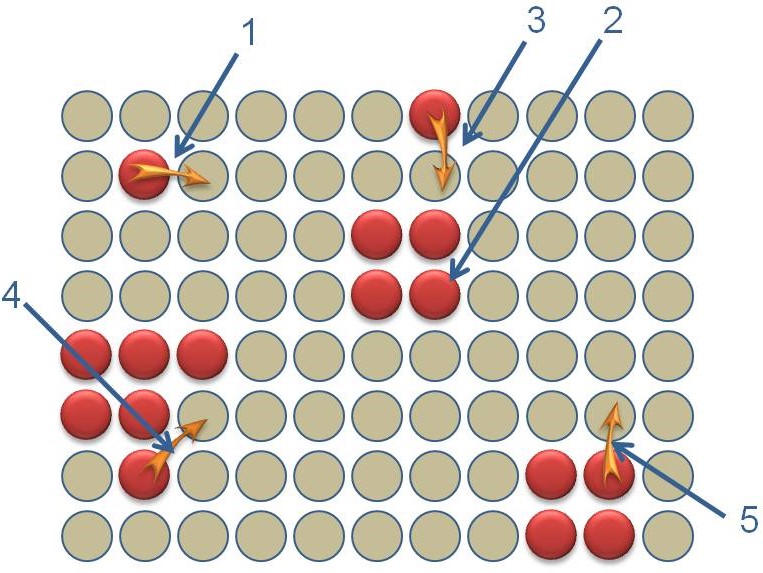
Adatoms are allowed to move on the top of the disordered lattice, but first we depose adatoms on the substrate i.e. fill part of the lattice cells with adatoms. Therefore during the first 30 simulated time steps of the simulation 100 adatoms are randomly deposited on VRL sites. If the randomly chosen site is already occupied, the new adatom is added to a neighboring site (in the case of random lattice the neighbor site with the bigger common edge is chosen). After this deposition period, adatoms are no further added. During the simulation, each adatom can jump to one of the neighboring sites of the disordered lattice, i.e. sites that have a mutual edge with the current site that contains the adatom. If an adatom jumps to a site adjacent to another adatom it nucleates to form a new crystal. If it jumps to a site adjacent to a crystal it aggregates to the existing crystal. Adatoms that belong to a crystal border can detach from the crystal or change their emplacement in the crystal. From an energetic point of view, neighboring adatoms has interaction energy therefore if an adatom have a neighbor its jumping probability decreases. On the other hand the adatom probability to stay attached to its neighbors increases. Fig. (2) summarizes the dynamical process on the lattice, for simplicity the lattice is presented as symmetric. We allow at most one adatom per lattice site.
The probability of a randomly chosen adatom to jump is defined as a combination of two probabilities: the probability to leave the original site and the probability to occupy a new site. First, all the potential locations s that the adatom may reach from its initial site are specified. These potential locations are the sites that have a common edge with . For each of those sites the transition probability is calculated
| (1) |
where , is the adatom energy in position , , T is the temperature and is the Boltzmann constant. A destination site is randomly chosen in accordance to . The probability, , that an adatom will attempt to leave its position is defined as
| (2) |
Where is the adatom energy. is defined as a sum of two terms and that represent the interaction with the substrate (), and the interaction energy contribution () from all of the occupied nearest neighbors.
The substrate binding energy, , is defined in direct proportion to the cell boundary size
| (3) |
where is a numerical coefficient. is the local energetic well that dictates the diffusion properties of an isolated adatom. It depends on the lattice site geometry/size and is quenched, i.e. remains constant during the simulation. When the lattice is geometrically disordered, is responsible for introduction of this heterogeneity into the dynamics of the adatoms. In the simple case of an ordered lattice, the substrate binding energy is uniform for all the lattice sites and local diffusion is homogeneous without preferred locations. Cases with uniform quenched energetic barriers were studied in Biehl (2005b); Xu et al. (2017). In our model we assume that the substrate irregularity also affects adatom emplacement and that the adatom emplacement, in its turn, affects the interaction energy between adatoms. The definition of the interaction energy, , between the adatom and neighbouring adatoms is varied between the two models. In model A, for each cell every neighboring adatom has the same contribution to the interaction energy. In model B the interaction energy between adatoms depends on the local substrate geometry, specifically it depends on their common edge length . The interaction energy between two neighboring adatoms in Model A is defined as
| (4) |
where is if is occupied and otherwise, the sumation is over all the neighbouring sites. In model (B) the binding energy between neighboring adatoms is
| (5) |
where (as previously mentioned) is the length of the boundary between and . The summation is again over all neighbouring sites. In the specific case when an ordered lattice is used, Model A and B should provide exactly the same results. For a VRL there is expected to be a difference between the behavior of Model A and Model B, due to the fact that the boundaries of a Voronoi cell are random. VRL simulates an amorphous substrate, therefore for a VRLs the substrate-adatom interaction energy varies for different cells. In model A, for each cell there is a constant interaction energy between adatoms and their neighbors. For VRL the amount of neighbours for different cells is not uniform, this in turn cause to variations of simply due to the fact that the summation in Eq. (4) varies. In model B, on top of the diversification of Model A, the magnitude of interaction between two adatoms also varies according to ( Eq. (5)). The reasoning behind introduction of this specific dependence of interaction energy between adatoms stems from the geometrical properties of the VRL. We want to take into account only the interaction with nearest neighbours. Number of nearest neighbours varies from site to site due to the disordered structure of the VRL. While for Model A the only thing that matters is the occupation of a nearest neighbour by adatom, in Model B the length of the mutual boundary with this specific site (i.e. ) is taken into account. The closer the centers of two VRL sites and the larger (on average) is their mutual boundary and vice versa.
Both models include three scaling parameters, , and the edge length of the square lattice. Theses parameters can be adjusted to correspond to a given disordered situation and comparability between and . The order of magnitude of is dictated by the edge length of the reference square lattice and . When the length edge of the reference square lattice is one, increasing from to 0.3 leads to decrease of the variance of . The distribution of is rather complicated and for high enough values of () it stops to behave as a Gaussian centerd around its mean. Therefore we chose to use rather small . The numerical coefficient that appear in Eq. 3 dictates the ratio of the interaction energy of adatoms () and the interaction energy between the substrate and the adatom ().
To summarize, at each time step a particle is chosen in a random fashion, then its probability to jump, , is calculated in accordance to Eq. (2). If the jump move is accepted, the destination site is chosen among all its empty neighbouring cells. An empty neighbour cell with a lower energy state, i.e. a neighbour surrounded by more adatoms, has better chance to receive the jumping adatom, in accordance to . The probability (Eq. (2)) of an adatom to exit from its original site, match to trap models where the depth of the trap depends on the energy of the original site Bouchaud and Georges (1990); Burov and Barkai (2011); Miyaguchi and Akimoto (2015); Burov (2017); Magdziarz and Szczotka (0181). The probability to reach a new site, as defined in Eq. (1), resembles barrier models Berne et al. (1998); Bouchaud and Georges (1990), where the transition probabilities between neighbouring sites are asymmetric.
III Results
In the simulation, crystallization on a substrate is reproduced by a two-dimension SOS model described in the previous section. The largest and the most defect-free crystals are the most desirable. In order to quantify the quality of a crystal, we need to take into consideration the crystal size and its uniformity. For this purpose we define an order parameter, the normalized weighted density (NWD): a sum over all cell edges that separate two occupied cells, normalized by the sum of all edges for all occupied cells,
| (6) |
where
The first summation (over ) is over all lattice cells in which there is an adatom, second summation (over ) is over the neighbors of cell . A brief glance at NWD reveals that there is a resemblance between NWD and the interaction energy of all the adatoms. The reason for this resemblance lays in the fact that the adatoms interaction energy has a strong effect on crystal growth. A global perspective of the system shows that NWD increases with the compactness of a crystal: the higher is the number of occupied sites of a given adatom, the higher is NWD. In the case of irregular crystal morphology, such as protrusion, branches and pores, many adatoms have empty neighbors and NWD is expected to be relatively small.
Two reasons can cause NWD to be small; if the adatoms jumping probability is highly restricted, the adatoms will be stuck in an isolated site, if is too high adatoms will not stabilize even on sites with many neighboring adatoms.
III.1 Temperature effects
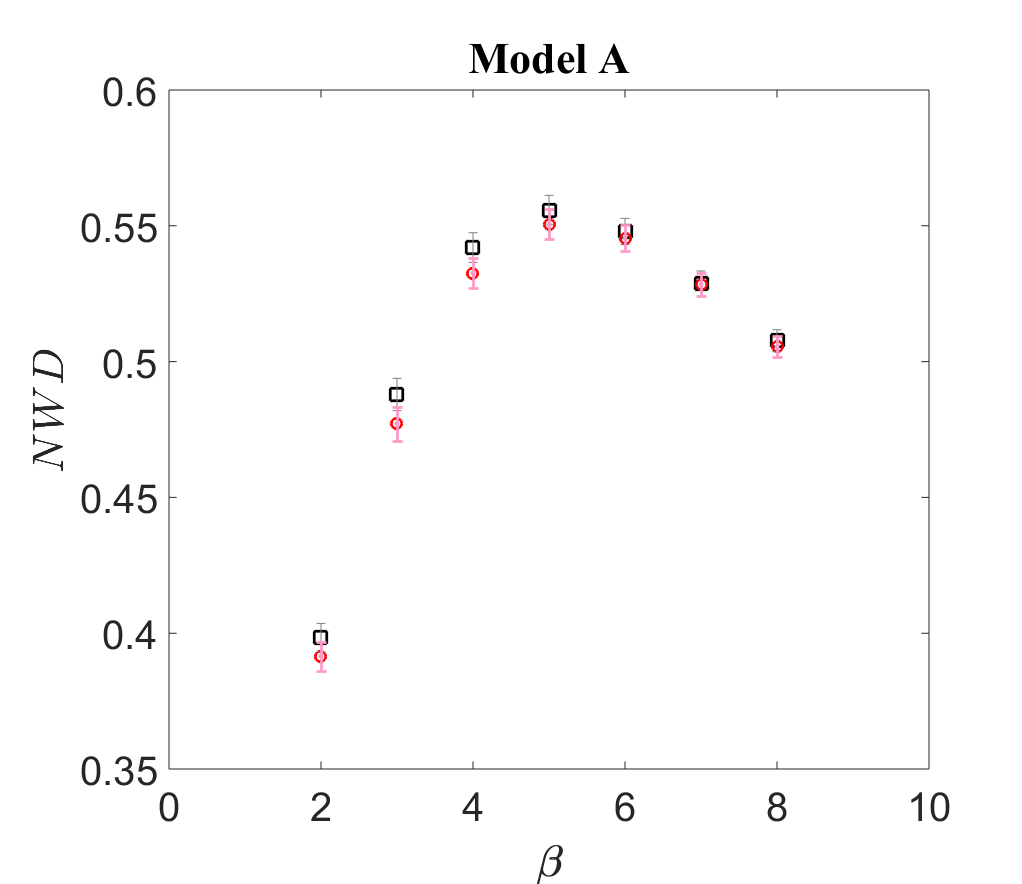
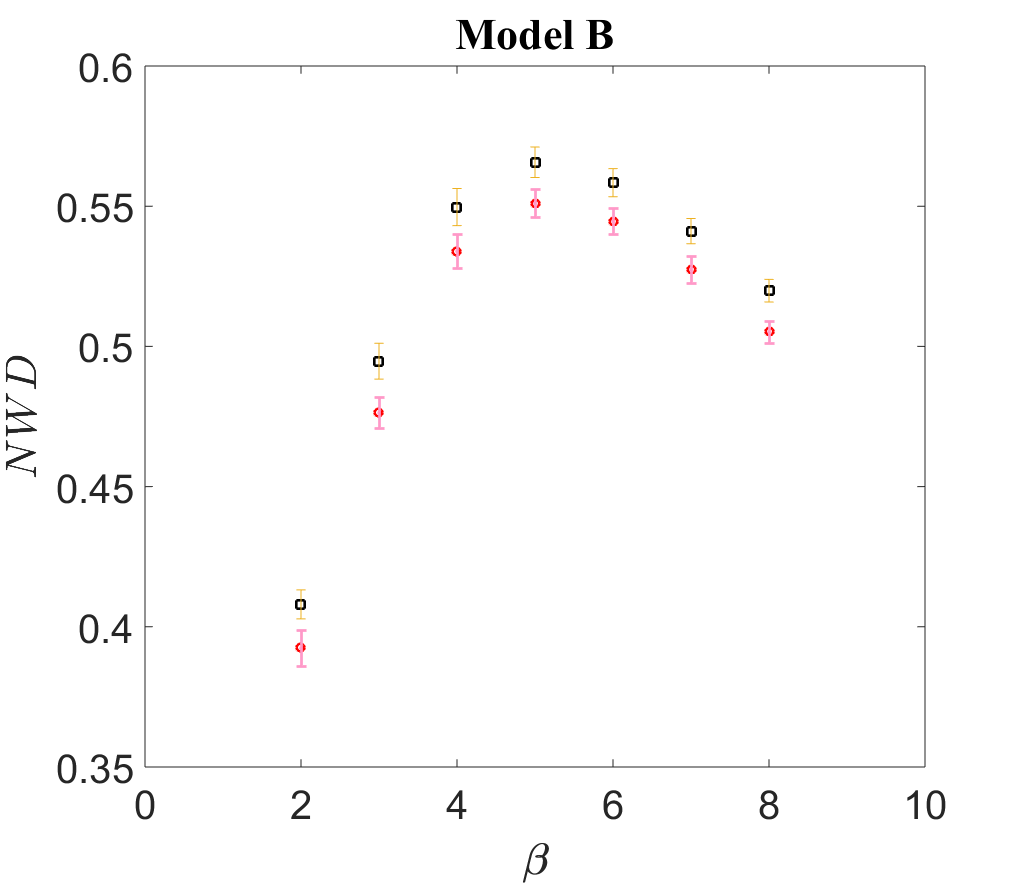
In order to study the effect of temperature, we vary which appears in Eqs. (1) and (2). We observe that the effect of temperature on NWD has an inverse U shape, see (Fig. (3 (a,b) and 4 (a,b) ). At sufficently low (high temperatures) ,an increases of improves crystallization until an optimal is reached, further increase of (low temperatures) damages the crystal.
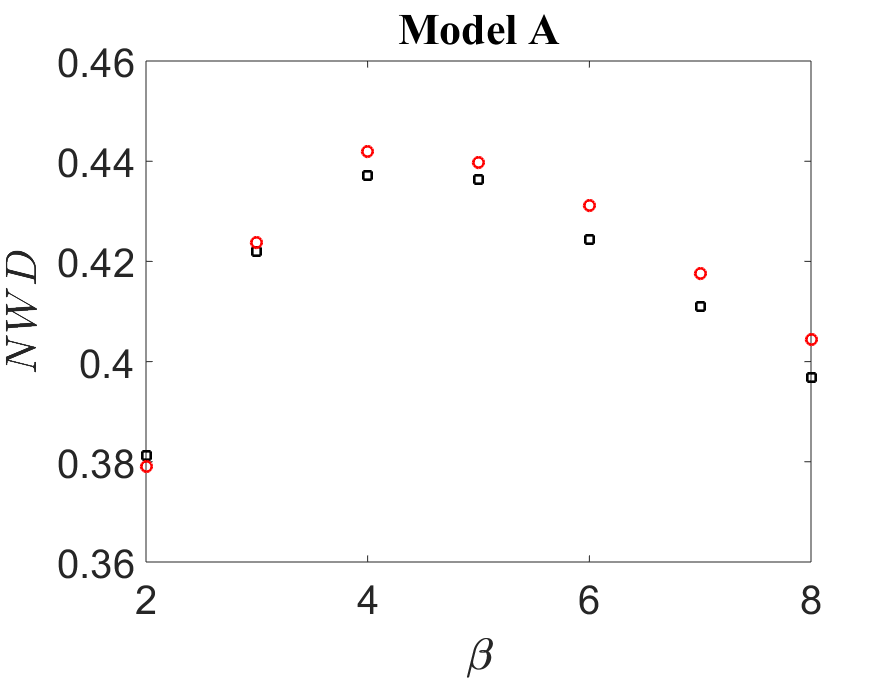
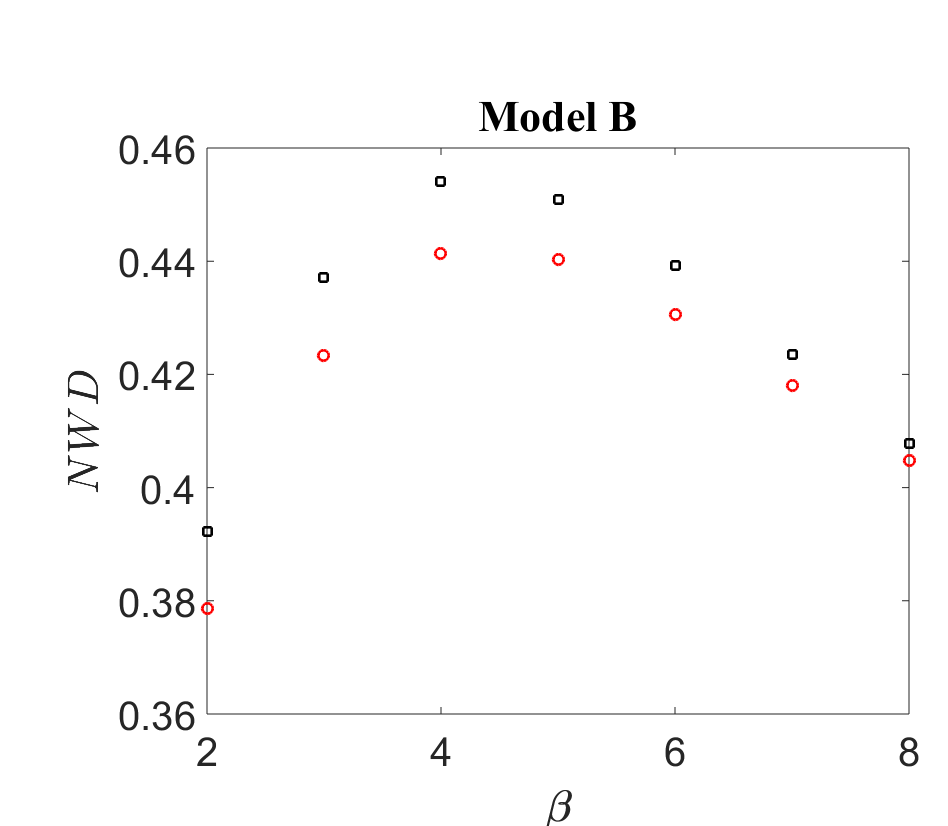
This observation of optimal temperature for crystal growth can be explained by following reasoning. At sufficiently low temperatures the adatoms mobility is restricted due to the fact that they need quite large activation energy in order to leave their current site, i.e. small . Increasing of the temperature leads to increasing of that in its turn contributes to better crystallization, i.e., higher NWD. As the temperature is further increased, another aspect of the dynamics must be taken into account. Above a specific temperature threshold the difference between a neighbor site with many neighbors and a less favorable neighbor is small. From the Eq. (1), we can see that decrease (T increase) causes a decrease in impact, therefore, the probability that a diffusing adatom will reach the site with highest interaction energy declines when the temperature is increased. This behavior is reproduced in our model (Figs. 3(a,b) , 4(a,b) ) and was already observed in Nishinaga (2015). An optimal temperature for crystal growth was also observed experimentally by Rafik et al. (2012) and reproduced theoretically L. Meng and Ding (2012); Zhang et al. (2004); Chen et al. (2011a).
III.2 Effect of the Disorder
The NWD is also used in order to study the effect of the disorder, i.e., amorphous lattice described by the VRL. For both definitions of the interaction energy, Model A and Model B, the comparison between ordered (square) substrate lattice and VRL with was performed ( Figs. 3(a,b) and 4(a,b)). In Figs. (3 (a,b)) and (4(a,b)) the behavior of NWD for ordered and disordered cases is presented. Surprisingly enough, the effect of the disorder on crystal-growth is non-negative and can also be positive.
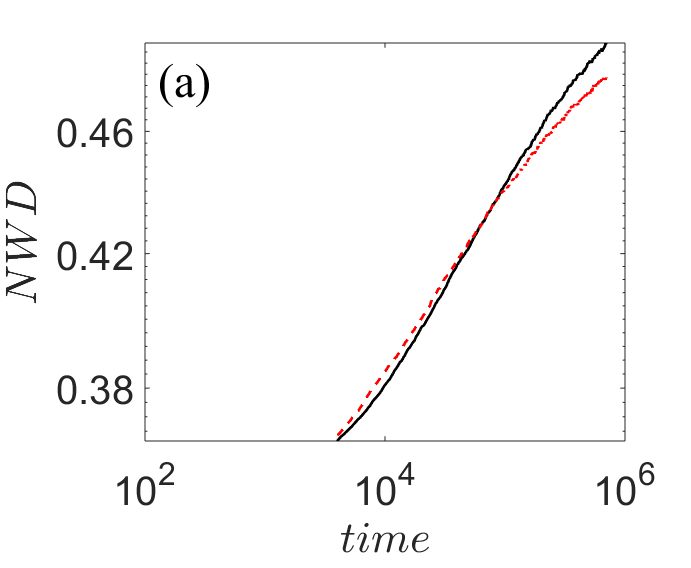
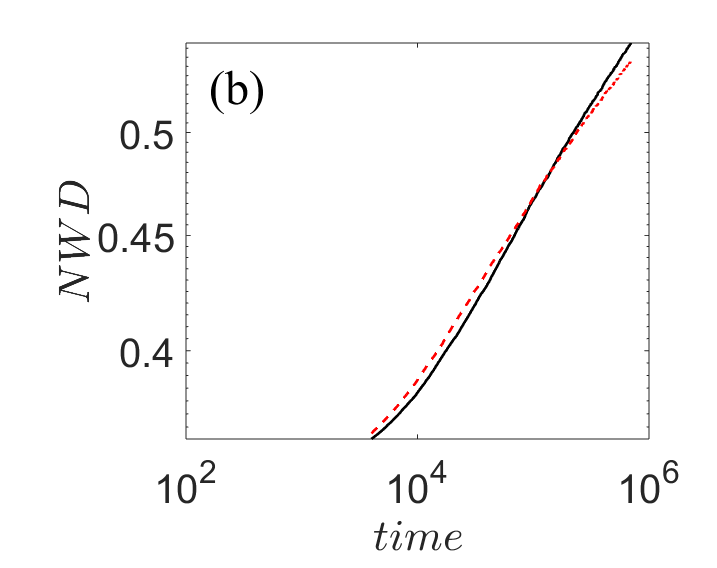
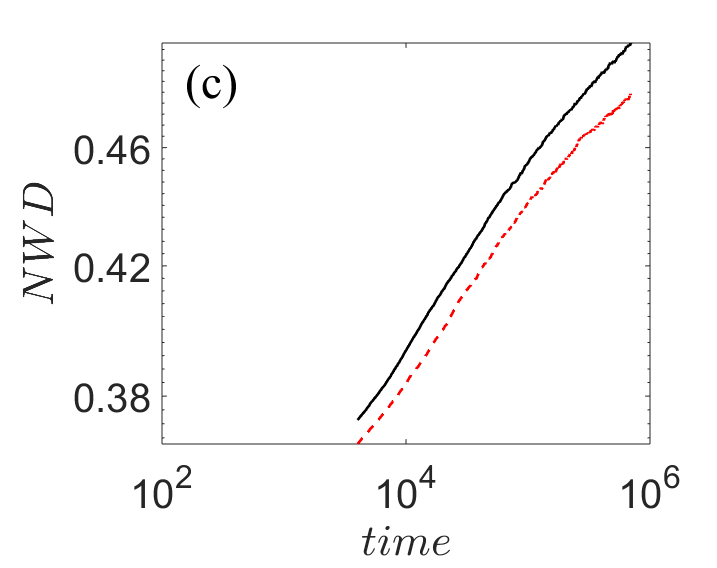
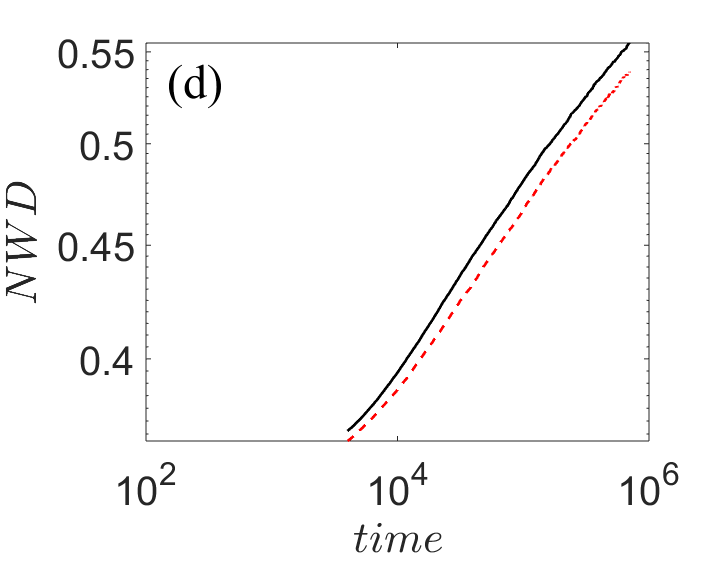
Specifically, for Model B, the NWD parameter is higher for the amorphous case, for any given temperature. The growth of the crystal with time, as described by NWD, is slow in both cases (ordered and disordered) and after sufficient temporal period appear to grow logorithmically (Fig. 5(a-d)). The growth on the disordered substrate appears to be a little bit faster, for Model B, when compared to the ordered substrate. When Model A is considered the situation is somewhat more complicated. In Fig. (3 (a)), there is a small preference for the ordered substrates for most temperatures. But for longer times, Fig. (4(a)),this seems to change and for sufficiently low temperatures the disordered substrate starts to become more beneficial, as compared to the squared lattice. Indeed, when comparing the growth with time of NWD Fig. (5 (a,b)), we see crossover between the ordered and disordered substrates. In both cases the growth is logarithmic but the growth for the disordered case is faster.
We must note that our results describe the stage when the crystal is still growing and local deformations are still in place. In Fig. (5 (a,b)), even after simulation time steps, the steady state, i.e. constant NWD, is not reached.
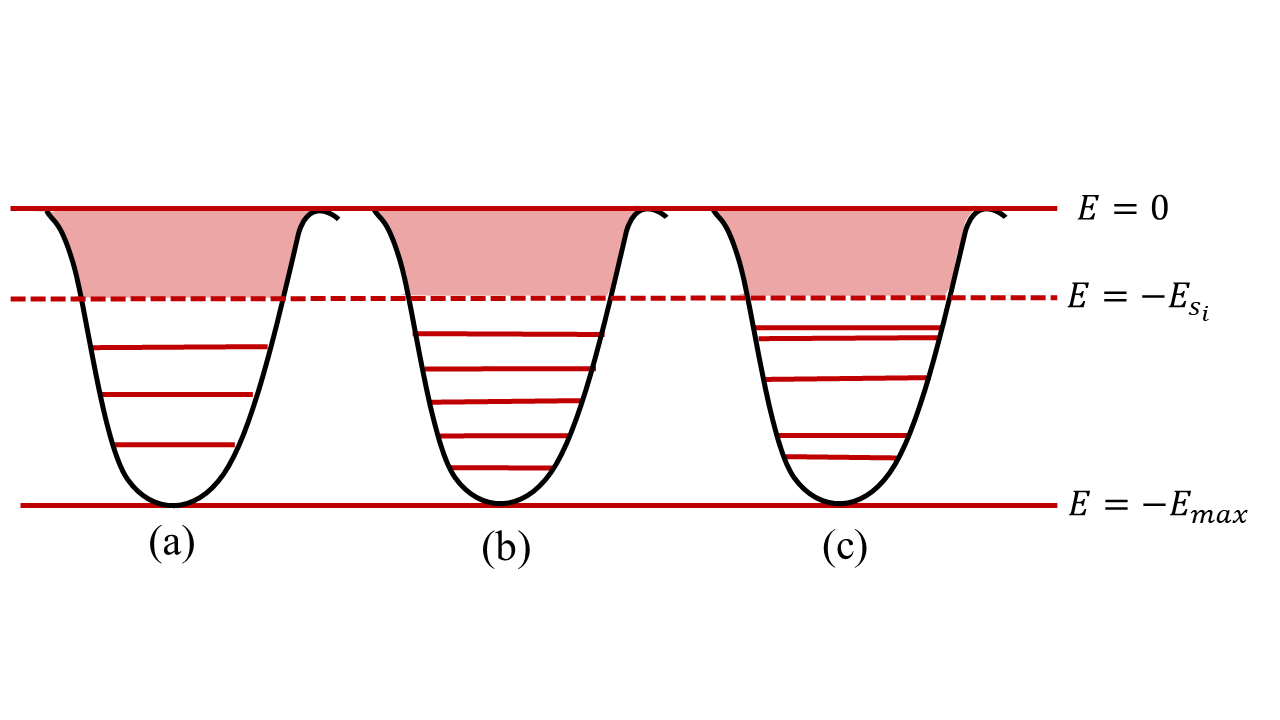
The observed benefit of introduction of disorder is rooted in the definitions of transition probabilities , and the local interaction energies and . The interaction with the substrate, , is the same for all lattice points in the case of ordered substrate. This is due to the fact that the cell perimeter is constant. When dealing with a VRL, each cell perimeter is different. Only on average the perimeter equals to the perimeter of the ordered lattice. Consequently, on average, the interaction with the substrate is the same for the ordered and the disordered cases (Model A and Model B). If one considers the situation when an adatom is isolated (step 1 in Fig. 2), the probability to perform a jump is similar (on average) for the different models. We can state that is the minimal ”depth” of local energy trap. On top of additional quantity , that depends on occupation of neighbour sites, is added. can obtain discrete set of equally spaced values in the case of ordered square lattice. This is graphically displayed in Fig. 6a, the energetic spectrum of a trap is composed of different sates. When dealing with the disordered case, the situation is different for Model A and Model B. First consider Model A, where is defined by Eq. (4). Here the also attains a set of discrete values, but the number of these values varies from site to site. For the case of the average number of neighbours is . This means that on average, the spectrum of energetic trap in Model A is composed of different (and equally spaced) states (Fig. 6b). In Model B, according to Eq. (5), there is not only distinct values (on average) but also they are not equally spaced. Fig. 6c describes the energetic spectrum of traps in Model B. In this situation one can expect to encounter with many situations where there are several energetic levels bunched closely to .
This perspective of randomization of ”band gaps” and their number can help intuitively understand the benefit of introduction of disorder. At some stage the homogenization of the crystal is due to local rearrangements of the adatoms (Fig. 2 step 4). In order for a rearrangement to occur the adatom must escape the local energetic trap. The benefit of energetic spectrum of the disordered case is due to existence of energetic states in the vicinity of , as compared to the ordered case. This line of thought also supports the observation that the NWD value for Model B is higher as compared to Model A. Existence of ”bunched” energetic states in the vicinity of can facilitate local transformations of adatoms and homogenize the crystal. We observe an effect that is small to moderate. Nonetheless, it becomes evident that disorder can support crystal growth by facilitation of new energetic pathways.
IV Summary
The purpose of this work was to explore the effect of disordered substrate on crystal growth. In order to achieve this goal KMC simulations of SOS models (with disordered lattices) were performed. The geometrical disorder of the lattice influenced the interaction energy between adatoms moving on the lattice and affected the crystal growth process. Numerically computed behavior of normalized weight density (NWD) parameter shows not only that there is a preferred temperature for crystallization but also that the presence of geometrical disorder is beneficial. We suggest that the disorder affects the local energetic states associated with each lattice site. It creates energetic states in the close vicinity of the energy associated with free particles. Those states, that are not present in the case of ordered substrate, can produce additional (and more preferable) energetic pathways to local reformation and faster crystallization. It will be interesting to explore this effect further, especially since it is known that fluctuations of energetic levels can lead to effects such as stochastic resonance Gammaitoni et al. (1998); Burov and Gitterman (2016).
References
- Novoselov and Neto (2012) K. S. Novoselov and A. H. C. Neto, Physica Scripta T146, 014006 (2012).
- Putkonen et al. (2005) M. Putkonen, T. Sajavaara, L. Niinistö, and J. Keinonen, Analytical and Bioanalytical Chemistry 382, 1791 (2005).
- Wu et al. (2019) L. Wu, W. Yang, and G. Wang, npj 2D Materials and Applications 3, 6 (2019).
- Chen et al. (2011a) Z. Chen, Y. Zhu, S. Chen, Z.Qiu, and S.Jiang, Applied Surface Science 257, 6102 (2011a).
- Nurminen et al. (2000) L. Nurminen, A. Kuronen, and K. Kaski, Phys. Rev. B 63, 035407 (2000).
- Tetlow et al. (2014) Tetlow et al., Phys. Rep. 542, 195 (2014).
- Levi and Kotrla (1997) A. C. Levi and M. Kotrla, J. Phys.: Condens. Matter 9, 299 (1997).
- Jourdain and Bichara (2013) V. Jourdain and C. Bichara, Carbon 58, 2 (2013).
- L. Meng and Ding (2012) J. W. L. Meng, Q Sun and F. Ding, J. Phys. Chem. 116, 6097 (2012).
- Shibuta and Maruyama (2003) Y. Shibuta and S. Maruyama, Chem. Phys. Lett. 382, 381 (2003).
- Zhang et al. (2004) P. Zhang, X. Zheng, S. Wu, J. Liu, and D. He, Vacuum 72, 405 (2004).
- Tang et al. (1992) Tang, Lei-Han, and L. Heiko, Phys. Rev. A 45, R8309 (1992).
- Ratsch and Venables (2003) C. Ratsch and J. Venables, Journal of Vacuum Science and Technology A 21, S96 (2003).
- Biehl (2005a) M. Biehl, International Series of Numerical Mathematics 149, 3–18 (2005a).
- Battaile and Srolovitz (2002) C. C. Battaile and D. J. Srolovitz, Annual Review of Materials Research 32, 297 (2002).
- Chatterjee and Vlachos (2007) A. Chatterjee and D. G. Vlachos, Journal of Computer-Aided Materials Design 14, 253 (2007).
- Pyziak et al. (2004) L. Pyziak, I. Stefaniuk, I. Virt, and M. Kuzma, Applied Surface Science 226, 114 (2004).
- K. (2013) C. K., Chimical vapor deposition of graphene on copper (ETH Zurich, 2013).
- Zeng et al. (2014) M. Zeng et al., Chemistry of Materials 26, 3637 (2014).
- Boeck et al. (2017) T. Boeck, F. Ringleb, and R. Bansen, Crystal Research and Technology 52, 1600239 (2017).
- Zhang et al. (2018) K. Zhang et al., Proceedings of the National Academy of Sciences 115, 685 (2018).
- Meixner et al. (2001) M. Meixner, E. Schöll, V. A. Shchukin, and D. Bimberg, Phys. Rev. Lett. 87, 236101 (2001).
- Loginova et al. (2008) E. Loginova, N. C. Bartelt, P. J. Feibelman, and K. F. McCarty, New Journal of Physics 10, 093026 (2008).
- et al. (2013) H. Y. et al., Science 342, 720–723 (2013).
- Chen et al. (2011b) H. Chen, H. Tao, X. Zhao, and Q. Wu, Journal of Non-Crystalline Solids 357, 3267 (2011b).
- Rafik et al. (2012) A. Rafik, D. Arjun, S. Peter, and B. Matthias, App. Phys. Lett. 100, 021601 (2012).
- Moukarzel and Herrmann (1992a) C. Moukarzel and H. J. Herrmann, J. Stat. phys. 68, 911 (1992a).
- Bunimovich and Khlabystova (2001) L. A. Bunimovich and M. A. Khlabystova, J. Stat. Phys. 104, 1155–1171 (2001).
- Schwarcz et al. (2016) D. Schwarcz, H. Levine, E. Ben-Jacob, and G. Ariel, Physica D: Nonlinear Phenomena 318-319, 91 (2016).
- Moukarzel and Herrmann (1992b) C. Moukarzel and H. Herrmann, J. Stat. Phys. 68, 911 (1992b).
- Vieira et al. (2001) A. P. Vieira, J. X. de Carvalho, and S. Salinas, Phys. Rev. B 63, 184415 (2001).
- Biehl (2005b) M. Biehl, International Series of Numerical Mathematics 149, 3 (2005b).
- Xu et al. (2017) D. Xu, P. Zapol, G. B. Stephenson, and C. Thompson, J. Chem. Phys. 146, 144702 (2017).
- Bouchaud and Georges (1990) J.-P. Bouchaud and A. Georges, Phys. Rep. 195, 127 (1990).
- Burov and Barkai (2011) S. Burov and E. Barkai, Phys. Rev. Lett. 106, 140602 (2011).
- Miyaguchi and Akimoto (2015) T. Miyaguchi and T. Akimoto, Phys. Rev. E 91, 010102 (2015).
- Burov (2017) S. Burov, Phys. Rev. E 96, 050103 (2017).
- Magdziarz and Szczotka (0181) M. Magdziarz and W. Szczotka, J. Stat. Mech. 2018, 023207 (20181).
- Berne et al. (1998) B. J. Berne, G. Ciccotti, and D. F. Coker, Classical and Quantum Dynamics in Condensed Phase Simulations (World Scientific, 1998) pp. 3 – 21.
- Nishinaga (2015) T. Nishinaga, ed., Handbook of Crystal Growth (Elsevier, 2015) pp. 445 – 475.
- Gammaitoni et al. (1998) L. Gammaitoni, P. Hänggi, P. Jung, and F. Marchesoni, Rev. Mod. Phys. 70, 223 (1998).
- Burov and Gitterman (2016) S. Burov and M. Gitterman, Phys. Rev. E 94, 052144 (2016).