Experimental Characterization of Ultrafast, Tunable and Broadband Optical Kerr Nonlinearity in Graphene
Abstract
In this study we systematically measure the near-infrared spectral dependence, the sub-picosecond temporal evolution and pulse-width dependence of the effective Kerr coefficient () of graphene in hundreds of femtosecond regime. The spectral dependence measured using the Z-scan technique is corroborated by quantum theory to extract a dependence. The temporal evolution extracted using the time-resolved Z-scan measurement shows the nonlinear response peaking at zero delay time and relaxing on a time scale of carrier relaxation. Since the Kerr-type response originated from the optically induced carrier population difference, the time-scale of the evolution of the nonlinear response is apt. The shows a dependence on the pulse-width attributed to the relative heating and cooling times of the carriers. This dependence is strong when the pulse-duration is on the same time-scale as the decay constant. Throughout our study the remains positive.
Introduction
The Dirac band structure of graphene [1, 2] has endowed this atomically thin two-dimensional material with exceptional optical and transport properties. As a scale-invariant host of chiral carriers[3], graphene exhibits a universal optical response in absorption, with a single sheet capable of absorbing of normally incident light. Its reduced dimensionality together with the peculiar Dirac type dynamics of the quasipartciles enable graphene to have a relatively strong nonlinear optical response in the presence of intense electromagnetic illuminations [4, 5]. Intrigued by its potential applications in photonic and optoelectronics several theoretical and experimental studies of the nonlinear optical properties of graphene have been carried out [4, 6, 7, 8, 9, 10, 5, 11, 12, 13, 14, 15, 16, 17, 3, 18, 19, 20, 21, 20, 22]. Due to the centrosymmetric crystalline structure of graphene, even-order nonlinearities are forbidden and the first nonlinear contribution is a third order effect. In particular, the Kerr type nonlinearity is dominantly attributable to the third order nonlinear interactions in graphene. The refractive index, , considering the first nonlinear term is intensity dependent and given by the expression , where is the linear refractive index, is the Kerr coefficient, and is incident intensity. This Kerr-type nonlinearity in graphene has been reported to be large, confirmed by studies characterising frequency mixing [4, 6, 7], harmonic generation [8], self-phase modulation[9, 10], and self-refraction[5, 11, 12, 13, 14, 15].
Several theoretical works have attempted to provide a cohesive theory for the third order nonlinearity in graphene, addressing the magnitude[16, 17, 3, 18] of the nonlinear refractive index (), the spectral[3, 4, 16] and temporal[19, 20] dependence, and effects of Fermi energy modulation[21, 17, 3, 18, 22]. Although topological anomalies in graphene hinder the adaption of perturbation theory in the treatment of the optical response of graphene [3, 23], fortunately, over the optical wavelength range, nonlinear response coefficients can still describe interactions of photons. Perturbative treatment of the nonlinear optical response of graphene yields explicit expressions for the higher orders conductivity tensors. Throughout this work we refer to the third order frequency mixing conductivity as where , and are the frequencies of the photons undergoing nonlinear interaction through the graphene monolayer. The conductivity is proportional to the Kerr coefficient through the third order susceptibility. The studies show large tunability in through Fermi level modulation. Other factors such as the spectral and temporal dependence have seen relatively less explicit theoretical discussion.
The experimental studies probing the Kerr-nonlinearity in graphene have shown variation of spanning six order of magnitudes (10-12 to 10-7 cm2/W) [4, 5, 11, 14]. A point of contention while comparing these results are the varying spectral and temporal properties of the excitation source, sample preparation techniques, and substrate material. The measurements are performed with the excitation wavelength ranging from the visible to the mid-infrared, while the pulse duration ranges from hundred femtoseconds to tens of picoseconds, under different sample preparation methods[24]. It has been recognised that the depends on the wavelength, pulse duration and power in semiconductor systems [25]. Particularly in graphene, the expected to become larger with longer wavelengths [4]. This trend has been observed and reported thereafter[12, 15]. It has also been shown in graphene oxide, that the nonlinear parameters of the system change when excited with nanosecond and picosecond pulses[26]. The decrease of with increasing incident intensity due to saturation effects has been observed and reported previously in several studies[5, 15, 12, 27]. Raman studies have shown p-type doping occurs when chemical vapour deposition (CVD) graphene is transferred onto quartz [24]. Considering these factors, it is more apt to consider the measured nonlinear parameters in conjunction with the experimental conditions. This makes it imperative to understand the dependence of these factors in a systematic manner to gain a fundamental understanding of the governing processes. The integrability of graphene combined with its large Kerr nonlinearity makes it ideal for use in on-chip all-optical communication and signal-processing with large tunability, which is limited in silicon photonics.
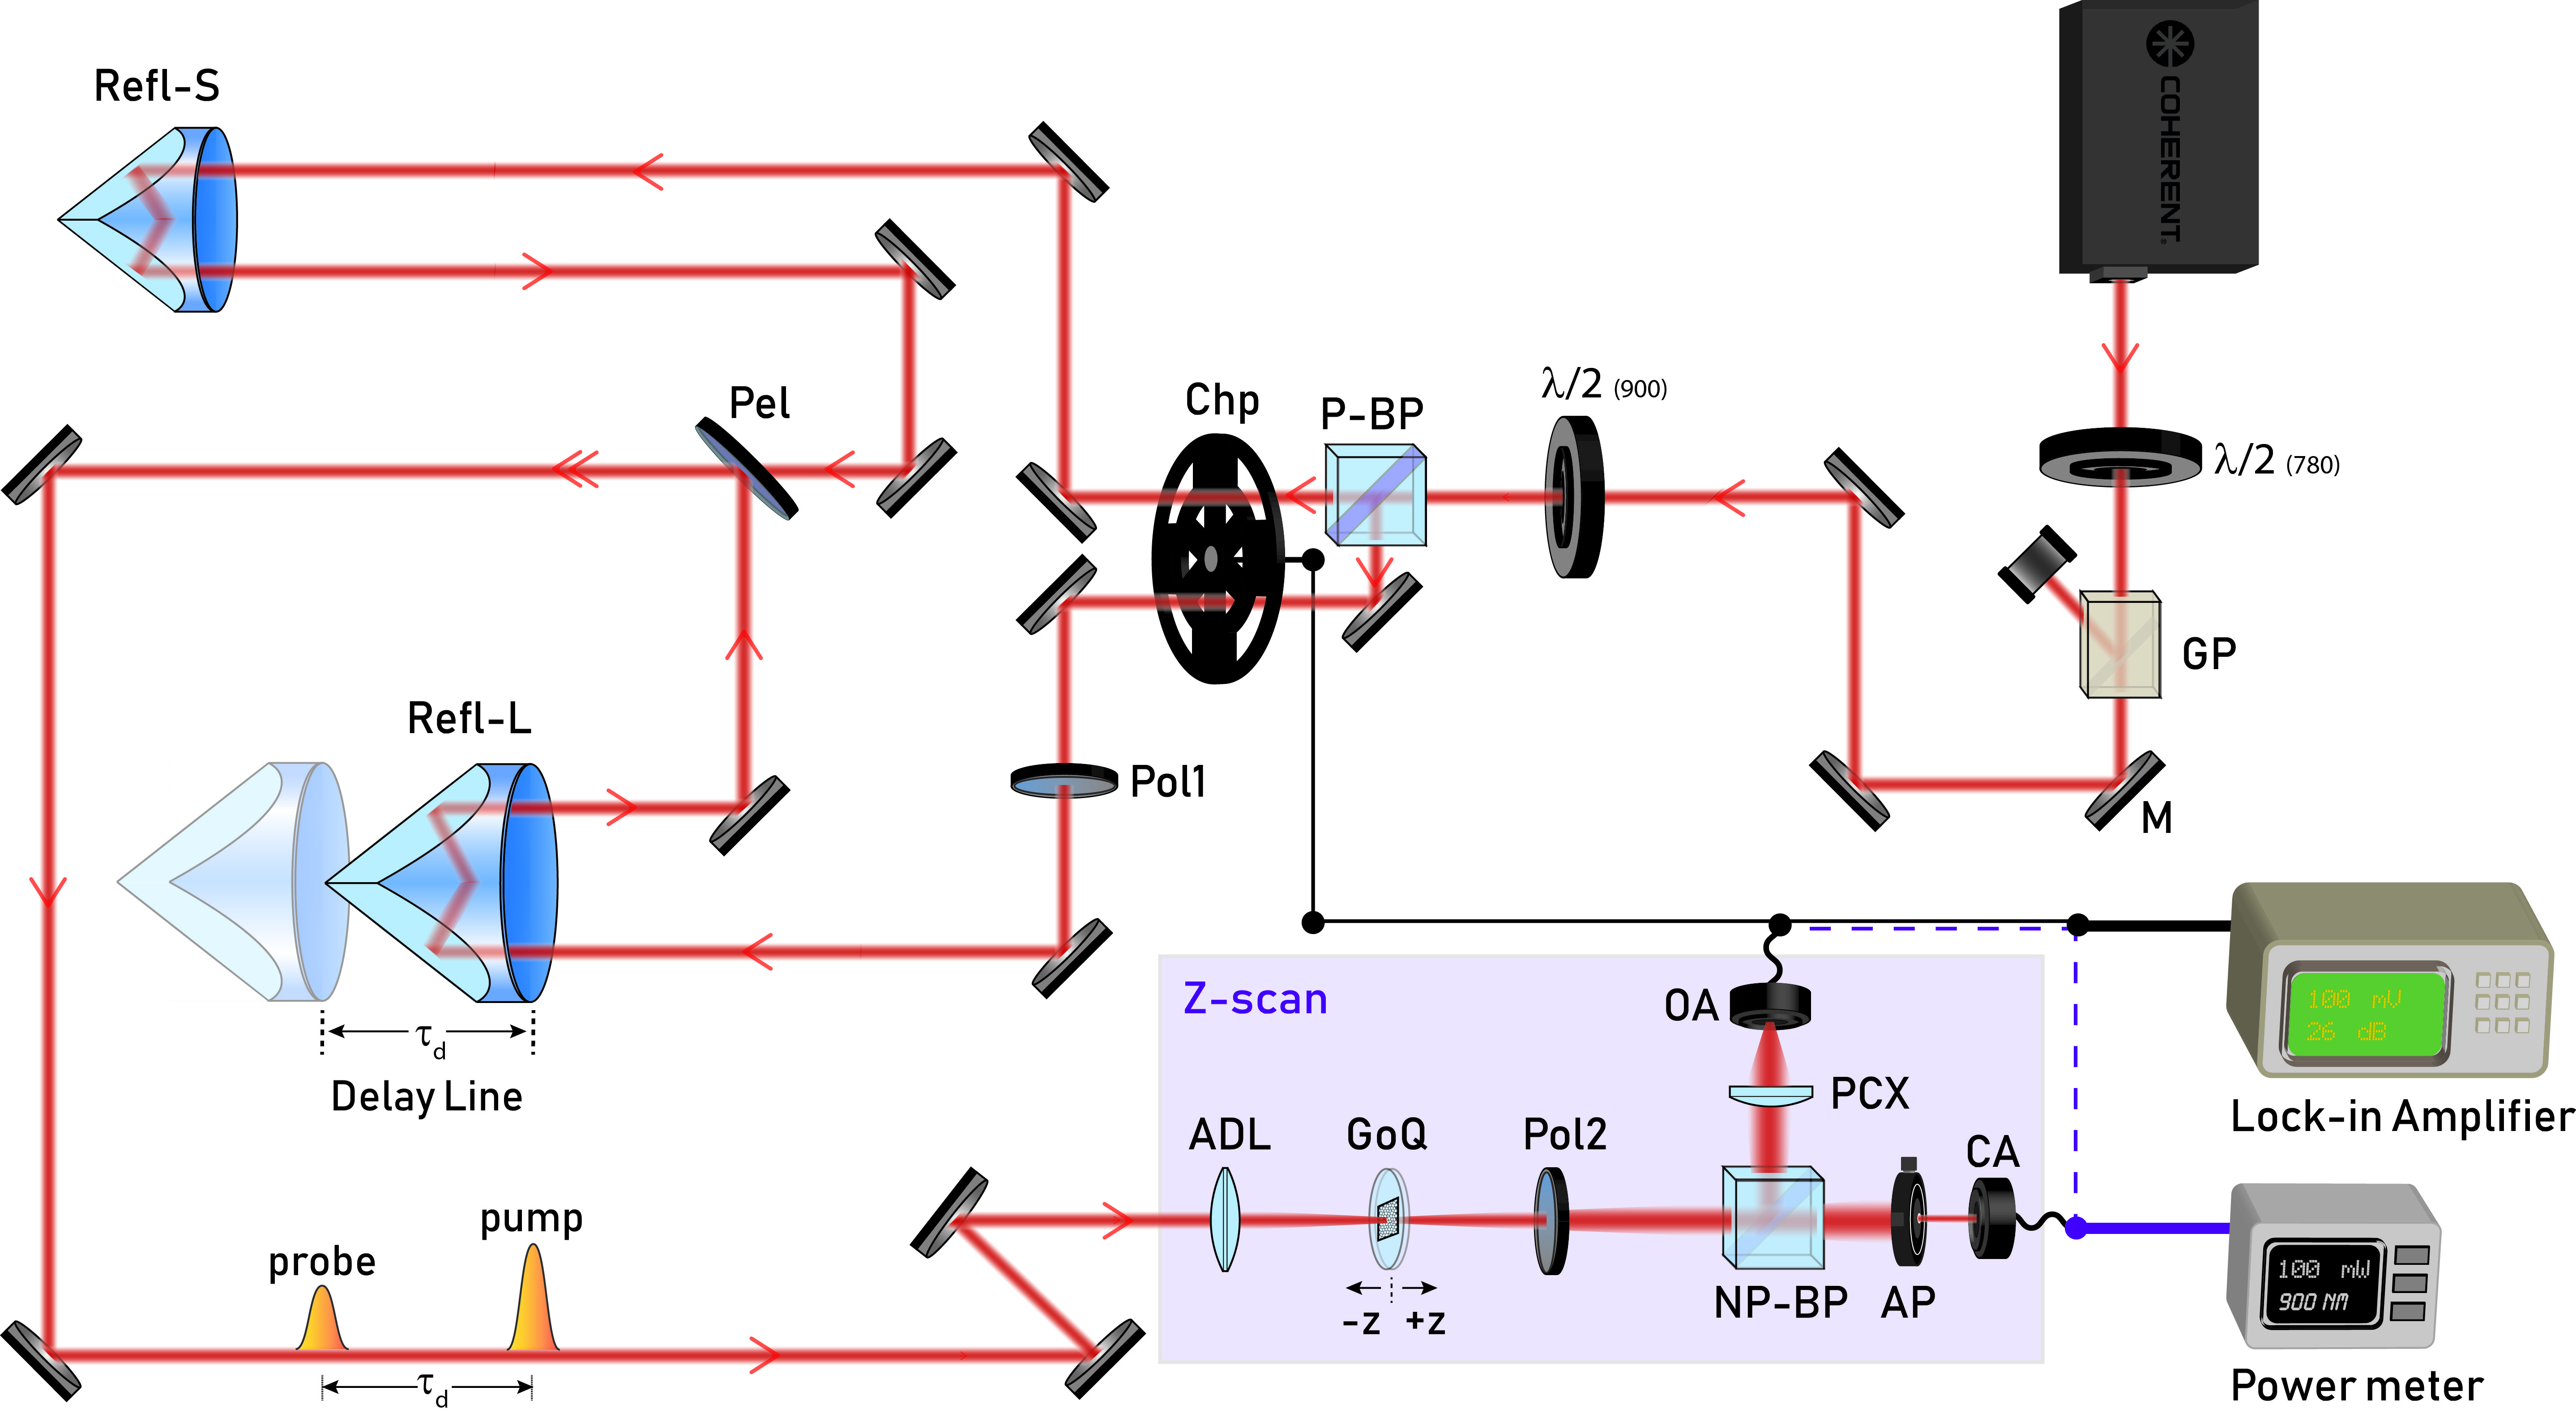
Originally introduced by Sheik-Bahae et al. [28], the Z-scan technique proved to be an experimentally facile yet sensitive method to extract the phase and magnitude of the Kerr coefficient. The optically induced self-refraction is quantified by relating the phase modulation of the traversing beam to the transmittance in the far-field in Closed Aperture (CA) configuration, while the Open Aperture (OA) configuration captures the effect of absorption. This technique was modified by Wang et al. [29] to extract the temporal evolution through the integration of a secondary time delayed beam to obtain the time-resolved Z-scan measurement. The pump-probe integrated Z-scan set-up (PPZS) is schematically illustrated in Figure 1. The set-up is elucidated upon in the Methods section at the end of the article. The set-up can be operated in multiple modes of measurement. In the single-beam mode, the set-up is a standard Z-scan measurement. In dual-beam mode, with the addition of a lock-in amplifier, chopper and cross-polarisation filtering, the set-up can be used to perform a standard pump-probe measurement for the extraction of relaxation time constants. When used in conjunction with the Z-scan components, the dual-beam mode is used for the time-resolved Z-scan measurements.
Results and Discussion
Spectral-dependence
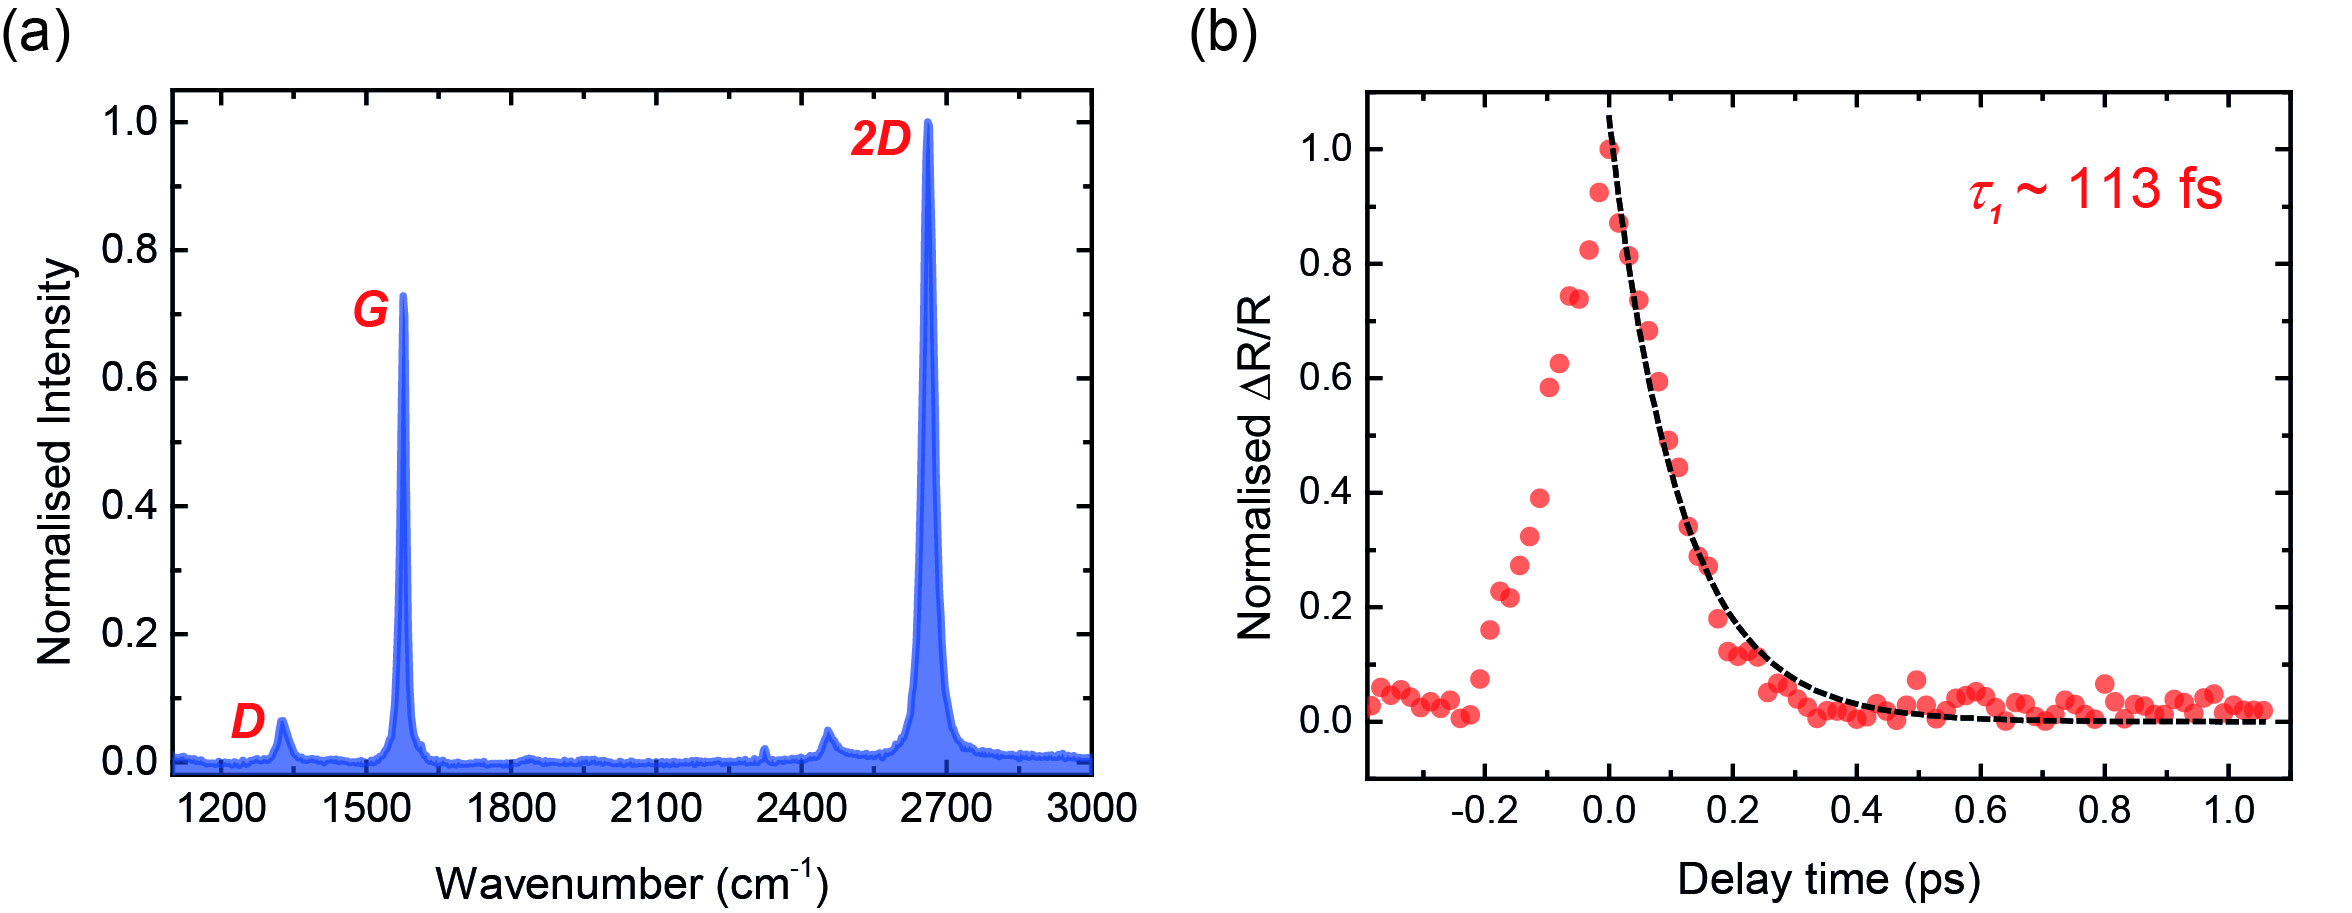
In order to verify the quality and monolayer nature of the samples, the CVD fabricated graphene on quartz (GoQ) samples (11 cm2) were characterised by Raman spectroscopy, shown in Figure 2a. The G-band, 2D-band and D-band peaks appear at 1576 cm-1, 2661 cm-1 and 1328 cm-1, respectively. The relative intensities and widths of the G and 2D peaks confirm that the sample is single layer. We also perform a temporal correlation measurement on the sample, shown in Figure 2b, to obtain a relaxation time constant of about 113 fs.
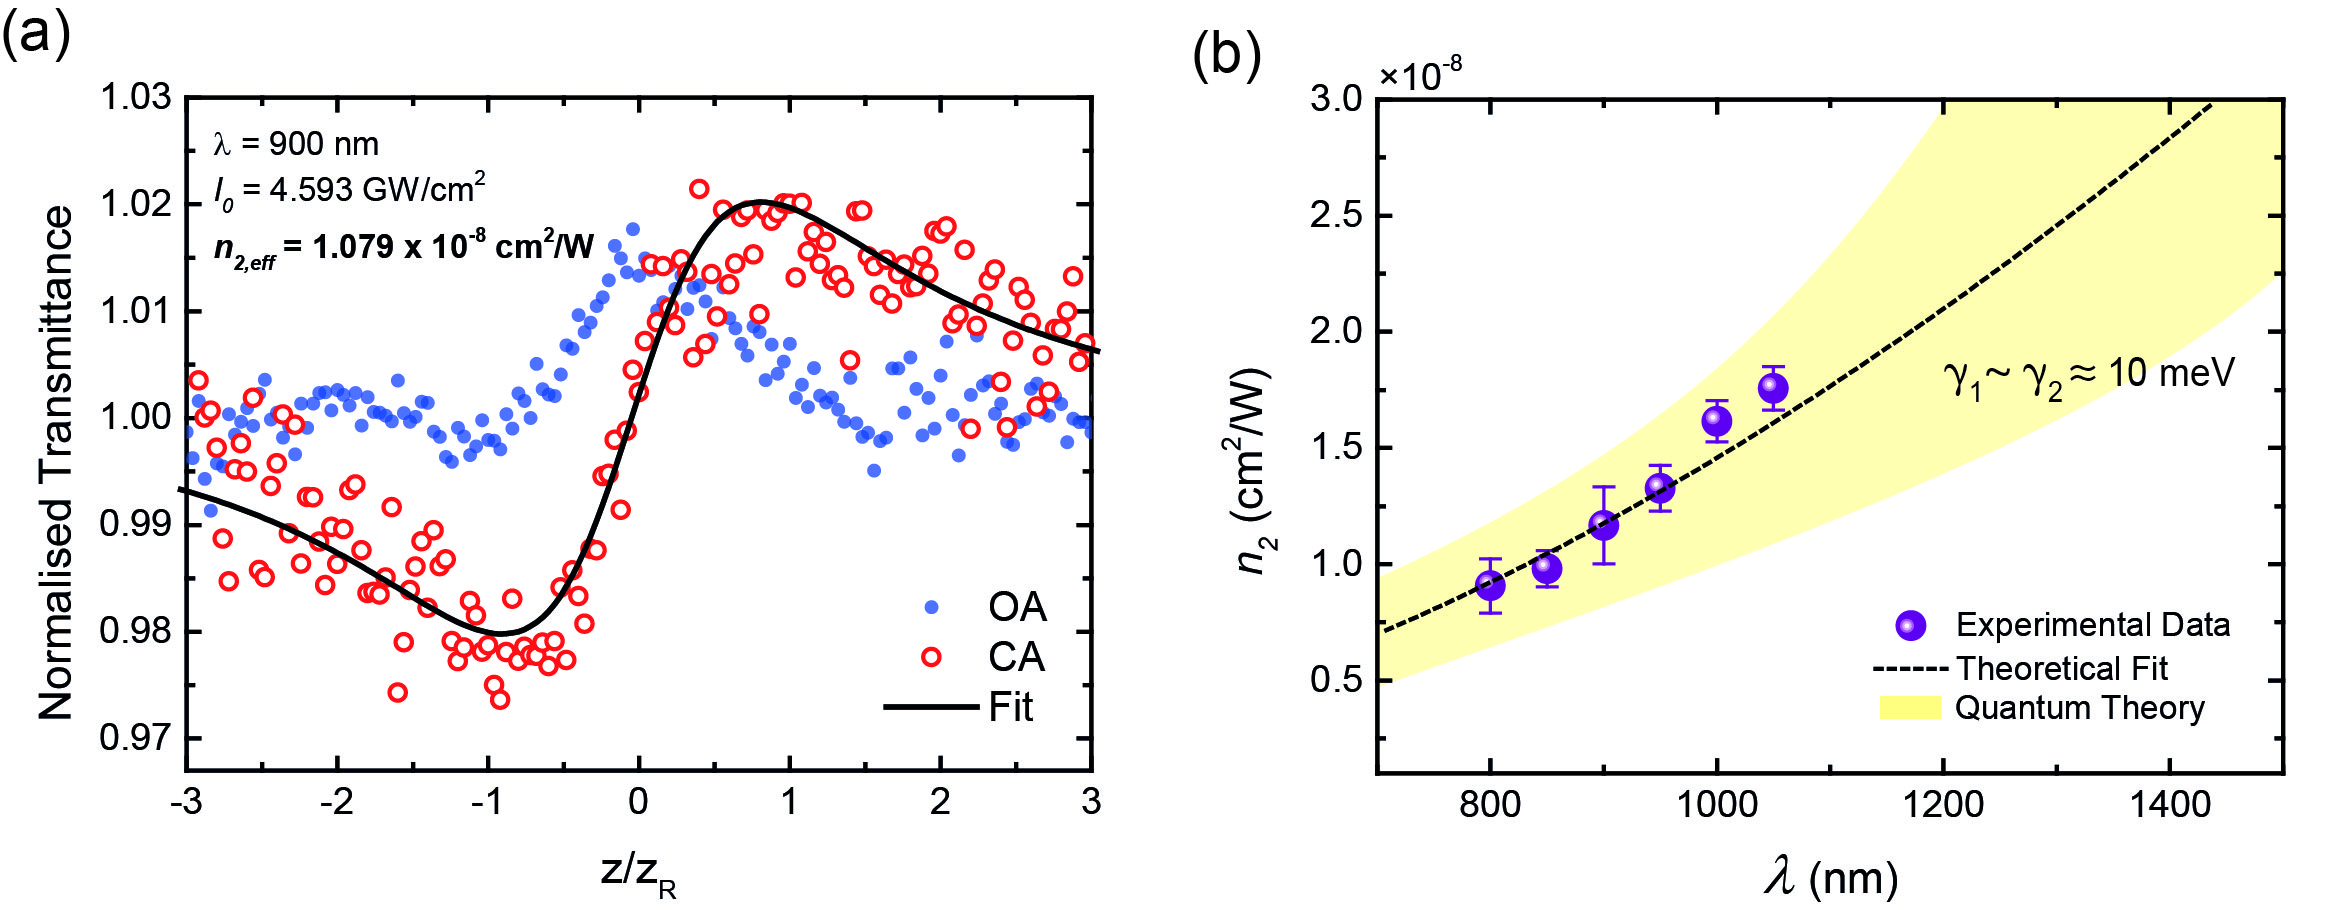
The spectral dependence of is obtained in the single-beam Z-scan mode and is measured by scanning the 100 fs excitation source from 800 to 1050 nm with 50 nm increments. The range of the excitation is limited by tunability of the laser (690-1050 nm). Since the measurement is sensitive to the beam quality, the beam is characterised using a knife edge beam profiler for quality and stability over the period of the measurement. To ensure that the Z-scan modulation observed in the far-field is originating from graphene, a bare quartz substrate is measured at 900 nm at high on-axis irradiance to show no effect (see supplementary Figure S5). The on-axis irradiance ranges from 1.5 to 5 GW/cm2, limited by the available power of the laser at each wavelength. A standard acquired Z-scan trace showing the OA, CA and Fit is shown in Figure 3a. The effects of saturation resulting in decrease of with increasing irradiance is observed and shown at 950 nm in Figure S6 in supporting information.
The cumulative results of the spectral dependence are presented in Figure 3b along with the quantum theory based fit. A full set of Z-scan fits from which these results are compiled is also provided for reference (Figure S7 in supporting information). The values for in this regime are measured to be positive and range from 9.0710-9 to 1.7610-8 cm2/W in this excitation range which fits well with our quantum model with relaxation coefficients of . The fitting parameters, , are obtained from the time constants derived from the temporal cross-correlation measurement, shown in Figure 2b. However, the pulse width of the pump and probes signals pose some uncertainties on the obtained decay constant of 113 fs as the correlated pulses are of similar pulse durations. This uncertainty is accounted for in our theoretical model and is illustrated by the shaded (yellow) region in Figure 3b. Shorter wavelengths are observed to have a value that is lower as compared to longer wavelengths, with approximately the same on-axis irradiance. Our calculation suggests a quadratic dependence of on which agrees with the experimental results. It is noted that exhibits negligible dependence on the Fermi level for a low-doped graphene monolayer. In our case is dominated by contributions from interband transitions and since the dependence is a direct consequence of the linear band diagram around the Dirac point, the most relevant transition occur at the zero detuning region where . Detuning is defined as , where is the frequency of the excitation photon and is the energy of the transition, see Figure 4a. The theoretical model employed in our theory uses semiconductor Bloch equations (SBEs) to describe the cooperative intra-interband dynamics of the population difference (between the valence and conduction bands) and the polarisation (coherence) for the Bloch state k. The phenomenological relaxation coefficients, , account for the collective broadening effects for the population and coherence decay, respectively. Under our theory, the electromagnetic coupling for normal illumination is defined by , where E is the electric field and the unit vector is defined as , shown in Figure 4a.
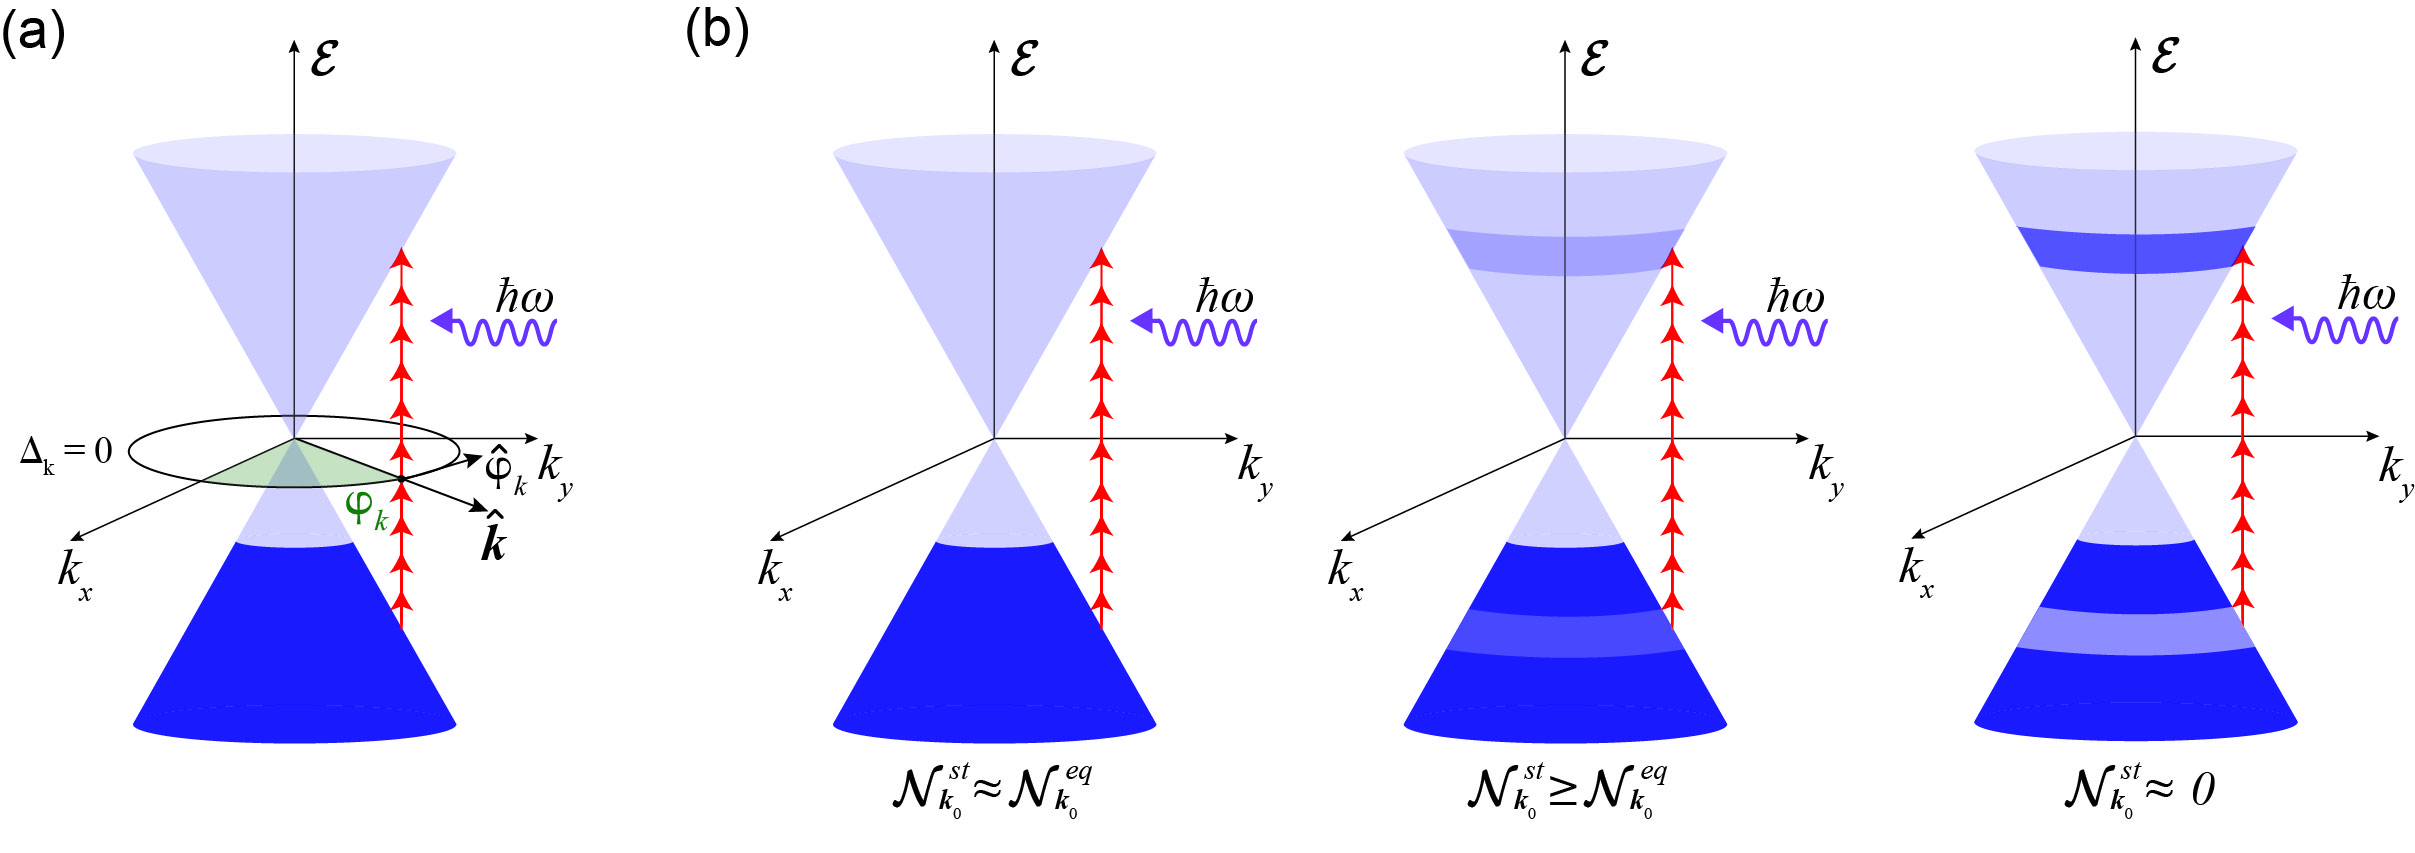
The nonlinear optical absorption has multiple origins namely bleaching effects culminating in saturation, and two photon absorption. Since the graphene sample used in our experiment is low-doped (i.e ), absorption bleaching due to optically induced Pauli-blocking plays the leading role. This assumption is supported by observation of the absorption drops upon high optical irradiance, refer to the OA trace in Figure 3a. Furthermore, since the Fermi energy level is small compared to the energy of the photons, it naturally follows that Pauli blocking around zero detuning region is widely demolished. Under high intensity illumination in a Kerr-type material, the charged carriers undergo ultrafast Rabi oscillations, much faster than their relaxation rate. As a consequence the steady state population, , is significantly modified by light, disturbing the distribution at equilibrium, . The origin of the Kerr-type nonlinearity is the optically induced change to the steady-state population difference. The relaxation dynamics as the population difference evolves is schematically shown in Figure 4b. Before saturation takes place, the nonlinear contribution of the field to the population difference around the zero detuning region is a quadratic function of the field magnitude, . The induced nonlinear current oscillating at the frequency is then given by , where the Lorenztian accounts for the interband transitions. The nonlinear current is the microscopic origin of the intensity dependence of the refractive index so that . For a small enough , the Kerr-type nonlinear induced current is given by
| (1) |
where and are the spin and valley degeneracy factors, respectively, is the density of states, and is a dimensionless quantity that arises from angular integration around the Dirac cone. Due to low doping, over the zero detuning circle. Therefore, the frequency dependence of nonlinear current is dominated by the term appearing in Eq. 1. Over the circle the Bloch wave-number is linearly proportional to the frequency which in turn yields dependence of the Kerr nonlinear coefficient.
It is worth pointing out that the quadratic wavelength dependence of the Kerr coefficient is a direct consequence of the linear energy-momentum dispersion of the Dirac quasi-particles. The calculations outlined above can be effectively applied to all two-level condensed matter systems by appropriately replacing interband coupling into Eq. 1. However, exclusive to graphene is the dependence of the interband coupling which results in the square wavelength dependence of the Kerr coefficient .
Temporal evolution
The temporal evolution of the nonlinearity is obtained using the dual-mode PPZS set-up. A single-beam (pump) Z-scan measurement is performed to locate the peak and valley positions of the sample. In order to locate the zero delay position of the probe, the sample (GoQ) is placed at the peak position and the probe is scanned until a cross-correlation signal of the pump and probe pulses is obtained, shown in the inset of Figure 5. The FWHM of the signal is 150 fs, which gives a pulse duration of 110 fs for the probe, considering a pulse duration of 102 fs for the pump. A similar scan is run at the valley position and both time-resolved data sets are used to extract the differential peak-valley transmittance, , where are the positions of the peak and valley, respectively, is the probe delay, and is the OA transmittance for normalisation. The sign of is given by the sign of . The pump power used for this measurement was 200 mW, equating to an intensity of 3.5 GW/cm2. The pump to probe power ratio was kept at 20:1. In general, the far-field aperture should only allow about 1 of light transmittance to isolate the effect of wave front distortion due to phase modulation, however, due to the weak signal of the probe the aperture is opened to allow 10 of transmittance with additional averaging at each acquisition point.
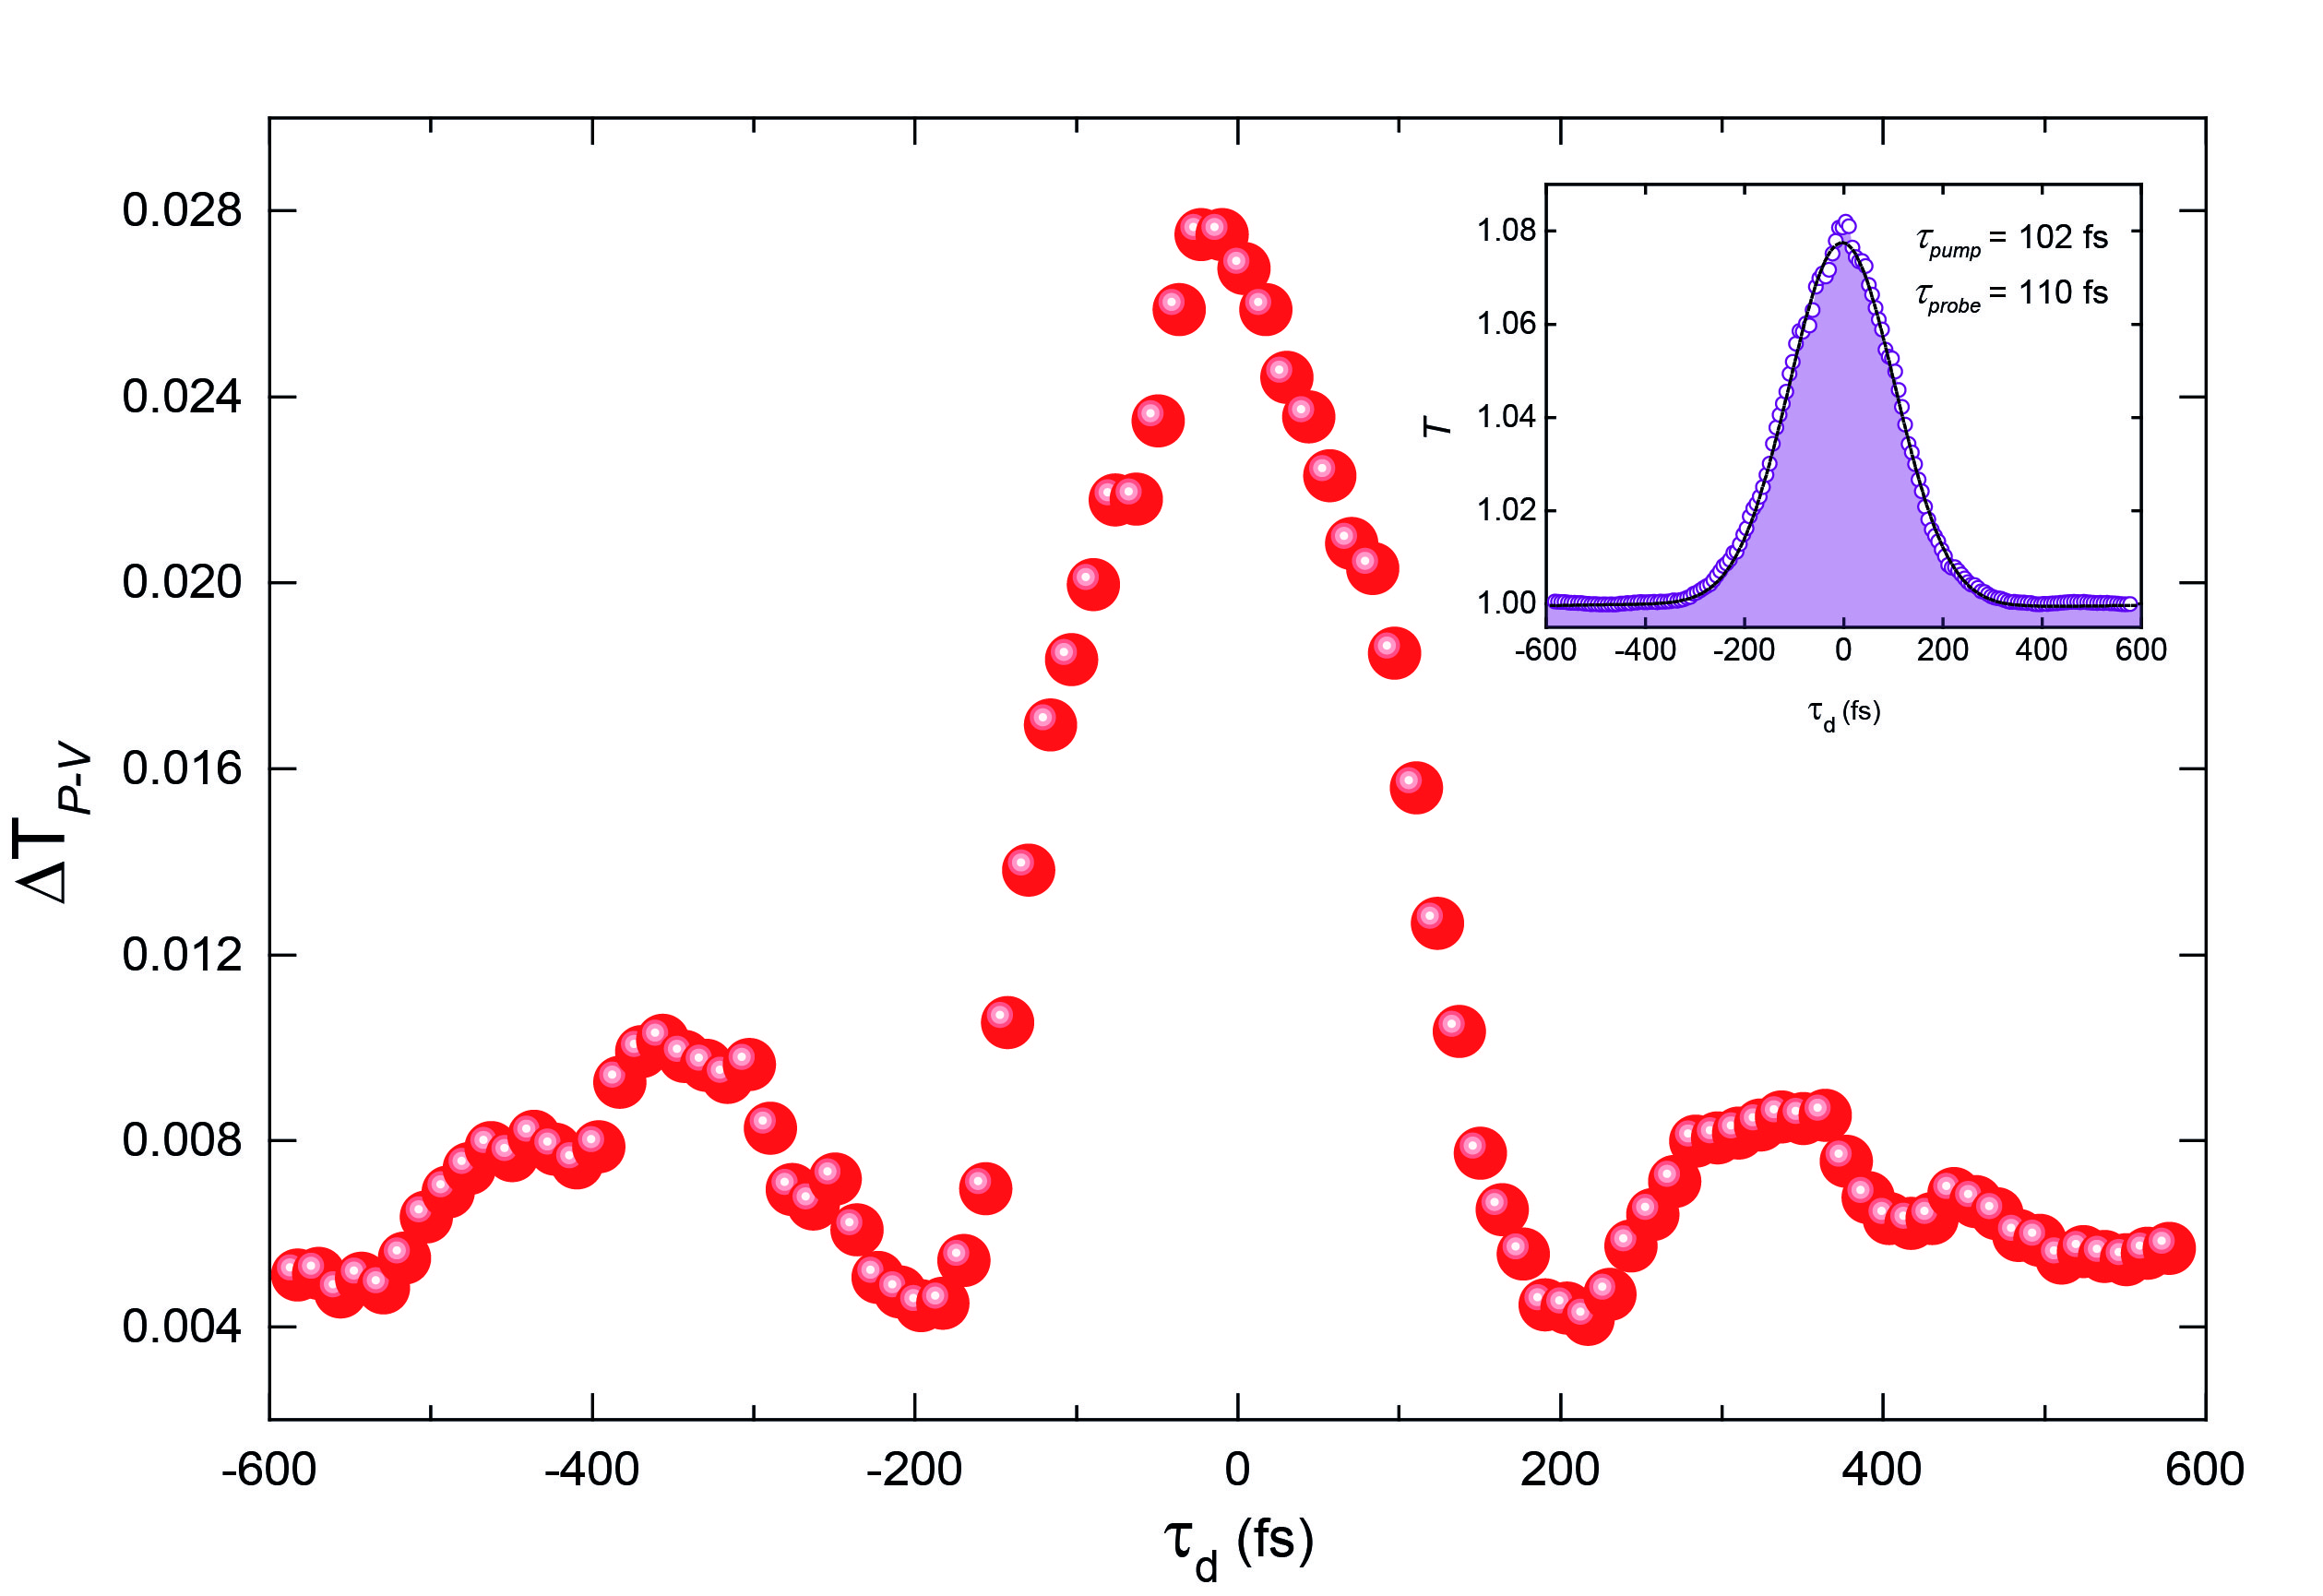
The temporal evolution of the nonlinearity is shown in Figure 5b. The effect peaks at zero probe delay and relaxes on the time-scale of , while at longer time scales, , shows no discernible variation. The symmetric shape of the figure leads us to believe that in this measurement we are simply observing the probe following the pump signals rather than unravelling the nonlinear phenomena hidden at shorter time scales. This is also supported by the fact that the pulse duration of the pump and probe is similar to the measured temporal cross-correlation extracted in Figure 2b. Therefore, we can conclude that the relaxation dynamics contributing to the observation of the nonlinear refraction are simply too fast to be measured by our laser pulses in this manner. The variation of or the induced phase shift seen in Figure 5 relates to the Gaussian power distribution within the pump pulse which reaches its maximum value (i.e. 3.5 GW/cm2) at the center peak of the pulse. Therefore, according to (See Methods), the for the peak power is extracted to be 1.1210-8 cm2/W. As the intensity decreases moving away from the peak, the increasing in accordance with saturation. This measurement clearly shows that on the time scale greater than the heating and cooling times, the probe follows the pump and Kerr nonlinearity is tunable and controllable over this time scale. The modulation is understood through the relation , where , and the parameter is modified as the varies nonlinearly on the intensity prior to complete saturation [5].
For the purposes of all-optical switching the on/off time of the nonlinearity is controlled by the pulse-duration and power of pulse. If the pulse-duration is longer than the effective relaxation times of the nonlinearity, then the evolution of the observed nonlinearity simply follows the Gaussian power distribution of the pulse. In this way through modulation of the term, by changing the pulse properties, the switch can be controlled. However, there is saturation that takes place at relatively high intensities, leading to a deviation between the pump power within the pulse and the observed .
Pulse-width dependence
It is well understood that the relative timescales of the excitation pulse and the system response times determine the induced dynamics in the system. To investigate the effects of pulse duration on nonlinear refraction, we stretch the 100 fs pulse upto 475 fs at 900 nm to observe the effects in the long pulse regime; longer than the duration of the nonlinearity or relaxation time, . Pulse stretching is achieved using a dispersion based prism-pair apparatus, where the pulse can be temporally expanded by varying the separation distance of prisms[30]. A schematic of the set-up is shown in Figure S8 in supplementary information. In our set-up we use N-SF11 flint glass prisms. The maximum allowed pulse expansion is limited by the space on the optical table. The autocorrelation curves for the expanded pulses at which the Z-scan is performed are given in Figure 6a and the results of the pulse-width dependence are provided in Figure 6b. A set of Z-scan fits for the presented data is also provided in Figure S9 in supporting information.
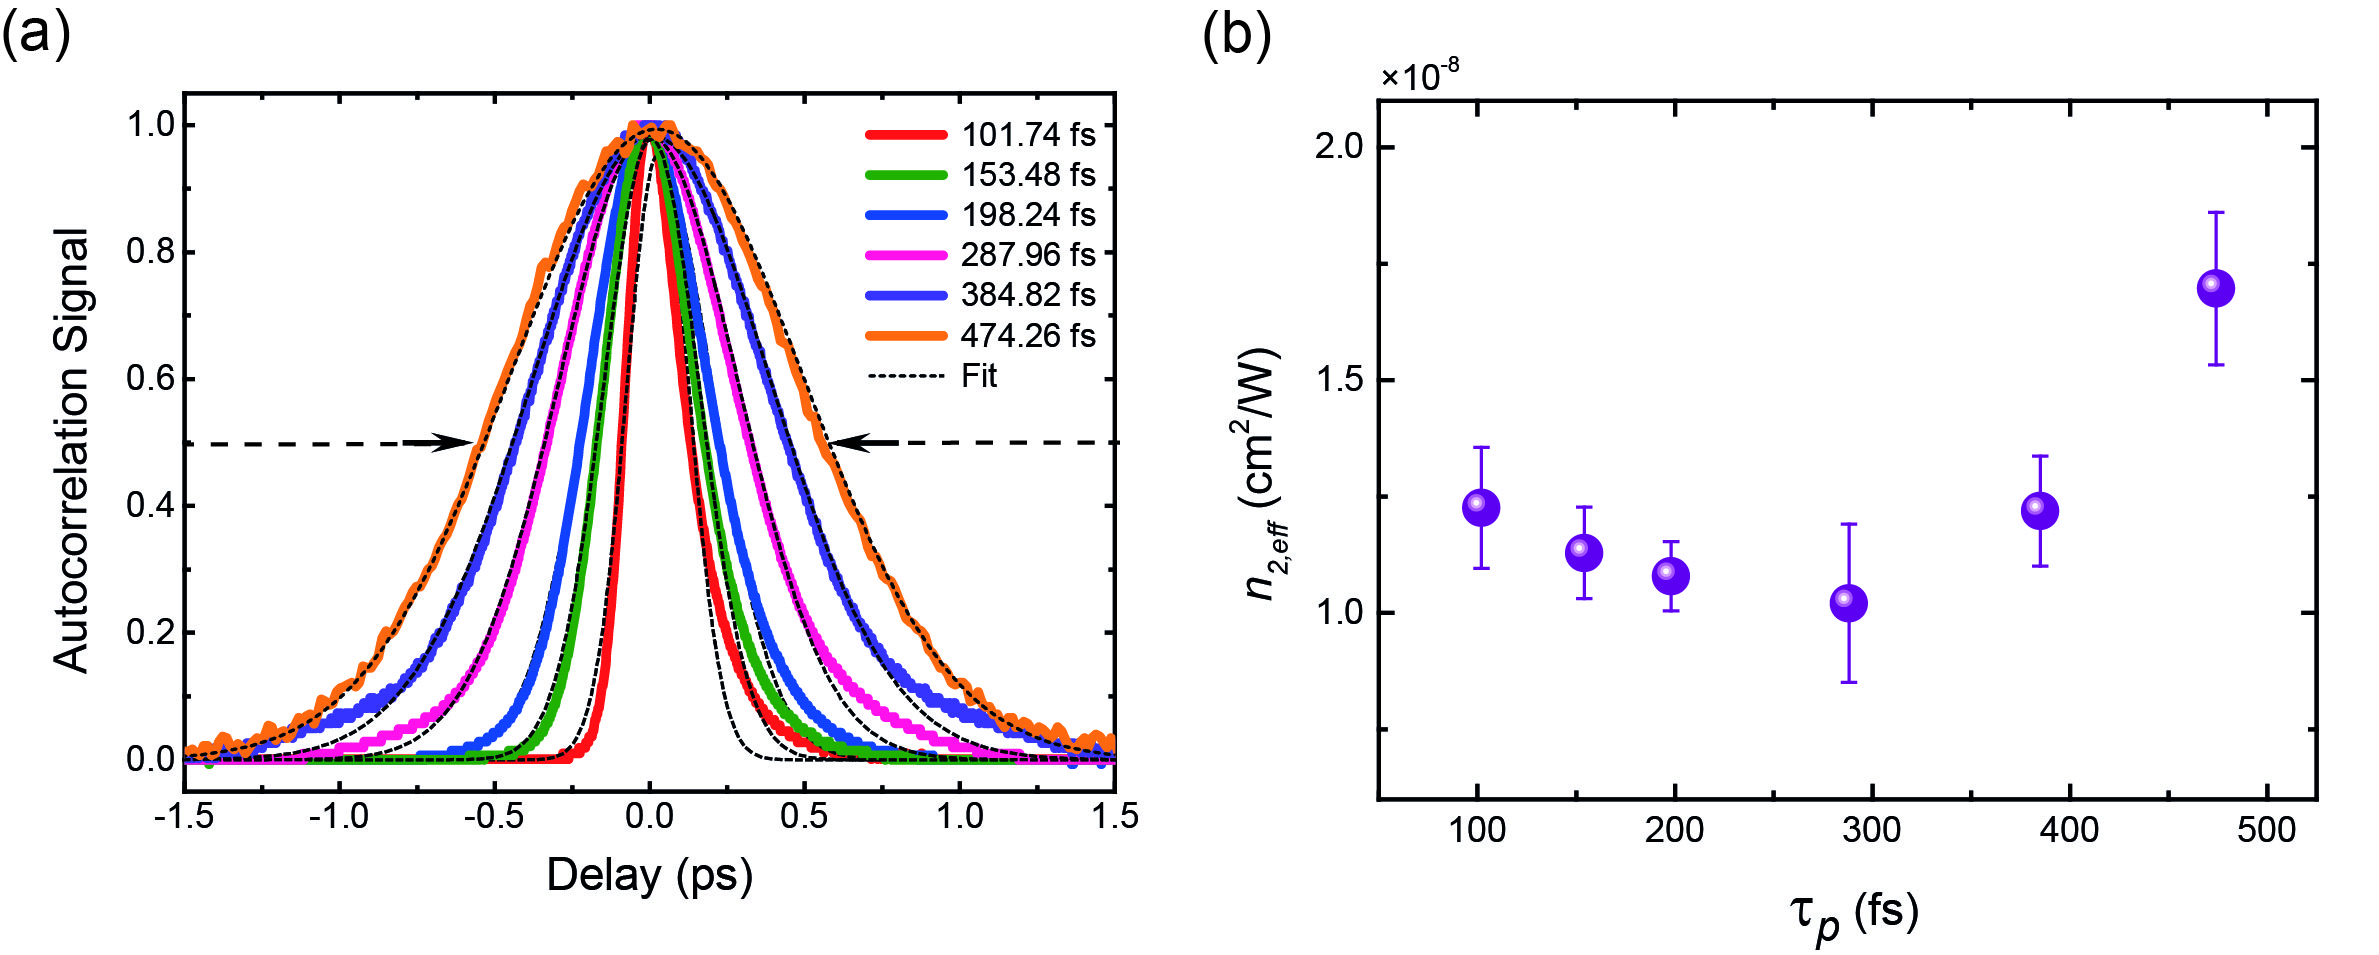
The results show a clear dependence of on the excitation pulse duration, with becoming larger with increasing pulse-width. This trend was theoretically speculated by Vermeulen et al.[10] and shown here experimentally. The ranges from 1.0210-8 to 1.710-8 cm2/W in this pulse duration regime with a minimum between 200-300 fs. The decay constant 113 fs measured in Figure 2b falls near the beginning of the data set. However, doping can modify the decay constant values with p- and n-doping making the time constants long and shorter, respectively[31]. This data trend coincides with previously reported Z-scan studies on graphene performed with picosecond excitation where the is larger than what is reported in the femtosecond regime. In addition to this, a similar comparative analysis performed on carbon disulphide (CS2), reference material used for calibration of Z-scan measurements, revealed a similar dependence of the on pulse duration[32]. In a recent publication[10], this pulse-width dependence of is theoretically derived for a regime when the effective decay constant is larger than the pulse duration in Z-scan measurements. The interplay of relative carrier heating and cooling times is said to induce a nonlinear response that may not originate only from the conventional electronic Kerr-type nonlinearity but also from what they refer to as saturable photoexcited-carrier refraction (SPCR). The saturability in graphene deviates from saturability in other 2D materials due to the presence of its unique gapless band structure which facilitates spontaneous saturation near the Dirac point even when there is no field [23]. Therefore, it is apt that we refer to the Kerr-type nonlinearity characterised using the Z-scan method as .
Conclusions
Through the systematic measurement and analysis of the effect of the spectral and temporal properties of the pulse, we were able to gain a more fundamental understanding of the parameters governing the observed nonlinear optical effect in graphene. This sheds significant light on the widespread debate in the field regarding the large variation in the value for graphene due to varying experimental conditions and sample preparation techniques. The dependence of on the exciting wavelength revealed a quadratic () relationship both experimentally and theoretically. The time-resolved Z-scan measurement revealed that the heating and cooling dynamics within our graphene sample are too fast to be probed using 100 fs pulses using this method. However, this method reveals a practical application in all-optical ultrafast switching of the nonlinearity, completely controlled by the pulse-duration and power of the impinging laser pulse. Through the pulse-duration dependent measurement, we were able to confirm the theoretically predicted relationship between and the laser pulse-duration in the hundreds of femtosecond regime, with growing larger with longer pulse-duration. Throughout all our experiments, the value for remains positive. With this study we have gained a fundamental understanding of the underlying processes governing the nonlinear optical phenomena and parameters to modulate the effect. In doing so we can accurately form predictable models for the purposes of nonlinear photonic device design.
Methods
Pump-probe integrated Z-scan measurement.
The experimental set-up for this measurement is illustrated in Figure 1. The excitation source is a high-power Ti:sapphire laser (Coherent Chameleon Vision S) delivering 100 fs pulses at wavelengths tunable from 690 to 1050 nm, at a repetition rate of 80 MHz. When operating in single beam mode, the set-up is a classic Z-scan measurement. The beam is focused onto the sample using an anti-reflection (AR) coated achromatic doublet lens (ADL) with a focal length of 75 mm. The beam is bisected in the far-field by an AR coated non-polarising beam splitter (NP-BP) to obtain the OA and CA profiles. The OA is used to normalise for absorption and laser fluctuations in the CA trace. The normalised CA transmittance is fitted to the equation: , where is the Rayleigh length () normalised position () and is the nonlinearity induced phase shift. When a pulsed source is used with pulse-width comparable to the duration of the nonlineairty, the nonlinear refractive index is extracted via , where is the wave vector, is the on-axis irradiance and is the effective length of the sample [33]. In dual-beam mode, we use degenerate pump and probe at 900 nm, in a collinear configuration with a 20:1 pump/probe ratio. The pump and probe are orthogonally polarised using a waveplate (/2), polarising beam-splitter (P-BS) and polariser (Pol1) before the sample. An analyser polariser (Pol2) placed after the sample is rotated to achieve extinction of the pump beam.
References
- [1] Wallace, P. R. The band theory of graphite. \JournalTitlePhysical Review 71, 622–634, DOI: 10.1103/PhysRev.71.622 (1946).
- [2] Novoselov, K. S. et al. Electric field effect in atomically thin carbon films. \JournalTitleScience 306, 666–669, DOI: 10.1126/science.1102896 (2004).
- [3] Semnani, B., Majedi, A. H. & Safavi-Naeini, S. Nonlinear quantum optical properties of graphene. \JournalTitleJournal of Optics 18, 035402, DOI: 10.1088/2040-8978/18/3/035402 (2016).
- [4] Hendry, E., Hale, P. J., Moger, J., Savchenko, A. K. & Mikhailov, S. A. Coherent nonlinear optical response of graphene. \JournalTitlePhysical Review Letters 105, 97401, DOI: 10.1103/PhysRevLett.105.097401 (2010).
- [5] Zhang, H. et al. Z-scan measurement of the nonlinear refractive index of graphene. \JournalTitleOptics Letters 37, 1856, DOI: 10.1364/OL.37.001856 (2012).
- [6] Krishna, M. B. M., Kumar, V. P., Venkatramaiah, N., Venkatesan, R. & Rao, D. N. Nonlinear optical properties of covalently linked graphene-metal porphyrin composite materials. \JournalTitleApplied Physics Letters 98, 081106, DOI: 10.1063/1.3553500 (2011).
- [7] Ciesielski, R. et al. Graphene near-degenerate four-wave mixing for phase characterization of broadband pulses in ultrafast microscopy. \JournalTitleNano Letters 15, 4968–4972, DOI: 10.1021/acs.nanolett.5b00893 (2015).
- [8] Jiang, T. et al. Gate-tunable third-order nonlinear optical response of massless dirac fermions in graphene. \JournalTitleNature Photonics DOI: 10.1038/s41566-018-0175-7 (2018).
- [9] Vermeulen, N. et al. Negative kerr nonlinearity of graphene as seen via chirped-pulse-pumped self-phase modulation. \JournalTitlePhysical Review Applied 6, 044006, DOI: 10.1103/PhysRevApplied.6.044006 (2016).
- [10] Vermeulen, N. et al. Graphene’s nonlinear-optical physics revealed through exponentially growing self-phase modulation. \JournalTitleNature Communications DOI: 10.1038/s41467-018-05081-z (2018).
- [11] Chen, W. et al. The nonlinear optical properties of coupling and decoupling graphene layers. \JournalTitleAIP Advances 3, 042123, DOI: 10.1063/1.4802889 (2013).
- [12] Miao, L. et al. Broadband ultrafast nonlinear optical response of few-layers graphene: toward the mid-infrared regime. \JournalTitlePhotonics Research 3, 214–219, DOI: 10.1364/PRJ.3.000214 (2015).
- [13] Demetriou, G. et al. Nonlinear optical properties of multilayer graphene in the infrared. \JournalTitleOptics Express 24, 13033–13043, DOI: 10.1364/OE.24.013033 (2016).
- [14] Dremetsika, E. et al. Measuring the nonlinear refractive index of graphene using the optical kerr effect method. \JournalTitleOptics Letters 41, 3281–3284, DOI: 10.1364/OL.41.003281 (2016).
- [15] Ahn, K. J. et al. Wavelength and fluence-dependent third-order optical nonlinearity of mono- and multi-layer graphene. \JournalTitleApplied Optics 56, 9920–9924, DOI: 10.1364/AO.56.009920 (2017).
- [16] Soh, D. B. S., Hamerly, R. & Mabuchi, H. Comprehensive analysis of the optical kerr coefficient of graphene. \JournalTitlePhysical Review A 94, 023845, DOI: 10.1103/PhysRevA.94.023845 (2016).
- [17] Ooi, K. J., Ang, L. K. & Tan, D. T. Waveguide engineering of graphene’s nonlinearity. \JournalTitleApplied Physics Letters 105, 111110, DOI: 10.1063/1.4895934 (2014).
- [18] Cheng, J., Vermeulen, N. & Sipe, J. Numerical study of the optical nonlinearity of doped and gapped graphene: From weak to strong field excitation. \JournalTitlePhysical Review B 92, 235307, DOI: 10.1103/PhysRevB.92.235307 (2015).
- [19] Mikhailov, S. A. & Ziegler, K. Nonlinear electromagnetic response of graphene: frequency multiplication and the self-consistent-field effects. \JournalTitleJournal of Physics: Condensed Matter 20, 384204, DOI: 10.1088/0953-8984/20/38/384204 (2008).
- [20] Zhang, Z. & Voss, P. L. Full-band quantum-dynamical theory of saturation and four-wave mixing in graphene. \JournalTitleOptics Letters 36, 4569–4571, DOI: 10.1364/OL.36.004569 (2011).
- [21] Cheng, J. L., Vermeulen, N. & Sipe, J. E. Third order optical nonlinearity of graphene. \JournalTitleNew Journal of Physics 16, 053014, DOI: 10.1088/1367-2630/16/5/053014 (2014).
- [22] Chatzidimitriou, D., Pitilakis, A. & Kriezis, E. E. Rigorous calculation of nonlinear parameters in graphene-comprising waveguides. \JournalTitleJournal of Applied Physics 118, 023105, DOI: 10.1063/1.4926501 (2015).
- [23] Semnani, B. et al. Anomalous optical saturation of low-energy dirac states in graphene and its implication for nonlinear optics. \JournalTitlearxiv (2018). arXiv:1806.10123.
- [24] Berciaud, S., Ryu, S., Brus, L. E. & Heinz, T. F. Probing the intrinsic properties of exfoliated graphene: Raman spectroscopy of free-standing monolayers. \JournalTitleNano Letters 9, 346–352, DOI: 10.1021/nl8031444 (2009).
- [25] Ogusu, K. & Shinkawa, K. Optical nonlinearities in silicon for pulse durations of the order of nanoseconds at 1.06 m. \JournalTitleOptics Express 16, 14780–14791, DOI: 10.1364/OE.16.014780 (2008).
- [26] Liu, Z. et al. Nonlinear optical properties of graphene oxide in nanosecond and picosecond regimes. \JournalTitleApplied Physical Letters 94 (2009).
- [27] Meng, F. et al. Saturable absorption of femtosecond optical pulses in multilayer turbostratic graphene. \JournalTitleOptics Express 24, 15261–15273, DOI: 10.1364/OE.24.015261 (2016).
- [28] Sheik-Bahae, M., Said, A. A. & Stryland, E. W. V. High-sensitivity, single-beam measurements. \JournalTitleOptics Letters 14, 955–957, DOI: 10.1364/OL.14.000955 (1989).
- [29] Wang, J., Sheik-Bahae, M., A. A. Said, D. J. H. & Stryland, E. W. V. Time-resolved z-scan measurements of optical nonlinearities. \JournalTitleJournal of the Optical Society of America B 11, 1009–1017, DOI: 10.1364/JOSAB.11.001009 (1994).
- [30] Sherriff, R. E. Analytic expressions for group-delay dispersion and cubic dispersion in arbitrary prism sequences. \JournalTitleJournal of the Optical Society of America B 15, 1224–1230, DOI: 10.1364/JOSAB.15.001224 (1998).
- [31] Johannsen, J. C. et al. Tunable carrier multiplication and cooling in graphene. \JournalTitleNano Letters 15, 326–331, DOI: 10.1021/nl503614v (2015).
- [32] Nikolakakos, I., Major, A., Aitchison, J. & Smith, P. Broadband characterization of the nonlinear optical properties of common reference materials. \JournalTitleIEEE Journal of Selected Topics in Quantum Electronics 10, 1164 – 1170, DOI: 10.1109/JSTQE.2004.836007 (2004).
- [33] Sheik-Bahae, M., Said, A. A., Wei, T.-H., Hagan, D. J. & Stryland, E. W. V. Sensitive measurement of optical nonlinearities using a single beam. \JournalTitleIEEE Journal of Quantum Electronics 26, 760–769, DOI: 10.1109/3.53394 (1990).
Acknowledgements
S.T., B.S. and A.H.M. acknowledge the financial support received from the Natural Science and Engineering Research Council of Canada (NSERC) and internal funding from U.W. B.S. and S.S.N. also acknowledge the financial support provided by the Quantum Quest Seed Fund (QQSF).
Author contributions statement
S.T., B.S., and A.H.M. defined the project and conceived the experiment(s). S.T. and B.S. conducted the experiment(s), B.S. developed the theoretical model and S.T. analyzed the results, under the guidance of A.H.M. and S.S.N. S.T. and B.S. wrote the manuscript and all authors reviewed the manuscript.
Additional information
Competing interests:
The author(s) declare no competing interests
Supplementary information is available from the corresponding author upon request.
Data availability: Experimental data presented in this article is available from the corresponding author upon request.