Triplet Lifetime in Gaseous Argon
Abstract
MiniCLEAN is a single-phase liquid argon dark matter experiment. During the initial cooling phase, impurities within the cold gas (140 K) were monitored by measuring the scintillation light triplet lifetime, and ultimately a triplet lifetime of 3.480 0.001 (stat.) 0.064 (sys.) s was obtained, indicating ultra-pure argon. This is the longest argon triplet time constant ever reported. The effect of quenching of separate components of the scintillation light is also investigated.
pacs:
PACS-keydiscribing text of that key and PACS-keydiscribing text of that key1 Introduction
Argon, Neon and Xenon noble liquids are of extensive interest to both direct dark matter searches and neutrino physics experiments. The high scintillation light yield of argon in particular gives relatively good energy resolution and its low ionization potential makes it suitable for charge detection. In addition, argon is well-suited for building large volume detectors due to its relatively low cost. This paper presents the measurement of gaseous argon properties while the MiniCLEAN detector was in its cooling phase. MiniCLEAN is a prototype for the full scale CLEAN (Cryogenic Low-Energy Astrophysics with Noble liquids) program which is a single-phase liquid argon dark matter experiment.
In gaseous argon, the spectrum of scintillation light is produced in three continuous bands. The first continuum ranges from 104 nm to 110 nm, the second continuum peaks at 128 nm and the third continuum ranges from 180 nm to 230 nm.
The mechanism of primary scintillation from the second continuum is similar for liquid and gaseous argon. When the incident particle impinges on target atoms, the argon atoms are either excited or ionized. During the excitation process, an excited argon atom and two ground-state argon atoms are involved in a three-body collision, creating an excimer (excited dimer Ar). Alternatively, for the ionization process, an ionized argon atom recombines with electrons and goes through a three-body collision with two ground-state argon atoms to form the excimer. These excimer states are in either singlet () or triplet () molecular states0038-5670-26-1-R02 . Subsequently the scintillation light is emitted and the excimer disassociates. The lifetimes for singlet and triplet states are 6 ns (7 ns) and 3.2 s (1.6 s) in gaseousdoi:10.1063/1.452869 (liquidPhysRevB.27.5279 ) argon, respectively.
The first continuum shares the same origin as the second continuum but from higher vibrational statesPhysRevA.5.1110 Goubert1994360 . The origin of the third continuum is still under debate, with several authors postulating different chemical processes doi:10.1063/1.436447 PhysRevA.43.6089 0953-4075-27-9-014 Grimm1987394 . From the most recent study Wieser2000233 , at least four different states are involved in the process, possibly including three body collisions of Ar++ (Ar+∗) with ground state argon atoms. This process leads to the creation of Ar(Ar), which then decays radiatively.
In general, the relative contribution from each of the three continua depends on the pressure of the argon gas. In particular, the intensity of the first continuum decreases with increasing pressure. At low pressure, the second continuum’s contribution is small. The second continuum becomes dominant for pressures larger than approximately 0.8 bar, where the first continuum is negligible PhysRevA.5.1110 Goubert1994360 . The MiniCLEAN detector operates at 1.5 bar where the second and third continua are observable and contributions from the first continuum are highly suppressed.
Previous studies have also provided insight on the relative timing of the various scintillation continua. Scintillation light from the third continuum is very fast and contributes mainly to the prompt light 1748-0221-3-02-P02001 . As previously discussed, light from the second continuum is produced from excimers according to two well-separated time constants: a fast time constant from the singlet state, and a slow time constant from triplet state. According to Ref.1748-0221-3-02-P02001 , the scintillation light from the second continuum’s singlet states is also prompt, but slightly delayed on the order of ten nanoseconds compared to the third continuum component.
In the presence of impurities (e.g. ), there is a probability that the argon excimer will undergo a non-radiative collisional reaction with the impurity molecule. This non-radiative quenching process is in competition with the de-excitation process that leads to light emission. The singlet state is not strongly affected by this process, due to its very fast decay time, but with sufficiently high impurity concentrations ( 100 ppm) the singlet state can begin to be quenched as well1748-0221-6-08-P08003 . However, even impurity concentrations ppm can significantly reduce the triplet lifetime and total light yield. As such, the measurement of triplet lifetime can lead to an understanding of argon impurity level. Various triplet lifetime measurements in gaseous argon found in the literature are summarized in Table 1. Figure 1 plots the same experimental data points along with the function from doi:10.1063/1.452869 which predicts the behavior of triplet decay rate (inverse lifetime) as a function of density. It can be seen in the plot that the decay rate decreases (or lifetime increases) as density decreases. With a low density, the chances for the dimer state to be formed though three-body collisions is decreased, resulting in smaller decay rates (longer lifetimes) in pure argon. However, even with an impurity level at 1 ppm, the density effect alone can not explain the variation of triplet decay rates and lifetimes. A more complete explanation requires inclusion of the effects of impurities, which have been investigated by many groups1748-0221-3-02-P02001 1748-0221-6-08-P08003 1748-0221-5-06-P06003 1748-0221-5-05-P05003 .
In this paper we present the gas triplet lifetime measurements from MiniCLEAN and find the longest triplet lifetime, to our knowledge, that has so far been measured. Section 2 gives an overview of the MiniCLEAN detector and the purification process. Data analysis is presented in detail in Section 3. The results of the analysis of the MiniCLEAN cold gas run are described in Section 4. In Section 5, we present the results from the measurement of triplet lifetime and its relationship to the purity. In addition, the quenching effect of each component of light is discussed. In Section 6 we draw conclusions and summarize implications for future detector design.

| (s) | Ref. | Number density () | Estimated impurity level | Induced particle type |
|---|---|---|---|---|
| 2.8 | Thonnard et al.PhysRevA.5.1110 | 0.19 | 2 ppm | |
| 2.840.02 | Gleason et al.doi:10.1063/1.434079 | 4 | 1 ppm | |
| 2.86 | P. Millet et al.0022-3700-15-17-024 | 0.1- 0.26 | 1 ppm | |
| 2.880.08 | K. Mavrokoridis et al.1748-0221-6-08-P08003 | 0.24 | 1ppb | |
| 2.9 | Carvalho et al.CARVALHO1979487 | 3 | not reported | |
| 3.00.05 | Suemoto et al.Suemoto1977131 | 2.2 | 10 ppm | |
| 3.14 0.067 | C. Amsler et al.1748-0221-3-02-P02001 | 0.32 | 9 ppb | |
| 3.150.05 | P. Moutard et al.doi:10.1063/1.452869 | 01111 | 1 ppm | |
| 3.2 0.3 | Keto et al.PhysRevLett.33.1365 | 2.6 | 2 ppm | |
| 3.220.042 | Oka et al.doi:10.1063/1.437923 | 0.32 | 5 ppm | |
| 3.240.05 | F. Marchal et al.0953-4075-42-1-015201 | 0.2 | 1 ppm |
1. The theoretical natural triplet life time inferred by the data.
2 MiniCLEAN experiment
2.1 Detector overview
MiniCLEAN is a single phase liquid argon detector with a 500kg (150 kg) total (fiducial) volume, intended for direct dark matter detection. The main vessel is placed inside a water tank to shield the detector from gammas and neutrons from the underground rock. The LAr is held inside a stainless steel Inner Vessel (IV) which is suspended inside an outer vacuum vessel (OV) to provide thermal insulation. The LAr volume is surrounded by 92 optical cassette modules, arranged spherically (Fig. 2). The optical cassettes consist of acrylic light guides whose inner surface is coated with wave-length shifting tetraphenyl butadiene (TPB) which shifts the argon ultraviolet scintillation light into the visible regime where the PMTs are most sensitive. The light guides are coupled to 8” Hamamatsu R5912-02Mod PMTs.
The supplied voltage to the 92 PMTs is from a VISyN high voltage mainframe and the programmable trip currents can be set for each channel. Both PMT signals and high voltage are carried along a single cable (RG-68 in air, Gore 30 AWG in the OV vacuum) for each PMT. A set of 12 CAEN V1720 250-MHz digitizers receive PMT signals and are configured to obtain 16-s waveforms. Each digitizer has eight input channels with 12-bit ADCs and a dynamic range of 2 V. The trigger is defined such that five or more channels are required to cross threshold within a 16-ns coincidence window. A more detailed description can be found in 2017arXiv171102117J .
The cryogenic system consists of a Gifford-McMahon cryocooler mounted on the OV, with 24 flexible OFHC (Oxygen-Free High thermal Conductivity) copper braids connecting to OFHC copper cold fingers extending into the IV. In addition, a condenser provides supplemental cooling power by liquefying gas as it leaves the purification system. The condenser consists of two concentric cylinders; the outer cylinder vacuum space provides insulation of the inner cylinder, which contains liquid nitrogen. The purified argon gas enters the condenser and passes through a copper coil submerged in the nitrogen, before flowing into the IV.

2.2 Purification
The purification system is responsible for removing the radon and other impurities from the gaseous argon. This prevents potential backgrounds from radon daughters deposited on the TPB, as well as preserving gas purity. Liquid argon purchased from Air Liquide has purity cited as 99.999 . This argon is passed through a SAES PS4-MT3-R-1 heated zirconium purifier, to further purify the gas, reducing most impurities (H2 , CO, H2O, N2, O2, CH4 and CO2 in particular) to below ppb level. Subsequently the purified gas passes through an activated charcoal trap, which provides a large surface area kept below the freezing point of radon. The charcoal trap cryo-absorbs radon, while allowing the purified argon to exit the trap. The argon flow is monitored by an RGA (Residual Gas Analyzer), to ensure the purity of the argon gas, before flowing into the IV.
During the initial cool down of the IV, an air leak occurred, which caused the triplet lifetime to decrease. In order to remove this impurity from the IV, a series of pump and purge cycles were performed. The RGA was used to monitor the gas impurity level in the IV during the pump and purge cycles. However, this RGA was not sensitive to impurities below 1 ppm, thus the estimated gas exchange during pump and purge cycle was used to infer the impurity level below the RGA limit. The pump and purge program included 209 cycles, with an average of 6.60 0.77 % of the gas pumped out in each cycle. The initial impurity level was 40.86 2.63 ppm, containing a mixture of mostly oxygen and nitrogen. The impurity level was estimated at the end of each cycle using:
| (1) |
where is the impurity level as a function of time, is the pump and purge period, is the initial impurity level, is the fraction of gas pumped out in each cycle and is the contaminant removal (purge) efficiency. The variation of temperature was very small ( 1K), thus we can ignore the effect from temperature changes during the cycles, and the purge efficiency of the purifier is assumed to be 100 .222The getter removes nitrogen and oxygen contaminants to a level of 1ppb. We use a recursive form of Eq. (1) to estimate the impurity level at the end of each cycle
| (2) |
where and are the impurity levels for the and cycle respectively, and is the fraction of pumped out gas in -th cycle. This gives the impurity level at the end of the full pumping cycle. However, due to the low trigger rates ( 8 Hz), we need relatively long data taking times to accumulate events in order to fit the triplet lifetime. We can integrate Eq.(1) with respect to time to obtain the average impurity level during the time period T of the pump and purge cycle.
| (3) |
This gives the average impurity level () for the cycle. In addition, when the gas flow to the IV restores the pressure before the next pump out, the IV is basically at static pressure. Thus the impurity level acquired at the end of the pumping cycle is used to estimate the systematic uncertainties on impurity level. By comparing the impurity level obtained from two approaches (Eq. (2), Eq. (3)), the estimated systematic uncertainty is 7.1% for the impurity level inferred from the pump and purge cycle. The systematic uncertainty from the initial value measurement can be estimated using multiple scans right before the beginning of pump and purge cycle. The estimated value is 6.4%.
3 Analysis Methods
3.1 RAT – Monte Carlo simulation
The data analysis is performed using custom software: the RAT analysis toolrat . RAT was originally developed by the Braidwood collaborationBOLTON2005166 , and is currently used by MiniCLEANRIELAGE2015144 , DEAP-3600PhysRevLett.121.071801 , and SNO+CHEN200565 . RAT incorporates the electromagnetic and hadronic physics simulation methods provided by GEANT42006ITNS Agostinelli2003250 , the data storage and processing tools provided by ROOTrootu , parts of the scintillation and PMT simulation from GLG4sim (an open source package released by the KamLAND collaboration)333Generic Liquid Scintillator GEANT4 simulation, written and maintained by Glenn Horton-Smith from the KamLAND collaboration. and much of the design philosophy of the SNOMAN tool developed by the SNO collaborationsnoman . The aim of RAT is to provide an accessible and easily configurable framework for simulation and analysis in scintillator/PMT based experiments and test stands.
3.2 Reconstruction
PMTs are calibrated using late scintillation light, which is of low intensity and dominated by single photons (see Fig. 3). Using the timing probability density function (PDF) from Fig. 4 AkashiRonquest201540 , we calculate the pile-up probability and identify the part of the event dominated by single photons, which is subsequently used to calculate SPE charge distributions for each PMT. The SPE charge distribution contains two components: the contribution from real single photons, and the contribution from various sources of backgrounds including both dark hits and electronic noise. The background component is included in the fit, using a distribution obtained by a periodic trigger. The SPE distribution is fitted with a double-gamma functiontomPMT as shown in Fig. 5.
The position reconstruction is performed by calculating the charge centroid for each event, defined as:
| (4) |
where is the position of the PMT and is the charge in that PMT.


3.3 Discrimination parameters
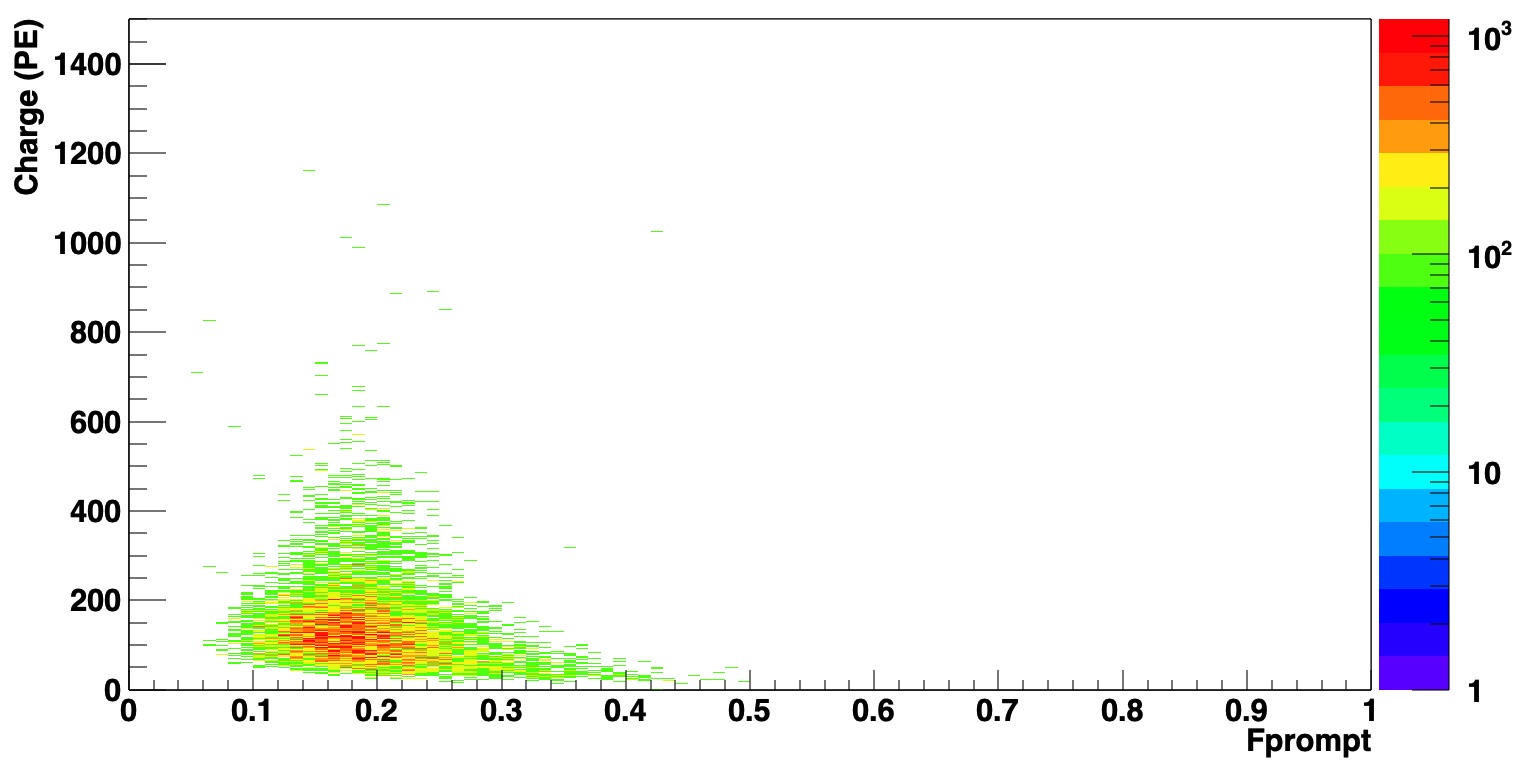
In order to select electronic recoil events, two discrimination parameters were defined : () and Charge Ratio (). is the fraction of hits occurring in a prompt window, and is defined as:
| (5) |
where is the ADC counts of the raw waveform, is the event start time before the prompt peak, is the end time of the event window and is an intermediate time, chosen depending upon the timing characteristics of the scintillator. is a useful discriminant since scintillation events created by different particle types have very different timing profiles, as seen in Fig. 4. is used to discriminate between electronic and nuclear recoils. In MiniCLEAN, is set to be ns, is 80 ns, is 1.5 s and the total data acquisition window is 16 s.
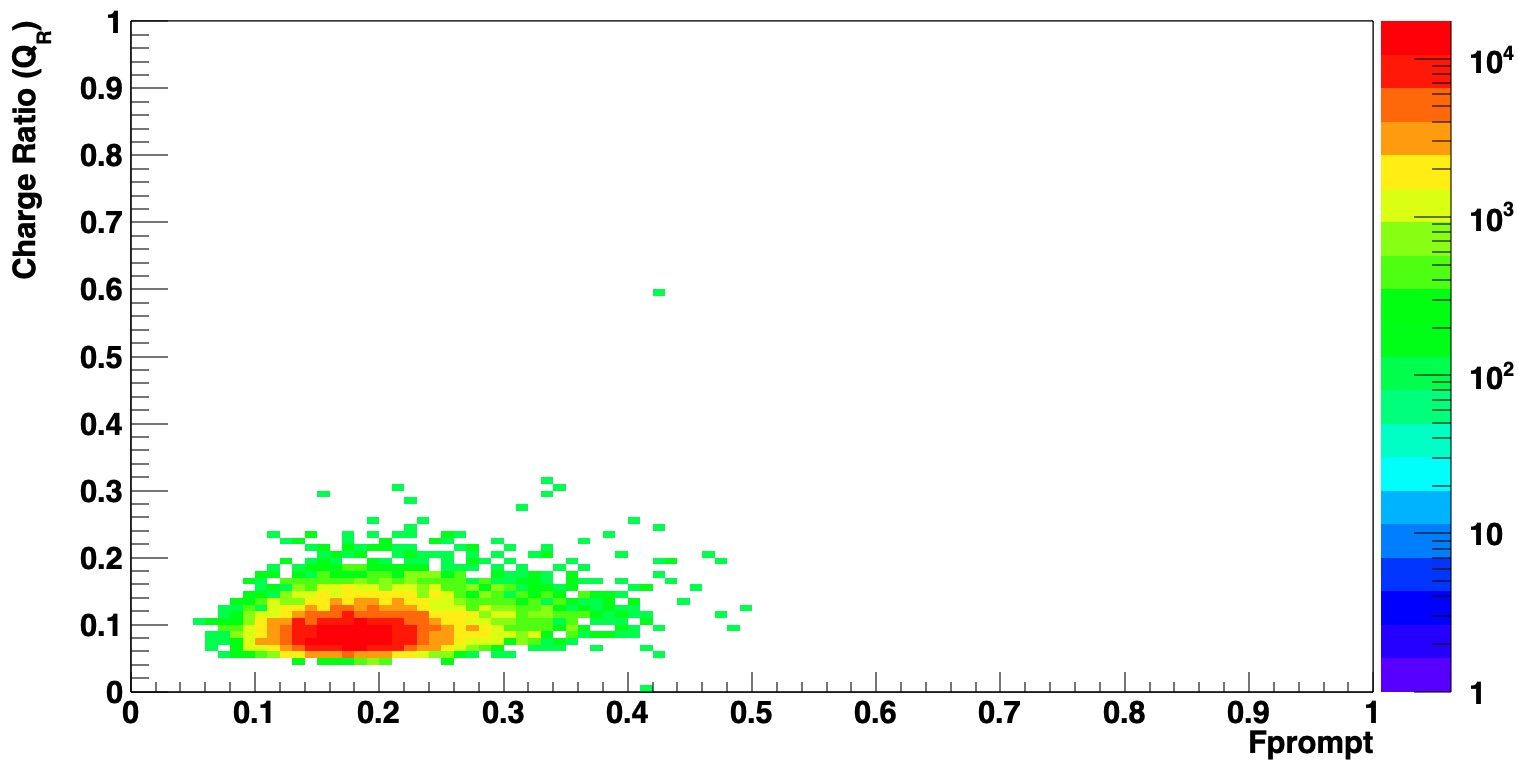
The total charge is defined as the sum of charges measured in all PMTs, and the charge ratio (QR) is defined as the maximum charge registered on any individual PMT divided by the total charge of the event. For example, QR will be equal to one if only a single PMT registers the full charge in a given event. QR is thus an indirect measure of the isotropy of recorded PMT hits in an event.

3.4 Pulse Finding
Calibrated waveforms are scanned for each PMT separately with a sliding 12-ns (3-sample) integration window, and a pulse region is defined whenever the integral exceeds 5 times the RMS of noise samples multiplied by the square root of the number of samples in the window. Once the pulse threshold has been crossed, the end boundary of the pulse region is defined as the time when the sliding window integral drops below the RMS divided by the square root of the number of samples. Figure 6 shows the sliding window calculation applied to a simulated pulse created by 5 photoelectrons.


4 Data
4.1 Data sets
Data used in this analysis were taken from February to April 2017, with a total of 39 runs and 18.4 days of live time. Initially 37 of the 92 PMTs were excluded from this analysis due to various reasons (no connection, low gain, high noise rates.) The number of total well-functioning PMTs included in the final analysis are 62 (55 for early pump and purge runs, 7 more PMTs were recovered in the later runs). The data taking started approximately 5 hours after the beginning of the pump and purge cycle; the initial motivation was to monitor the cycle progress. After completion of the pump and purge cycle, IV was kept static to observe the stability of the triplet lifetime.
4.2 Event selection
The dominant scintillation events are from intrinsic 39Ar beta decays. In this analysis, the scintillation events were chosen by selecting events with low and low QR. These electronic recoil scintillation events have low value because they contain more late light than nuclear recoil like events (Fig. 4). These events have a small QR because scintillation light in gaseous argon is emitted isotropically, thus multiple PMTs are hit. In addition, the high regions is dominate by instrumental events (i.e. cross talk between channels) and the Cherenkov radiation in acrylic produced by residual radioactive in PMT glass or high energy external gamma is dominate in high region. These event selections were validated using a Monte Carlo simulation (with the same number of PMTs turned on), as shown in Fig. 7 (c) and (d). Event selection values were defined as 0.5 and QR 0.6. The cut efficiency estimated using MC simulation is 99.988. We noted that the peak of in simulation is at smaller value than in the data. We believe that this discrepancy is due to the fact that in the simulation we use the average triplet lifetime value (acquired from the data) whereas in the data we use the individual PMT lifetimes which have a slight variation possibly due to the different efficiency for PMT in different locations.
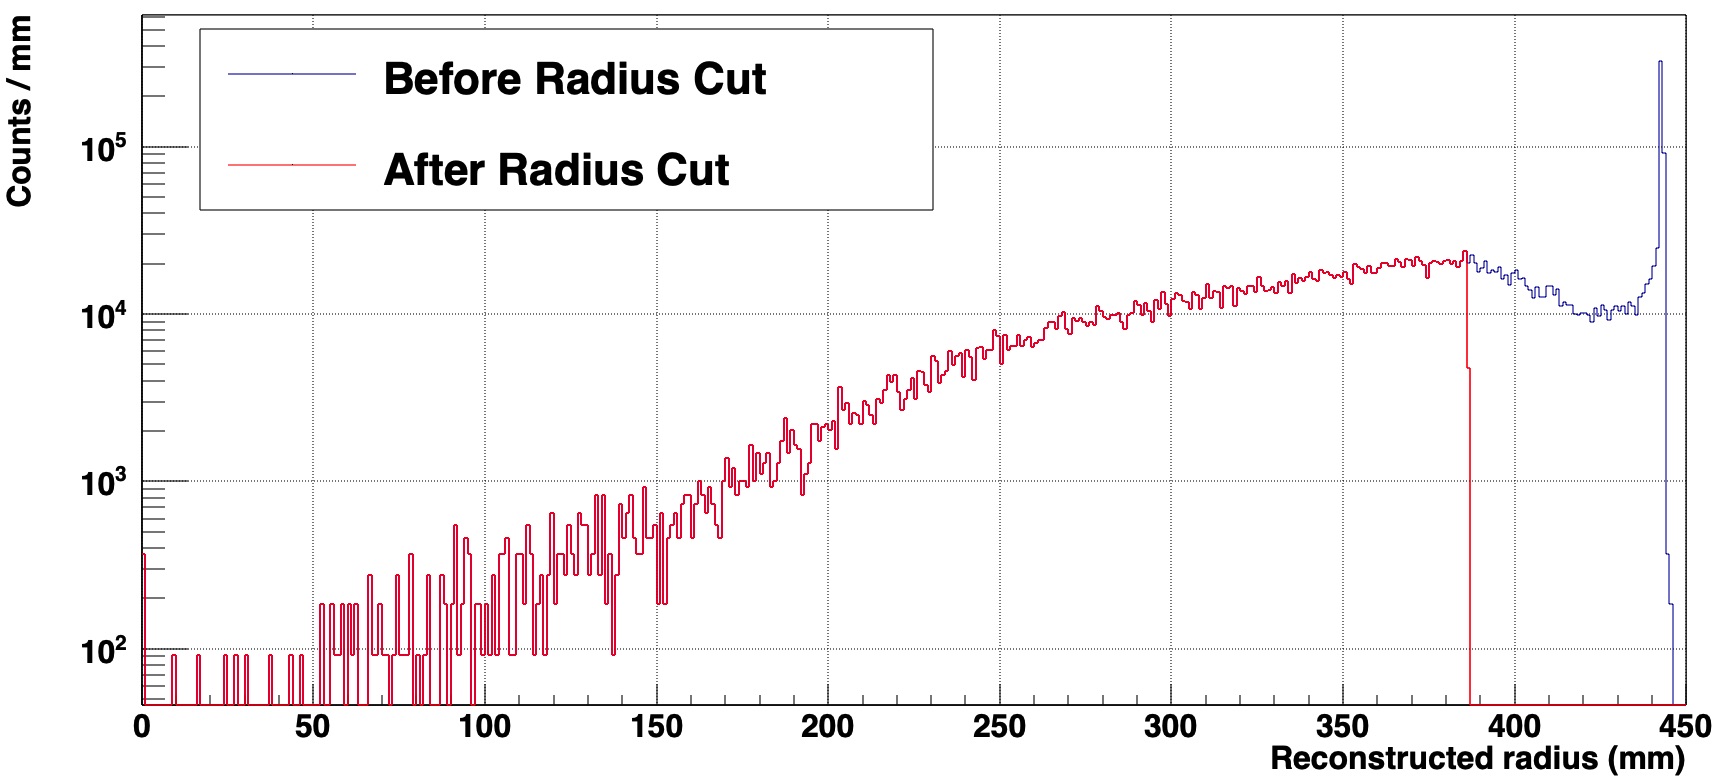
PMT base discharge is a problem when operating in gaseous argon, where the PMT bias voltage is sufficient to cause breakdown over distances less than a centimeter. Most bases were coated in epoxy, so the breakdown rate in gas is relatively low and bases which were not conformally coated remained off during the cold gas runs. However, once a base begins to discharge, the spark path provides a preferred route for continued discharge. Figure 9 shows the reconstructed radius of each event passing the and QR cut using a charge centroid . The existence of PMT discharge events in one channel biases the centroid reconstructed radius toward the edge of the detector, resulting in excessive events reconstructed near the edge of the IV. Therefore, to remove these discharge events an additional radius cut was applied to the data and defined as , where R is the centroid reconstructed radius, and is the radius of the TPB (435 mm). The cut efficiency determined by MC simulation changed to 88.30. The results are shown in Fig. 8
An additional type of event is frequently observed, one in which only PMTs on the same WFD board have charge, corresponding to PMTs on one side of the detector. Such events arise from electronic cross-talk on the WFD board. We removed these events by a dedicated cut.
5 Results
5.1 Triplet lifetime
The start times found by the pulse-finding algorithm (Section 3.4) on the selected data is fitted with a simple exponential function plus constant background model:
| (6) |
where is a normalization, is the background fraction and is the triplet lifetime. The window for the fit is taken from 200 ns after time zero to the end of the data acquisition window, to prevent contamination from the scintillation light of the singlet state. A sample fit is shown in Fig 10.

The method to assess impurity level was described in Sec. 2.2. The pulse time distribution for each pump and purge cycle is fit to get the triplet lifetime for each cycle. The triplet lifetime and the associated impurity level is shown in Fig. 11. The fitting function of the curve is :
| (7) |
where is the measured triplet lifetime, is a fit parameter representing the natural triplet lifetime with zero impurity present in gaseous argon, is the total impurity level in ppm and is the fitting constant.
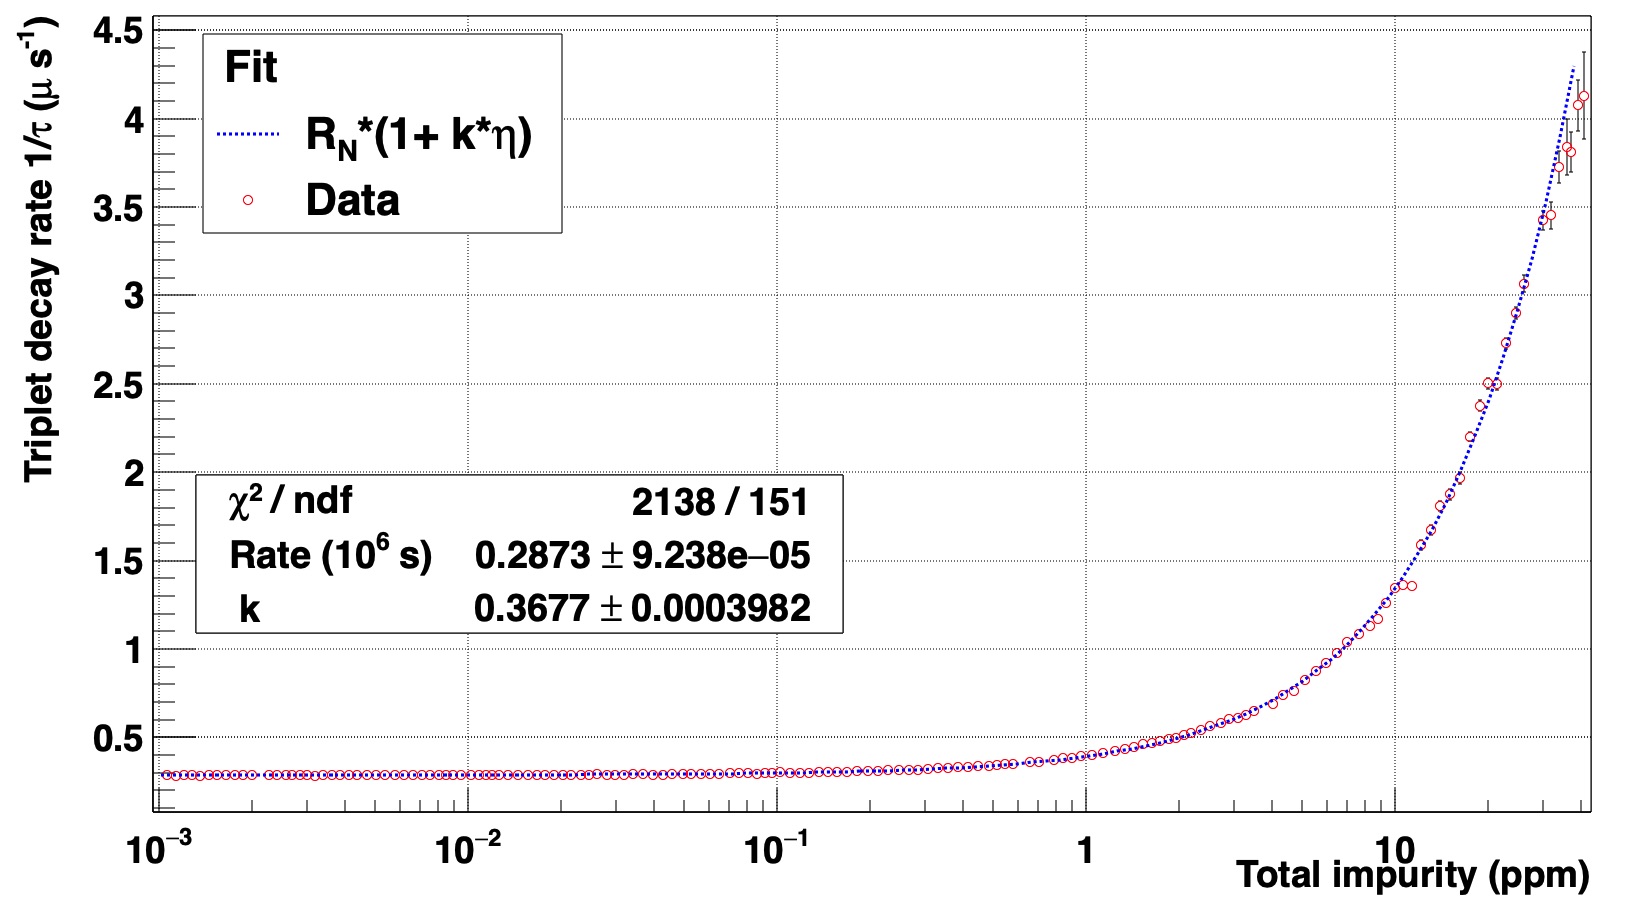
Alternatively, we can convert the lifetime to the decay rate and use the inverse function of Eq. 7 to fit a line (Fig. 12)
| (8) |
where and are the inverse lifetimes (decay rates). The product of and is the reaction rate per ppm between argon and the impurity molecule. The reaction rate between argon and impurity molecules has been measured by various groupsdoi:10.1063/1.436447 doi:10.1063/1.437923 doi:10.1063/1.441532 . The dominant impurity species in MiniCLEAN are oxygen and nitrogen at the operating temperatures (140 K). The quenching effects from nitrogen diminish with impurity level less than 1 ppm1748-0221-6-08-P08003 , therefore we assume the quenched light yield is mainly due to oxygen when the impurity level is below 1 ppm.
We note that the of both fits are large, due to a discrepancy in the high impurity level region. This implies either the functional form does not describe the behavior well at high impurity levels ( 1ppm) or some additional systematic uncertainty occurs in that region. We know of no systematic effect in our analysis that could account for the difference. We speculate that the functional form is altered at large impurities due to nitrogen which is known to only significantly quench the triplet state for concentrations above 1 ppm1748-0221-6-08-P08003 .

5.2 Component Light yield
The charge distribution for different scintillation light components was obtained using the SPE calibrated charge. A charge cut (charge 0.2 PE) was applied to eliminate background from electronic noise. A new SPE counting algorithmAkashiRonquest201540 is adopted to improve the precision on determining the photon arrival time. This algorithm exploits features in the scintillation time structure as prior inputs of a Bayesian probability distribution to estimate the plausible arrival time of the single photoelectrons.
The PMT photon time-of-flight corrected timing distribution is fitted with the following functional form, consisting of three exponentials convolved with a Gaussian response function:
| (9) |
where is the gaussian response function, the parameters , and are the time constant of the fast, intermediate and slow-decaying (late) states respectively and the parameters , and are the fractions of prompt, intermediate and late states respectively. Finally, is the fraction of flat background. An example of the fit is shown in Fig. 13. The mean light yield (LY) for each component was determined from the fitting parameters (B, C, and D) in Eq. 9 and plotted against triplet lifetime as shown in Fig. 14. As can be seen, the prompt and intermediate components are relatively flat compared to the late component. It is confirmed that the singlet state of the second continuum (intermediate component) is not affected by the impurities, while the triplet state of the second continuum (late component) is strongly quenched. Moreover the prompt states, which mostly come from the third continuum, are not affected by impurities either.

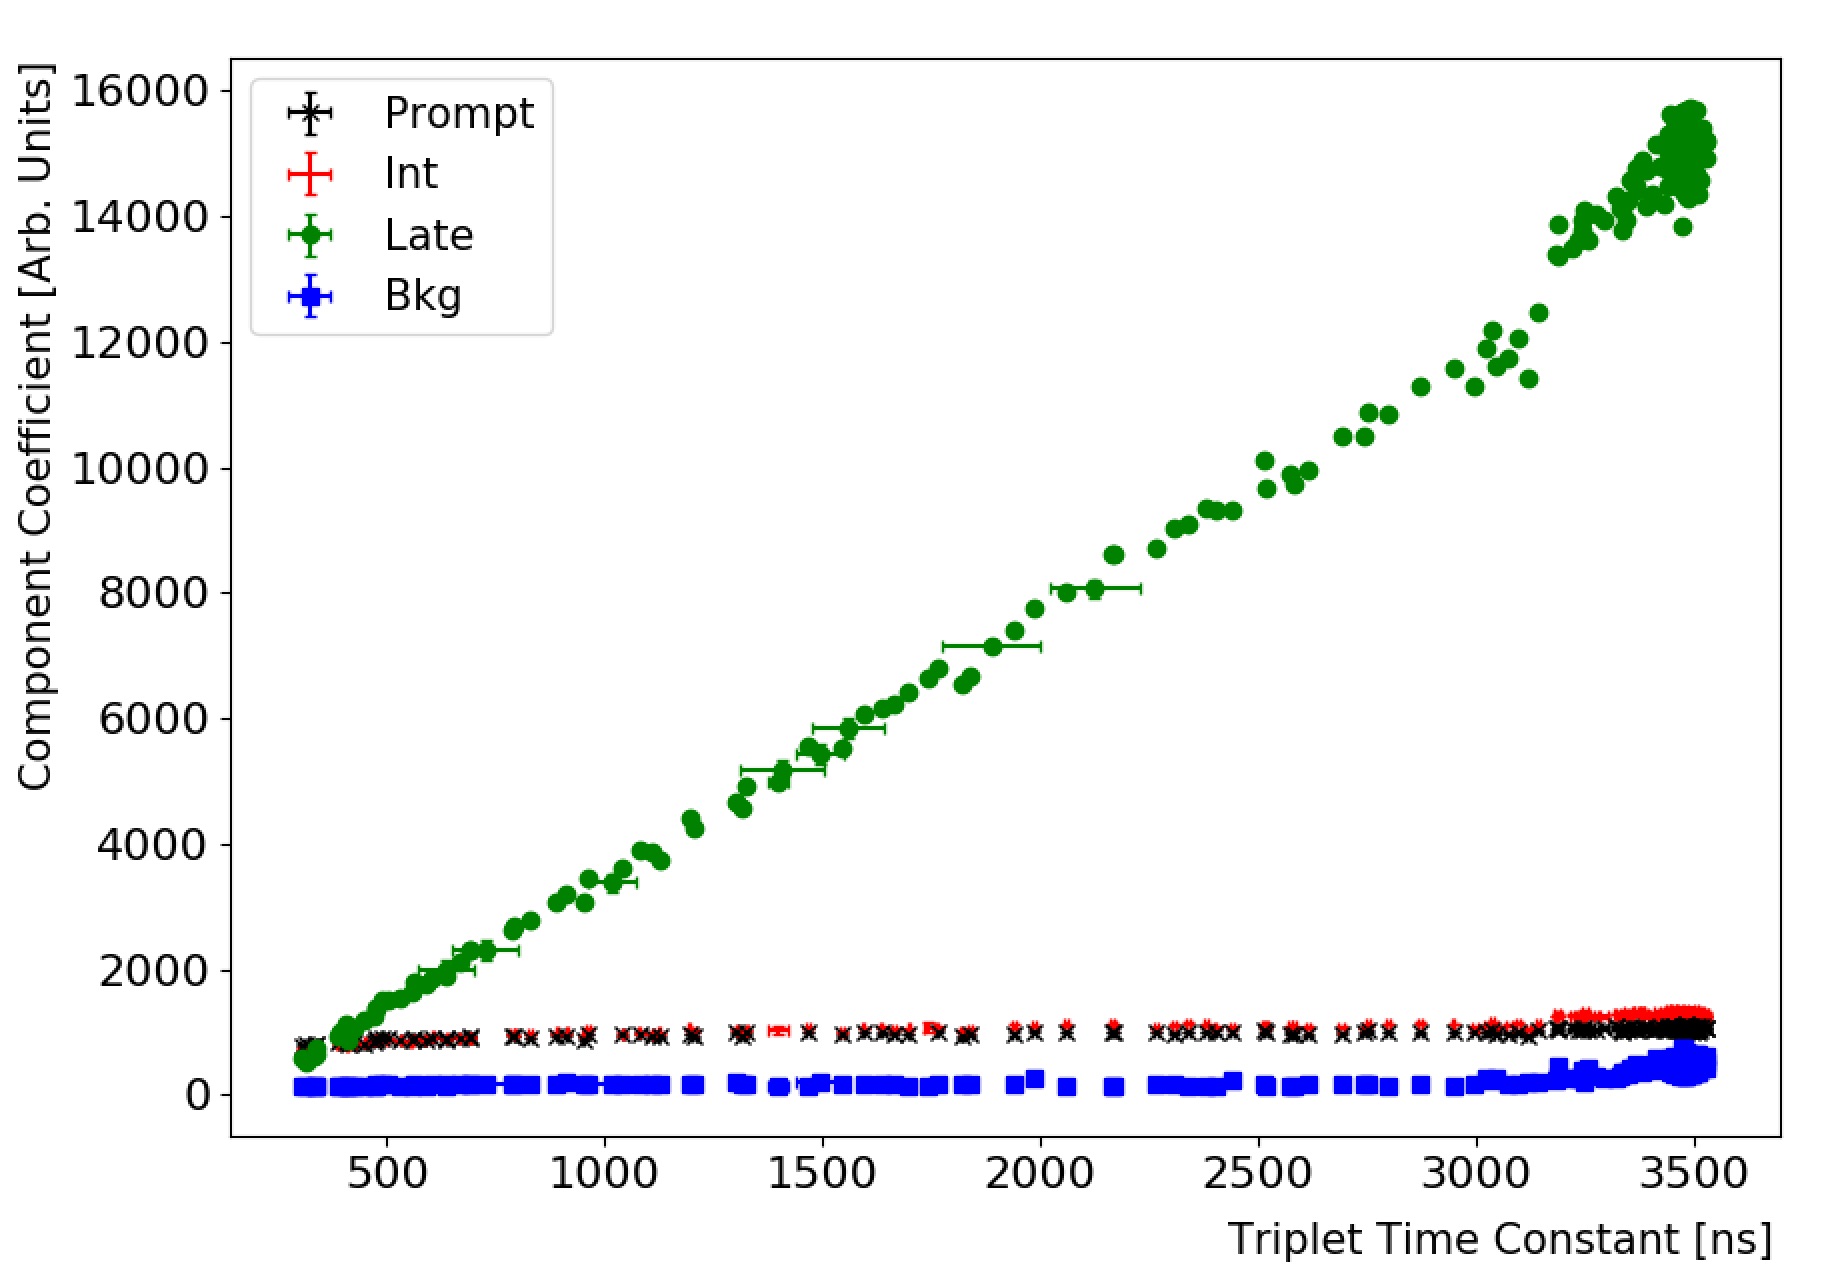
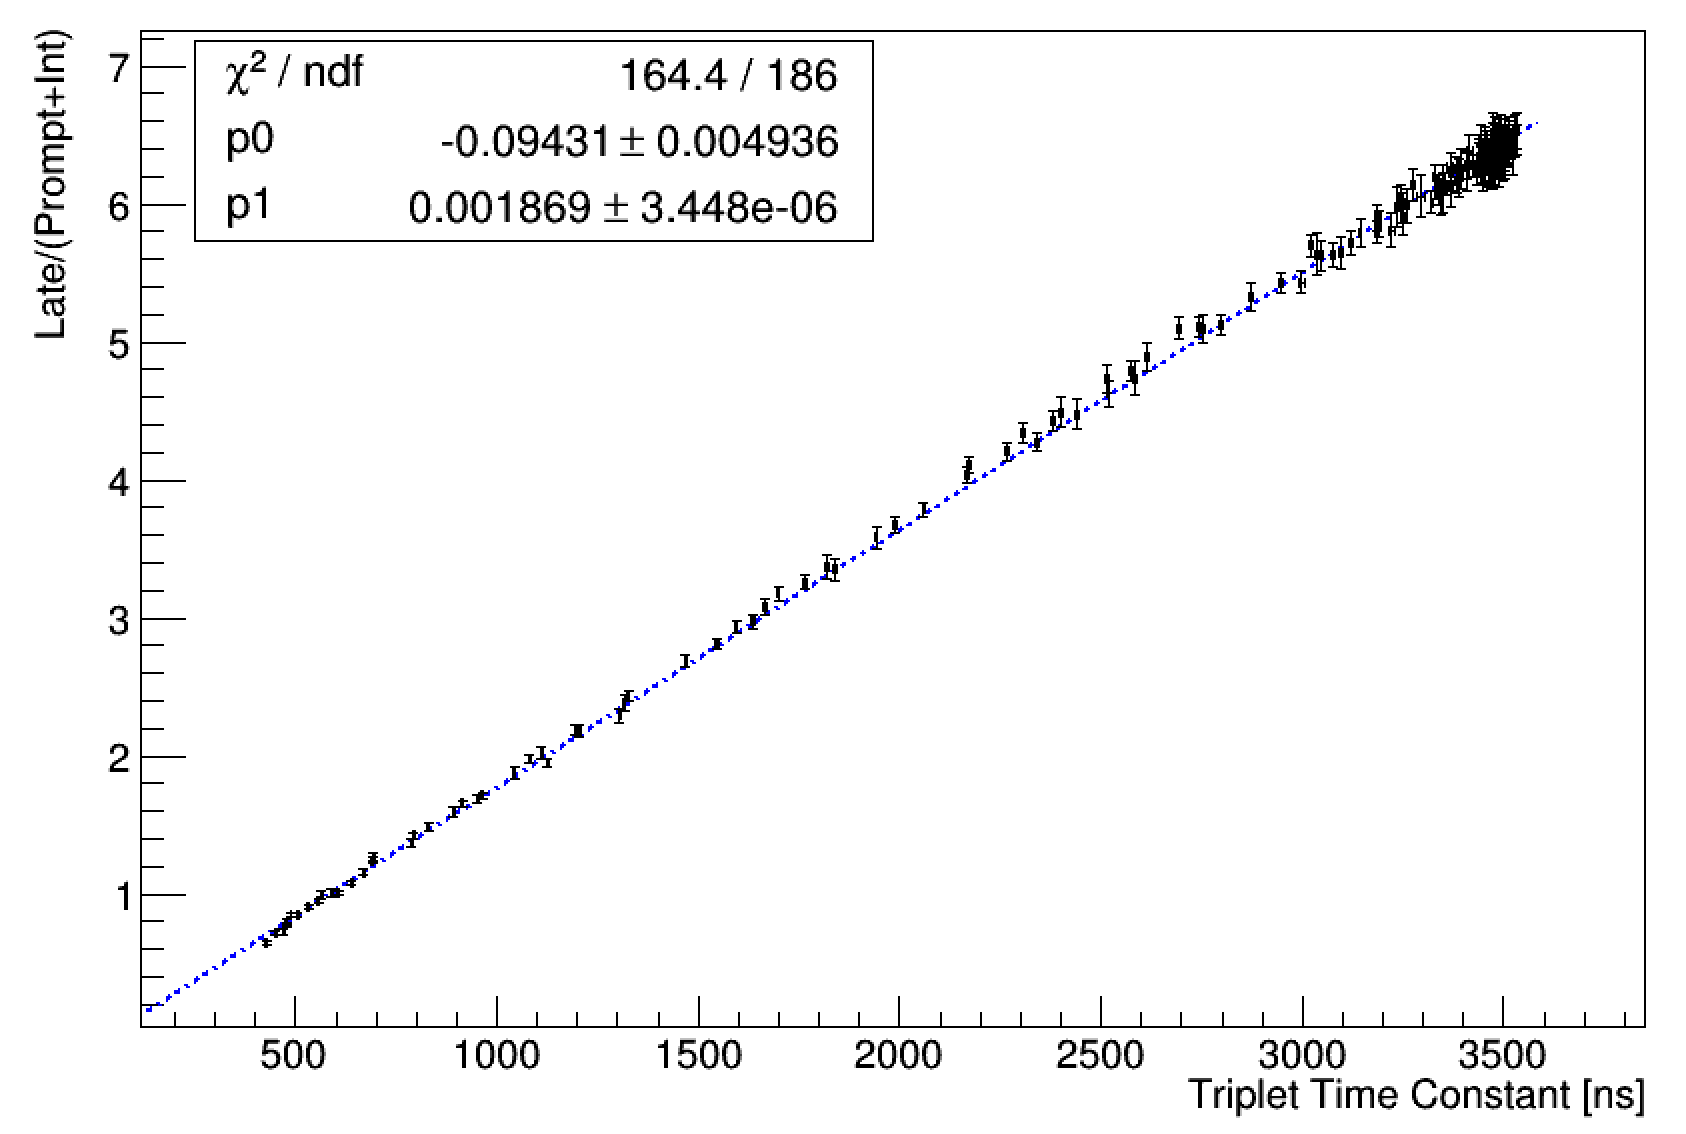
The fraction of late component to the total scintillation light is another interesting quantity, which was obtained by taking the fitting parameters in Eq. 9 (/(+)). The final results as a function of the average triplet lifetime hour by hour as shown in Fig. 15. The measured ratio is fit to a first order polynomial function. The largest late/prompt ratio, 6.37 0.01, is determined by averaging the value obtained with long lifetime ( 3.4 s). We noticed that a systematic bump in late component in Fig. 14 is correlated with the turning on of additional PMTs which are not included in this analysis. The displacement in the late component is likely due to the increased noise levels (e.g. PMT cross talk), and this effect appears to approximately cancel out when evaluating the ratio. The discrepancy between our results and the value 5.5 0.6 reported in reference 1748-0221-3-02-P02001 is largely due to their use of an alpha particle source, well known to produce more prompt light compared to our electronic recoil events. Also a longer lifetime is attained in our measurement, which effectively increases the late/(prompt+intermediate) ratio. The authors believe the source of the intermediate component to be a combination of PMT effects (double and late pulsing), delayed singlet state light from the second continuum, and possibly delayed TPB light PhysRevC.91.035503 . No effort is made to disentangle these effects as the relative fraction of the late component is the primary result of this work. However, these effects are considered as a source of systematic uncertainty.
5.3 Systematic Uncertainties
We have identified a number of systematic effects on the measurement of the triplet lifetime and light yield and estimated uncertainties due to these effects. The pressure and temperature of IV changed during the measurement,the average pressure and temperature during each cycle was used to determine the density of the gaseous argon. Then by using the equation from P. Moutard’sdoi:10.1063/1.452869 (green dashed line in Fig. 1), the systematic uncertainty from the density variation can be determined. The pressure during the pump and purge cycle changed from 1420 mbar to 1560 mbar while the temperature change is much less than 1K, thus the density effect has a negligible systematic uncertainty. The gain variation during the measurement also leads to systematic uncertainties on triplet lifetime. We determined this uncertainty by tracking the light yield of prompt light hour by hour. Figure 16 shows the relative gain variation during on long run (33 hrs), this run is used to estimate the systematic uncertainty due to the variations of PMT gain. The relative gain variation is defined as root-mean-square (RMS) of the gain variation in 33 hrs divided by mean gain in this 33 hrs. Subsequently, we fit the pulse-time distribution generated by the modified gain (according to the gain variations) and compare with unmodified results. This determines the uncertainty due to gain variations in Table 2.
On the other hand, due to the potential of inhomogeneity of the gas distribution inside the IV, some PMTs might detect more photons than others. This uncertainty is assessed by fitting the triplet lifetime PMT by PMT. We found that the top PMTs (PMT channel number 1 - 20) has slightly longer triplet lifetime than others. This may be due to the gas non-uniformity at the top of the IV during pumping. The fitted triplet lifetime for each PMTs is shown in Fig. 17. The systematic uncertainty of pulse finding algorithm can be assesed by comparing the fitting results between pulse-time distribution and summed waveform. The comparison of the fitting results is shown in Fig. 18. The estimated systematic uncertainty from pulse finding algorithm is 0.39. Furthermore, the effect from pumping the detector can be assesed by comparing the triplet lifetime during the pumping and purge (static) respectively. The systematic uncertainty from pumping the detector is estimated to be 0.73 . Backgrounds also tend to reconstruct near the edge of IV compared to the scintillation events. We developed a pseudo-experiment to investigate this effect. In this method, we fix the triplet time to some constant and varies the background fraction according to the fitted background fraction from different radius (Fig. 19). Starting with an assumed true triplet lifetime value, we pick a random radius according to Fig. 9, and obtain the corresponding background fraction from Fig. 19 (interpolating with a 4th order polynomial). Then by sampling the background fraction at different radii, we refit with the fitting function (Eq. (6)) and use the subsequent variation as the systematic uncertainty. The PMT after-pulsing is also one of the source which contribute to the systematic uncertainty. The after-pulsing of PMTs is simulated by importing the dedicated measurement. Thus, by simulating the detector response with and without PMT after-pulsing, the systematic uncertainty can be accessed. As a result, 0.06 is contributed by this effect.
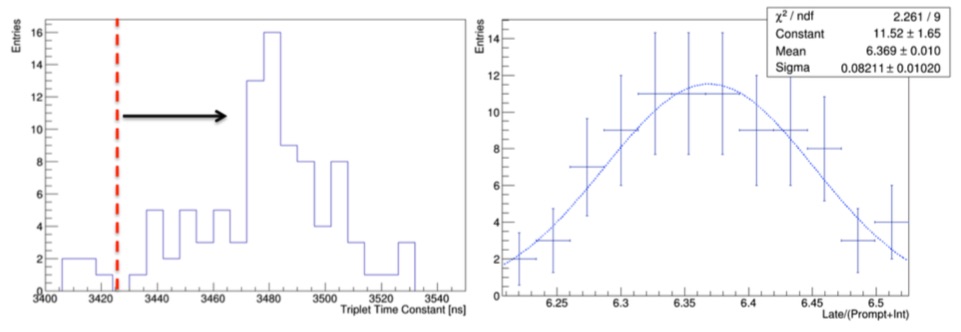
Two systematic uncertainties are considered for the measurement of light yield. The first is the spread in the Late/(Prompt + Intermediate) ratio at long triplet time constant values. Evaluating this number provides a handle on the spread in the ratio result once the measured triplet time constant has stabilized. Fig. 20 shows profile histograms of the triplet time constant (left) and
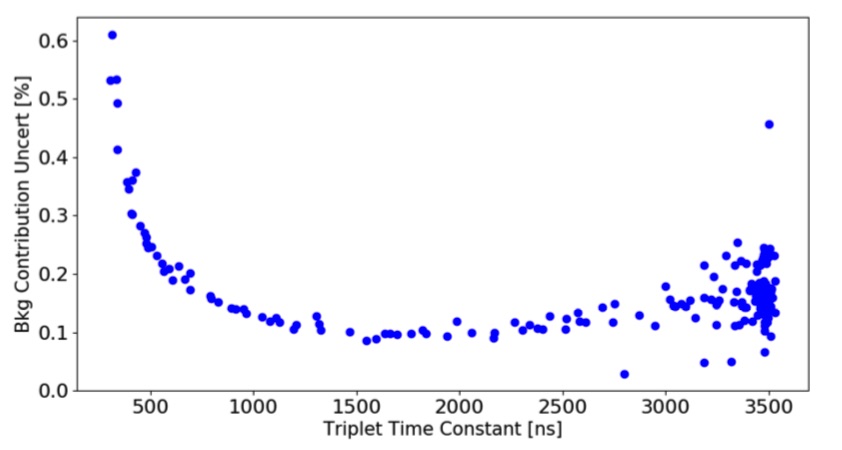
Late/(Prompt + Intermediate) (right) ratio axes plotted in Fig. 15 for measured triplet time constant between 3400 ns and 3550 ns. Once the triplet time constant measurement stabilizes to 3480 ns, the distribution in the left-side histogram of Fig. 20 motivates placing a cut at 3425 ns to define the population of events from which to evaluate the spread in the ratio. The right-side histogram in Fig. 20 is the distribution of measured Late/(Prompt + Intermediate) ratios after a cut of 3425 ns on the measured triplet time constant is applied. This distribution is then fit to a Gaussian and the fitted standard deviation is taken to be the systematic spread in the evaluation of the Late/(Prompt + Intermediate). The second systematic uncertainty considered is related to the fitted background contribution. Fig. 21 shows the percent uncertainty as a function of measured triplet time constant in the evaluation of the Late/(Prompt + Intermediate) ratio when adding/subtracting the uncertainty in the fitted background coefficient from the late coefficient.


| Source | Triplet lifetime | Ratio of LY |
|---|---|---|
| PMT gain variation | 0.26% | – |
| PMT after-pulsing | 0.06% | – |
| Background | 1.31% | 0.20% |
| PMT variation | 0.96% | – |
| Detector | – | 1.25% |
| Density | 0.07% | – |
| Pumping on the IV | 0.73% | – |
| Pulse finding | 0.39% | – |
| Total | 1.84% | 1.27% |
6 Conclusion
Triplet lifetime is important for performing pulse shape discrimination in gaseous/liquid argon detectors. Residual impurities in argon will lead to the degradation of both triplet lifetime and light yield. This subsequently affects the pulse shape discrimination power and the energy resolution of the detector. We have investigated the detailed correlation between triplet lifetime and impurity level, which helps to monitor detector health before, during and after the commissioning of the detector. We have found the triplet lifetime with ppb impurity is 3.480 0.001 (stat.) 0.064 (sys.) s, which is the longest lifetime so far measured at 1.5 bar and temperature less than 140 K, to our knowledge.
We have presented the results of relative light yield and the late/(intermediate + prompt) ratio measurements. The relative light yield reveals the origin of the quenching effects of impurity molecules. They mainly interact with the triplet state of the second continuum and results in a loss of light yield. A detailed analysis of light yield from each component suggest that the impurity molecules did not affect the prompt (third continuum) and singlet state (second continuum) except at very high impurity levels (100 ppm). This is probably due to the relatively fast lifetime of these two components, and the low reaction rates when impurity levels are low. The late/prompt ratio gives a quantitative definition of the scintillation timing structure. The best value of the late/(intermediate + prompt) ratio has been measured as 6.37 0.01(stat.) 0.08 (sys.), which has better precision than previously measured1748-0221-3-02-P02001 due to the high purity of our argon, as evidenced by our long triplet lifetime.
Acknowledgments
This research is supported by Pacific Northwest National Laboratory, SNOLAB and DOE (Office of Science, DE-FG02-04ER41300). We gratefully acknowledge the support of the U.S. Department of Energy through the
LANL/LDRD Program for this work. This work also supported by University of California, Berkeley and the Hellman Faculty Fellowship Fund.
References
- [1] Boris M Smirnov. Soviet Physics Uspekhi, 26(1):31, 1983.
- [2] P. Moutard, P. Laporte, J. L. Subtil, N. Damany, and H. Damany. The Journal of Chemical Physics, 87(8):4576–4588, 1987.
- [3] Akira Hitachi, Tan Takahashi, Nobutaka Funayama, Kimiaki Masuda, Jun Kikuchi, and Tadayoshi Doke. Phys. Rev. B, 27:5279–5285, May 1983.
- [4] N. Thonnard and G. S. Hurst. Phys. Rev. A, 5:1110–1121, Mar 1972.
- [5] L. Goubert, G.D. Billing, E. Desoppere, and W. Wieme. Chemical Physics Letters, 219(5?6):360 – 365, 1994.
- [6] J. E. Velazco, J. H. Kolts, and D. W. Setser. The Journal of Chemical Physics, 69(10):4357–4373, 1978.
- [7] W. Krötz, A. Ulrich, B. Busch, G. Ribitzki, and J. Wieser. Phys. Rev. A, 43:6089–6094, Jun 1991.
- [8] A Kh Amirov, O V Korshunov, and V F Chinnov. Journal of Physics B: Atomic, Molecular and Optical Physics, 27(9):1753, 1994.
- [9] P. Grimm, F.-J. Hambsch, M. Mutterer, J.P. Theobald, and S. Kubota. Nuclear Instruments and Methods in Physics Research Section A: Accelerators, Spectrometers, Detectors and Associated Equipment, 262(2):394 – 402, 1987.
- [10] J Wieser, A Ulrich, A Fedenev, and M Salvermoser. Optics Communications, 173(1?6):233 – 245, 2000.
- [11] C Amsler, V Boccone, A B chler, R Chandrasekharan, C Regenfus, and J Rochet. Journal of Instrumentation, 3(02):P02001, 2008.
- [12] K Mavrokoridis, R G Calland, J Coleman, P K Lightfoot, N McCauley, K J McCormick, and C Touramanis. Journal of Instrumentation, 6(08):P08003, 2011.
- [13] R Acciarri et al. Journal of Instrumentation, 5(06):P06003, 2010.
- [14] R Acciarri et al. Journal of Instrumentation, 5(05):P05003, 2010.
- [15] R. E. Gleason, T. D. Bonifield, J. W. Keto, and G. K. Walters. The Journal of Chemical Physics, 66(4):1589–1593, 1977.
- [16] P Millet, A Birot, H Brunet, H Dijolis, J Galy, and Y Salamero. Journal of Physics B: Atomic and Molecular Physics, 15(17):2935, 1982.
- [17] M.J. Carvalho and G. Klein. Journal of Luminescence, 18:487 – 490, 1979.
- [18] T. Suemoto, Y. Kondo, and H. Kanzaki. Physics Letters A, 61(2):131 – 132, 1977.
- [19] J. W. Keto, R. E. Gleason, and G. K. Walters. Phys. Rev. Lett., 33:1365–1368, Dec 1974.
- [20] Takefumi Oka, Masuhiro Kogoma, Masashi Imamura, Shigeyoshi Arai, and Tsutomu Watanabe. The Journal of Chemical Physics, 70(7):3384–3389, 1979.
- [21] F Marchal, N Merbahi, G Ledru, J P Gardou, and N Sewraj. Journal of Physics B: Atomic, Molecular and Optical Physics, 42(1):015201, 2009.
- [22] JuiJen Wang. Ph.D Thesis, November 2017.
- [23] RAT User’s Guide. https://rat.readthedocs.io/en/latest/. Technical report.
- [24] T. Bolton. Nuclear Physics B - Proceedings Supplements, 149:166 – 169, 2005.
- [25] K. Rielage et al. Physics Procedia, 61(Supplement C):144 – 152, 2015. 13th International Conference on Topics in Astroparticle and Underground Physics, TAUP 2013.
- [26] P.-A. Amaudruz et al. Phys. Rev. Lett., 121:071801, Aug 2018.
- [27] M.C. Chen. Nuclear Physics B - Proceedings Supplements, 145:65 – 68, 2005.
- [28] J. Allison et al. IEEE Transactions on Nuclear Science, 53:270–278, February 2006.
- [29] S. Agostinelli et al. Nuclear Instruments and Methods in Physics Research Section A: Accelerators, Spectrometers, Detectors and Associated Equipment, 506(3):250 – 303, 2003.
- [30] ROOT User Guides and Manuals.
- [31] The SNO Collaboration. The SNOMAN Users Manual version 5.02 ed.
- [32] M. Akashi-Ronquest et al. Astroparticle Physics, 65:40 – 54, 2015.
- [33] Thomas Caldwell. techreport, MiniCLEAN internal report, 2012.
- [34] D. W. Loeb, MonChao Chen, and R. F. Firestone. The Journal of Chemical Physics, 74(6):3270–3277, 1981.
- [35] E. Segreto. Phys. Rev. C, 91:035503, Mar 2015.