Band-selective clean- and dirty-limit superconductivity with nodeless gaps in the bilayer iron-based superconductor CsCa2Fe4As4F2
Abstract
The optical properties of the new iron-based superconductor CsCa2Fe4As4F2 with K have been determined. In the normal state a good description of the low-frequency response is obtained with a superposition of two Drude components of which one has a very low scattering rate (narrow Drude-peak) and the other a rather large one (broad Drude-peak). Well below K, a pronounced gap feature is observed which involves a complete suppression of the optical conductivity below 110 cm-1 and thus is characteristic of a nodeless superconducting state. The optical response of the broad Drude-component can be described with a dirty-limit Mattis-Bardeen-type response with a single isotropic gap of meV. To the contrary, the response of the narrow Drude-component is in the ultra-clean-limit and its entire spectral weight is transferred to the zero-frequency function that accounts for the loss-free response of the condensate. These observations provide clear evidence for a band-selective coexistence of clean- and dirty-limit superconductivity with nodeless gaps in CsCa2Fe4As4F2.
The discovery of high-temperature superconductivity in the iron-based superconductors (FeSCs) has received great attention over the past decade Kamihara et al. (2008); Chen et al. (2008a, b); Paglione and Greene (2010); Stewart (2011). Meanwhile, a large number of different families of FeSCs have been discovered which all have FeAs or FeSe layers as their essential structural element. According to the stacking of these FeAs or FeSe layers and the additional layers that separate them, they can be classified into 1111-type (e.g. LaFeAsO) Kamihara et al. (2008); Chen et al. (2008a, b), 111-type (e.g. LiFeAs) Wang et al. (2008), 11-type (e.g. FeSe) Hsu et al. (2008), 122-type (e.g. BaFe2As2) Rotter et al. (2008a, b), etc. Probably the most intensively studied is the 122-type family for which large and high-quality single crystals can be readily grown. The 122 parent compounds are antiferromagnetic metals for which superconductivity is obtained by applying chemical doping, which leads to extra holes Rotter et al. (2008b), electrons Sefat et al. (2008) or chemical pressure (for isovalent substitution) Kasahara et al. (2010), or by applying external pressure Alireza et al. (2008). Recently, the closely related CaKFe4As4 (1144-type) Iyo et al. (2016) family with K, has been discovered. Unlike K-doped Ca-122, for which the K and Ca ions are randomly distributed among the layers that separate the FeAs planes, the 1144-type structure is composed of distinct K and Ca layers that alternatingly separate the FeAs planes. Accordingly, the 1144-structure has two well-defined As sites that are neighboring either a K or a Ca layer. This strongly reduces the disorder and it also introduces an electric field gradient across the FeAs planes that can, e.g., affect the orbital state of the charge carriers, enhance spin-orbit coupling effects and even affect the antiferromagnetic order Meier et al. (2018). Very recently, the so-called 12442-type (KCa2Fe4As4F2) family with K in its stoichiometric form was successfully synthesized for which the Ca layer of CaKFe4As4 is replaced with a Ca2F2 layer Wang et al. (2016, 2017). This should further enhance the electric field gradient across the FeAs layers and strongly increase the anisotropy of the electronic and superconducting (SC) properties in the directions parallel (ab-plane) and perpendicular (c-axis) to the FeAs layers. The intrinsic hole doping of this 12442-type compound corresponds to the one of a 50 percent K-doped Ba-122 sample placing it in the moderately overdoped regime of the phase diagram where the values remain sufficiently high and competing magnetic and/or structural orders are absent.
The new 12442-type family thus is well-suited to study which effects the reduced disorder, a strong anisotropy, and an enhanced spin-orbit coupling due to broken local inversion symmetry of the FeAs planes have on the unconventional superconducting properties of the FeSCs. Recent SR measurements on polycrystalline samples of the 12442 compounds KCa2Fe4As4F2 Smidman et al. (2018) and CsCa2Fe4As4F2 Kirschner et al. (2018) have indeed provided evidence for the presence of line nodes in the SC gaps. This result is very surprising and in clear contrast with the experiments on CaKFe4As4 single crystals which revealed multiple Fermi surfaces with nodeless SC gaps Mou et al. (2016); Cui et al. (2017); Biswas et al. (2017); Cho et al. (2017); Yang et al. (2017), in good agreement with previous results on optimally doped Ba1-xKxFe2As2 Ding et al. (2008). These contradictory results thus call for further investigations especially of the SC gap structure of high-quality 12442 single crystals.
In this work, we present such a study based on optical spectroscopy measurements of high-quality CsCa2Fe4As4F2 single crystals. The normal state optical properties of this multiband material are analyzed with a two-Drude model which reveals two types of free carrier that can be distinguished according to their very small and rather large scattering rates, respectively. In the superconducting state, our optical spectra provide clear evidence for the absence of any nodal gaps. Instead, the optical conductivity is well described with two isotropic gaps that are in the extremely-clean and the dirty limit, respectively.
High-quality single crystals of CsCa2Fe4As4F2 were grown using the self-flux method with a CsAs flux Wang et al. . The ab-plane reflectivity was measured at a near-normal angle of incidence with a Bruker VERTEX 70v FTIR spectrometer with an in situ gold overfilling technique Homes et al. (1993). Data from 40 to 12 000 were collected at different temperatures from 300 to 7 K with a ARS-Helitran crysostat. The room temperature spectrum in the near-infrared to ultraviolet range (4 000 – 50 000) was obtained with a commercial ellipsometer (Woollam VASE). The optical conductivity was obtained by performing a Kramers-Kronig analysis of Dressel and Grüner (2002). For the low frequency extrapolation below 40, we used a Hagen-Rubens () or superconducting () extrapolation. For the extrapolation on the high frequency side, we assumed a constant reflectivity up to 12.5 eV that is followed by a free-electron () response.
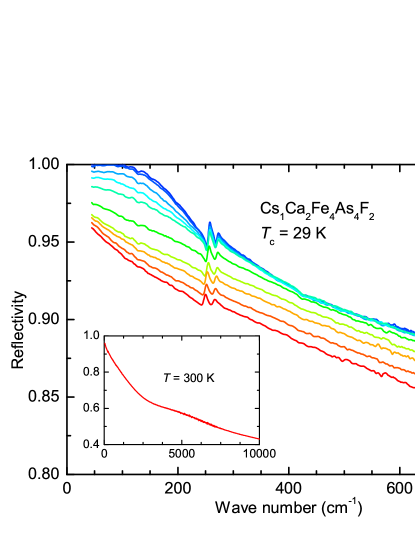
Figure 1 displays the in-plane far-infrared reflectivity of CsCa2Fe4As4F2 for several temperatures above and below . The inset shows the reflectivity at 300 K for a wide spectral range up to 10 000. In the normal state, shows a typical metallic response, approaching unity at low frequencies and increasing upon cooling. When entering the superconducting state, the reflectivity below 250 shows an upturn and reaches a flat, unity response at 7 K, which is a clear signature of the opening of a SC gap. In addition to these gross features, two sharp peaks representing the symmetry allowed in-plane infrared active phonon modes are observed around 250 and 265 Akrap et al. (2009); Xu et al. (2015); Yang et al. (2017).
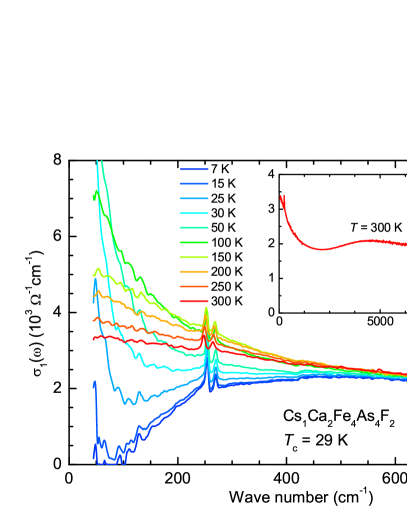
Figure 2 shows the temperature dependence of the optical conductivity of CsCa2Fe4As4F2 in the far-infrared above and below . The inset shows the 300 K conductivity over a broader spectral range. In the normal state, the optical conductivity has a Drude-like peak centered at zero frequency where the width of the Drude response at half maximum is the value of the quasiparticle scattering rate. As the temperature decreases, this Drude-like peak narrows with a concomitant increase of the low-frequency optical conductivity. Just above at 30 K the Drude peak is quite narrow, suggesting a very small quasiparticle scattering rate at low temperature. Below , the formation of the superfluid condensate gives rise to a suppression of at low frequencies. This suppression is the consequence of a transfer of spectral weight from finite frequencies to a zero-frequency function which represents the infinite dc conductivity of the superconducting condensate that is described by the so-called Ferrel-Glover-Tinkham (FGT) sum rule Ferrell and Glover (1958); Tinkham and Ferrell (1959). For the 7 K spectrum, the low-frequency part of the optical conductivity is strongly suppressed and vanishes (within the error of the experiment) below 110. Such a complete suppression of the low-frequency optical conductivity is a clear signature of a nodeless SC gap structure as it was also observed in CaKFe4As4 Yang et al. (2017) and in optimally doped Ba1-xKxFe2As2 Li et al. (2008); Dai et al. (2013a); Xu et al. (2017); Mallett et al. (2017).
A quantitative analysis of the optical data has been obtained by fitting the spectra with a Drude-Lorentz model,
| (1) |
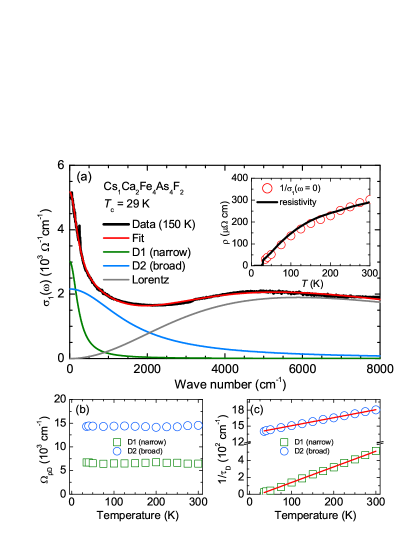
where is the vacuum impedance. The first sum of Drude-terms describes the response of the itinerant carriers in the different bands that are crossing the Fermi-level, each characterized by a plasma frequency and a scattering rate . The second term contains a sum of Lorentz oscillators of which each has a resonance frequency , a line width and an oscillator strength . The corresponding fit to the conductivity at 150 K (thick black line) using the function of Eq. 1 (red line) is shown in Fig. 3(a) up to 8 000. As shown by the thin coloured lines, the fitting curve is composed of two Drude terms with small and large scattering rates, respectively, and a Lorentz-term that accounts for the interband transitions at higher energy (grey line). Fits of equal quality have been obtained with this fit configuration for the curves at all the measured temperatures in the normal state. The inset of Fig. 3(a) compares the temperature dependent values of the dc resistivity deduced from the optical data (open circles) with the ones obtained from the dc transport measurements (solid line). The good agreement confirms the consistency of our modeling of the optical data.
The two-Drude fit indicates that CsCa2Fe4As4F2 has two types of charge carriers with very different scattering rates. A corresponding trend has been reported for various FeSCs for which the narrow (broad) Drude-peak has been assigned to the electron-like (hole-like) bands around the -point (M-point) of the Brillouin zone Wu et al. (2010); Dai et al. (2013b); Nakajima et al. (2013). Fig. 3(b) shows the temperature dependence of the plasma frequencies of the two Drude terms which remain constant within the error bar of the measurement, indicating that the band structure hardly changes with temperature. Fig. 3(c) displays the temperature dependence of the corresponding scattering rates which both decrease towards low temperature. The red solid line denotes a -linear fit of that spans the entire temperature range above and is suggestive of a non Fermi-liquid behavior, similar as in optimally doped Ba1-xKxFe2As2 Dai et al. (2013b).
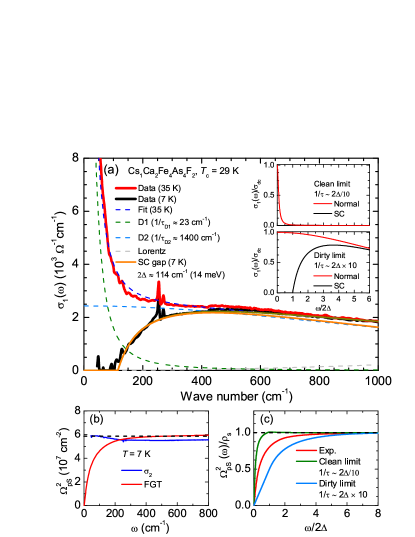
Next, we focus on the optical response of CsCa2Fe4As4F2 in the superconducting state. Figure 4(a) shows the optical conductivity of CsCa2Fe4As4F2 at 35 K just above (thick red line) and at 7 K well below (thick black line). The dashed line shows the fit to the data at 35 K, which consists of a narrow Drude peak with and , and a broad one with and . For the spectrum in the superconducting state at 7 K spectrum, there is a strong suppression of the low-frequency conductivtiy (that sets in below about 400). In particular, as was already noted above, there is a full suppression of the optical conductivity up to a frequency of about 110 and a steep increase of toward higher frequency that is the hallmark of a nodeless SC gap with a magnitude of meV.
For a quantitative description of the spectrum at 7 K we have used a Mattis-Bardeen-type model of the optical conductivity Mattis and Bardeen (1958); Zimmermann et al. (1991) for each of the two Drude-peaks. Notably, since and , this means that the first (narrow) part of the Drude-response is in the clean limit () whereas the second (broad) part is in the dirty limit (). As illustrated in the inset of Fig. 4(a), for the former clean-limit case nearly all of the normal state spectral weight is located below . In the superconducting state, therefore essentially all of this spectral weight is redistributed to the function at zero frequency that accounts for the superconducting condensate, leaving no observable conductivity at finite frequency. In the dirty-limit case, much of the normal state spectral weight lies above and therefore does not contribute to the SC condensate. The remaining regular part of has an absorption edge at above which the conductivity first rises steeply and eventually levels off and slowly approaches the normal state value above . Indeed, as shown by the solid orange line through the data, the spectrum at 7 K is rather well described by a single Mattis-Bardeen-type SC gap in the dirty limit. The gap value determined from the fit is meV and the ratio is about 4.8, in agreement with a recent heat transport study Huang et al. (2019). Therefore, as a consequence of its multiband nature, the optical response in the superconducting state of CsCa2Fe4As4F2 simultaneously satisfies the clean- and dirty-limit conditions.
The magnitude of the zero-frequency function and thus the superconducting plasma frequency, , and the density of the superfluid condensate, , can be calculated using the so-called FGT sum rule Ferrell and Glover (1958); Tinkham and Ferrell (1959):
| (2) |
where is chosen such that is indistinguishable between the normal and superconducting states. Alternatively, the superfluid density is deduced from the imaginary part of the optical conductivity Jiang et al. (1996) according to:
| (3) |
For equation 3 to be accurate, the contribution of the regular (non-superconducting) response to has to be subtracted as described in Refs. Dordevic et al. (2002); Zimmers et al. (2004).
Figure 4(b) shows the superfluid density at 7 K as obtained from the FGT sum rule (red curve) and from (blue curve). The values obtained from both methods agree rather well, as indicated by the black dashed line, and yield a superfluid plasma frequency of 7 600 that corresponds to a magnetic penetration depth of nm. The frequency dependence of , normalized to the values of and , is shown by the red line in Fig. 4(c). The value of first increase steeply up to before it starts to saturate and eventually approaches unity around , indicating that the FGT sum rule is satisfied at this energy scale. For comparison, we also show in Fig. 4(c) the corresponding curves obtained assuming that the response of both Drude-bands is in the pure clean-limit (green line) or dirty-limit (blue line). It shows that the pure clean-limit (dirty-limit) case leads to a much steeper (slower) increase of than in the experimental data, thus confirming our interpretation in terms of a band-selective clean- and dirty-limit scenario.
Overall, the optical response in the superconducting state of the 12442 compound CsCa2Fe4As4F2 compares rather well with the one reported for CaKFe4As4 and optimally doped Ba1-xKxFe2As2, which also show multiple nodeless SC gaps Yang et al. (2017); Li et al. (2008); Dai et al. (2013a). The existence of a multiband, clean- and dirty-limit superconductivity has also been reported for FeSCs, such as 11-type FeTe0.55Se0.45 Homes et al. (2015) and 111-type LiFeAs Dai et al. (2016). However, for these latter FeSCs, the description of the SC response required at least two SC gaps that are in the dirty-limit. This may well be the result of a larger disorder, as compared to CsCa2Fe4As4F2. Alternatively, it may indicate that the SC gaps on the three hole-like bands around the -point, which are responsible for the broad Drude response, have very similar magnitudes in CsCa2Fe4As4F2 but not for the other FeSCs mentioned above.
To summarize, the optical properties of the multiband superconductor CsCa2Fe4As4F2 ( K) have been investigated for numerous temperatures above and below . Taking into account the multiband nature of this material, the normal state optical properties have been described by a two-Drude model with a narrow and a very broad Drude peak. In the superconducting state below K, a sharp gap feature is observed in the optical conductivity spectrum with a full suppression of below 110 that is a hallmark of a nodeless superconductor. A quantitative description of the superconducting response has been obtained with a two-gap model that assumes the coexistence of a clean-limit gap on the narrow Drude band and a single dirty-limit gap on the broad Drude band. For the latter we derived a magnitude of meV. The overall plasma frequency or condensate density has been deduced as 7 600, corresponding to a magnetic penetration depth of 210 nm.
Work at the University of Fribourg was supported by the Schweizer Nationalfonds (SNF) by Grant No. 200020-172611.
References
- Kamihara et al. (2008) Y. Kamihara, T. Watanabe, M. Hirano, and H. Hosono, Journal of the American Chemical Society 130, 3296 (2008).
- Chen et al. (2008a) X. H. Chen, T. Wu, G. Wu, R. H. Liu, H. Chen, and D. F. Fang, Nature 453, 761 (2008a).
- Chen et al. (2008b) G. F. Chen, Z. Li, D. Wu, G. Li, W. Z. Hu, J. Dong, P. Zheng, J. L. Luo, and N. L. Wang, Phys. Rev. Lett. 100, 247002 (2008b).
- Paglione and Greene (2010) J. Paglione and R. L. Greene, Nature Physics 6, 645 (2010).
- Stewart (2011) G. R. Stewart, Rev. Mod. Phys. 83, 1589 (2011).
- Wang et al. (2008) X. Wang, Q. Liu, Y. Lv, W. Gao, L. Yang, R. Yu, F. Li, and C. Jin, Solid State Commun. 148, 538 (2008).
- Hsu et al. (2008) F.-C. Hsu, J.-Y. Luo, K.-W. Yeh, T.-K. Chen, T.-W. Huang, P. M. Wu, Y.-C. Lee, Y.-L. Huang, Y.-Y. Chu, D.-C. Yan, et al., Proc. Natl. Acad. Sci. 105, 14262 (2008).
- Rotter et al. (2008a) M. Rotter, M. Tegel, D. Johrendt, I. Schellenberg, W. Hermes, and R. Pöttgen, Phys. Rev. B 78, 020503 (2008a).
- Rotter et al. (2008b) M. Rotter, M. Tegel, and D. Johrendt, Phys. Rev. Lett. 101, 107006 (2008b).
- Sefat et al. (2008) A. S. Sefat, R. Jin, M. A. McGuire, B. C. Sales, D. J. Singh, and D. Mandrus, Phys. Rev. Lett. 101, 117004 (2008).
- Kasahara et al. (2010) S. Kasahara, T. Shibauchi, K. Hashimoto, K. Ikada, S. Tonegawa, R. Okazaki, H. Shishido, H. Ikeda, H. Takeya, K. Hirata, et al., Phys. Rev. B 81, 184519 (2010).
- Alireza et al. (2008) P. L. Alireza, Y. T. C. Ko, J. Gillett, C. M. Petrone, J. M. Cole, G. G. Lonzarich, and S. E. Sebastian, Journal of Physics: Condensed Matter 21, 012208 (2008).
- Iyo et al. (2016) A. Iyo, K. Kawashima, T. Kinjo, T. Nishio, S. Ishida, H. Fujihisa, Y. Gotoh, K. Kihou, H. Eisaki, and Y. Yoshida, Journal of the American Chemical Society 138, 3410 (2016).
- Meier et al. (2018) W. R. Meier, Q.-P. Ding, A. Kreyssig, S. L. Bud’ko, A. Sapkota, K. Kothapalli, V. Borisov, R. Valentí, C. D. Batista, P. P. Orth, et al., npj Quantum Mater. 3, 5 (2018).
- Wang et al. (2016) Z.-C. Wang, C.-Y. He, S.-Q. Wu, Z.-T. Tang, Y. Liu, A. Ablimit, C.-M. Feng, and G.-H. Cao, Journal of the American Chemical Society 138, 7856 (2016).
- Wang et al. (2017) Z.-C. Wang, C.-Y. He, S.-Q. Wu, Z.-T. Tang, Y. Liu, and G.-H. Cao, Chemistry of Materials 29, 1805 (2017).
- Smidman et al. (2018) M. Smidman, F. K. K. Kirschner, D. T. Adroja, A. D. Hillier, F. Lang, Z. C. Wang, G. H. Cao, and S. J. Blundell, Phys. Rev. B 97, 060509 (2018).
- Kirschner et al. (2018) F. K. K. Kirschner, D. T. Adroja, Z.-C. Wang, F. Lang, M. Smidman, P. J. Baker, G.-H. Cao, and S. J. Blundell, Phys. Rev. B 97, 060506 (2018).
- Mou et al. (2016) D. Mou, T. Kong, W. R. Meier, F. Lochner, L.-L. Wang, Q. Lin, Y. Wu, S. L. Bud’ko, I. Eremin, D. D. Johnson, et al., Phys. Rev. Lett. 117, 277001 (2016).
- Cui et al. (2017) J. Cui, Q.-P. Ding, W. R. Meier, A. E. Böhmer, T. Kong, V. Borisov, Y. Lee, S. L. Bud’ko, R. Valentí, P. C. Canfield, et al., Phys. Rev. B 96, 104512 (2017).
- Biswas et al. (2017) P. K. Biswas, A. Iyo, Y. Yoshida, H. Eisaki, K. Kawashima, and A. D. Hillier, Phys. Rev. B 95, 140505 (2017).
- Cho et al. (2017) K. Cho, A. Fente, S. Teknowijoyo, M. A. Tanatar, K. R. Joshi, N. M. Nusran, T. Kong, W. R. Meier, U. Kaluarachchi, I. Guillamón, et al., Phys. Rev. B 95, 100502 (2017).
- Yang et al. (2017) R. Yang, Y. Dai, B. Xu, W. Zhang, Z. Qiu, Q. Sui, C. C. Homes, and X. Qiu, Phys. Rev. B 95, 064506 (2017).
- Ding et al. (2008) H. Ding, P. Richard, K. Nakayama, K. Sugawara, T. Arakane, Y. Sekiba, A. Takayama, S. Souma, T. Sato, T. Takahashi, et al., EPL (Europhysics Letters) 83, 47001 (2008).
- (25) Z.-C. Wang, Y. Liu, S.-Q. Wu, Y.-T. Shao, Z. Ren, and G.-H. Cao, eprint arXiv:1811.05706(2018).
- Homes et al. (1993) C. C. Homes, M. Reedyk, D. A. Cradles, and T. Timusk, Appl. Opt. 32, 2976 (1993).
- Dressel and Grüner (2002) M. Dressel and G. Grüner, Electrodynamics of Solids (Cambridge University press, 2002).
- Akrap et al. (2009) A. Akrap, J. J. Tu, L. J. Li, G. H. Cao, Z. A. Xu, and C. C. Homes, Phys. Rev. B 80, 180502 (2009).
- Xu et al. (2015) B. Xu, Y. M. Dai, B. Shen, H. Xiao, Z. R. Ye, A. Forget, D. Colson, D. L. Feng, H. H. Wen, C. C. Homes, et al., Phys. Rev. B 91, 104510 (2015).
- Ferrell and Glover (1958) R. A. Ferrell and R. E. Glover, Phys. Rev. 109, 1398 (1958).
- Tinkham and Ferrell (1959) M. Tinkham and R. A. Ferrell, Phys. Rev. Lett. 2, 331 (1959).
- Li et al. (2008) G. Li, W. Z. Hu, J. Dong, Z. Li, P. Zheng, G. F. Chen, J. L. Luo, and N. L. Wang, Phys. Rev. Lett. 101, 107004 (2008).
- Dai et al. (2013a) Y. M. Dai, B. Xu, B. Shen, H.-H. H. Wen, X. G. Qiu, R. P. S. M. Lobo, R. P. S. M. Lobo, and R. P. S. M. Lobo, EPL (Europhysics Lett. 104, 47006 (2013a).
- Xu et al. (2017) B. Xu, Y. M. Dai, H. Xiao, B. Shen, H. H. Wen, X. G. Qiu, and R. P. S. M. Lobo, Phys. Rev. B 96, 115125 (2017).
- Mallett et al. (2017) B. P. P. Mallett, C. N. Wang, P. Marsik, E. Sheveleva, M. Yazdi-Rizi, J. L. Tallon, P. Adelmann, T. Wolf, and C. Bernhard, Phys. Rev. B 95, 054512 (2017).
- Wu et al. (2010) D. Wu, N. Barišić, P. Kallina, A. Faridian, B. Gorshunov, N. Drichko, L. J. Li, X. Lin, G. H. Cao, Z. A. Xu, et al., Phys. Rev. B 81, 100512 (2010).
- Dai et al. (2013b) Y. M. Dai, B. Xu, B. Shen, H. Xiao, H. H. Wen, X. G. Qiu, C. C. Homes, and R. P. S. M. Lobo, Phys. Rev. Lett. 111, 117001 (2013b).
- Nakajima et al. (2013) M. Nakajima, T. Tanaka, S. Ishida, K. Kihou, C. H. Lee, A. Iyo, T. Kakeshita, H. Eisaki, and S. Uchida, Phys. Rev. B 88, 094501 (2013).
- Mattis and Bardeen (1958) D. C. Mattis and J. Bardeen, Phys. Rev. 111, 412 (1958).
- Zimmermann et al. (1991) W. Zimmermann, E. Brandt, M. Bauer, E. Seider, and L. Genzel, Physica C: Superconductivity 183, 99 (1991).
- Huang et al. (2019) Y. Y. Huang, Z. C. Wang, Y. J. Yu, J. M. Ni, Q. Li, E. J. Cheng, G. H. Cao, and S. Y. Li, Phys. Rev. B 99, 020502 (2019).
- Jiang et al. (1996) C. Jiang, E. Schachinger, J. P. Carbotte, D. Basov, and T. Timusk, Phys. Rev. B 54, 1264 (1996).
- Dordevic et al. (2002) S. V. Dordevic, E. J. Singley, D. N. Basov, S. Komiya, Y. Ando, E. Bucher, C. C. Homes, and M. Strongin, Phys. Rev. B 65, 134511 (2002).
- Zimmers et al. (2004) A. Zimmers, R. P. S. M. Lobo, N. Bontemps, C. C. Homes, M. C. Barr, Y. Dagan, and R. L. Greene, Phys. Rev. B 70, 132502 (2004).
- Homes et al. (2015) C. C. Homes, Y. M. Dai, J. S. Wen, Z. J. Xu, and G. D. Gu, Phys. Rev. B 91, 144503 (2015).
- Dai et al. (2016) Y. M. Dai, H. Miao, L. Y. Xing, X. C. Wang, C. Q. Jin, H. Ding, and C. C. Homes, Phys. Rev. B 93, 054508 (2016).