88email: Pascal.Quinet@umons.ac.be
Plasma environment effects on K lines of astrophysical interest
Abstract
Aims. In the context of accretion disks around black holes, we estimate plasma-environment effects on the atomic parameters associated with the decay of K-vacancy states in highly charged iron ions, namely Fe xvii – Fe xxv.
Methods. Within the relativistic multiconfiguration Dirac–Fock (MCDF) framework, the electron–nucleus and electron–electron plasma screenings are approximated with a time-averaged Debye-Hückel potential.
Results. Modified ionization potentials, K thresholds, wavelengths, radiative emission rates and Auger widths are reported for astrophysical plasmas characterized by electron temperatures and densities respectively in the ranges K and cm-3.
Conclusions. We conclude that the high-resolution micro-calorimeters onboard future X-ray missions such as XRISM and ATHENA are expected to be sensitive to the lowering of the iron K edge due to the extreme plasma conditions occurring in accretion disks around compact objects.
Key Words.:
Black hole physics – Plasmas – Atomic data – X-rays: general1 Introduction
Accurate descriptions of K-shell atomic processes are essential in the analysis of the X-ray spectra from space telescopes such as Chandra, XMM-Newton, Suzaku, and NuSTAR. In this respect, we have been involved for the past two decades in extensive computations of the relevant atomic data for cosmic abundant elements with atomic number , iron in particular, but also trace elements with odd (see, for example, Palmeri et al., 2002, 2003a, 2003b, 2008, 2011, 2012, 2016; Bautista et al., 2003, 2004; Kallman et al., 2004; García et al., 2005, 2009; García, Kallman & Mushotzky, 2011; Mendoza et al., 2004, 2017, 2018; Witthoeft et al., 2009, 2011; Gorczyka et al., 2013; Hasoglu et al., 2014).
This data collection has become a reference source in several atomic databases for astrophysical applications, e.g. Bautista & Kallman (2001), AtomDB111http://www.atomdb.org, chianti (Landi et al., 2012), and uaDB222http://heasarc.gsfc.nasa.gov/uadb/ as well as in spectral modeling codes such as xstar (Kallman & Bautista, 2001), cloudy (Ferland et al., 2013), spex (Kaastra et al., 1996), and ion (Netzer, 1996). However, these atomic parameters have been computed neglecting plasma-embedding effects, and consequently, they are not expected to be applicable at relatively high electron densities, say cm-3 (Smith & Brickhouse, 2014).
Absorption and emission of high-energy photons in dense plasmas occur in a wide range of astrophysical phenomena, among the most exciting perhaps are the X-rays produced and reprocessed in the regions close to compact objects such as black holes and neutron stars. In these systems the gas inflow caused by the strong gravitational potential forms an accretion disk from which copious X-ray radiation is emitted (e.g. Krolik, 1999; Done et al., 2007). Observed spectra are usually imprinted with atomic features, both in emission and absorption, from a wide variety of ionic species, the modeling of which provides reliable insights of the composition, temperature, and degree of ionization of the plasma (Ross & Fabian, 2005; García & Kallman, 2010). In the case of a black hole, its angular momentum can be inferred by modeling the distortion of the Fe K emission complex caused by the strong relativistic effects (e.g. Reynolds, 2013; García et al., 2014).
X-ray emission lines from accreting sources, in particular the K and K lines from Fe ions, are characterized by observed widths and shifts mostly implying an origin close to the compact object (Reynolds & Nowak, 2003); that is, the innermost stable circular orbit in the case of a black hole, or the stellar surface in the case of a neutron star. Line intensities may thus provide estimates of key properties of these exotic dense-plasma environments, including the effects of both special and general relativity in the emitting region, that are not attainable through other observational windows. In order to analyze the K and K emission lines to derive, for instance, the Fe ionic fractions and abundance, it is of paramount importance to rely on accurate radiative and Auger data to infer the emission and absorption rates under various extreme conditions.
Dynamical models of black-hole accretion flows appear to support densities as high as cm-3 (Reis & Miller, 2013; Schnittman et al., 2013; Tomsick et al., 2018; Jiang et al., 2019), but thus far, their effect on line emission has not been studied in detail. It is worth noting that iron-ion survival near a black hole requires such high densities to counteract the strong ionization, and therefore, plasma embedding effects on the ionic structure, K photoexcitation and photoionization, and both radiative and Auger decay become unavoidable issues.
Following previous work on the oxygen isonuclear sequence by Deprince et al. (2019a), we have estimated density effects on the atomic parameters associated with the K-vacancy states of highly charged iron ions. Multiconfiguration Dirac–Fock computations have been carried out for these species representing the plasma electron–nucleus and electron–electron shieldings with a time-averaged Debye-Hückel potential. Deprince et al. (2019a) have shown that both of these plasma interactions must be taken into account. We use a combination of the GRASP92 code (Parpia et al., 1996) to obtain the wave functions and RATIP (Fritzsche, 2012) to calculate the atomic parameters. We report a first set of results on the ionization potentials, K thresholds, transition wavelengths, radiative emission rates, and Auger widths for nine ions: from Fe xvii (Ne-like) to Fe xxv (He-like).
2 Theoretical model
2.1 Relativistic Multiconfiguration Dirac–Fock Method
Wave functions for the ionic species Fe xvii – Fe xxv are obtained using the fully relativistic multiconfiguration Dirac–Fock (MCDF) method, implemented in the GRASP92 version (Parpia et al., 1996) of the General-purpose Relativistic Atomic Structure Program (GRASP) initially developed by Grant et al. (1980), McKenzie et al. (1980), and Grant (1988). In this approach the atomic state functions (ASF) () are expanded in linear combinations of the configuration state functions (CSF) (i)
| (1) |
The CSF are in turn taken as linear combinations of Slater determinants constructed from monoelectronic spin-orbitals of the form
| (2) |
where () and () are, respectively, the large and small components of the radial wave function, and the angular functions κm(,) are spinor spherical harmonics. The i coefficients represent all the one-electron and intermediate quantum numbers needed to completely define the CSF, and is usually chosen as the i corresponding to the CSF with the largest weight 2. The quantum number is given by
| (3) |
being the electron total angular momentum. The sign before the parenthesis in Eq. (3) corresponds to the coupling relation between the electron orbital momentum and its spin
| (4) |
The angular functions κm(,) are spinor spherical harmonics in the coupling scheme. Following Grant (2007) their expression is given by
| (5) |
with the two spinors
| (6) |
The radial functions nκ() and nκ() are numerically represented on a logarithmic grid, and are required to be orthonormal within each symmetry. In the MCDF variational procedure, the radial functions and expansion coefficients are optimized self-consistently.
In the present work the restricted active space (RAS) method is used to obtain the MCDF expansions for each ionic system. In this method electrons are excited from prescribed reference configurations to a given active set of orbitals; that is, the RAS is built up by considering all the single and double excitations from the ground and spectroscopic configurations to the configuration space. The list of reference configurations for each ionic system is specified as follows:
- Fe xvii:
-
1s22s22p6, 1s22s22p53s
- Fe xviii:
-
1s22s22p5, 1s22s22p43s
- Fe xix:
-
1s22s22p4, 1s22s2p5, 1s22p6, 1s2s22p5, 1s2s2p6
- Fe xx:
-
1s22s22p3, 1s22s2p4, 1s22p5, 1s2s22p4, 1s2s2p5, 1s2p6
- Fe xxi:
-
1s22s22p2, 1s22s2p3, 1s22p4, 1s2s22p3, 1s2s2p4, 1s2p5
- Fe xxii:
-
1s22s22p, 1s22s2p2, 1s22p3, 1s2s22p2, 1s2s2p3, 1s2p4
- Fe xxiii:
-
1s22s2, 1s22s2p, 1s22p2, 1s2s22p, 1s2s2p2, 1s2p3
- Fe xxiv:
-
(1s+2s+2p)3
- Fe xxv:
-
1s2, 1s2s, 1s2p
The computations are carried out with the extended average level (EAL) option, optimizing a weighted trace of the Hamiltonian using level weights proportional to (), and they are completed with the inclusion of the relativistic two-body Breit interaction and the quantum electrodynamic corrections (QED) due to the self-energy and vacuum polarization. The MCDF ionic bound states generated by GRASP92 are then used in RATIP (Fritzsche, 2012) to compute the atomic structure and the radiative and Auger parameters associated with K-vacancy states.
2.2 Plasma screening effects
We use a Debye-Hückel (DH) potential to model the plasma screening effects on the atomic properties, which in atomic units (a.u.) is given by
| (7) |
is the number of bound electrons, is the distance of the th electron from the nucleus, and is the distance between the and electrons. The plasma screening parameter is the inverse of the Debye shielding length De, and can be expressed in terms of the plasma electron density and temperature as
| (8) |
A given value of is then associated with a certain type of plasma environment. For example, according to the magnetohydrodynamic simulations reported by Schnittman et al. (2013) for accreting black holes with ten solar masses and an accretion rate of 10%, the plasma conditions have been estimated at K and cm-3. As shown in Table 1, this range corresponds to values of a.u. for which the plasma-coupling parameter (Piel, 2010)
| (9) |
denoting the ratio of the electrostatic energy of neighboring particles to the thermal energy in the astrophysical plasma (predominantly protons and electrons), is always smaller (much smaller in most cases) than unity. This is in fact the validity condition for the statistically shielded DH potential to describe appropriately the screened Coulomb electrostatic interaction (see, for example, Saha & Fritzsche, 2006; Belkhiri et al., 2015; Das et al., 2016). In Eq. (9) is the charge of the neighboring particles separated by a typical distance .
| 0.002 | 0.008 | 0.024 | 0.077 | 0.242 | |
| 0.001 | 0.002 | 0.008 | 0.024 | 0.077 | |
| 0.000 | 0.001 | 0.002 | 0.008 | 0.024 |
Therefore, when computing the atomic data with the RATIP code, we replace the electron–nucleus and electron–electron Coulomb interactions of the ionic system with the corresponding DH potential terms of Eq. (7) assuming values of the plasma screening parameter in the range a.u. The applicability of this approach was recently discussed for the oxygen isonuclear sequence by Deprince et al. (2019a).
| Ion | NIST | |||
|---|---|---|---|---|
| Fe xvii | 1260.58 | 1214.75 | 1147.80 | |
| Fe xviii | 1357.09 | 1308.56 | 1237.68 | |
| Fe xix | 1459.12 | 1407.92 | 1333.09 | |
| Fe xx | 1573.48 | 1519.58 | 1440.80 | |
| Fe xxi | 1689.13 | 1632.53 | 1549.75 | |
| Fe xxii | 1797.82 | 1738.54 | 1651.80 | |
| Fe xxiii | 1950.49 | 1888.61 | 1798.43 | |
| Fe xxiv | 2044.34 | 1979.79 | 1885.77 | |
| Fe xxv | 8836.74 | 8768.90 | 8667.86 |
3 Results and discussion
3.1 Ionization potentials and K-thresholds
The ionization potentials (IP) and K thresholds we have computed with screening parameters in the range a.u. are summarized in Tables 2–3. For the isolated ions ( = 0) we reproduce the IPs listed in the NIST spectroscopic database (Kramida et al., 2018) to an accuracy better than 0.2%. The inclusion of the DH potential leads to reductions of the IP and K-threshold energy positions that increase with ; namely 3% and 8% for and , respectively, except for Fe xxv for which the reduction is less than 2% due to its large IP eV. For the same reason, the K-threshold reductions are only marginal ().
| Ion | |||
|---|---|---|---|
| Fe xvii | 7697.64 | 7651.45 | 7582.46 |
| Fe xviii | 7827.06 | 7778.17 | 7705.19 |
| Fe xix | 7959.86 | 7908.27 | 7831.30 |
| Fe xx | 8095.41 | 8041.11 | 7960.14 |
| Fe xxi | 8246.57 | 8189.56 | 8104.56 |
| Fe xxii | 8398.74 | 8339.03 | 8250.02 |
| Fe xxiii | 8558.75 | 8496.29 | 8403.31 |
| Fe xxiv | 8689.49 | 8624.26 | 8527.21 |
| Fe xxv | 8836.74 | 8768.90 | 8667.86 |
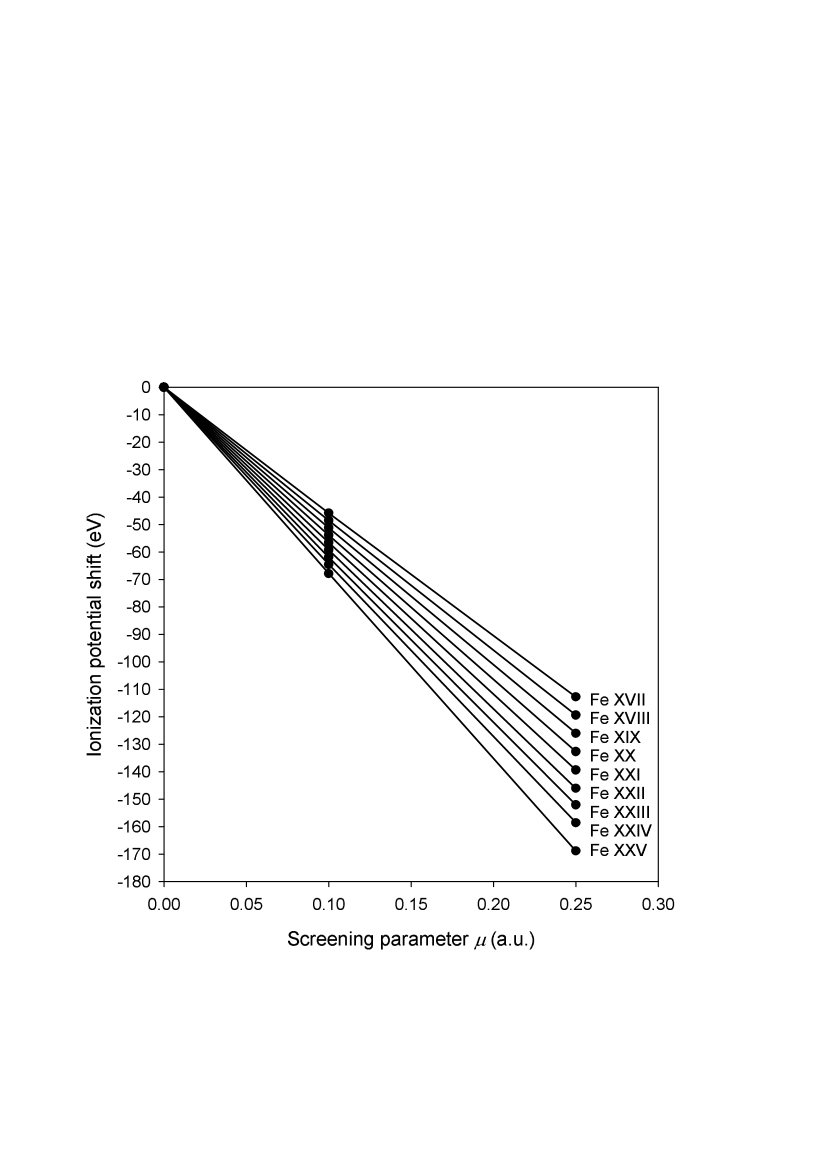
This threshold lowering is a well-known phenomenon in dense-plasma physics, whose behavior is further illustrated in Figs. 1–2. For each of the ionic species considered, the DH potential predicts a linear decrease of the IP downshift with at a gradient that grows with ionic charge (see Fig. 1); however, as shown in Fig. 2, the IP-shift variation with effective ionic charge for a particular is only moderate: . On the other hand, we find that, for any specific ionic species, the IP and K-threshold energy shifts are practically the same (see Fig. 2).
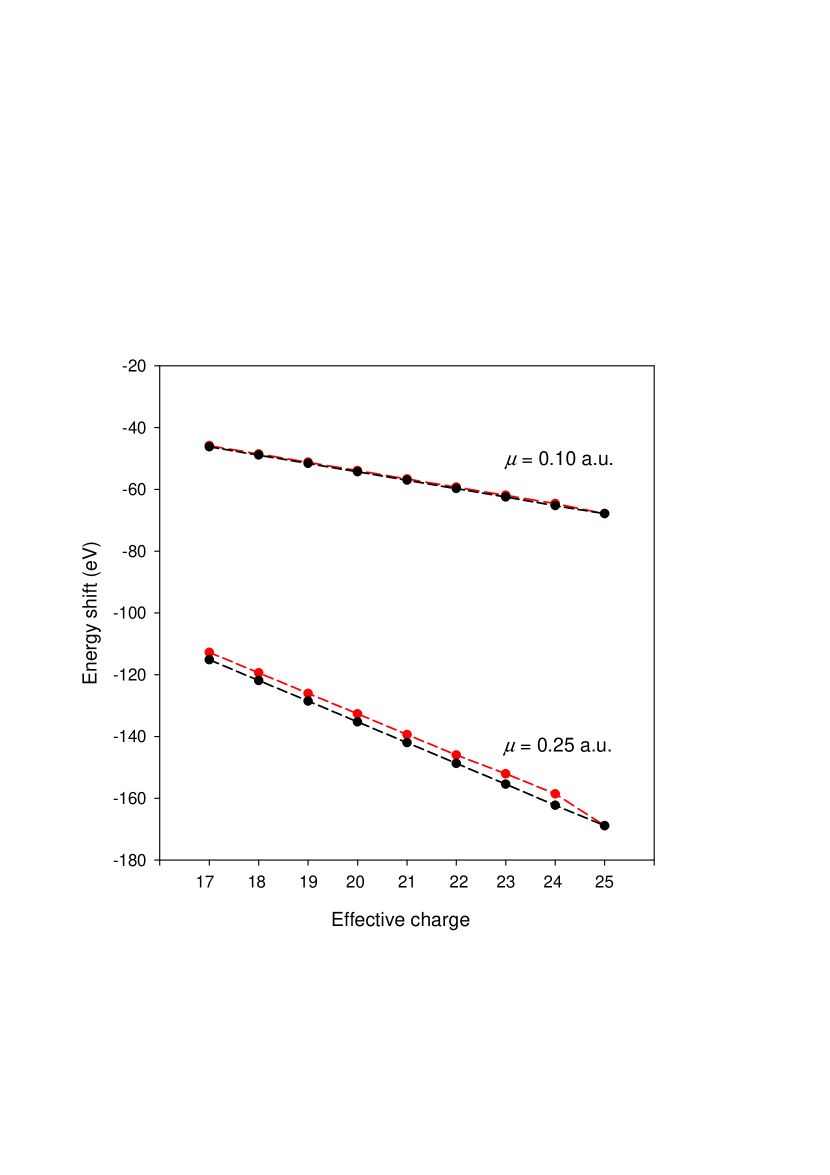
In agreement with Deprince et al. (2019a) and as shown in Table 4, the inclusion of the electron–electron Debye screening, in addition to the electron–nucleus screening, leads to a substantially less pronounced IP lowering: 4% in Fe xxv to 50% Fe xvii. As expected, this discrepancy grows inversely with as the number of interacting electron–electron pairs is larger for the low-charge states.
The importance of the screening effects by the electron–electron pair interactions has also been recently highlighted by Das et al. (2016), who found significant influence of such effects on the IP lowering and excitation energies in Al ions, in particular in the neutral and lowly ionized species. They also found that more stable atomic systems are predicted when the electron–electron screening is taken into account. The Debye electron–nucleus and electron–electron screening effects have been amply discussed by, for instance, Winkler (1996), Kar & Ho (2004, 2005), Saha & Fritzsche (2006), Xie et al. (2012), Certik & Winkler (2013), Jiao & Ho (2014), and Deprince et al. (2019a).
| Ion | ||||
|---|---|---|---|---|
| Fe xvii | 1190.72 | 1214.75 | 1089.22 | 1147.80 |
| Fe xviii | 1287.21 | 1308.56 | 1185.55 | 1237.68 |
| Fe xix | 1389.10 | 1407.92 | 1287.41 | 1333.09 |
| Fe xx | 1503.54 | 1519.58 | 1401.59 | 1440.80 |
| Fe xxi | 1619.15 | 1632.53 | 1517.02 | 1549.75 |
| Fe xxii | 1727.82 | 1738.54 | 1625.57 | 1651.80 |
| Fe xxiii | 1880.58 | 1888.61 | 1778.76 | 1798.43 |
| Fe xxiv | 1974.41 | 1979.79 | 1872.58 | 1885.77 |
| Fe xxv | 8766.28 | 8768.90 | 8661.14 | 8667.86 |
3.2 Radiative transitions
Computed wavelengths and transition probabilities for the stronger K lines ( s-1) of Fe xvii – Fe xxv with the three plasma screening parameters , 0.1, and 0.25 a.u. are listed in Table 5. If our data for the isolated ion ( = 0) are compared with Palmeri et al. (2003a) and Mendoza et al. (2004), who used the pseudo-relativistic Hartree–Fock (HFR) method, good agreement is generally found. For the transitions listed in Table 5, the wavelengths agree to better than 0.1% while the transition probabilities can show differences at the 25% level. Since we have taken into account similar configuration interaction effects in our atomic models as Palmeri et al. (2003a) and Mendoza et al. (2004), the main discrepancy source must be attributed to relativistic effects, which are more formerly treated in the MCDF method. Furthermore, we find excellent agreement (within 5%) among our -values computed in the Babushkin and Coulomb gauges, although only transition probabilities obtained in the Babushkin gauge are reported in Table 5.
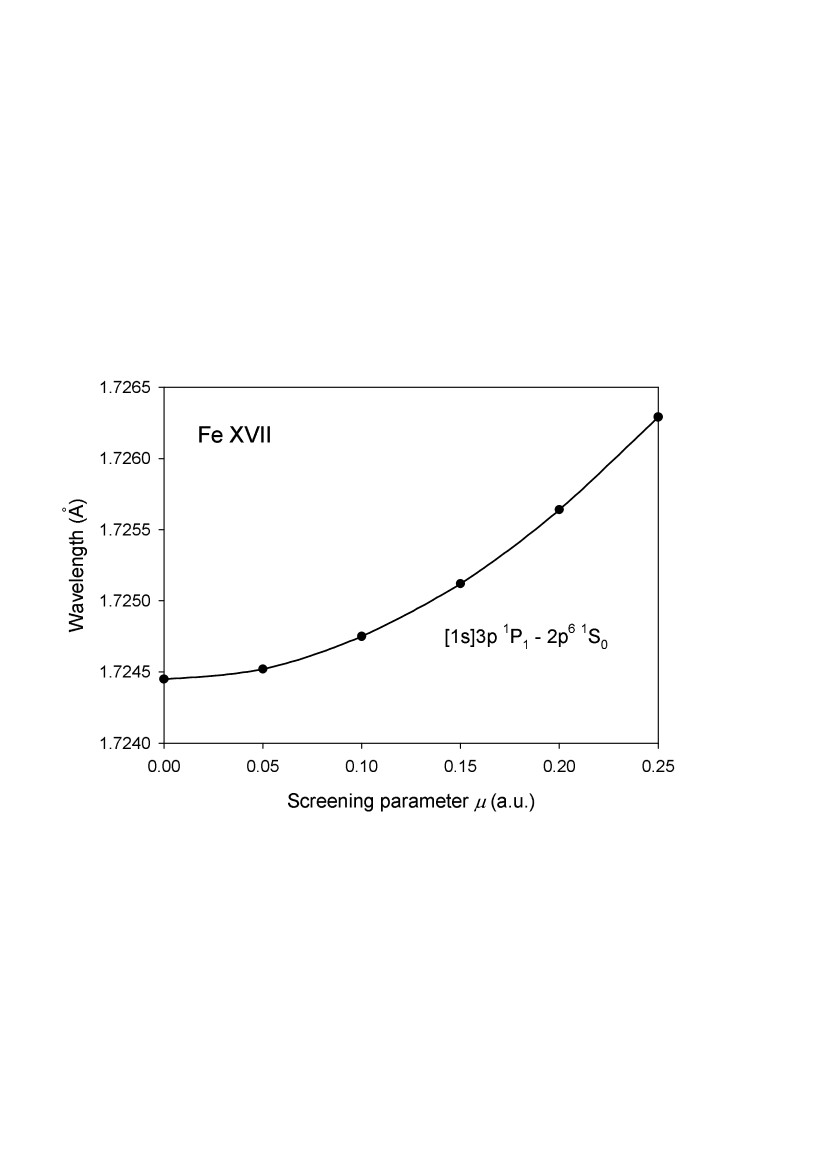
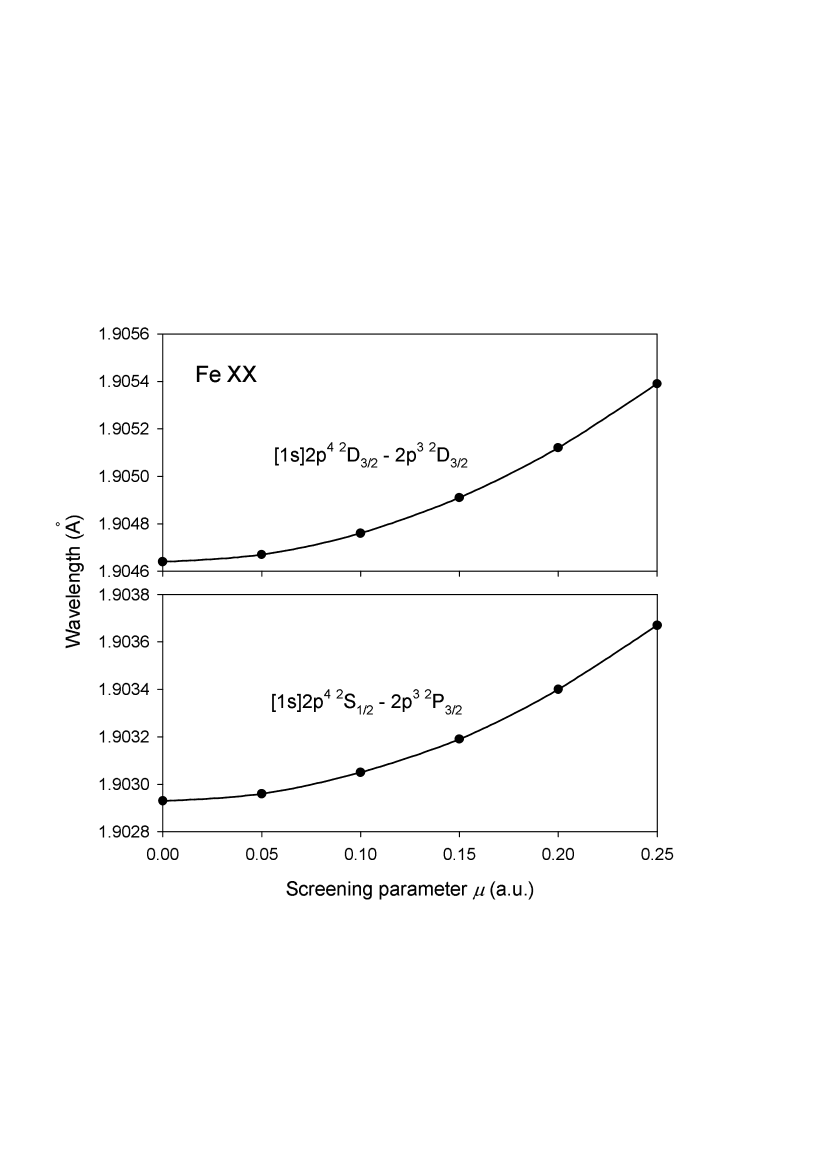
A close inspection of Table 5 brings out the meager effects of the plasma environment on the K-line radiative parameters. For screening parameters and , wavelengths appear redshifted relative to those of the isolated ion by less than 0.1 mÅ and 1 mÅ, respectively, while the variations of the radiative decay rates do not exceed more than a few percent. To illustrate this point we show in Fig. 3 the reddening of the [1s]3p 1P1 - 2p6 1S0 K line in Fe xvii, which for it amounts to mÅ. Similarly, for the [1s]2p4 2D3/2 - 2p3 2D3/2 and [1s]2p4 2S1/2 - 2p3 2P3/2 K lines in Fe xx in Fig. 4, the reddening is less than 1 mÅ.
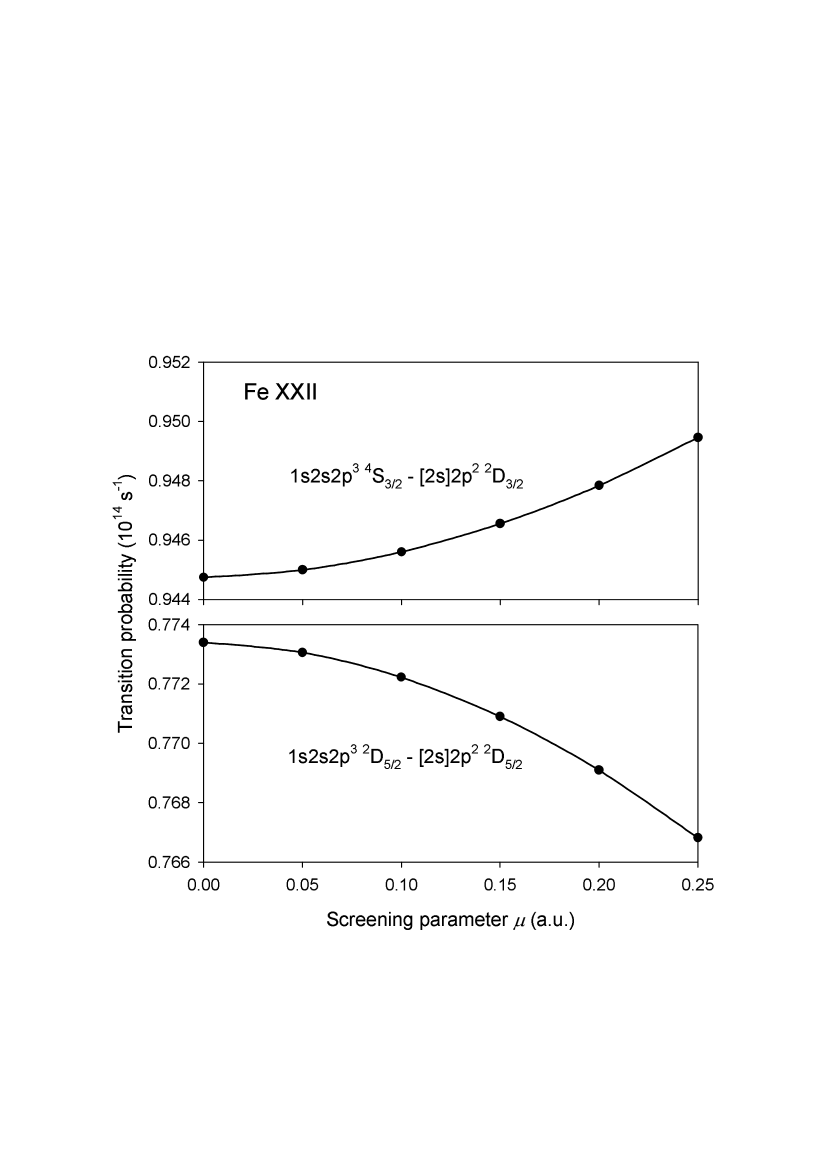
It is shown in Fig. 5 for the [1s]3p 3P0 - [2p]3p 3S1 and [1s]3p 1P1 - 2p6 1S0 lines in Fe xvii that although the plasma effects on the radiative transition probabilities (-values) are less than 1%, they can increase or decrease their nominal values (). In Fe xxii the changes are somewhat larger (3%) as illustrated in Fig. 6 with the 1s2s2p3 4S3/2 - [2s]2p2 2D3/2 and 1s2s2p3 2D5/2 - [2s]2p2 2D5/2 lines.
3.3 Auger widths
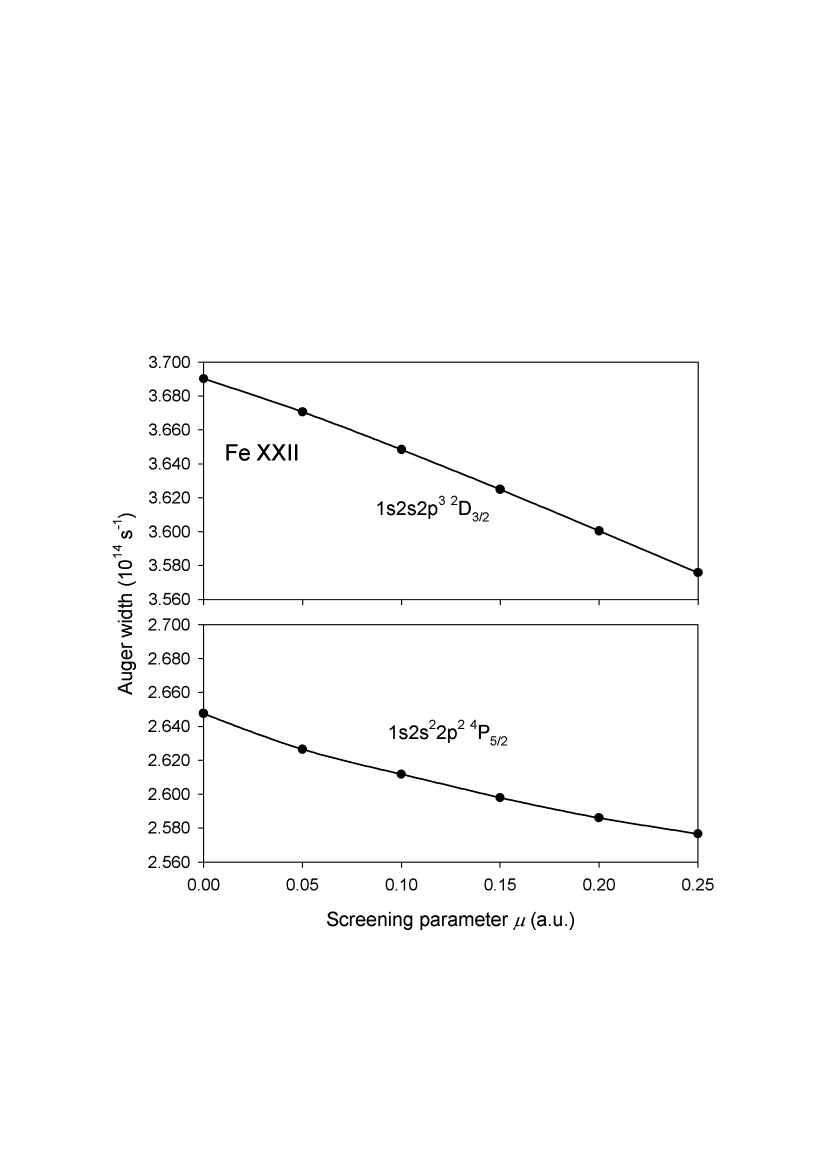
Computed Auger widths for the K-vacancy levels with screening parameters , 0.1, and 0.25 a.u. are tabulated in Table 6. Present widths for the isolated ion case ( a.u.) are found to be in good agreement (within 5%) with those computed previously with hfr by Palmeri et al. (2003a). The DH potential leads to more noticeable decrements of the Auger widths, namely by up to 3% and 10% for and 0.25 a.u., respectively. This variation is exemplified in Fig. 7 with the and K-vacancy levels in Fe xxii. We also find that the Auger widths for the higher iron ionization stages seem to be more affected by the plasma environment. As previously shown for Fe xvii, Fe xviii, and Fe xix by Deprince et al. (2019b), due to the weak variations of both the radiative rates and Auger widths with , the K-line fluorescence yields in the iron ions considered herein are hardly affected, i.e. by 3% at most.
4 Astrophysical implications
The atomic calculations hereby presented are expected to influence the predictions from plasma modeling in environments where the density and temperature of the gas are such that the screening parameter becomes important, i.e., for relatively low temperatures ( K) and high densities ( cm-3, see Table 1). These conditions could be encountered in astrophysical environments such as the solar interior (near the convective zone) or in the inner-most regions of accretion disks around compact objects (white dwarfs, neutron stars, and black holes). While the inclusion of the DH potential has a very small effect on the energy levels, radiative probabilities, and Auger widths, it does shift the ionization potential and K-threshold of each ion to lower energies. This effect would modify the part of the ionizing radiation field sampled by the photoionization cross section and, thus, the ionization rates in a photoionized plasma. For simplicity, if we assume a canonical radiation field in the form of an energy power law, the spectrum can be crudely represented by a power law . Therefore, for a flat spectrum in energy (), the rates will grow proportionally with the reduction of the K-threshold energy leading to a higher ionization rate; moreover, the steeper spectra the larger the change. The emissivity of the fluorescent lines will also display the same dependence increasing the intensity of the observed lines. The heating of the gas due to direct photoionization has the weaker dependence .
The shifts in the K thresholds are of eV for Fe xvii – Fe xxv at the largest screening parameter considered here. These shifts are marginally too small to be detected with the available X-ray observatories. Nevertheless, changes in the Fe K-edge position will be resolved with new instruments such as the micro-calorimeters aboard the future missions XRISM (Tashiro et al., 2018; Guainazzi & Tashiro, 2018) and ATHENA (Nandra et al., 2013; Guainazzi & Tashiro, 2018), which will have a resolution of a few eVs. Notice that unlike the energies of the K-thresholds, the energies of the K and K lines are almost unaffected by high density plasma effects. Hence, high spectral resolution observations should yield information on the ionization structure of the plasma and plasma effect simultaneously. This is by constraining the presence of different ionic stages on the position and structure of the K-lines, while diagnosing plasma screening effects on the position and structure of the respective K-thresholds. Moreover, we emphasize that the effects mentioned here only concern changes in the ionic radiative properties. Other plasma effects at high densities, such as the continuum lowering and increase of the collisional rates, are expected to introduce additional modifications to the observed spectra. These effects will be a matter of further study in our on-going projects.
5 Summary and conclusion
The influence of the plasma environment on the atomic structure and the radiative and Auger properties of K lines in highly charged iron ions (from He-like Fe xxv to Ne-like Fe xvii) has been studied by means of a time-averaged Debye–Hückel screened potential in the context of the relativistic multiconfiguration Dirac–Fock framework. The explored plasma screening-parameter space of the problem spans a.u. corresponding to conditions expected in compact-object accretion disks. The results can be summarized as follows:
-
1.
The ionization potentials and K-threshold energies are both lowered by the plasma environment. The lowering is found to be linearly dependent on both the plasma screening parameter and the ionic effective charge . They vary from eV to eV for corresponding to extreme plasma conditions.
-
2.
The importance of the electron–electron plasma screening has been reconfirmed.
-
3.
Plasma environment effects are negligibly small on the wavelengths (redshifted by less than ), the transition probabilities (they decrease or increase depending on transitions by a few percent) and the Auger widths (they decrease by at most 10%).
In conclusion, the high-resolution X-ray spectrometers onboard future missions such as XRISM and ATHENA are expected to be sensitive to the lowering of the iron K edge due to the extreme plasma conditions occurring in accretion disks around compact objects.
Acknowledgements.
J.D. is Research Fellow of the Belgian Fund for Research Training in Industry and Agriculture (FRIA) while P.P. and P.Q. are, respectively, Research Associate and Research Director of the Belgian Fund for Scientific Research (F.R.S.-FNRS). Financial supports from these organizations, as well as from the NASA Astrophysics Research and Analysis Program (grant 80NSSC17K0345) are gratefully acknowledged. J.A.G. acknowledges support from the Alexander von Humboldt Foundation.References
- Bautista & Kallman (2001) Bautista, M. A., & Kallman, T. R. 2001, ApJS, 134, 139
- Bautista et al. (2003) Bautista, M. A., Mendoza, C., Kallman, T. R., & Palmeri, P. 2003, A&A, 403, 339
- Bautista et al. (2004) Bautista, M. A., Mendoza, C., Kallman, T. R., & Palmeri, P. 2004, A&A, 418, 1171
- Belkhiri et al. (2015) Belkhiri, M., Fontes, C. J., & Poirier, M. 2015, Phys. Rev. A, 92, 032501
- Certik & Winkler (2013) Certik, O., & Winkler, P. 2013, Int. J. Quant. Chem., 113, 2012
- Das et al. (2016) Das, M., Sahoo, B. K., & Pal, S., 2016, Phys. Rev. A, 93, 052513
- Deprince et al. (2019a) Deprince, J., Bautista, M. A., Fritzsche, S., García, J., Kallman, T. R., Mendoza, C., Palmeri, P., & Quinet, P. 2019a, A&A, to be published
- Deprince et al. (2019b) Deprince, J., Bautista, M. A., Fritzsche, S., García, J., Kallman, T. R., Mendoza, C., Palmeri, P., & Quinet, P. 2019b, X-Ray Spectrom., to be published
- Done et al. (2007) Done, C., Gierlinski, M., & Kubota, A. 2007, A&ARv, 15, 1
- Ferland et al. (2013) Ferland, G. J., Porter, R. L., van Hoof, P. A. M., Williams, R. J. R., Abel, N. P., Lykins, M. L., Shaw, G., Henney, W. J., & Stancil, P. C. 2013, Rev. Mex. Astron. Astrophys., 49, 137
- Fritzsche (2012) Fritzsche, S. 2012, Comput. Phys. Commun., 183, 1523
- García et al. (2014) García, J., Dauser, T., Lohfink, A., Kallman, T. R., Steiner, J. F., McClintock, J. E., Brenneman, L., Wilms, J., Eikmann, W., Reynolds, C. S., & Tombesi, F. 2014, ApJ, 782, 76
- García & Kallman (2010) García, J., & Kallman, T. R. 2010, ApJ, 718, 695
- García, Kallman & Mushotzky (2011) García, J., Kallman, T. R., & Mushotzky, R. F. 2011, ApJ, 731, 131
- García et al. (2009) García, J., Kallman, T. R., Witthoeft, M. C., Behar, E., Mendoza, C., Palmeri, P., Quinet, P., Bautista, M. A., & Klapisch, M. 2009, ApJS, 185, 477
- García et al. (2005) García, J., Mendoza, C., Bautista, M. A., Gorczyka, T. W., Kallman, T. R., & Palmeri, P. 2005, ApJS, 158, 68
- Gorczyka et al. (2013) Gorczyka, T. W., Bautista, M. A., Hasoglu, M. F., García, J., Gatuzz, E. Kaastra, J. S., Kallman, T. R., Manson, S. T., Mendoza, C., Raassen, A. J. J., de Vries, C. P., & Zatsarinny, O. 2013, ApJ, 779, 78
- Grant (1988) Grant, I. P. 1988, Meth. Comput. Chem., 2, 1
- Grant (2007) Grant, I. P. 2007, Relativistic Quantum Theory of Atoms and Molecules (Springer-Verlag, New York)
- Grant et al. (1980) Grant, I. P., McKenzie, B. J., Norrington, P. H., Mayers, D. F., & Pyper, N. C. 1980, Comput. Phys. Commun., 21, 207
- Guainazzi & Tashiro (2018) Guainazzi, M., & Tashiro, M. S. 2018, arXiv e-prints, arXiv:1807.06903
- Hasoglu et al. (2014) Hasoglu, M. F., Abdel-Naby, S. A., Gatuzz, E., García, J., Kallman, T. R., Mendoza, C., & Gorczyka, T. W. 2014, ApJS, 214, 8
- Jiang et al. (2019) Jiang, J., Fabian, A. C., Wang, J., Walton, D. J., García J. A., Parker, M. L., Steiner, J. F., & Tomsick, J. A. 2019, MNRAS, 484, 1972
- Jiao & Ho (2014) Jiao, L. G., & Ho, Y. K. 2014, J. Quant. Spectrosc. Radiat. Transf., 144, 27
- Kaastra et al. (1996) Kaastra, J. S., Mewe, R., & Nieuwenhuijzen, H. 1996, in UV and X-ray Spectroscopy of Astrophysical and Laboratory Plasmas, ed. K. Yamashita & T. Watanabe, 411
- Kallman & Bautista (2001) Kallman, T. R., & Bautista, M. A. 2001, ApJS, 133, 221
- Kallman et al. (2004) Kallman, T. R., Palmeri, P., Bautista, M. A., Mendoza, C., & Krolik, J. H. 2004, ApJS, 155, 675
- Kar & Ho (2004) Kar, S., & Ho, Y. K. 2004, Phys. Rev. E, 70, 066411
- Kar & Ho (2005) Kar, S., & Ho, Y. K. 2005, New. J. Phys., 7, 141
- Kramida et al. (2018) Kramida, A., Ralchenko, Yu., Reader, J. and NIST ASD Team 2018, NIST Atomic Spectra Database (version 5.6.1). Available: http://physics.nist.gov/asd [2019, February 1]. National Institute of Standards and Technology, Gaithersburg, MD
- Krolik (1999) Krolik, J. H. 1999, Active Galactic Nuclei from the Central Black Hole to the Galactic Environment (Princeton Univ. Press, Princeton)
- Landi et al. (2012) Landi, E., Del Zanna, G., Young, P. R., Dere, K. P., & Mason, H. E. 2012, ApJ, 744, 99
- McKenzie et al. (1980) McKenzie, B. J., Grant, I. P., & Norrington, P. H. 1980, Comput. Phys. Commun., 21, 233
- Mendoza et al. (2017) Mendoza C., Bautista M. A., Palmeri P., Quinet P., Witthoeft M. C., & Kallman T. R., 2017, A&A, 604, A63
- Mendoza et al. (2018) Mendoza C., Bautista M. A., Palmeri P., Quinet P., Witthoeft M. C., & Kallman T. R., 2018, A&A, 616, A62
- Mendoza et al. (2004) Mendoza, C., Kallman, T. R., Bautista, M. A., & Palmeri, P. 2004, A&A, 414, 377
- Nandra et al. (2013) Nandra, K., Barret, D., Barcons, X., et al. 2013, arXiv e-prints, arXiv:1306.2307
- Netzer (1996) Netzer, H. 1996, ApJ, 473, 781
- Palmeri et al. (2002) Palmeri, P., Mendoza, C., Kallman, T. R., & Bautista, M. A. 2002, ApJ, 577, L119
- Palmeri et al. (2003a) Palmeri, P., Mendoza, C., Kallman, T. R., & Bautista, M. A. 2003a, A&A, 403, 1175
- Palmeri et al. (2003b) Palmeri, P., Mendoza, C., Kallman, T. R., Bautista, M. A., & Meléndez, M. 2003b, A&A, 410, 359
- Palmeri et al. (2008) Palmeri, P., Quinet, P., Mendoza, C., Bautista, M. A., García, J., & Kallman, T. R. 2008, ApJS, 177, 408
- Palmeri et al. (2011) Palmeri, P., Quinet, P., Mendoza, C., Bautista, M. A., García, J., Witthoeft, M. C., & Kallman, T. R. 2011, A&A, 525, A59
- Palmeri et al. (2012) Palmeri P., Quinet P., Mendoza C., Bautista M. A., García J., Witthoeft M. C., & Kallman T. R., 2012, A&A, 543, A44
- Palmeri et al. (2016) Palmeri P., Quinet P., Mendoza C., Bautista M. A., Witthoeft M. C., & Kallman T. R., 2016, A&A, 589, A137
- Parpia et al. (1996) Parpia, F. A., Fischer, C. F., & Grant, I. P. 1996, Comput. Phys. Commun., 94, 249
- Piel (2010) Piel, A. 2010, Plasma Physics. An Introduction to Laboratory, Space and Fusion Plasmas (Springer Verlag, Berlin-Heidelberg)
- Reis & Miller (2013) Reis, R. C., & Miller, J. M. 2013, ApJ, 769, L7
- Reynolds (2013) Reynolds, C. S. 2013, Class. Quantum Grav., 30, 244004
- Reynolds & Nowak (2003) Reynolds, C. S., & Nowak, M. A. 2003, Phys. Rep., 377, 389
- Ross & Fabian (2005) Ross, R. R., & Fabian, A. C. 2005, MNRAS, 358, 211
- Saha & Fritzsche (2006) Saha, B., & Fritzsche, S. 2006, Phys. Rev. E, 73, 036405
- Schnittman et al. (2013) Schnittman, J. D., Krolik, J. H., & Noble, S. C. 2013, ApJ, 769, 156
- Smith & Brickhouse (2014) Smith, R. K., & Brickhouse, N. S. 2014, Adv. At. Mol. Opt. Phys., 63, 271
- Tashiro et al. (2018) Tashiro, M., Maejima, H., Toda, K., et al. 2018, SPIE Conf. Ser., 10699, 1069922
- Tomsick et al. (2018) Tomsick, J. A., Parker, M. L, García, J. A., Yamaoka, K., Barret, D., Chiu, J.-L., Clavel, M., Fabian, A., Fürst, F., Gandhi, P., Grinberg, V., Miller, J. M., Pottschmidt, K., & Walton, D. J. 2018, ApJ, 855, 3
- Winkler (1996) Winkler, P. 1996, Phys. Rev. E, 53, 5517
- Witthoeft et al. (2009) Witthoeft, M. C., Bautista, M. A., Mendoza, C., Kallman, T. R., Palmeri, P., & Quinet, P. 2009, ApJS, 182, 127
- Witthoeft et al. (2011) Witthoeft, M. C., García, J., Kallman, T. R., Bautista, M. A., Mendoza, C., Palmeri, P., & Quinet, P. 2011, ApJS, 192, 7
- Xie et al. (2012) Xie, L. Y., Wang, J. G., Janev, R. K., Qu, Y. Z., & Dong, C. Z. 2012, Eur. Phys. J. D, 66, 125
| Transition | Wavelength (Å) | Transition probability (s-1) | |||||
|---|---|---|---|---|---|---|---|
| = 0.0 | = 0.1 | = 0.25 | = 0.0 | = 0.1 | = 0.25 | ||
| 17 | 1.7244 | 1.7248 | 1.7263 | 1.016E+14 | 1.017E+14 | 1.023E+14 | |
| 17 | 1.9253 | 1.9254 | 1.9260 | 1.131E+13 | 1.130E+13 | 1.127E+13 | |
| 17 | 1.9263 | 1.9264 | 1.9270 | 2.370E+13 | 2.373E+13 | 2.386E+13 | |
| 17 | 1.9265 | 1.9267 | 1.9273 | 2.919E+13 | 2.927E+13 | 2.964E+13 | |
| 17 | 1.9268 | 1.9269 | 1.9275 | 3.225E+14 | 3.223E+14 | 3.211E+14 | |
| 17 | 1.9270 | 1.9271 | 1.9277 | 8.108E+13 | 8.109E+13 | 8.112E+13 | |
| 17 | 1.9272 | 1.9273 | 1.9279 | 2.138E+14 | 2.135E+14 | 2.119E+14 | |
| 17 | 1.9274 | 1.9275 | 1.9281 | 1.108E+14 | 1.107E+14 | 1.103E+14 | |
| 17 | 1.9278 | 1.9279 | 1.9285 | 3.401E+14 | 3.400E+14 | 3.394E+14 | |
| 17 | 1.9280 | 1.9281 | 1.9287 | 2.871E+14 | 2.870E+14 | 2.865E+14 | |
| 17 | 1.9280 | 1.9281 | 1.9287 | 1.505E+14 | 1.504E+14 | 1.497E+14 | |
| 17 | 1.9283 | 1.9284 | 1.9290 | 3.090E+14 | 3.088E+14 | 3.079E+14 | |
| 17 | 1.9284 | 1.9285 | 1.9291 | 1.453E+13 | 1.450E+13 | 1.435E+13 | |
| 17 | 1.9285 | 1.9286 | 1.9292 | 9.717E+13 | 9.718E+13 | 9.724E+13 | |
| 17 | 1.9290 | 1.9291 | 1.9297 | 9.841E+13 | 9.840E+13 | 9.834E+13 | |
| 17 | 1.9293 | 1.9294 | 1.9300 | 2.092E+14 | 2.094E+14 | 2.102E+14 | |
| 17 | 1.9297 | 1.9298 | 1.9304 | 2.434E+13 | 2.439E+13 | 2.461E+13 | |
| 17 | 1.9297 | 1.9298 | 1.9305 | 1.148E+13 | 1.143E+13 | 1.119E+13 | |
| 17 | 1.9302 | 1.9303 | 1.9309 | 3.116E+13 | 3.121E+13 | 3.145E+13 | |
| 17 | 1.9304 | 1.9305 | 1.9311 | 2.896E+14 | 2.896E+14 | 2.899E+14 | |
| 17 | 1.9312 | 1.9313 | 1.9319 | 5.188E+13 | 5.184E+13 | 5.167E+13 | |
| 17 | 1.9313 | 1.9314 | 1.9320 | 1.580E+14 | 1.580E+14 | 1.577E+14 | |
| 17 | 1.9315 | 1.9316 | 1.9322 | 5.507E+13 | 5.510E+13 | 5.523E+13 | |
| 17 | 1.9316 | 1.9317 | 1.9324 | 6.669E+13 | 6.667E+13 | 6.656E+13 | |
| 17 | 1.9319 | 1.9320 | 1.9327 | 1.099E+14 | 1.098E+14 | 1.093E+14 | |
| 17 | 1.9321 | 1.9322 | 1.9328 | 1.042E+14 | 1.042E+14 | 1.038E+14 | |
| 17 | 1.9321 | 1.9322 | 1.9328 | 1.694E+14 | 1.693E+14 | 1.689E+14 | |
| 17 | 1.9322 | 1.9323 | 1.9329 | 7.919E+13 | 7.915E+13 | 7.896E+13 | |
| 17 | 1.9323 | 1.9324 | 1.9331 | 1.014E+14 | 1.013E+14 | 1.010E+14 | |
| 17 | 1.9331 | 1.9332 | 1.9338 | 1.615E+13 | 1.619E+13 | 1.637E+13 | |
| 17 | 1.9380 | 1.9381 | 1.9388 | 4.421E+13 | 4.421E+13 | 4.421E+13 | |
| 17 | 1.9398 | 1.9399 | 1.9406 | 1.056E+13 | 1.051E+13 | 1.029E+13 | |
| 18 | 1.9262 | 1.9263 | 1.9268 | 4.116E+14 | 4.115E+14 | 4.103E+14 | |
| 18 | 1.9301 | 1.9302 | 1.9307 | 2.018E+14 | 2.017E+14 | 2.012E+14 | |
| Level | Auger width (s-1) | |||
|---|---|---|---|---|
| 17 | 7.711E+14 | 7.647E+14 | 7.604E+14 | |
| 17 | 8.135E+14 | 8.069E+14 | 8.027E+14 | |
| 17 | 7.610E+14 | 7.548E+14 | 7.420E+14 | |
| 17 | 7.302E+14 | 7.243E+14 | 7.128E+14 | |
| 17 | 7.154E+14 | 7.097E+14 | 7.069E+14 | |
| 17 | 7.244E+14 | 7.189E+14 | 7.106E+14 | |
| 18 | 1.529E+15 | 1.523E+15 | 1.504E+15 | |
| 19 | 8.058E+14 | 8.016E+14 | 7.951E+14 | |
| 19 | 7.929e+14 | 7.890E+14 | 7.828E+14 | |
| 19 | 7.803E+14 | 7.764E+14 | 7.699E+14 | |
| 19 | 7.512E+14 | 7.484E+14 | 7.427E+14 | |
| 19 | 7.663E+14 | 7.623E+14 | 7.598E+14 | |
| 19 | 1.137E+15 | 1.130E+15 | 1.115E+15 | |