subject
Article\SpecialTopicSPECIAL TOPIC: FAST special issue\Year2019 \MonthMay \Vol62 \No5 \DOIxxx \ArtNo959504 \ReceiveDateDecember 6, 2018 \AcceptDateJanuary 19, 2019
FAST ultra-wideband observation of abnormal emission-shift events of PSR B091906
yzyu@nao.cas.cnpb@nao.cas.cn
Y.-Z. Yu, B. Peng, K. Liu, et al
Y.-Z. Yu, B. Peng, K. Liu, et al
FAST ultra-wideband observation of abnormal emission-shift events of PSR B091906
Abstract
PSR B091906 is known for its abnormal emission phenomenon, where the pulse emission window occasionally shifts progressively in longitude and returns afterwards. The physical mechanism behind this phenomenon is still under investigation. In this paper, we present our ultra-wideband observation of this pulsar using the Five-hundred-meter Aperture Spherical radio Telescope (FAST), with simultaneous measurements in the frequency ranges 280–780 MHz and 1250–1550 MHz. We have identified three abnormal events, each of which becomes less apparent as the frequency decreases. At 1400 MHz, the averaged profile slightly shifted after the first and third abnormal events, implying a relationship between abnormal event and profile variation. We also found a linear trend in the left-edge position of the averaged profiles between the first and third event as well as after the third event, suggesting the existence of a slow-drifting mode between the two major events. The second event has a comparatively small shift in phase and is thus categorized as a “small flare state”. During the third event, a sequence of approximately nine pulses was seen to significantly weaken in all frequency bands, likely associated with the pseudo-nulling observed at 150 MHz. A three-component de-composition analysis of the normal averaged profiles shows that the trailing component is dominant at our observing frequencies, while the centre component has a comparatively steeper spectrum. We found the overall flux density in an abnormal event to slightly differ from that in an ordinary state, and the difference shows a frequency dependence. A comparison of the normal, abnormal and dimmed averaged profile indicates that the leading component is likely to be stable in all states.
keywords:
Pulsar; B091906; Radio95.55.Jz, 95.85.Bh, 97.60.Gb
1 Introduction
Pulsars are rapidly rotating magnetized neutron stars, the radio pulsation signals from which are observed when the radiation beam passes across the observer’s line of sight. The classical phenomena of variations of individual pulses or averaged profiles, e.g. subpulse drifting, where the \Authorfootnote
subpulses periodically drift in longitude in the pulsar emission window [1, 2, 3]; nulling, where the energy of an individual pulse incidentally drops to zero or near zero [4, 5, 6]; and mode changing where the integrated profiles switch between two or more profile forms [7, 8, 6], have been detected in many pulsars. An additional variation phenomenon, in which the individual pulses first shift in longitude toward early phase and then turn backward progressively, was first identified by ref. [9] in PSR B091906 and B185907. Such an abnormal emission event is difficult to categorize within the classical categories, and its physical mechanism is still unknown.
PSR B091906 is a bright pulsar with a rotation period of 0.4306 s [10] and a dispersion measure of 27.2986 pc [11]. Its averaged profile is significantly asymmetric in the frequency range from 61 to 1400 MHz with a long weak leading component and a bright trailing component. An additional central component can be detected clearly within the frequency range 300–500 MHz (according to the profiles in ref. [9, 13, 12]). The abnormal emission events of PSR B091906 were first discovered by ref. [9] using the Arecibo 305-m telescope at 327 and 1400 MHz. In such an abnormal event, the trailing subpulses occasionally shift progressively in longitude toward early phase and return later. Unlike the observations at 1400 MHz, the abnormal event is hardly discernible in the total intensity at 327 MHz, but it can still be identified by linear/circular polarization or from the rotation of the polarization angle. The abnormal events of PSR B091906 were also identified in observations by ref. [14] using the Lovell 76-m telescope at 1400 MHz. In addition to events that were termed “main flare states”, they also found “small flare states”, wherein pulses shift only by about . Ref. [15] observed PSR B091906 for about 30 h using the Jimusi 66-m telescope at 2250 MHz. They detected 92 abnormal events and classified them into four morphological types, which they called , , and . Ref. [16] searched for periodicity in the abnormal events using datasets from ref. [9], ref. [15], and from additional extensive Arecibo observations. In the Arecibo observations, among 26 abnormal events, they found an approximate period of about 700 pulses, or 300 s, but no indication of periodicity was found in the dataset of ref. [15] with the 96 abnormal events. Ref. [17] observed PSR B091906 by simultaneously using the Effelsberg 100-m telescope at 1350 MHz and the Bornim station of the LOw Frequency ARray (LOFAR) at 150 MHz. They detected seven abnormal events in their 1350 MHz observations, but they observed no emission shift at 150 MHz. Instead, on most occasions the intensity of 10-s sub-integrations at 150 MHz decreased as ‘pseudo-nulling’ when an abnormal event occurred at 1350 MHz. As no significant intensity variation of the sub-integrations was observed at 1350 MHz, they considered that such pseudo-nulling only occurs at a low frequency. There have been no previous observations in the frequency range 327–1350 MHz for the abnormal events of PSR B091906.
In this article, we present our ultra-wideband observation of PSR B091906, covering the frequency ranges 280–780 and 1250–1550 MHz, respectively. The observation is described in section 2. The results are shown in section 3, and discussions are placed in section 4. Finally, a summary is given in section 5.
2 Observation
The Five-hundred-meter Aperture Spherical radio Telescope (FAST) [18, 19] is located at Pingtang, Guizhou Province, China. It was built and is operated by the National Astronomical Observatories, Chinese Academy of Sciences (NAOC). Its construction was completed in September, 2016, and the telescope is currently in the commissioning phase [20]. FAST has total and effective apertures of 500 m and 300 m, respectively. An ultra-wideband receiver covering 270 to 1620 MHz was used between September 2016 and May 2018. The observation presented in this article was obtained on 8th October 2017 (MJD 58034), with a duration of approximately 30 min. The signal collected by the receiver was filtered into two individual bands with frequency range of 270 to 800 MHz and 1200 to 1620 MHz, respectively. Next, we used a digital backend based on Reconfigurable Open Architecture Computing Hardware generation 2 (ROACH 2)111https://casper.berkeley.edu/ to sample each band at the Nyquist rate, yield intensity detections for dual polarisations, and pack the data in PSRFITS [21] search-mode format with 0.2 ms samples and 0.25 MHz frequency channels.
We then processed the data with the DSPSR software [22] to generate single-pulse archives, each with 2048 phase bins. In total, we obtained 3916 single pulses from PSR B091906. Channels containing radio frequency interferences were identified by eye and removed manually. Only the data in the frequency ranges 280–780 and 1250–1550 MHz were used after this step. For each frequency channel and polarisation, we also subtracted the baseline and re-scaled the data by the amplitude of the noise diode from observation of the “clear sky”, which mitigated the amplitude differentials between the two polarisations. Finally, we averaged the data in the frequency domain to improve the signal-to-noise ratio for the detection of single pulses.
3 Result
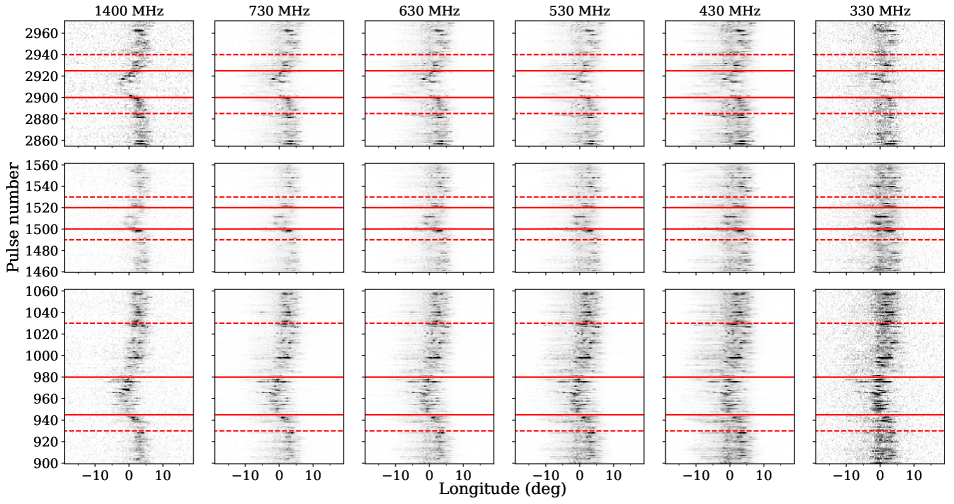
We identified three abnormal events in our observation. fig. 1 shows the individual pulse sequences of these three events in the different frequency bands. To identify the time intervals containing the abnormal events, we first averaged individual pulses from the 1400 MHz observation to produce twenty-period (about 8.6 s) sub-integrations. For each sub-integration, we then measured the phase of the leftmost (earliest) and rightmost (latest) bin that have intensities larger than 50% of the peak ( and , respectively); the width at 50% of the peak is . An example illustrating the measurement of , , and is shown in fig. 2. The values of , , and are plotted in fig. 3. Based on the significant decrease of the values at about pulse numbers 1000, 1500, and 2900, we identified the regions of the three abnormal events where all values are below average. Within the region of each event, we have also highlighted the range where is below 50% of the minimum in that event. Pulses from these ranges are later referred to as “most-shifted” pulses. The first and third events exhibit a shift in longitude up to , while the second event has a maximum shift of only and may fall into the category of “small flare state”, first discussed by ref. [14]. The results of the , , and measurements are summarized in table 1.
| Event | Entire event | Most-shifted |
|---|---|---|
| no. | pulse no. | pulse no. |
| 1 | 930–1030 | 945–980 |
| 2 | 1490–1530 | 1500–1520 |
| 3 | 2885–2940 | 2900–2925 |

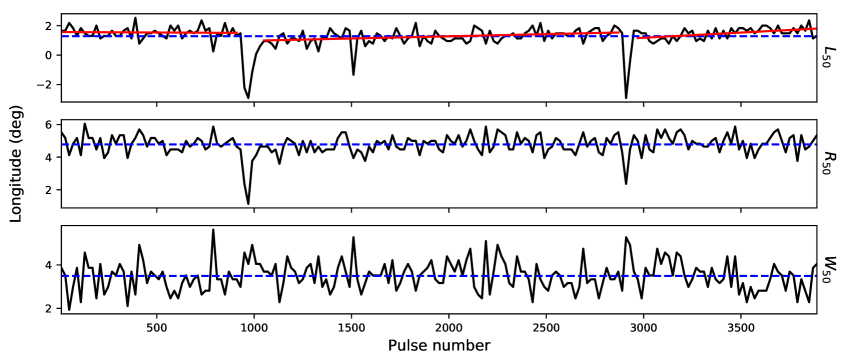
A close observation of the pulse sequence at 1400 MHz in fig. 1 indicates that the left edges of the individual pulses after the first abnormal event are still slightly offset from the previous level before the event. The same phenomenon was noted before and after the third event as well. This observation is supported by the measured values for the sub-integrations shown in fig. 3, where the percentage of measurements above average drops from 85% to 35% and from 80% to 35%, after the first and the third event, respectively. The value of exhibits an increase in time, both from the end of the first event until the beginning the third event and from the end of the third event onwards. As shown in fig. 3, linear fits to the values in these two intervals verify the significance of both trends. This suggests the possible existence of a slow-drifting mode between the two major events, where the intensity shift is much more rapid. Further observations with more detections of abnormal events will be required to confirm this finding.
In all three cases, the abnormal event becomes less apparent as the observing frequency decreases. Such a frequency dependence of the abnormal events is in line with the expectation of ref. [9], who found that the abnormal event is difficult to identify in the total-intensity pulse sequence at low frequency. A similar phenomenon has also been witnessed by ref. [17]. However, it is noteworthy that during the third abnormal event, there are approximately nine individual pulses (pulse numbers 2902 to 2910) that appear to be dimmer than the others (see the upper panels in fig. 1). Herein, shifted sub-pulses are barely visible in any frequency band, although a weak but broad component can been seen in the 430 to 730 MHz bands that does not exhibit an apparent shift in time.
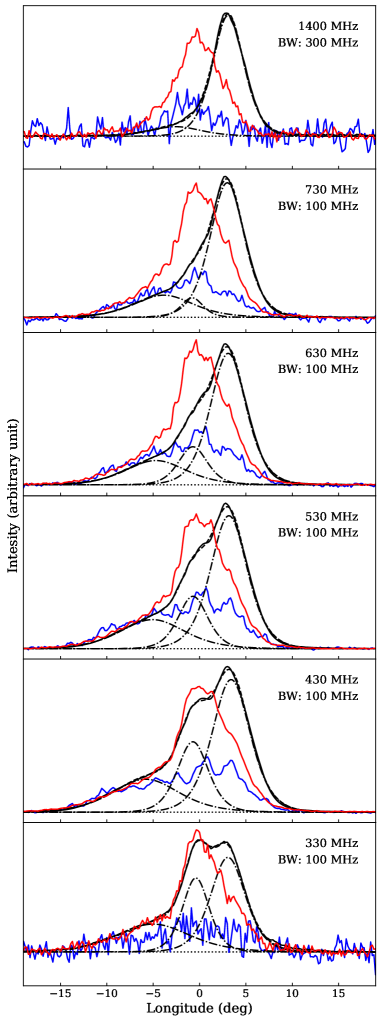
The averaged profiles of normal, abnormal (most-shifted pulses only) and dimmed pulses in different frequency bands are shown in fig. 4. At 1400 MHz and 330 MHz, the normal and abnormal averaged profiles are consistent with those obtained by ref. [9]. For the normal averaged profiles, the intensity of the centre component (peaked around longitude) seems to drop significantly relative to the trailing component and is barely detectable at 1400 MHz, suggesting that the centre component has a significantly steeper spectrum than other components. The overall trend also indicates that the main peak and the plateau at the trailing side of the averaged profile observed in ref. [17] at 150 MHz correspond to the centre and the trailing component seen herein, respectively. To further investigate the variation in frequency, we performed a three-component de-composition of the normal averaged profiles in all frequency bands. We found that the trailing component is dominant across the entire frequency range. The centre component becomes weaker than the leading component at 730 MHz, and it is insignificant in the fit at 1400 MHz.
The abnormal averaged profiles approximately peak at the longitude of the centre component, and they exhibit less apparent variation across the frequency bands. Compared with the flux densities of the normal averaged profile at the same frequency, their flux densities in general are at the same level, but they are slightly stronger at 1400 MHz and become relatively weaker as the frequency decreases. This indicates a small flattening in the overall spectrum during the abnormal event. At 330 and 430 MHz, the overlap of the normal and abnormal profiles at the leading edge, i.e. at negative longitudes, indicates that both the leading and the centre component are unlikely to shift during the abnormal event. The amplitude of the centre component, as indicated from the de-composition, is significantly lower than the peak of the abnormal averaged profile. This means that additional emission occurs at the longitude of the centre component during the abnormal event. All three profiles overlaps around the region of the leading component from 430 MHz to 730 MHz, suggesting that the leading component mostly remains unchanged during the abnormal event. In addition, the profiles at 330 and 430 MHz shows that both the centre and trailing components become weaker during the dimming process.
4 Discussion
The profile parameters (, and ) of the sub-integrations obtained at 1400 MHz evidence the profile variation before and after the abnormal event. We also noticed that the left edges of the pulses after the first abnormal event, as shown in Figure 10 of ref. [14], also arrive at an earlier phase than those before the event. Nevertheless, additional observations of PSR B091906 are required to gather more information about the relationship between the abnormal event and profile variations.
Compared with the pseudo-nulling phenomenon identified in ref. [17], the dimming of pulses seen in our observation has a shorter duration ( s) and occurs over a wide frequency range. On the other hand, the dimmed averaged profile at 330 MHz is similar to that at 150 MHz in their work. Given the fact that the observations in ref. [17] have a limited time resolution (10 s), it is still possible that our dimmed pulses are in fact the same phenomenon. This, however, needs to be investigated with further observations.
A number of possible origins of the abnormal events of PSR B091906 have been proposed. Ref. [9] suggested that the abnormal event may be an extreme example of variable absorption within the pulsar magnetosphere or that it may be due to intrinsic changes of the emission region in the pulsar beam. Ref. [17] claimed support for the absorption model, although they noted that the absorption needs to have frequency-dependent efficiency to explain the pseudo-nulling phenomenon that only occurs at 150 MHz. However, since we have found that the pseudo-nulling phenomenon occurs over a wide frequency range, there is no longer a need for proving such a dependence. The abnormal event could also be caused by intrinsic relocations of the emission spots within the pulsar beam. Ref. [23] applied their differentially co-rotating magnetosphere model to the abnormal events of PSR B091906, and were able to reproduce the emission shift at 1400 MHz. If the emission spots move both along and away from the line of sight, we might also observe the wide-band pseudo-nulling inside an abnormal event. Due to the discovery of a possible quasi-periodicity of the abnormal event in the Arecibo observations, ref. [16] and ref. [24] suggested that the abnormal event may be caused by a ’companion’ moving around the pulsar in a highly eccentric orbit. However, as no apparent emission shift of the leading or centre component has been observed in our data and because the pulse profile exhibits consistent polarization angle behavior between the normal and abnormal state, as shown and discussed in ref. [9] and ref. [15], the abnormal event is unlikely to be associated with a binary system.
5 Summary
We have presented ultra-wideband observation of PSR B091906 using FAST, with simultaneous measurements in the frequency ranges 280–780 and 1250–1550 MHz. We identified three abnormal events in our observation which contains 3916 individual pulses. The averaged profile at 1400 MHz shifts slightly after the first and the third abnormal event, indicating a relationship between the abnormal event and profile changing. We also found a linear trend in the position of the left edge of the averaged profile both between the first and third event and after the third, indicating the possible existence of a slow-drifting mode between these two major events. The second event has a smaller pulse-phase shift and is thus likely to be categorized as a “small flare state”. In the third event, a sequence of approximately nine pulses was seen to become significantly dimmer in all frequency bands, which later has been associated with the pseudo-nulling observed at 150 MHz.
A three-component de-composition of the normal averaged profile shows that the trailing component is dominant across our observing frequencies, while the centre component has a comparatively steeper spectrum and fades away at 1400 MHz. During the abnormal event, the overall flux density generally remains the same relative to that of the normal state but shows slight variations at different frequencies. A comparison of the normal, abnormal, and dimmed averaged profiles indicates that the leading component is likely to remain mostly unchanged during the abnormal event.
This work made use of the data from the FAST telescope (Five-hundred-meter Aperture Spherical radio Telescope). FAST is a Chinese national mega-science facility, built and operated by the National Astronomical Observatories, Chinese Academy of Sciences. This work is supported by the National Natural Science Foundation of China (No. 11673031, No. 11703048 and U1731238), and the Open Project Program of the Key Laboratory of FAST, NAOC. KL acknowledges the financial support by the European Research Council for the ERC Synergy Grant BlackHoleCam under contract no. 610058, the FAST FELLOWSHIP from Special Funding for Advanced Users, budgeted and administrated by Center for Astronomical Mega-Science, Chinese Academy of Sciences (CAMS), and the MPG-CAS Joint Project “Low-Frequency Gravitational Wave Astronomy and Gravitational Physics in Space”.
References
- [1] D. C. Backer, Nature. 227, 692 (1970)
- [2] P. Weltevrede, R. T. Edwards, and B. W. Stappers, A&A. 445, 243 (2006)
- [3] P. Weltevrede, R. T. Edwards, and B. W. Stappers, A&A. 469, 607 (2007)
- [4] D. C. Backer, Nature. 228, 42 (1970)
- [5] J. D. Biggs, ApJ. 394, 574 (1992)
- [6] N. Wang, R. N. Manchester, and S. Johnston, MNRAS. 377, 1383 (2007)
- [7] D. C. Backer, Nature. 228, 1297 (1970)
- [8] N. Bartel, D. Morris, W. Sieber, and T. H. Hankins, ApJ. 258, 776 (1982)
- [9] J. M. Rankin, C. Rodriguez, and G. A. E. Wright, MNRAS. 370, 673 (2006)
- [10] T. V. Shabanova, V. D. Pugachev, and K. A. Lapaev, ApJ. 775, 2 (2013)
- [11] K. Stovall, P. S. Ray, J. Blythe, et al. ApJ. 808, 156 (2015)
- [12] T. H. Hankins, and J. M. Rankin, AJ. 139, 168 (2010)
- [13] S. Johnston, A. Karastergiou, D. Mitra, and Y. Gupta, MNRAS. 388, 261 (2008)
- [14] B. B. P. Perera, B. W. Stappers, P. Weltevrede, A. G. Lyne, and C. G. Bassa, MNRAS. 446, 1380 (2015)
- [15] J. Han, J. L. Han, L.-X. Peng, et al. MNRAS. 456, 3413 (2016)
- [16] H. M. Wahl, D. J. Orfeo, J. M. Rankin, and J. M. Weisberg, MNRAS. 461, 3740 (2016)
- [17] G. Shaifullah, C. Tiburzi, S. Osłowski, et al. MNRAS. 477, L25 (2018)
- [18] B. Peng, R. Nan, Y. Su, et al. Ap&SS. 278, 219 (2001)
- [19] R. Nan, Sci. China-Phys. Mech. and Astron. 49, 129 (2006)
- [20] P. Jiang, Y. Yue, H. Gan, et al. Sci. China-Phys. Mech. and Astron. 62, 959502 (2019)
- [21] A. W. Hotan, W. van Straten, and R. N. Manchester, PASA. 21, 302 (2004)
- [22] W. van Straten, and M. Bailes, PASA. 28, 1 (2011)
- [23] R. Yuen, and D. B. Melrose, MNRAS. 469, 2049 (2017)
- [24] B. P. Gong, Y. P. Li, J. P. Yuan, et al. ApJ. 855, 35 (2018)