reception date \Acceptedacception date \Publishedpublication date
gamma-ray burst: general — galaxies: ISM — dust, extinction
Systematic study for gas-to-dust ratio of short gamma-ray burst afterglows
Abstract
Extra-galactic X-ray absorption and optical extinction are often found in gamma-ray burst (GRB) afterglows and they could be tracers of both circumburst and host galaxy environments. By performing spectral analyses for spectral energy distribution of 9 short GRB (SGRB) afterglows with known redshift, we investigated a ratio of the equivalent hydrogen column density to the dust extinction, , in the rest frame of each SGRB. We found that the distribution of is systematically smaller than the one for long GRBs, and is roughly consistent with the gas-to-dust ratio in the Milky Way. This result means that the measured gas-to-dust ratio of SGRBs would originate from the interstellar medium in each host galaxy. This scenario supports the prediction that SGRBs occur in non star-forming regions in the host galaxies.
1 Introduction
Gamma-ray bursts (GRBs) are grouped in two classes based on their observed duration and spectral hardness of prompt emissions. Long GRBs (LGRBs) and short GRBs (SGRBs) typically have duration of longer and shorter than about 2 s, and relatively softer and harder spectra, respectively (e.g., Kouveliotou et al., 1993; Lien et al., 2016). LGRBs are almost always found in star-forming regions within star-forming galaxies (Bloom et al., 2002; Fruchter et al., 2006; Sevensson et al., 2010), and their progenitors are confirmed as the death of massive stars (e.g., Hjorth et al., 2003; Woosley & Bloom, 2006; Kumar & Zhang, 2015, and references therein). On the other hand, some fraction of SGRBs occur in elliptical galaxies showing no star-formation (Fong et al., 2013; Fong & Berger, 2013). The progenitors of SGRBs are considered to be the coalescence of binary neutron star (NS) and/or black hole (BH)-NS binary (e.g., Eichler et al., 1989; Narayan, Paczynski, & Piran, 1992). In fact, the binary NS merger event, GW 170817, was observed through the gravitational waves by the LIGO and Virgo collaboration, which accompanied the SGRB candidate, GRB 170817A, (Abbott et al., 2017; Goldstein et al., 2017; Savchenko et al., 2017). Since the binary system should move away from their birth cite until its merging by natal kicks in the compact binary merger scenario (e.g., Narayan, Paczynski, & Piran, 1992; Bloom et al., 1999; Fryer et al., 1999; Belczynski et al., 2006), SGRBs may occur in non star-forming regions inside of host galaxies or outside of that. Therefore to investigate the surrounding environment of SGRBs and compare it with that of LGRBs are crucial way to interpret the SGRBs’ progenitors.
To study the spectral energy distributions (SEDs) of GRB afterglows is the major approach to interpret surrounding environments of GRBs. GRB afterglows are thought to originate from relativistically expanding jets that form shocks between the jet and the surrounding medium (e.g., Rees & Mészáros, 1992, 1998), and their SEDs in the optical to X-ray band can be described by a single or broken power-law function (Sari, Piran, & Narayan, 1998; Granot & Sari, 2002). Performing the spectral analysis for them, we can study extinction curves following SEDs and measure the amounts of X-ray absorption and optical extinction in the host galaxy, which are usually defined as an equivalent hydrogen column density () under the assumption of the solar abundance and an extinction in V band (), respectively. The extinction curve shows the dependence of dust attenuation on wavelength, which originates from the dust size and their chemical properties and are different for galaxies, e.g., the Milky Way (MW), the Large Magellanic Cloud (LMC) and the Small Magellanic Cloud (SMC), (e.g., Pei, 1992). The ratios, called gas-to-dust ratio111This is sometimes called metal-to-dust ratio, especially when the equivalent hydrogen column density is derived from the X-ray absorption, because the dominant X-ray absorbers are strictly metallic elements., reflect the properties of the interstellar medium (ISM) in the galaxies and is considered to vary with galaxies, e.g. the MW, LMC and SMC (Welty et al., 2012).
According to previous studies for afterglows of LGRBs (e.g., Schady et al., 2007, 2010; Covino et al., 2013), in the optical and near infrared (NIR) band, the extinction curve of the SMC well fits to SEDs of observation data rather than the one of the MW or LMC in almost all events. However, in the rest frame of each GRB, the ratio of hydrogen equivalent column density measured in X-ray band to the dust extinction measured in optical/NIR band () is significantly larger than the ones in the SMC as well as the MW and LMC. The dust destruction caused by the intense GRB emission is discussed as an major interpretation of the large , but its observational evidence has been not found (Waxman & Draine, 2000; Galama & Wijers, 2001; Savaglio et al., 2003; Schady et al., 2010). Schady et al. (2010) reports the possibility that the ratio of LGRBs in low-metallicity galaxies is large. On the other hand, Zafar et al. (2011) investigated the ratio including metallicity of each LGRB in detail, but they concluded that only the metallicity can not explain the observed high ratio. Until now, a unified picture to explain such a large ratio has not been established.
In this paper, we systematically performed SED fitting for 9 SGRBs with known redshifts using both X-ray and optical/NIR afterglow data, and investigated the ratio of equivalent hydrogen column density to optical extinction of each GRB. Furthermore, we compared these ratio with the results of LGRBs and also typical galaxy environment. The error and upper/lower limits of all fitting parameters are shown at and confidence level, respectively.
2 Data reduction and analysis
We used SGRBs with known redshifts observed by the X-ray Telescope (XRT) on board the Neil Gehrels Swift Observatory (Swift) (Gehrels et al., 2004; Burrows et al., 2005). In addition to obvious SGRBs with sec, we included possible SGRB candidates with sec, which are considered as the SGRB with extended soft X-ray emissions following prompt emissions. Here is the time duration which includes 90% of the observed photon counts except for the first and the last 5% in the GRB emission observed the Swift/BAT. We selected brighter 9 SGRBs, listed in Table 1, whose host galaxies were much dimmer than the optical/NIR afterglows.
Since the spectral parameters of the power-law index and the dust extinction in the SEDs of GRB afterglows are degenerate, we cannot correctly measure the dust extinction in the rest frame of SGRBs with only optical/NIR data, which are limited data points. Therefore, in order to obtain the reliable spectral parameters, we performed the simultaneous spectral analysis for broadband SEDs consist of both optical/NIR and X-ray data, i.e. we estimate the spectral index in optical/NIR band including X-ray data. In Covino et al. (2013), the optical extinctions derived from only optical/NIR data analysis were consistent with those derived from the X-ray prior analysis as we mentioned.
2.1 Optical/NIR data
We gathered available data (not including upper limits) of optical/NIR afterglow observations from the published papers and GCN Circulars222https://gcn.gsfc.nasa.gov/, and converted their magnitude to the flux density. The data we used and the references of them are listed in Table LABEL:tab:opt. Using the database in the NASA/IPAC Infrared Science Archive333https://irsa.ipac.caltech.edu/applications/DUST/ (Schlafly & Finkbeiner, 2011), we converted the observed flux density of each burst to the one before affecting the galactic extinction.
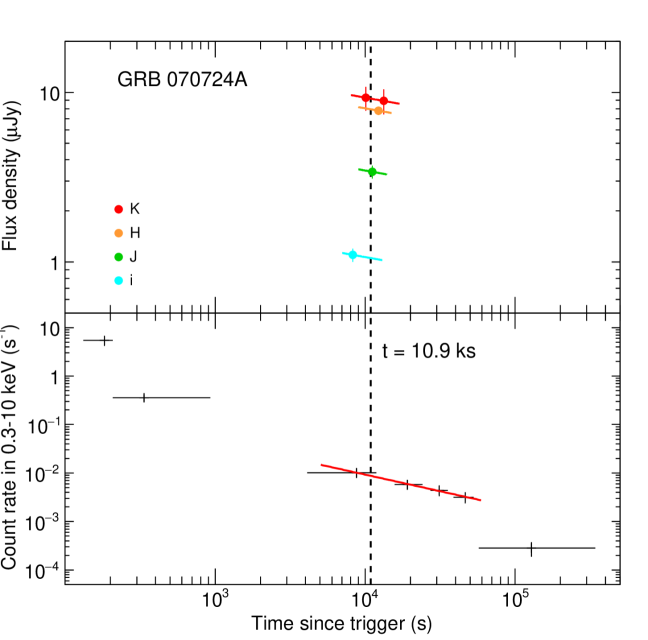
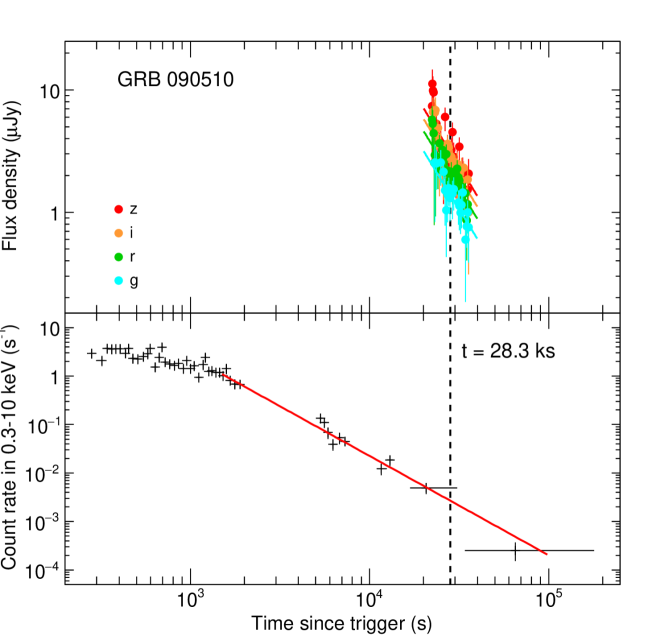
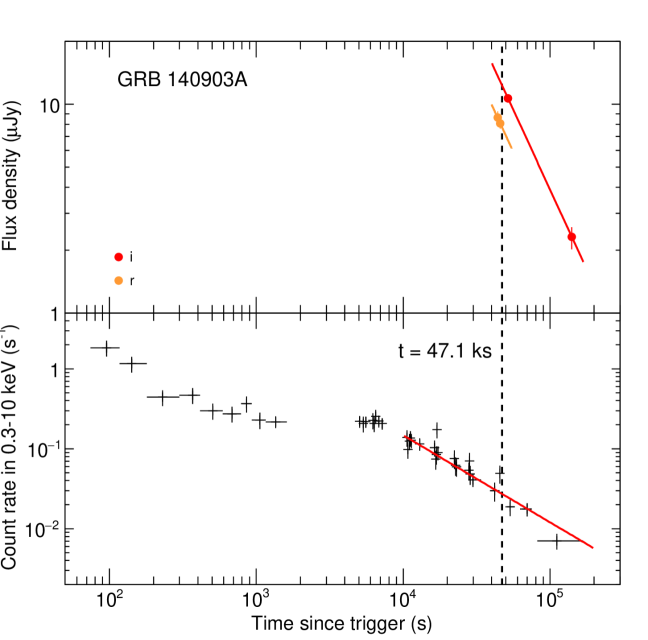
Since the GRB afterglow shows power-law decline in time (Sari, Piran, & Narayan, 1998; Granot & Sari, 2002), it is necessary to collect data at the same time as close as possible in order to create accurate SED. Here, we ignore the time difference among each band data observed almost at the same time (or slightly different time) when the relative uncertainty of the measured flux density () and the observation time () satisfies . Since six of the nine samples satisfied the condition, we used the observation data of that epoch as the SEDs for these events. For the other three samples, GRB 070724A, 090510 and 140903A, we adopted a power-law function of to the observed light curve in the same band, and we estimate the flux density at the time when the interpolation and extrapolation in all bands are minimized. Here, is the trigger time and is the temporal index in optical/NIR band. The time we set for each sample is summarized in Table 1.
2.2 X-ray data
X-ray observation data of SGRBs are taken from UK Swift Science Data Centre444http://www.swift.ac.uk/index.php. The XRT observation is generally performed in two modes, windowed timing (WT) and photon counting (PC) mode. The PC mode data as data of afterglows were used in this analysis, since the extended emission is often observed in the WT mode, whose origin is different from the one of afterglows (e.g., Norris & Bonnell, 2006; Kagawa et al., 2015; Kisaka et al., 2017). The light-curve data were taken from the XRT light curve repository555http://www.swift.ac.uk/xrt_curves/ (Evans et al., 2007, 2009). We extracted a source and background event data from circle region with 20 pixels and 40 in radius (corresponding to 47 and 94 arcsec), respectively, which are recommended ones in the Swift XRT Users Guide Version 1.2666https://swift.gsfc.nasa.gov/analysis/. Using XSELECT software (v2.4)777https://heasarc.gsfc.nasa.gov/docs/software/lheasoft/ftools/xselect/, we extracted spectral data from the cleaned event data. For the spectral analysis, ancillary response files were created by xrtmkarf (v0.6.3) and response matrices were taken from the calibration database files888https://heasarc.gsfc.nasa.gov/docs/heasarc/caldb/swift/.
In Kagawa et al. (2019), they analyzed time-resolved X-ray spectra whose time intervals were divided to each spectrum contains 128 photons, and spectral parameters at each time were obtained. They also analyzed the time averaged spectra with all observation data in PC mode, and confirmed that the photon indices of both results are consistent with each other within the error. Thus we performed time averaged spectral analyses with the entire PC mode data to maximize a signal-to-noise ratio. The time averaged spectra were grouped to 20 counts per energy bin.
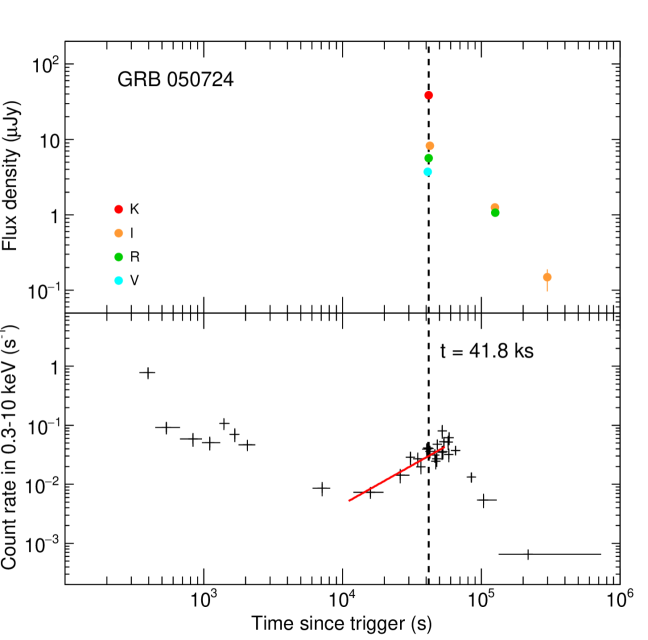
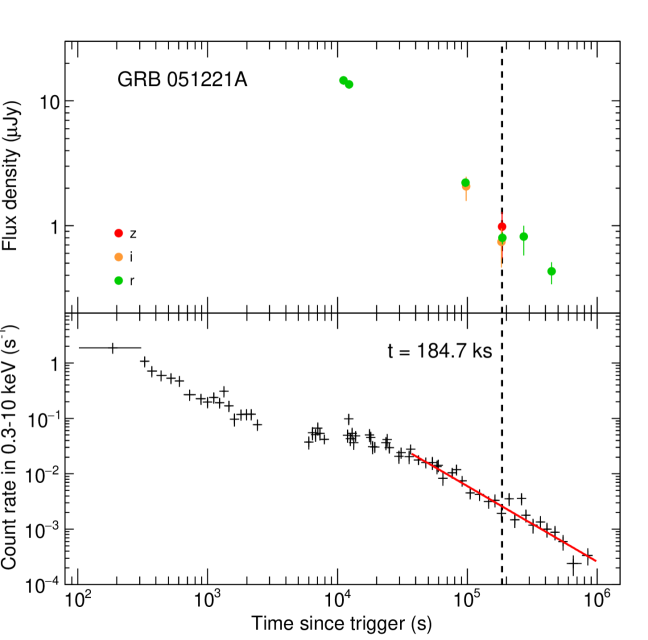
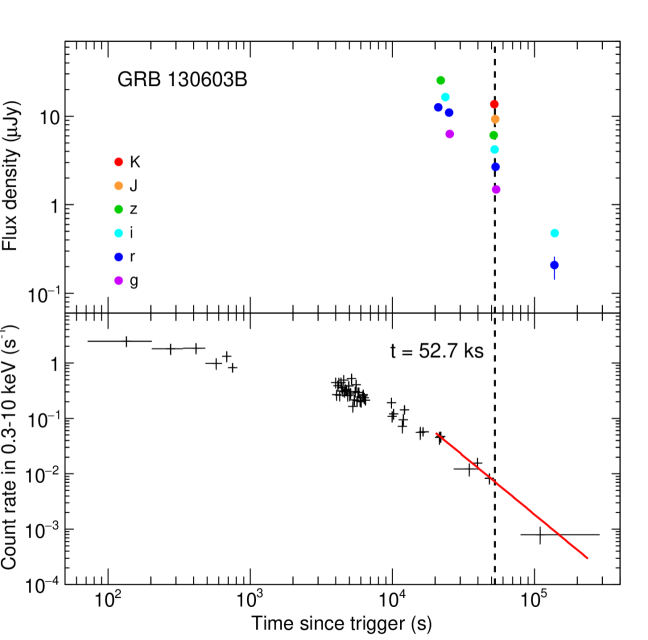
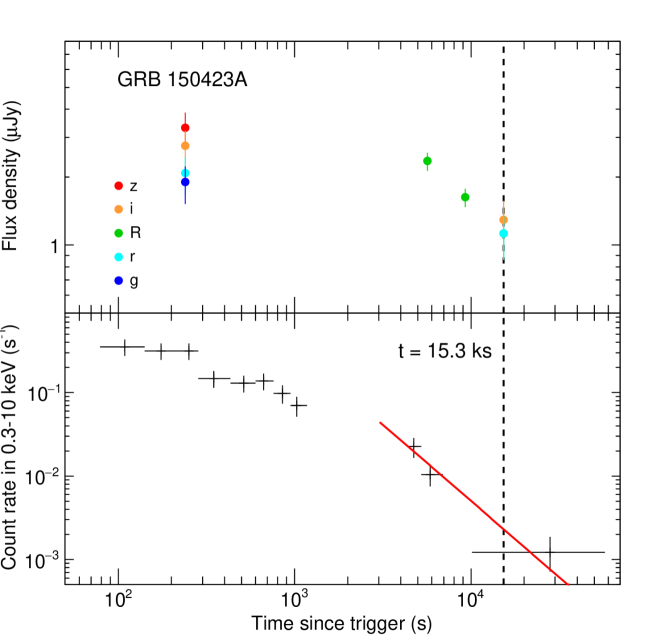
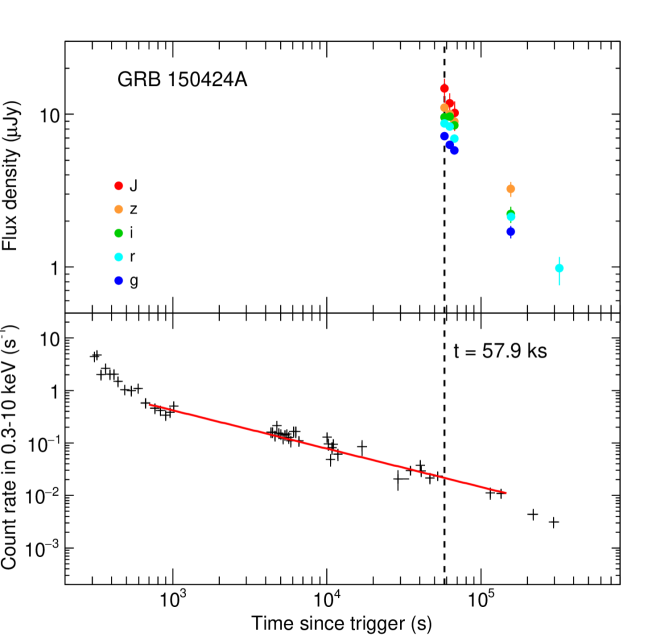
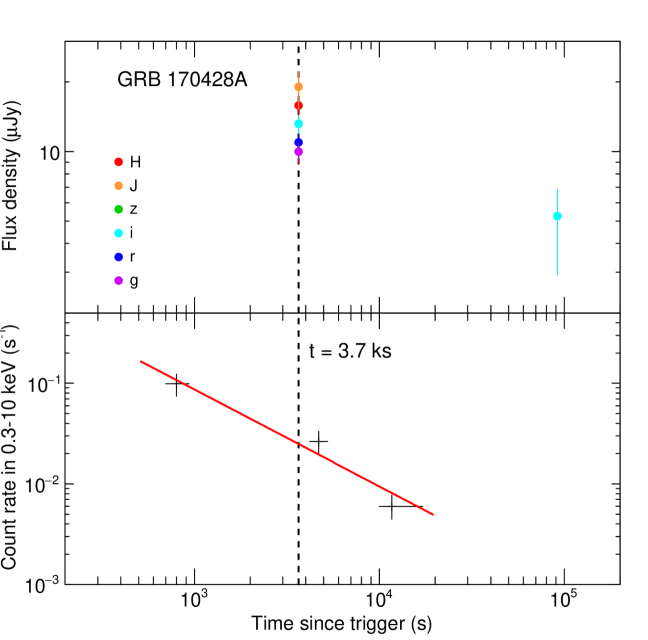
In order to determine the X-ray flux at any given time, we adopted the power-law function with the temporal index of X-ray band () to the X-ray light curves in the same way we did for optical/NIR light curves. Where light curve data were taken from the Swift-XRT lightcurve repository999http://www.swift.ac.uk/xrt_curves/, in which the systematic search of temporal breaks had been performed for light curves (Evans et al., 2007, 2009). Considering their results and excluding the time at the temporal breaks, we defined fitting intervals with simple power-laws. The fitting results are shown in Figure 1 as red solid lines. Using the best-fitting result, we estimated a conversion factor from average flux to the one of focusing time and renormalized the time-averaged X-ray spectra for the broadband SED analysis.
2.3 Spectral analysis
The spectral analysis is carried out with XSPEC software (v12.9.0)101010https://heasarc.gsfc.nasa.gov/xanadu/xspec/ and fit models prepared in there. Based on a standard synchrotron shock model (Sari, Piran, & Narayan, 1998; Granot & Sari, 2002), we adopted a powerlaw model and bknpower model for the broadband SEDs. The X-ray spectral index () is derived from the photon index () of power-law in the relation of . Then we imposed the spectral index of the optical/NIR region, in the powerlaw model and in the bknpower model. The latter case corresponds to the condition where the cooling frequency of the synchrotron emission locates between the optical/NIR and X-ray ranges (Sari, Piran, & Narayan, 1998; Granot & Sari, 2002).
We added phabs and zphabs models corresponding to the photo-electric absorption in our galaxy and host galaxy, respectively. The parameter of the Galactic equivalent hydrogen column density () is fixed to be the amount calculated for the sky coordinates of each SGRB by the database in the UK Swift Science Data Center111111http://www.swift.ac.uk/analysis/nhtot/index.php (Willingale et al., 2013), as shown in Table 1. The equivalent hydrogen column density in the host galaxy () was derived from the model fit where the solar abundances were assumed. We note that the metallicity of the SGRB host galaxies show a wide value, but on the average, it is about a solar abundance (Berger, 2014, and references therein).
To compute the extinctions in the host galaxy, we used the zdust model that considered extinction for wavelength by dust grains as described in Pei (1992). There are major three models of the extinction curves in the MW, LMC and SMC environments. We adopted all three extinction models and investigated the difference of extinction in each model. All results of our spectral analysis are summarized in Table 2, but in the Section 3, we reported the results of using the MW extinction model because there is little difference of the amount of optical extinction among the three models. In fact, the three extinction models are almost the same within the wavelength range of the observation data in the rest frame of 9 SGRBs.
3 Results
Figure 1 shows the optical/NIR and X-ray light curves and the epoch of the broadband SED of each GRB. Although the time when the multi-band observation was performed for GRB 050724 is in the X-ray flare phase, we set this epoch for the broadband SED because it is reported in Berger et al. (2005) (see also Malesani et al., 2007) that the optical/NIR and X-ray emission might belong to the same component. In GRB 150423A, there are two times with multi-band observation data, i.e an early epoch ( s) and a later one ( s). Since the extended emission was observed in the early epoch (Kisaka et al., 2017; Kagawa et al., 2019), we selected the later epoch.
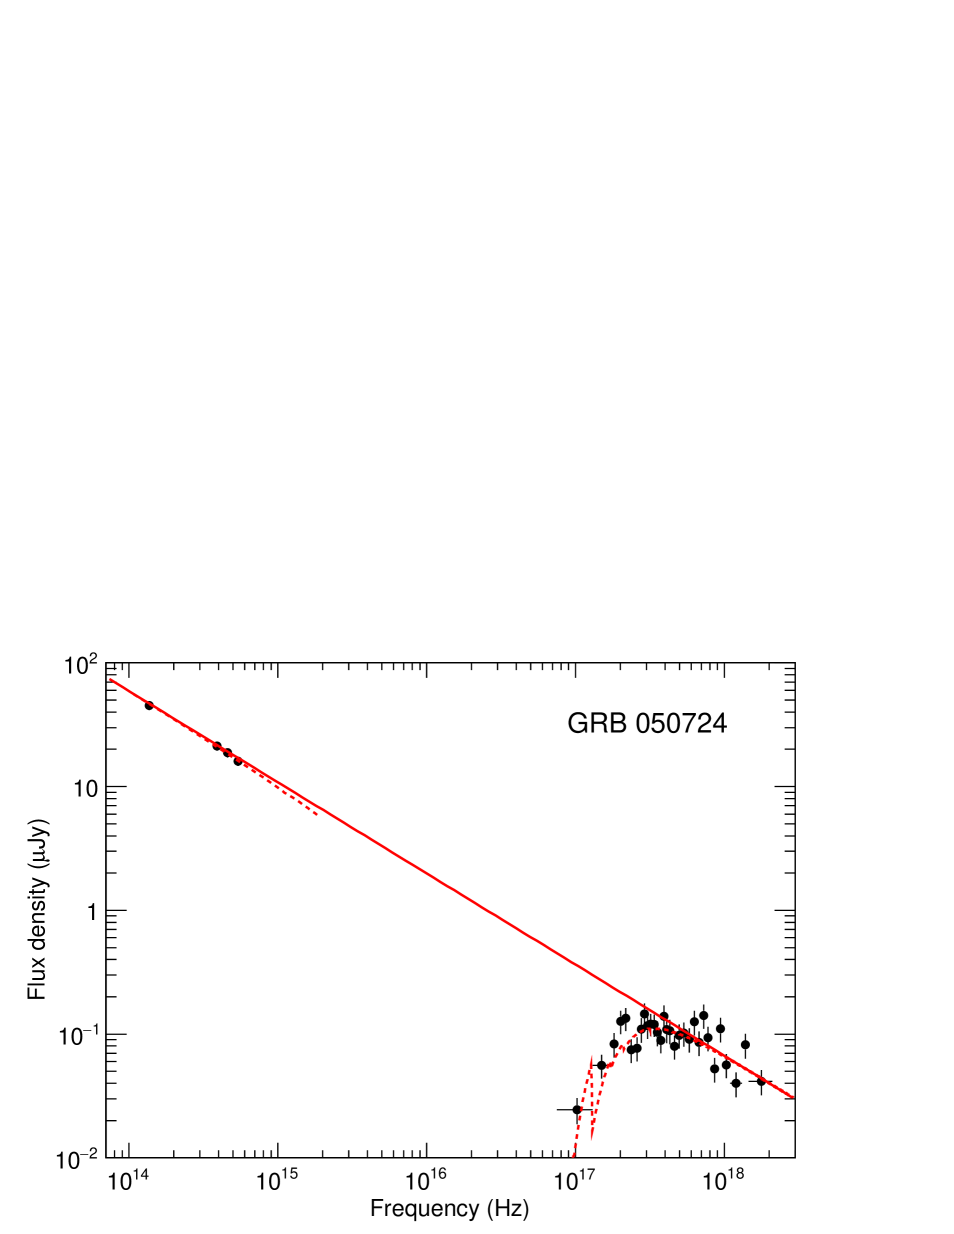
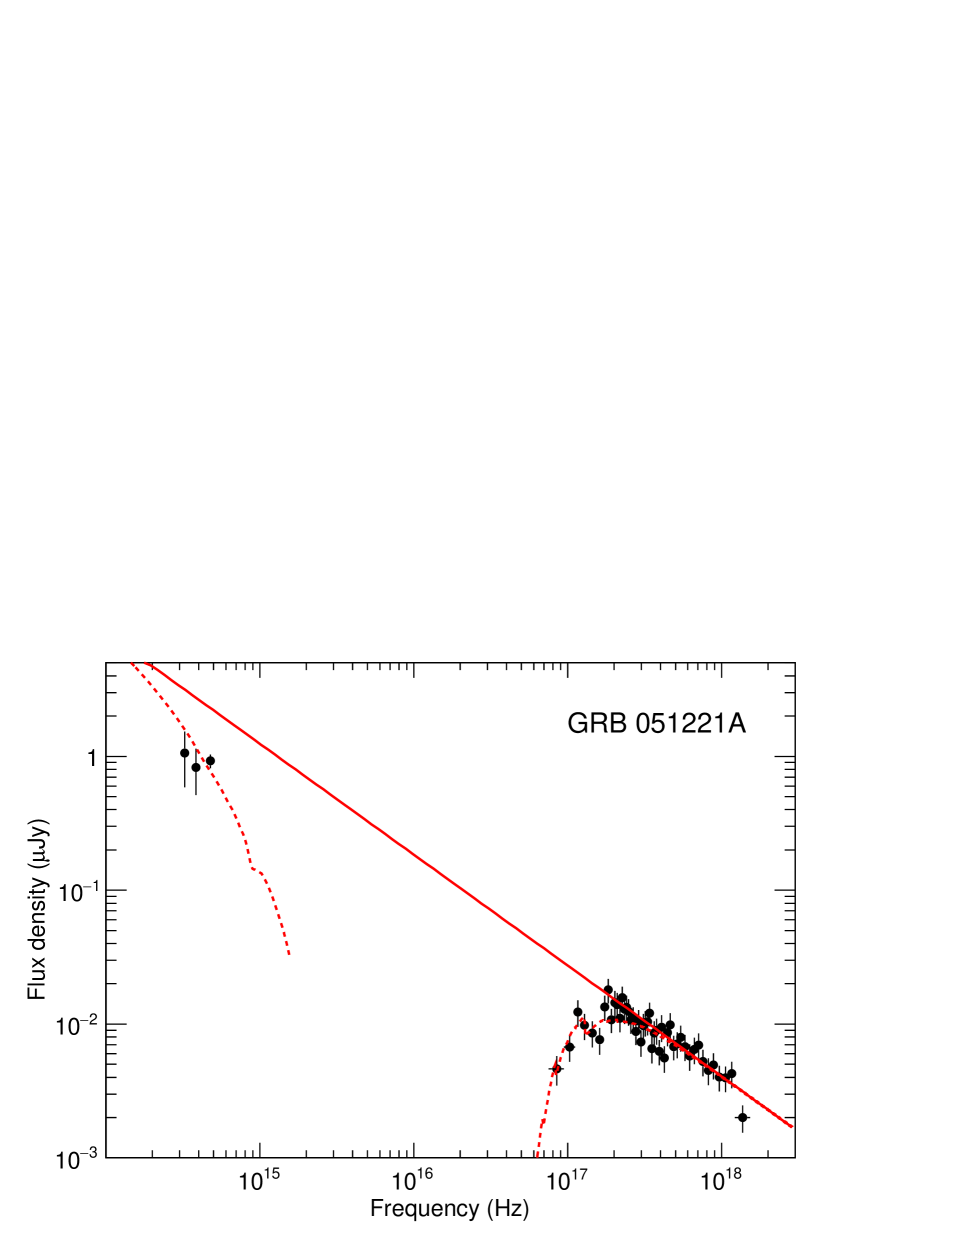
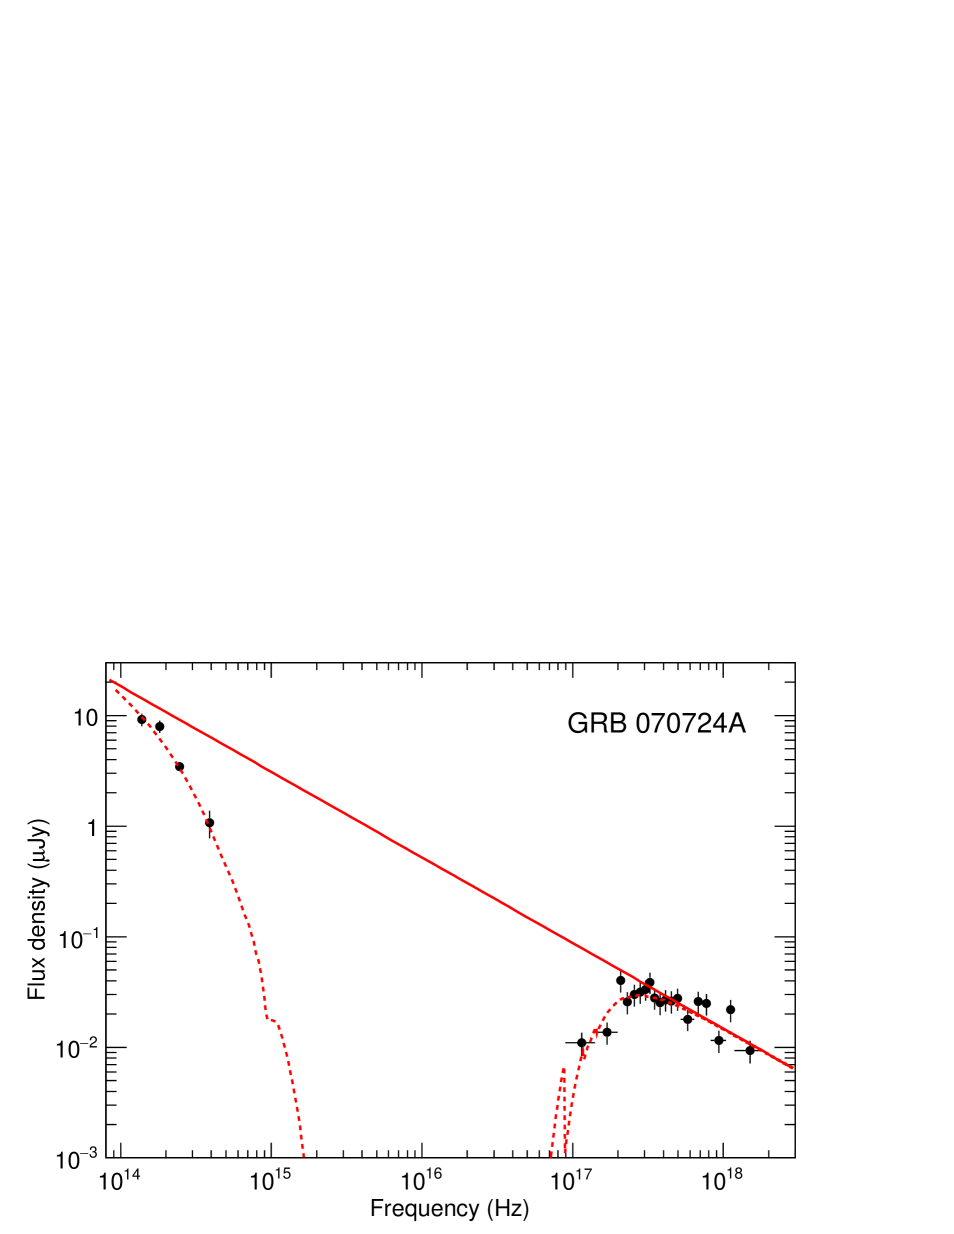
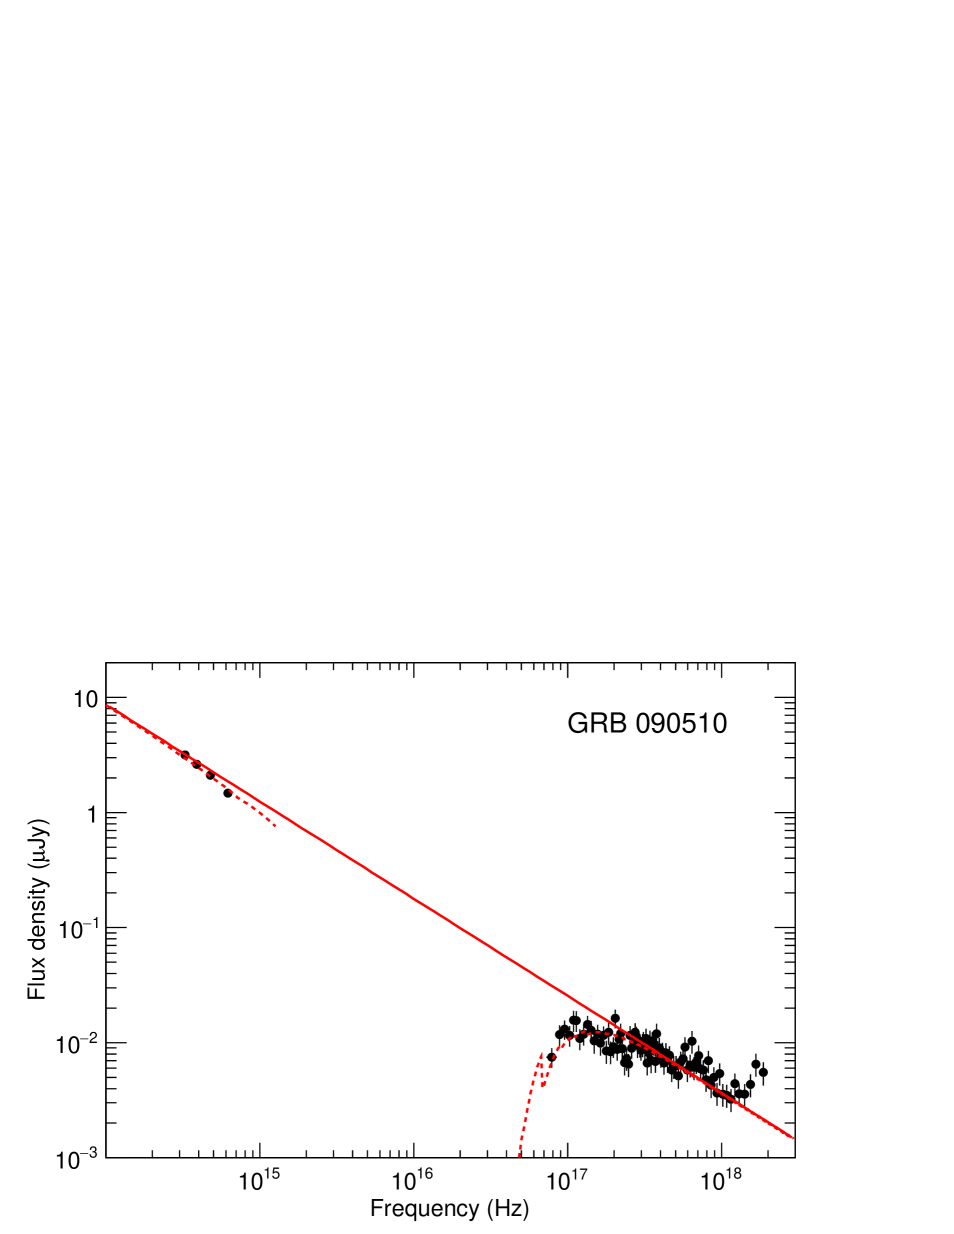
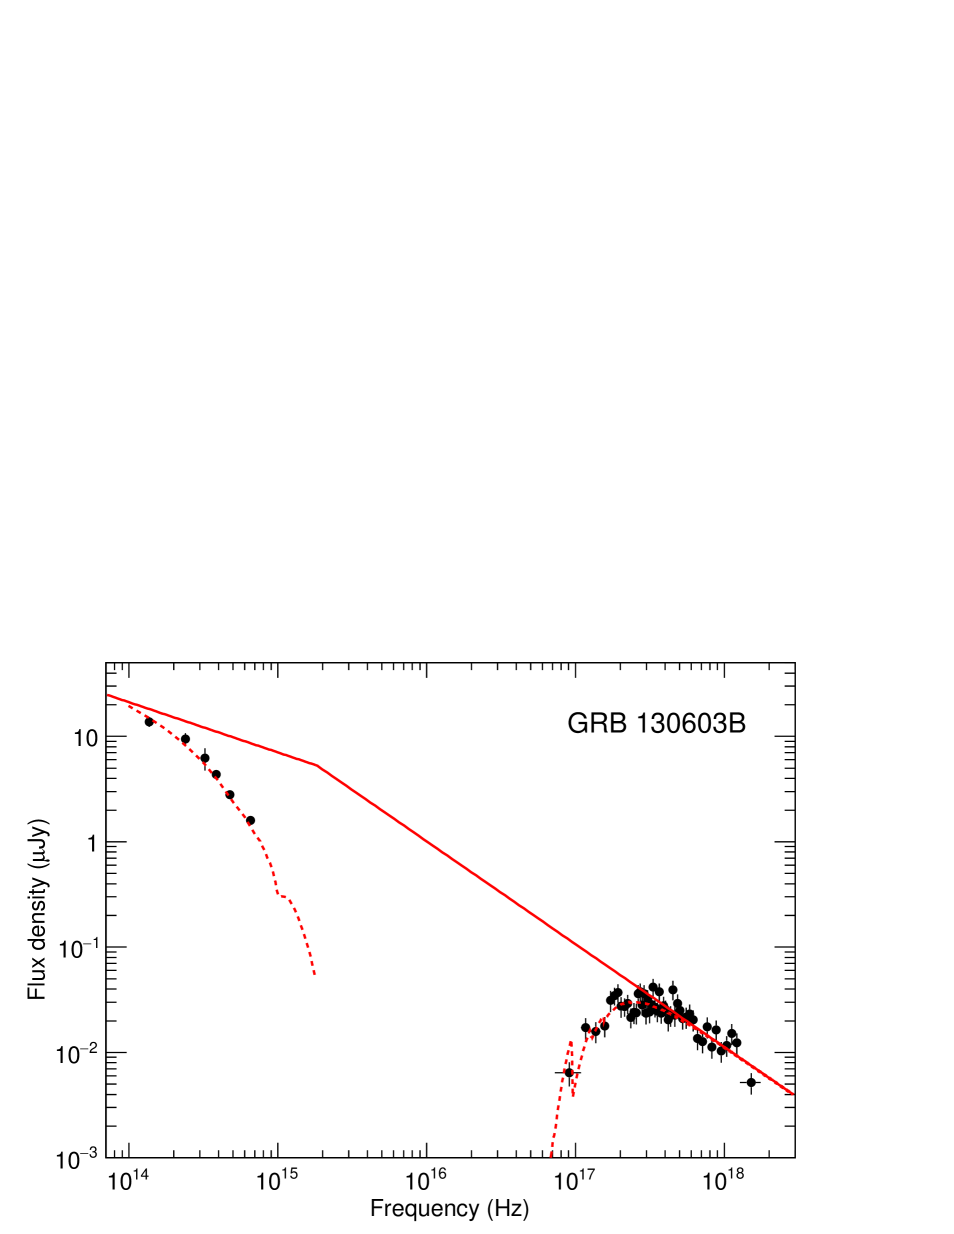
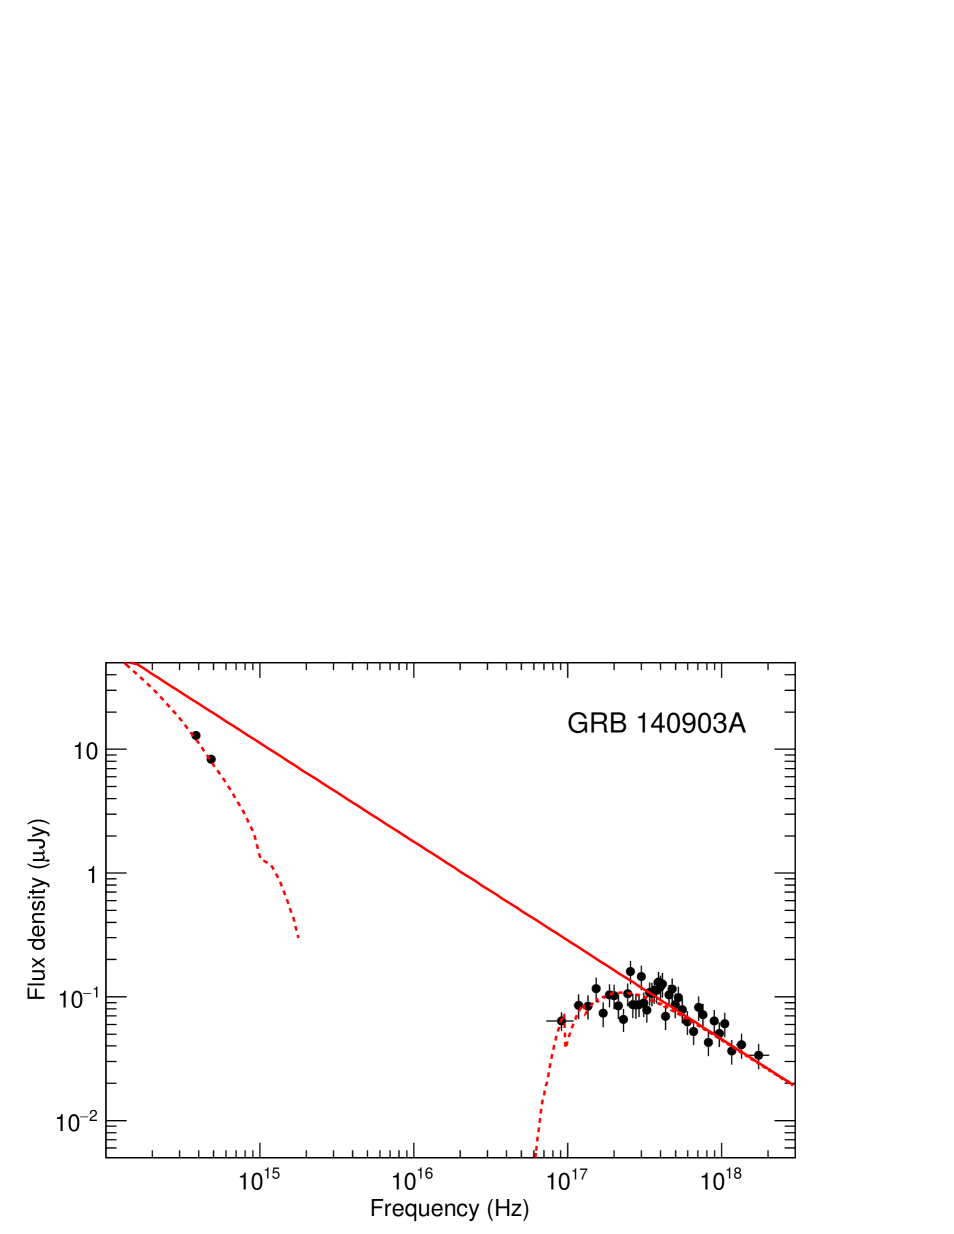
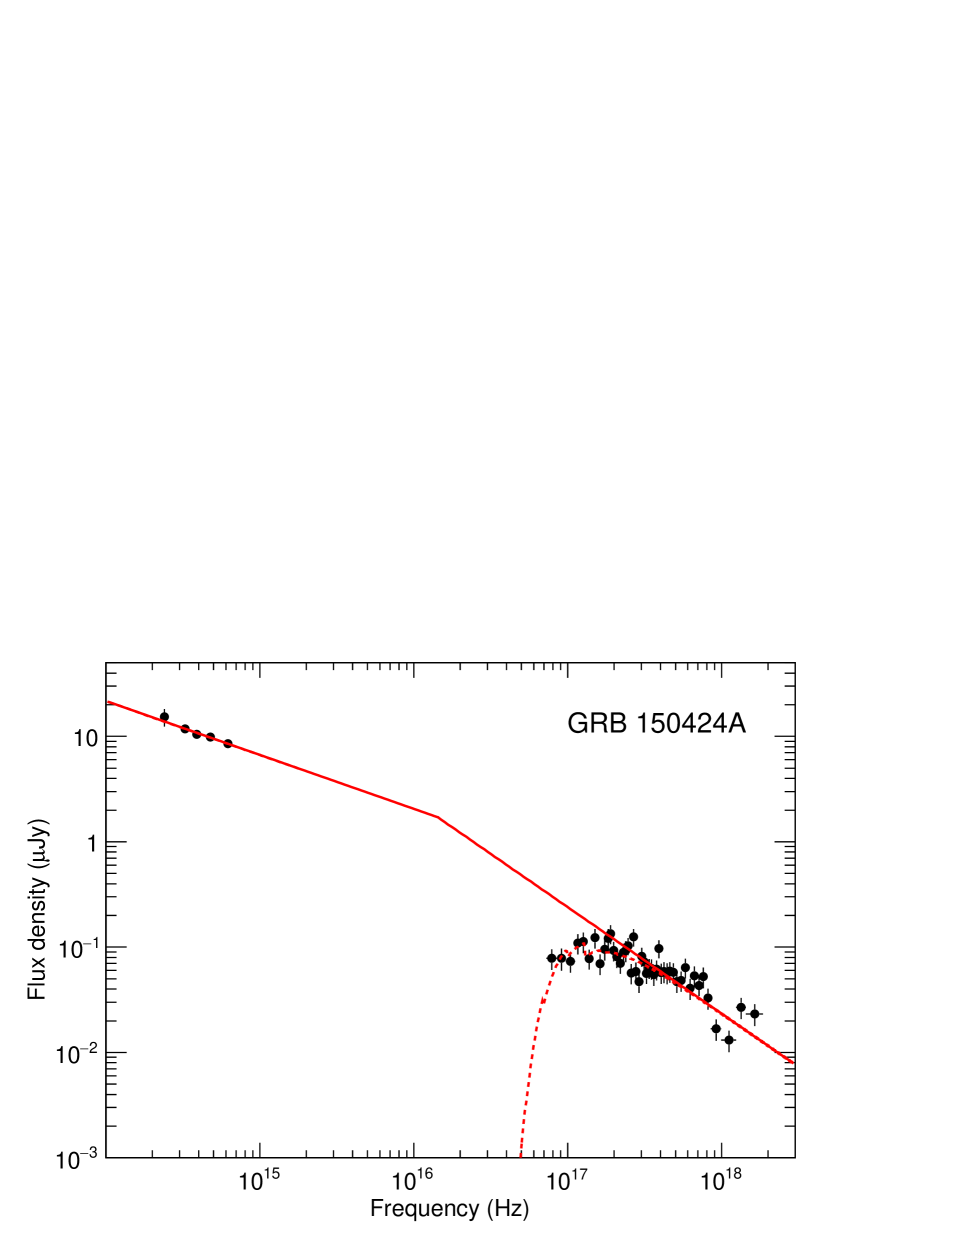
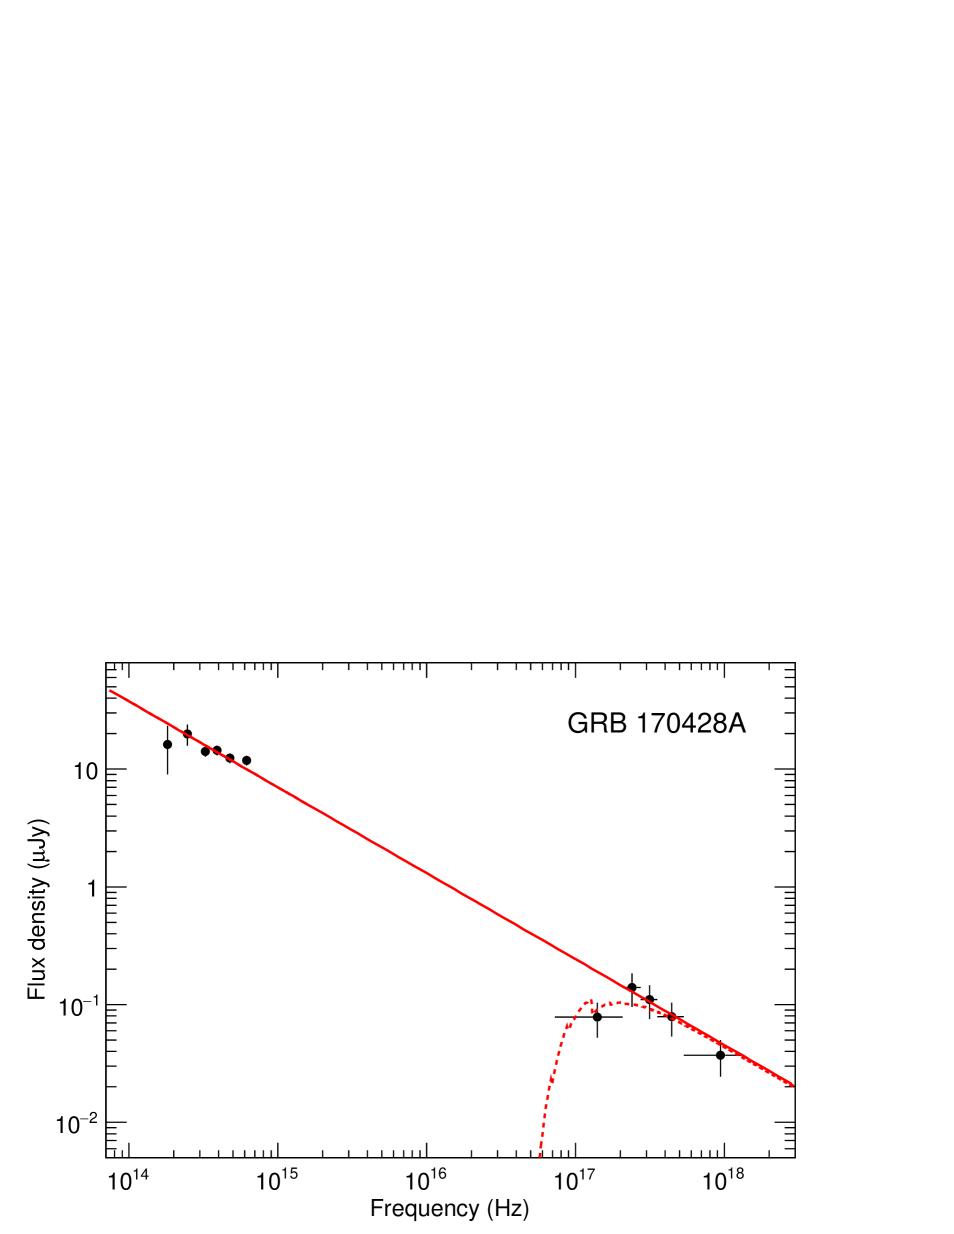
The broadband SEDs with best-fit models are shown in Figure 2 and the results of our spectral analyses are summarized in Table 2 (see also Table LABEL:tab:all). For the SEDs of two SGRBs (GRB 130603B, 150424A), the broken power-law models have better fitting results rather than the single power-law model. These are consistent with the previous studies (de Ugarte Postigo et al., 2014; Knust et al., 2017).
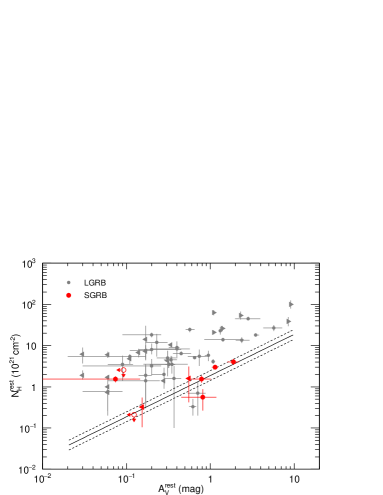
Figure 3 shows a scatter plot between and of SGRBs (this work) and LGRBs (Covino et al., 2013), and the typical gas-to-dust ratio of the MW, cm-2 mag-1 (Welty et al., 2012). As shown in Figure 3, we found that the ratio in the rest frame of SGRBs is systematically smaller than the one of LGRBs, and is roughly consistent with the gas-to-dust ratio in the MW.
4 Discussion
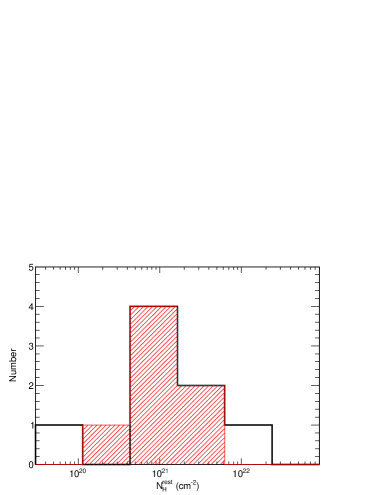
In order to investigate the selection effect on , we analyzed X-ray afterglow spectra of all 20 SGRBs (not including our 9 samples) with known redshift observed by Swift/XRT before the end of 2017, which did not have any near simultaneous optical/NIR data. We performed the spectral analysis for each time-averaged spectrum consists of observation data in PC mode. The sample and the fitting result are listed in Table 3. Figure 4 shows the histograms of the best fit value of for our initial 9 samples and additional 20 samples. We created the cumulative distribution of best fit and applied the Kolmogorov-Smirnov test to it. Then, we found the null hypothesis probability of 0.79 and our 9 samples show the same distribution of the other 20 SGRBs. Therefore we concluded the of our 9 SGRBs are not affected by the selection bias, while we cannot give further argument on the selection bias in under the limited observation data. Since Krühler et al. (2011) reports the anti-correlation between the and the ratio for LGRBs, the selection bias in should be discussed in detail for future observation data of SGRBs.
In our 9 SGRB samples, the measured gas-to-dust ratio of SGRBs is roughly close to the one of the MW. Our result means that a major contribution of both extinction in optical/NIR band and absorption in X-ray band originates from the ISM in the host galaxy of SGRB. In other words, most of SGRBs are likely to occur in not star-forming regions but typical ISM environments of galaxies such as the MW. This result on the environment is consistent with the scenario that the coalescence of the compact binaries are the origin of because the system must move away from the location of their birth by natal kicks until its merging (e.g., Narayan, Paczynski, & Piran, 1992; Bloom et al., 1999; Fryer et al., 1999; Belczynski et al., 2006).
will show the amount of the intervening ISM within the host galaxy. In our results, we found approximately half of SGRB samples show to be consistent with zero while we obtained only marginal upper limit on them. These SGRBs are considered to occur in outskirt or outside of the host galaxies in which there are almost no X-ray absorption (and dust extinction) by the ISM. Moreover, while GRB 170817A with GW 170817, whose origin is the binary neutron star merger (Abbott et al., 2017; Goldstein et al., 2017; Savchenko et al., 2017), which occurred at only 1 from the center of the host galaxy. Here is given by a Sérsic model (Ciotti & Bertin, 1999). However the X-ray absorption and optical extinction in the host galaxy are not significantly detected (Levan et al., 2017; Pooley et al., 2018). This event might occur at the location apart from the host galaxy toward the observer’s side. The value might be an indicator of the offset along the line of sight.
Acknowledgments
We gratefully thank the anonymous referee for quick responses and helpful comments, and we also acknowledge the quick and kind responses of the editors. We also thank Yuu Niino for useful discussions. This work made use of data supplied by the UK Swift Science Data Centre at the University of Leicester, and is supported by JSPS KAKENHI Grant Number JP17J00905 (KY), JP16H06342 (DY), JP18J13042 (YK), MEXT KAKENHI Grant Number JP18H04580 (DY), JP17H06362 (MA), and Sakigake 2018 Project of Kanazawa University (DY). MA acknowledges the support from the JSPS Leading Initiative for Excellent Young Researchers program.
| GRB | z | Epoch | ||
|---|---|---|---|---|
| ( cm-2) | (mag) | (s) | ||
| 050724 | 0.258 | 27.7 | 1.61 | 41783 |
| 051221A | 0.5465 | 7.52 | 0.18 | 184701 |
| 070724A | 0.457 | 1.21 | 0.04 | 10872 |
| 090510 | 0.903 | 1.77 | 0.05 | 28267 |
| 130603B | 0.3564 | 2.1 | 0.06 | 52714 |
| 140903A | 0.351 | 3.26 | 0.09 | 47117 |
| 150423A | 1.394 | 1.77 | 0.08 | 15300 |
| 150424A | 0.3 | 6.02 | 0.16 | 57903 |
| 170428A | 0.454 | 6.95 | 0.16 | 3660 |
| GRB | (dof) | Null hypothesis | ||||
|---|---|---|---|---|---|---|
| ( cm-2) | (mag) | (eV) | probability | |||
| 050724 | – | 40 (31) | 0.121 | |||
| 051221A | – | 44 (46) | 0.544 | |||
| 070724A | – | 23 (19) | 0.226 | |||
| 090510 | – | 107 (85) | 0.051 | |||
| 130603B | 48 (49) | 0.498 | ||||
| 140903A | – | 49 (39) | 0.128 | |||
| 150423A | – | 6 (7) | 0.536 | |||
| 150424A | 59 | 66 (46) | 0.027 | |||
| 170428A | – | 8 (7) | 0.344 |
| GRB | z | ||
| ( cm-2) | ( cm-2) | ||
| 060614 | 0.125 | 2.09 | |
| 060801 | 1.131 | 1.45 | |
| 061006 | 0.4377 | 25.1 | |
| 061201 | 0.111 | 6.8 | |
| 070714B | 0.923 | 9.82 | |
| 070809 | 0.2187 | 8.62 | |
| 071227 | 0.383 | 1.31 | |
| 080123 | 0.495 | 2.52 | |
| 080905 | 0.121 | 13.5 | |
| 090426 | 2.609 | 1.58 | |
| 090530 | 1.266 | 1.84 | |
| 100117A | 0.915 | 2.97 | |
| 100625A | 0.453 | 2.23 | |
| 100816A | 0.804 | 5.70 | |
| 101219A | 0.718 | 5.91 | |
| 111117A | 2.211 | 4.12 | |
| 160228A | 1.64 | 8.98 | |
| 160410A | 1.717 | 1.8 | |
| 160624A | 0.483 | 9.31 | |
| 160821B | 0.16 | 5.95 |
|
|
|
|
|

|
References
- Abbott et al. (2017) Abbott, B., et al. 2017, ApJ, 848, L12
- Belczynski et al. (2006) Belczynski, K., et al. 2006, ApJ, 648, 1110
- Berger et al. (2005) Berger, E., et al. 2005, Nature, 438, 988
- Berger et al. (2009) Berger, E., Cenko, S. B., Fox, D. B., & Cucchiara, A. 2009, ApJ, 704, 877
- Berger (2014) Berger, E., 2014, ARA&A, 52, 43
- Bloom et al. (1999) Bloom, J. S, Sigurdsson, S., & Pols, O. 1999, MNRAS, 305, 763
- Bloom et al. (2002) Bloom, J. S, Kulkarni, S. R., & Djorgovski, S. G. 2002, AJ, 123, 1111
- Bolmer et al. (2017) Bolmer, J., Steinle, H., & Schady, P. 2017, GCN Circ., 21050
- Burrows et al. (2005) Burrows, D., et al. 2005, Space Sci. Rev., 120, 165
- Ciotti & Bertin (1999) Ciotti, L., & Bertin, G. 1999, å, 352, 447
- Covino et al. (2013) Covino, S., et al. 2013, MNRAS, 432, 1231
- de Ugarte Postigo et al. (2014) de Ugarte Postigo, A., et al. 2014, A&A, 563, A62
- Galama & Wijers (2001) Galama, T. J., & Wijers, R. A. M. J. 2001, ApJ, 549, L209
- Gehrels et al. (2004) Gehrels, N., et al. 2004, ApJ, 611, 1005
- Goldstein et al. (2017) Goldstein, A., et al. 2017, ApJ, 848, L14
- Eichler et al. (1989) Eichler, D., Livio, M., Schramm, D. N., et al. 1989, Nature, 340, 126
- Evans et al. (2007) Evans, P. A., et al. 2007, å, 469, 379
- Evans et al. (2009) Evans, P. A., et al. 2007, MNRAS, 397, 1177
- Fong et al. (2013) Fong, W., et al. 2013, apj, 769, 56
- Fong & Berger (2013) Fong, W., & Berger, E. 2013, apj, 776, 16
- Fong et al. (2015) Fong, W., Berger, E., Margutti, R., & Zauderer, B. A. 2015, ApJ, 815, 102
- Fruchter et al. (2006) Fruchter, A. S, et al. 2006, Nature, 441, 463
- Fryer et al. (1999) Fryer, C., Woosley, S., & Hartman, D. 1999, ApJ, 526, 152
- Granot & Sari (2002) Granot, J., & Sari R. 2002, ApJ, 568, 820
- Guelbenzu et al. (2012) Guelbenzu, A. N., et al. 2012, A&A, 538, L7
- Hjorth et al. (2003) Hjorth, J., et al. 2003, Nature, 423, 847
- Kagawa et al. (2015) Kagawa, Y., et al. 2015, ApJ, 811, 4.
- Kagawa et al. (2019) Kagawa, Y., et al. 2019, ApJ, in prep.
- Kann et al. (2015) Kann, D. A. 2015, GCN Circ., 17738
- Kisaka et al. (2017) Kisaka, S., Ioka, K., & Sakamoto, T. 2017, ApJ, 846, 142K
- Knust et al. (2017) Knust, F., et al. 2017, A&A, 607, A84
- Kouveliotou et al. (1993) Kouveliotou, C., et al. 1993, ApJ, 413L, 101K
- Krühler et al. (2011) Krühler, T., et al. 2011, A&A, 534, A108
- Kumar & Zhang (2015) Kumar, P., & Zhang, B. 2015, Phys. Rep., 561, 1
- Levan et al. (2017) Levan, A., J., et al. 2017, ApJ, 848, L28
- Lien et al. (2016) Lien, A., et al. 2016, ApJ, 829, 7
- Littlejohns et al. (2015) Littlejohns, O., et al. 2015, GCN Circ., 17736
- Malesani et al. (2007) Malesani, D., et al. 2007, A&A, 473, 77
- Narayan, Paczynski, & Piran (1992) Narayan, R., Paczynski, B., Piran, T. 1992, ApJ, 395, L83
- Norris & Bonnell (2006) Norris, J. P., & Bonnell, J. T. 2006, ApJ, 643, 266
- Pei (1992) Pei, Y. C., 1992, ApJ, 395, 130
- Pooley et al. (2018) Pooley, D., Kumar, P., Wheeler, J., C., & Grossan, B. 2018, ApJ, 859, L23
- Rees & Mészáros (1992) Rees, M. J., Mészáros, P. 1992, MNRAS, 258, 41
- Rees & Mészáros (1998) Rees, M. J., Mészáros, P. 1998, ApJ, 496, L1
- Sari, Piran, & Narayan (1998) Sari, R., Piran, T., & Narayan, R. 1998, ApJ, 497, L17
- Savchenko et al. (2017) Savchenko, V., et al. 2017, ApJ, 848, L15
- Savaglio et al. (2003) Savaglio, S., Fall, S. M., & Fiore, F. 2003, ApJ, 585, 638
- Schady et al. (2007) Schady, P., et al. 2007, MNRAS, 377, 273
- Schady et al. (2010) Schady, P., et al. 2010, MNRAS, 401, 2773
- Schlafly & Finkbeiner (2011) Schlafly, E. F., & Finkbeiner, D. P. 2011, ApJ, 737, 103
- Sevensson et al. (2010) Svensson, K. M., Levan, A. J., Tanvir, N. R., Fruchter, A. S., & Strolger, L.-G. 2010, MNRAS, 405, 57
- Soderberg et al. (2006) Soderberg, A. M., et al. 2006, ApJ, 650, 261
- Troja et al. (2016) Troja, W., et al. 2016, ApJ, 827, 102
- Troja et al. (2017) Troja, E., et al. 2017, GCN Circ., 21051
- Varela et al. (2015) Varela, K., & Berger, E. 2015, GCN Circ., 17732
- Waxman & Draine (2000) Waxman, E., & Draine, B. T. 2000, apj, 537, 796
- Welty et al. (2012) Welty, D. E., Xue, R., & Wong, T. 2012, ApJ, 745, 173
- Willingale et al. (2013) Willingale, R., et al. 2013, MNRAS, 431, 394
- Woosley & Bloom (2006) Woosley, S. E., & Bloom, J. S. 2006, ARA&A, 44, 507
- Zafar et al. (2011) Zafar, T., et al. 2011, A&A, 532, A143
Appendix A Optical/NIR observation data and result of spectral analysis
Time since the trigger time (sec).
If not specified, the flux is not corrected for extinctions of our galaxy or the host one in the direction of the GRB.
(a) Berger et al. (2005), (b) Malesani et al. (2007), (c) Soderberg et al. (2006), (d) Berger et al. (2009), (e) Fong et al. (2015) (f) Guelbenzu et al. (2012), (g) de Ugarte Postigo et al. (2014), (h) Troja et al. (2016), (i) Varela et al. (2015), (j) Littlejohns et al. (2015), (k) Kann et al. (2015), (l) Knust et al. (2017), (m) Bolmer et al. (2017), (n) Troja et al. (2017)
The fluxes are corrected for Galactic extinction in the direction of the GRB.
| GRB | Filter | 1 (sec) | Flux2 (Jy) | Reference3 |
|---|---|---|---|---|
| 050724 | (a) | |||
| (b) | ||||
| (b) | ||||
| (b) | ||||
| (b) | ||||
| (b) | ||||
| (b) | ||||
| 051221A | (c) | |||
| (c) | ||||
| (c) | ||||
| (c) | ||||
| (c) | ||||
| (c) | ||||
| (c) | ||||
| (c) | ||||
| (c) | ||||
| 070724A4 | (d) | |||
| (d) | ||||
| (d, e) | ||||
| (d, e) | ||||
| (d) | ||||
| 090510 | (f) | |||
| (f) | ||||
| (f) | ||||
| (f) | ||||
| (f) | ||||
| (f) | ||||
| (f) | ||||
| (f) | ||||
| (f) | ||||
| (f) | ||||
| (f) | ||||
| (f) | ||||
| (f) | ||||
| (f) | ||||
| (f) | ||||
| (f) | ||||
| (f) | ||||
| (f) | ||||
| (f) | ||||
| (f) | ||||
| (f) | ||||
| (f) | ||||
| (f) | ||||
| (f) | ||||
| (f) | ||||
| (f) | ||||
| (f) | ||||
| (f) | ||||
| (f) | ||||
| (f) | ||||
| (f) | ||||
| (f) | ||||
| (f) | ||||
| (f) | ||||
| (f) | ||||
| (f) | ||||
| (f) | ||||
| (f) | ||||
| (f) | ||||
| (f) | ||||
| (f) | ||||
| (f) | ||||
| (f) | ||||
| (f) | ||||
| (f) | ||||
| (f) | ||||
| (f) | ||||
| (f) | ||||
| (f) | ||||
| (f) | ||||
| (f) | ||||
| (f) | ||||
| (f) | ||||
| (f) | ||||
| (f) | ||||
| (f) | ||||
| (f) | ||||
| (f) | ||||
| (f) | ||||
| (f) | ||||
| (f) | ||||
| (f) | ||||
| (f) | ||||
| (f) | ||||
| (f) | ||||
| (f) | ||||
| (f) | ||||
| (f) | ||||
| (f) | ||||
| (f) | ||||
| (f) | ||||
| (f) | ||||
| (f) | ||||
| (f) | ||||
| (f) | ||||
| (f) | ||||
| (f) | ||||
| (f) | ||||
| (f) | ||||
| (f) | ||||
| (f) | ||||
| (f) | ||||
| (f) | ||||
| (f) | ||||
| (f) | ||||
| (f) | ||||
| (f) | ||||
| (f) | ||||
| (f) | ||||
| (f) | ||||
| (f) | ||||
| (f) | ||||
| (f) | ||||
| (f) | ||||
| (f) | ||||
| (f) | ||||
| (f) | ||||
| (f) | ||||
| (f) | ||||
| (f) | ||||
| (f) | ||||
| 130603B | (g) | |||
| (g) | ||||
| (g) | ||||
| (g) | ||||
| (g) | ||||
| (g) | ||||
| (g) | ||||
| (g) | ||||
| (g) | ||||
| (g) | ||||
| (g) | ||||
| (g) | ||||
| 140903A | (h) | |||
| (h) | ||||
| (h) | ||||
| (h) | ||||
| 150423A | (i) | |||
| (i) | ||||
| (j) | ||||
| (k) | ||||
| (k) | ||||
| (i) | ||||
| (j) | ||||
| (i) | ||||
| 150424A | (l) | |||
| (l) | ||||
| (l) | ||||
| (l) | ||||
| (l) | ||||
| (l) | ||||
| (l) | ||||
| (l) | ||||
| (l) | ||||
| (l) | ||||
| (l) | ||||
| (l) | ||||
| (l) | ||||
| (l) | ||||
| (l) | ||||
| (l) | ||||
| (l) | ||||
| (l) | ||||
| (l) | ||||
| (l) | ||||
| 170428 | (m) | |||
| (m) | ||||
| (m) | ||||
| (m) | ||||
| (n) | ||||
| (m) | ||||
| (m) | ||||
| \insertTableNotes |
Break energy are restricted by the lower limit we set.
| GRB | Model | Null hypothesis | |||||
|---|---|---|---|---|---|---|---|
| (mag) | (eV) | probability | |||||
| 050724 | MW/po | – | 40 (31) | 0.121 | |||
| LMC/po | – | 40 (31) | 0.121 | ||||
| SMC/po | – | 40 (31) | 0.121 | ||||
| MW/bknpo | 37 (30) | 0.183 | |||||
| LMC/bknpo | 37 (30) | 0.182 | |||||
| SMC/bknpo | 37 (30) | 0.180 | |||||
| 051221A | MW/po | – | 44 (46) | 0.544 | |||
| LMC/po | – | 44 (46) | 0.540 | ||||
| SMC/po | – | 45 (46) | 0.522 | ||||
| MW/bknpo | 38 (45) | 0.743 | |||||
| LMC/bknpo | 38 (45) | 0.743 | |||||
| SMC/bknpo | 38 (45) | 0.743 | |||||
| 070724A | MW/po | – | 23 (19) | 0.226 | |||
| LMC/po | – | 23 (19) | 0.227 | ||||
| SMC/po | – | 23 (19) | 0.229 | ||||
| MW/bknpo | 23 (18) | 0.199 | |||||
| LMC/bknpo | 23 (18) | 0.199 | |||||
| SMC/bknpo | 23 (18) | 0.196 | |||||
| 090510 | MW/po | – | 107 (85) | 0.051 | |||
| LMC/po | – | 108 (85) | 0.049 | ||||
| SMC/po | – | 108 (85) | 0.050 | ||||
| MW/bknpo | ∗*∗*footnotemark: | 107 (84) | 0.043 | ||||
| LMC/bknpo | ∗*∗*footnotemark: | 108 (84) | 0.042 | ||||
| SMC/bknpo | ∗*∗*footnotemark: | 108 (84) | 0.043 | ||||
| 130603B | MW/po | – | 58 (50) | 0.206 | |||
| LMC/po | – | 57 (50) | 0.218 | ||||
| SMC/po | – | 56 (50) | 0.253 | ||||
| MW/bknpo | 48 (49) | 0.498 | |||||
| LMC/bknpo | 48 (49) | 0.505 | |||||
| SMC/bknpo | 49 (49) | 0.477 | |||||
| 140903A | MW/po | – | 49 (39) | 0.128 | |||
| LMC/po | – | 49 (39) | 0.130 | ||||
| SMC/po | – | 49 (39) | 0.139 | ||||
| MW/bknpo | ∗*∗*footnotemark: | 49 (38) | 0.106 | ||||
| LMC/bknpo | ∗*∗*footnotemark: | 49 (38) | 0.108 | ||||
| SMC/bknpo | ∗*∗*footnotemark: | 49 (38) | 0.116 | ||||
| 150423A | MW/po | – | 6 (7) | 0.536 | |||
| LMC/po | – | 6 (7) | 0.536 | ||||
| SMC/po | – | 6 (7) | 0.536 | ||||
| MW/bknpo | ∗*∗*footnotemark: | 6 (6) | 0.419 | ||||
| LMC/bknpo | ∗*∗*footnotemark: | 6 (6) | 0.419 | ||||
| SMC/bknpo | ∗*∗*footnotemark: | 6 (6) | 0.419 | ||||
| 150424A | MW/po | – | 89 (47) | 2.66e-02 | |||
| LMC/po | – | 89 (47) | 2.66e-02 | ||||
| SMC/po | – | 89 (47) | 2.66e-02 | ||||
| MW/bknpo | 66 (46) | 0.027 | |||||
| LMC/bknpo | 66 (46) | 0.027 | |||||
| SMC/bknpo | 66 (46) | 0.027 | |||||
| 170428A | MW/po | – | 8 (7) | 0.344 | |||
| LMC/po | – | 8 (7) | 0.344 | ||||
| SMC/po | – | 8 (7) | 0.344 | ||||
| MW/bknpo | 2 (6) | 0.870 | |||||
| LMC/bknpo | 3 (6) | 0.869 | |||||
| SMC/bknpo | 2 (6) | 0.870 | |||||
| \insertTableNotes |