Basic Performance Measurements of the
Intel Optane DC Persistent Memory Module
Or: It’s Finally Here! How Fast is it?
![[Uncaptioned image]](/html/1903.05714/assets/x1.png)
Computer Science & Engineering
University of California
Abstract
After nearly a decade of anticipation, scalable nonvolatile memory DIMMs are finally commercially available with the release of the Intel® Optane™ DC Persistent Memory Module (or just “Optane DC PMM”). This new nonvolatile DIMM supports byte-granularity accesses with access times on the order of DRAM, while also providing data storage that survives power outages.
This work comprises the first in-depth, scholarly, performance review of Intel’s Optane DC PMM, exploring its capabilities as a main memory device, and as persistent, byte-addressable memory exposed to user-space applications. For the past several months, our group has had access to machines with Optane DC memory and has investigated the Optane DC PMM’s performance characteristics. This report details the chip’s performance under a number of modes and scenarios, and across a wide variety of both micro- and macro-scale benchmarks. In total, this report represents approximately 330 hours of machine time.
Optane DC memory occupies a tier in-between SSDs and DRAM. It has higher latency (346 ns) than DRAM but lower latency than an SSD. Unlike DRAM, its bandwidth is asymmetric with respect to access type: for a single Optane DC PMM, its max read bandwidth is 6.6 GB/s, whereas its max write bandwidth is 2.3 GB/s. However, the expected price point of Optane DC memory means that machines with large quantities of Optane DC memory are feasible — our test machine has 3 TB of Optane DC memory across two sockets.
Optane DC PMMs can be used as large memory devices with a DRAM cache to hide their lower bandwidth and higher latency. When used in this Memory (or cached) mode, Optane DC memory has little impact on applications with small memory footprints. Applications with larger memory footprints may experience some slow-down relative to DRAM, but are now able to keep much more data in memory.
In contrast, in App Direct (or uncached) mode, Optane DC PMMs can be used as a persistent storage device. When used under a file system, this configuration can result in significant performance gains, especially when the file system is optimized to use the load/store interface of the Optane DC PMM and the application uses many small, persistent writes. For instance, using the NOVA-relaxed NVMM file system, we can improve the performance of Kyoto Cabinet by almost 2.
In App Direct mode, Optane DC PMMs can also be used to enable user-space persistence where the application explicitly controls its writes into persistent Optane DC media. By modifying the actual application, application programmers can gain additional performance benefits since persistent updates bypass both the kernel and file system. In our experiments, modified applications that used user-space Optane DC persistence generally outperformed their file system counterparts; for instance, the user-space persistent version of RocksDB performed almost 2 faster than the equivalent program utilizing an NVMM-aware file system.
This early report is only the beginning in an effort to understand these new memory devices. We hope that these results will be enlightening to the research community in general and will be useful in guiding future work into nonvolatile memory systems.
How to Use this Document
Specialists in different areas will be interested in different sections. Researchers who are interested in the basic characteristics of Optane DC memory should pay close attention to Section 3. Application developers that use large amounts of memory should read Section 4 to see how Optane DC memory performs when used as a very large main memory device. File systems and storage researchers should head to Section 5 to see how Optane DC memory affects file systems. Persistent memory researchers should see Section 6 to see how prototype persistent memory libraries perform when run on real Optane DC PMMs and how prior methods of emulation compare.
All data presented in this document is included in the arxiv directory under the anc folder. All figures are tagged with a reference to their data files.
We have called out “observations” in boxes throughout this document. These observations represent key facts or findings about the Intel’s Optane DC PMM. In general, we highlight findings that are useful to a wide group of readers, or that represent key statistics about the device.
We welcome and will try to answer any questions about the data or our methodology. However, many aspects of Intel’s design are still not publicly available, so we may be limited on the information that we can provide.
Versions
This is Version 1.0.1 of this document.
- Version 0.1.0 (3/13/2019)
-
The initial release of this document, with a number of results still under embargo.
- Version 1.0.0 (4/3/2019)
-
The first full release of this document, with all results released from embargo and including non-normalized results.
- Version 1.0.1 (8/9/2019)
-
Updated release of this document. Includes minor textual clarifications, new experiments on device bandwidth, and errata. In particular, earlier versions stated that the cache-line size for data movement in Memory Mode between Optane DC and DRAM memory was 4 KB — it is in fact 64 bytes.
Executive Summary
For the last ten years, researchers have been anticipating the arrival of commercially available, scalable non-volatile main memory (NVMM) technologies that provide byte-granularity storage and survive power outages. Recently, Intel released a product based on one of these technologies: the Intel® Optane™ DC Persistent Memory Module (or just “Optane DC PMM”).
Researchers have not waited idly for real nonvolatile DIMMs (NVDIMMs) to arrive222Optane DC PMM are not technically NVDIMMs since they do not comply with any of the NVMM-F, -N, or -P JEDEC standards.. Over the past decade, they have written a slew of papers proposing new programming models [5, 35, 29], file systems [37, 6, 15], and other tools built to exploit the performance and flexibility that NVDIMMs promised to deliver.
Now that Optane DC PMMs are finally here, researchers can begin to grapple with their complexities and idiosyncrasies. We have started that process over the last several months by putting Optane DC memory through its paces on test systems graciously provided by Intel.
This report describes how Optane DC PMMs attach to the processor and summarizes our findings about basic Optane DC performance as an extension of volatile DRAM, as a fast storage medium in a conventional storage stack, and as non-volatile main memory. The goal of this report is to help the computer architecture and systems research community develop intuition about this new memory technology behaves.
This executive summary presents our key findings and provides a snapshot of the data on Optane DC that we think are most useful. The full report provides more detail, a comparison to multiple memory technologies (e.g., DRAM used to emulated Optane DC), data for additional software components, and much more data. It also provides pointers to the raw data underlying each of the graphs.
Background (Section 2)
Like traditional DRAM DIMMs, the Optane DC PMM sits on the memory bus and connects to the processor’s on-board memory controller. Our test systems use Intel’s new second generation Xeon Scalable processors (codenamed Cascade Lake). A single CPU can host six Optane DC PMMs for a total of 3 TB of Optane DC memory. The memory controller communicates with the Optane DC PMM via a custom protocol that is mechanically and electrically compatible with DDR4 but allows for variable-latency memory transactions. Optane DC PMMs currently come in three capacities: 128 GB, 256 GB, and 512 GB. In this article, we report numbers for 256 GB Optane DC PMMs.
Cascade Lake includes a suite of instruction to enforce ordering constraints between stores to Optane DC. Some of these have existed for a long time (e.g., sfence and non-temporal stores that bypass the caches), but others are new. For example, clwb writes back a cache line without necessarily invalidating it.
Optane DC PMMs can operate in two modes: Memory and App Direct modes.
Memory mode uses Optane DC to expand main memory capacity without persistence. It combines a Optane DC PMM with a conventional DRAM DIMM that serves as a direct-mapped cache for the Optane DC PMM. The cache block size is 64 bytes, and the CPU’s memory controller manages the cache transparently. The CPU and operating system simply see a larger pool of main memory. In graphs, for brevity and clarity, we refer to this mode as cached.
App Direct mode is useful for building storage systems out of Optane DC. The Optane DC PMM appears as a separate, persistent memory device. There is no DRAM cache. Instead, the system installs a file system to manage the device. Optane DC-aware applications and the file system can access the Optane DC PMMs with load and store instructions and use the ordering facilities mentioned above to enforce ordering constraints and ensure crash consistency. In graphs, for brevity and clarity, we refer to App Direct mode as uncached.
Our experiments explore a number of Optane DC memory configurations and modes. In addition to the cached/uncached option, Optane DC memory can be integrated in two ways. It can be used as the main memory of the system as a direct replacement for DRAM, an option we refer to as main memory or MM; or it can be used as a storage tier underlying the file system, an option we refer to as persistent memory or PM.
Basic Optane DC Performance (Section 3)
The most critical difference between Optane DC and DRAM is that Optane DC has longer latency and lower bandwidth. Load and store performance is also asymmetric.
Latency To measure Optane DC load latency, we disable the DRAM cache and issue single load instructions with a cold cache. On average, random loads take 305 ns compared to 81 ns for DRAM accesses on the same platform. For sequential loads, latencies are 169 ns, suggesting some buffering or caching inside the Optane DC PMM.
Measuring write latency is difficult because we cannot detect when a store physically reaches the Optane DC PMM. We can, however, detect when the store reaches the processor’s asynchronous DRAM refresh (ADR) domain, which guarantees that the store’s effects are persistent. To measure that latency, we issue a store followed by a cache flush instruction and a fence. That latency is 94 ns for Optane DC compared to 86 ns for DRAM.
Bandwidth Our measurements show that Optane DC bandwidth is lower than DRAM bandwidth, especially for stores. Figure 1 plots sequential access bandwidth to six Optane DC PMMs for between 1 and 23 threads and compares its bandwidth to six DRAM DIMMs (on a local and remote NUMA node). For reads (at left), bandwidth peaks at 39.4 GB/s. For writes (at right), it takes just four threads to reach saturation at 13.9 GB/s. For a single Optane DC PMM, its max read bandwidth is 6.6 GB/s, whereas its max write bandwidth is 2.3 GB/s.
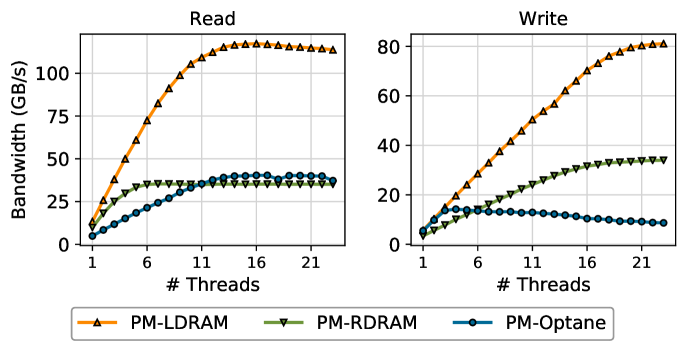
Figure 2 plots bandwidth for random accesses of different sizes to a single DIMM issued by one thread. The left edge of the graph corresponds to small (64 B) random updates, while the right edge measure accesses large enough (128 kB) to be effectively sequential.
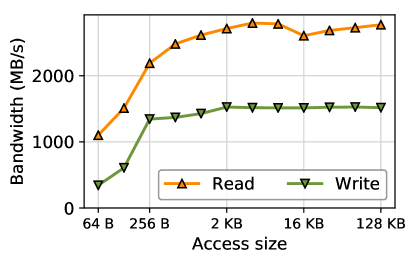
Performance for read and write rises quickly until access size reaches 256 B and slowly climbs to a peak of 1.5 GB/s for stores and 2.8 GB/s for loads. 256 B is Optane DC’s internal block size. It represents the smallest efficient access granularity for Optane DC. Loads and stores that are smaller than this granularity waste bandwidth as they have the same latency as a 256 B access. Stores that are smaller also result in write amplification since Optane DC writes at least 256 B for every update, incurring wear and consuming energy.
Optane DC as Main Memory (Section 4)
When used as main memory, we expect that the Optane DC PMM will be used in Memory Mode (that is, with a DRAM cache) in order to provide a large main memory device.
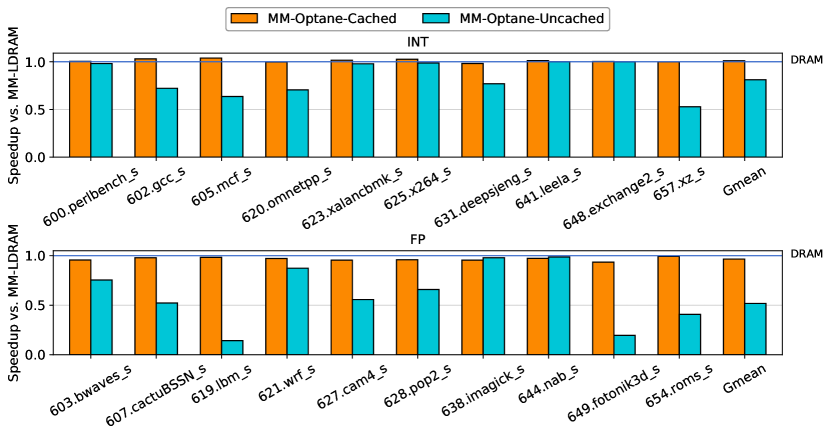
Figure 3 compares the performance of SPEC 2017 [3] running on cached Optane DC and uncached Optane DC normalized to performance using DRAM. The working sets of the SPEC 2017 applications are all small enough to fit in the DRAM cache. For the integer workloads, cached Optane DC is just as fast as DRAM, and uncached Optane DC is 38% slower. Floating point performance, however, drops 15% with cached Optane DC and 61% with uncached. The poor performance in cached mode is surprising, and we do not yet sure of the root cause. One likely candidate is the limited write bandwidth of Optane DC.
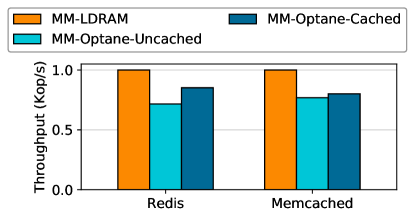
The caching mechanism works for larger memory footprints as well. Figure 4 measures performance for Memcached and Redis (each configured as a non-persistent key-value store) each managing a 96 GB data set. Memcached serves a workload of 50% SET operations, and Redis serves a workload with pure SETs. It shows that for these two applications, replacing DRAM with uncached Optane DC reduces performance by 20.1% and 23.0% for memcached and Redis, respectively. Enabling the DRAM cache, as would normally be done in system deployment, means performance drops only between 8.6% and 19.2%. Regardless of performance losses, Optane DC memory is far denser; our machine can fit 192 GB of DRAM but 1.5 TB of Optane DC memory on a socket, giving us the ability to run larger workloads than fit solely in DRAM.
Optane DC as Persistent Storage (Section 5)
Optane DC will profoundly affect the performance of storage systems. Using Optane DC PMMs as storage media disables the DRAM cache and exposes the Optane DC as a persistent memory block device in Linux. Several persistent-memory file systems are available to run on such a device: Ext4 and XFS were built for disks but have direct access (or “DAX”) modes, while NOVA [37] is purpose-built for persistent memory.
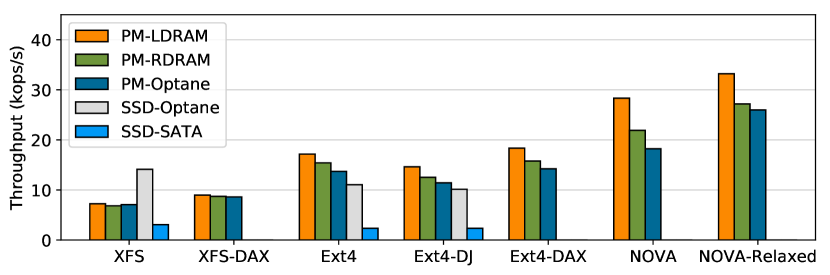
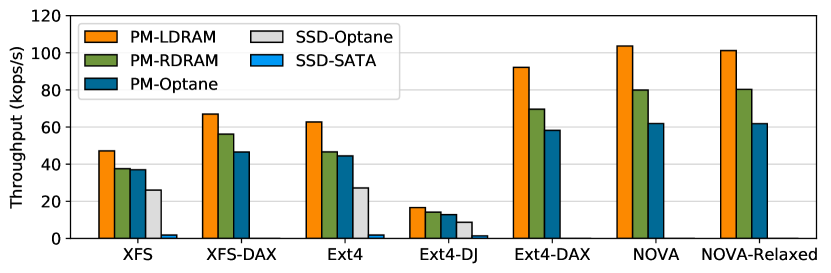
Figure 5 summarizes performance for several file systems performing random reads and random writes with between one and sixteen threads. It also compares performance to a SATA flash-based SSD and an Optane SSD that exposes Optane DC as block device via the PCIe bus. The data show that Optane DC improves basic storage performance over both of those storage devices by a wide margin.
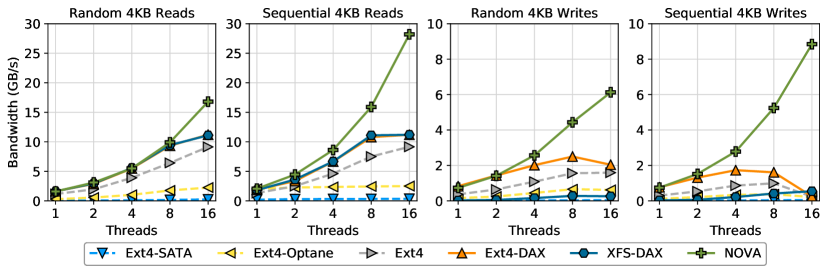
The data also demonstrate the benefits of designing software specifically for persistent memory. NOVA outperforms the legacy file systems and provides much better performance scaling.
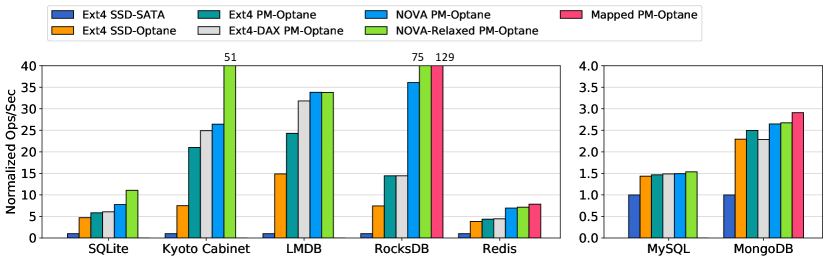
Figure 6 shows how Optane DC affects application-level performance for RocksDB [16], Redis [30], MySQL [28], SQLite [31], MongoDB [24], Kyoto Cabinet [17], and LMDB [32]. MySQL is running TPC-C; the others are running workloads that insert key-value pairs.
The impact at the application level varies widely. Interestingly, for MongoDB, the legacy version of Ext4 outperforms the DAX version. We suspect this result occurs because DAX disables the DRAM page cache, but the cache is still useful since DRAM is faster than Optane DC.
Optane DC as Persistent Memory (Section 6)
Optane DC’s most intriguing application is as a byte-addressable persistent memory that user space applications map into their address space (with the mmap() system call) and then access directly with loads and stores.
Using Optane DC in this way is more complex than accessing it through a conventional file-based interface because the application has to ensure crash consistency rather than relying on the file system. However, the potential performance gains are much larger.
Figure 6 includes results for versions of Redis and RocksDB modified to use Optane DC in this manner. The impact varies widely: performance for RocksDB increases by 3.5, while Redis 3.2 gains just 20%. Understanding the root cause of the difference in performance and how to achieve RocksDB-like results will be fertile ground for developers and researchers.
Conclusion
Intel’s Optane DC is the first new memory technology to arrive in the processor’s memory hierarchy since DRAM. It will take many years to fully understand how this new memory behaves, how to make the best use of it, and how applications should exploit it.
The data we present are a drop in the bucket compared to our understanding of other memory technologies. The data are exciting, though, because they show Optane DC’s strengths and its weaknesses, both where it can have an immediate positive impact on systems and where more work is required.
We are most excited to see what emerges as persistent main memory moves from a subject of research and development by a small number engineers and academics to a mainstream technology used by, eventually, millions of developers. Their experiences and the challenges they encounter will give rise to the most innovative tools, the most exciting applications, and the most challenging research questions for Optane DC and other emerging NVMM technologies.
1 Introduction
Over the past ten years, researchers have been anticipating the arrival of commercially available, scalable non-volatile main memory (NVMM) technologies that provide byte-granularity storage that survives power outages. In the near future, Intel is expected to release a enterprise product based on one of these technologies: the Intel® Optane™ DC Persistent Memory Module (or just “Optane DC PMM”).
Researchers have not idly waited for real nonvolatile DIMMs (NVDIMMs) to arrive333Optane DC PMM are not technically NVDIMMs since they do not comply with any of the NVMM-F, -N, or -P JEDEC standards.. Over the past decade, they have written a slew of papers proposing new programming models [5, 35], file systems [37, 38, 36, 34, 6, 15], libraries [2, 4, 29], and applications built to exploit the performance and flexibility that NVDIMMs promised to deliver.
Those papers drew conclusions and made design decisions without detailed knowledge of how real NVDIMMs would behave, what level of performance they would offer, or how industry would integrate them into computer architectures. In its place, researchers have used a variety to techniques to model the performance of NVDIMMs, including custom hardware [15], software simulation [5], slowing the DRAM frequency [19], exploiting NUMA effects [14], or simply pretending that DRAM is persistent.
Now that Optane DC PMMs are actually here, we can begin to grapple with their complexities and idiosyncrasies. The first step in understanding Optane DC PMM performance is to conduct measurements that explore fundamental questions about the Optane DC memory technology and how Intel has integrated it into a system. This report provides some of those measurements.
We have attempted to answer several questions, namely:
-
1.
What are the basic performance characteristics of Optane DC memory?
-
2.
What are the basic performance characteristics of persistent memory-specific instructions?
-
3.
How does Optane DC memory affect the performance of applications when used as an extension of (non-persistent) DRAM?
-
4.
How does Optane DC memory affect the performance of applications when used as storage?
-
5.
How does Optane DC memory affect the performance of system software (e.g. file systems)?
-
6.
How does custom software written for NVMMs perform on Optane DC memory?
-
7.
How does the performance of Optane DC compare to prior methods used to emulate Optane DC?
This report presents measurements over of a wide range of applications, benchmark suites, and microbenchmarks, representing over 330 hours of machine time. All of the underlying data is freely available in the attached anc/ directory. We hope that the community finds this data useful.
2 Background and Methodology
In this section, we provide background on the Intel® Optane™ DC Persistent Memory Module, describe the test system, and then describe the configurations we use throughout the rest of the paper.
2.1 Optane DC Memory
The Intel® Optane™ DC Persistent Memory Module, which we term the Optane DC PMM for shorthand, is the first commercially available NVDIMM that creates a new tier between volatile DRAM and block-based storage. Compared to existing storage devices (including the related Optane SSDs) that connect to an external interface such as PCIe, the Optane DC PMM has better performance and uses a byte-addressable memory interface. Compared to DRAM, it has higher density and persistence. At its debut, the Optane DC PMM is available in 3 different capacities: 128 GB, 256 GB, and 512 GB.
2.1.1 Intel’s Optane DC PMM
Like traditional DRAM DIMMs, the Optane DC PMM sits on the memory bus, and connects to the integrated memory controller (iMC) on the CPU. The Optane DC PMM debuts alongside the new Intel second generation Xeon Scalable processors (codenamed Cascade Lake). On this platform, each CPU has two iMCs, and each iMC supports three channels. Therefore, in total, a CPU socket can support a total of six Optane DC PMMs, for a maximum of 6 TB of Optane DC memory.
For ensuring data persistency, the iMC sits within the asynchronous DRAM refresh (ADR) domain — Intel’s ADR feature ensures that CPU stores that reach the ADR domain will survive a power failure (i.e. will be flushed to the NVDIMM within the hold-up time, s). The ADR domain does not include the processor caches, so stores will only be persistent after they reach the iMC.
The iMC communicates with the Optane DC PMM using the DDR-T interface. This interface shares a mechanical and electrical interface with DDR4 but uses a different protocol that allows for variable latencies, since Optane DC memory access latencies are not deterministic. Like DDR4 (with ECC), it uses 72-bit data bus and transfers data in cache-line (64-byte) granularity for CPU loads and stores.
When a memory access request arrives on the NVDIMM, it is received by the on-DIMM Controller. This central controller handles most of the processing required on the NVDIMM and coordinates access to the banks of Optane DC media.
After an access request reaches the controller, the address is internally translated. Like SSDs, the Optane DC PMM performs an internal address translation for wear-leveling and bad-block management. The address indirection table (AIT) translates from the DIMM physical address to an internal Optane DC media device address. The AIT resides in Optane DC media, though on-DIMM DRAM keeps a copy of the AIT entries.
After the request is translated, the actual access to storage media occurs. As Optane DC media access granularity is 256 bytes, the controller will translate 64-byte load/stores into larger 256 byte accesses. As a consequence, write amplification occurs as smaller stores issued by the CPU are handled as read-modify-write operations on Optane DC memory by the controller.
Unlike DRAM, Optane DC memory does not need constant refresh for data retention; consequently it consumes less power when idle. The Optane DC PMM has two configurable power budgets. The average power budget controls the power budget allowed for contiguous workloads, and the peak power budget controls the maximum power usage under burst traffic. Both budgets are configurable by the user.
2.1.2 Operation Modes
Each Optane DC PMM can be configured into one of the following two modes, or can be partitioned and used in both modes respectively:
-
•
Memory mode: In this two-level mode, the DDR4 DIMMs connected to the same iMC operate as caches for slower Optane DC memory. In this scheme, the DDR4 DIMM acts as a direct mapped write-back cache for the Optane DC PMM, where each cache line is 64 bytes. The Optane DC PMMs are exposed to the operating system as large volatile regions of memory and do not have persistence (since updates may not be written back all the way into Optane DC memory).
-
•
App Direct mode: In this one-level mode, the Optane DC PMMs are directly exposed to the CPU and operating system and can consequently be used as persistent storage. Both Optane DC PMMs and their adjacent DDR4 DIMMs are visible to the operating system as memory devices. In App Direct mode, the Optane DC PMM is exposed to operating system via configurable regions on contiguously-addressed ranges.
In this paper, for simplicity, we only evaluate a single operation mode at a time and use the same NVDIMM configuration across across all Optane DC memory. That is, for a given configuration, we allocate all Optane DC memory in the same mode (i.e. Memory / App Direct), and, when using Memory mode, share a single fsdax namespace across all NVDIMMs on a socket.
2.2 System Description
We perform our experiments on a dual-socket evaluation platform provided by Intel Corporation. The hardware and software configuration is shown in Table 1.
Two CPUs are installed on the evaluation platform. They are Intel’s new second generation Xeon Scalable processors (codenamed Cascade Lake), and are engineering samples with an obfuscated model number. The overall specifications of these CPUs are close to Xeon Platinum 8160 (former-gen Skylake) with higher base clock at 2.2 GHz, and same single-core turbo boost frequency at 3.7 GHz. Each CPU has 24 cores, each with exclusive 32 KB L1 instruction and data caches, and 1 MB L2 caches. All cores share a 33 MB L3 cache. Each CPU has two iMCs and six memory channels (three channels per iMC). A 32 GB Micron DDR4 DIMM and a 256 GB Intel Intel® Optane™ DC Persistent Memory Module are attached to each of the memory channels. Thus the system has 384 GB (2 socket x 6 channel x 32 GB/DIMM) of DRAM, and 3 TB (2 socket x 6 channel x 256 GB/DIMM) of NVMM. To compare Optane DC memory with traditional blocked based storage, we use an NVMe Optane SSD (NVMe interface) and an NAND SSD (SATA interface) as baselines.
On this system, we run Fedora 27 with Linux kernel version 4.13.0 built from source. For all of the experiments, we disable hyper-threading and set the CPU power governor to performance mode, which forces the CPU to use the highest possible clock frequency. All Optane DC PMMs have the same firmware (version 01.01.00.5253) and use the default power budget (average 15 W / peak 20 W).
In all experiments, transparent huge pages (THP) are enabled unless explicitly mentioned. We do not apply security mitigations (KASLR, KPTI, Spectre and L1TF patches) because Cascade Lake fixes these vulnerabilities at the hardware level [27].
| # Sockets | 2 |
|---|---|
| Microarch | Intel Cascade Lake-SP (engineering sample) |
| CPU Spec. | 24 Cores at 2.2 GHz (Turbo Boost at 3.7 GHz) |
| L1 Cache | 32 KB i-Cache & 32 KB d-Cache (per-core) |
| L2 Cache | 1 MB (per-core) |
| L3 Cache | 33 MB (shared) |
| DRAM Spec. | 32 GB Micron DDR4 2666 MHz (36ASF4G72PZ) |
| Total DRAM | 384 GB [2 (socket) 6 (channel) 32 GB] |
| NVMM Spec. | 256 GB Intel Optane DC 2666 MHz QS (NMA1XXD256GQS) |
| Total NVMM | 3 TB [2 (socket) 6 (channel) 256 GB] |
| Storage (NVMe) | Intel Optane SSD DC P4800X 375 GB |
| Storage (SATA) | Intel SSD DC S3610 1.6 TB (MLC) |
| GNU/Linux Distro | Fedora 27 |
| Linux Kernel | 4.13.0 |
| CPUFreq Governor | Performance |
| Hyper-Threading | Disabled |
| NVDIMM Firmware | 01.01.00.5253 |
| Avg. Power Budget | 15 W |
| Peak Power Budget | 20 W |
| Transparent Huge Page (THP) | Enabled |
| Kernel ASLR | Disabled |
| KPTI & Security Mitigations | Not Applied |
2.3 Configurations
As the Optane DC PMM is both persistent and byte-addressable, it can fill the role of either a main memory device (i.e. replacing DRAM) or as a persistent device (i.e. replacing disk). Both use cases will be common. To fully examine the performance of Optane DC memory, we test its performance in both roles. We examine six system configurations — three that explore the main memory role and three that explore the persistence role. They are shown in Table 2.
| DRAM | NVDIMM | Persistence | Namespace | Size | |
|---|---|---|---|---|---|
| Mode | Mode | (per-socket) | |||
| MM-LDRAM | Memory | n/a | No | unmanaged | 192 GB |
| MM-Optane-Cached | Cache | Memory | No | unmanaged | 1.5 TB |
| MM-Optane-Uncached | Memory | App Direct | No | unmanaged | 1.5 TB |
| PM-Optane | Memory | App Direct | Yes | fsdax | 1.5 TB |
| PM-LDRAM | Fake PMem | n/a | Emulated | fsdax | 80 GB |
| PM-RDRAM | Fake PMem | n/a | Emulated | fsdax | 80 GB |
| SSD-Optane | Memory | n/a | Yes | n/a | 375 GB (total) |
| SSD-SATA | Memory | n/a | Yes | n/a | 1.6 TB (total) |
2.3.1 Memory Configurations
We use our first set of configurations to examine the performance of Optane DC as memory; they therefore vary the type of memory attached behind the traditional DRAM interface. In these configurations, the main memory used by the system is of a single type. These configurations, prefixed by MM (main memory), are explored in detail in Section 4. They are:
MM-LDRAM Our baseline configuration simply uses the DRAM in the system as DRAM and ignores the Optane DC PMMs. This configuration is our control configuration and represents an existing system without NVDIMMs. It provides a DRAM memory capacity of 192 GB per socket.
MM-Optane-Cached This configuration uses cached Optane DC as the system memory. That is, all memory in the system is comprised of Optane DC PMMs but with the adjacent DRAM DIMMs as caches. This configuration represents the likely system configuration used when Optane DC PMMs are utilized as large (but volatile) memory. In this configuration, we set Optane DC into Memory mode, so each Optane DC PMM uses volatile DRAM as a cache. This configuration provides 1.5 TB of Optane DC per socket. The 192 GB per-socket DRAM functions as a cache and is transparent to the operating system.
MM-Optane-Uncached In this configuration, we use uncached Optane DC as the system memory, that is, without DRAM caching Optane DC. This configuration represents a Optane DC system configuration where raw, uncached Optane DC is used as the main memory device. We include this configuration since the DRAM cache in MM-Optane-Cached obscures the raw performance of the Optane DC media — we do not expect this to be a common system configuration. To build this configuration, we configured the Optane DC PMM into App Direct mode and let the Linux kernel consider Optane DC to be DRAM. The kernel considers Optane DC to be slower memory and DRAM to be faster memory, and puts them in two separate NUMA nodes. Although it would be interesting to measure the performance when the whole system running directly on the NVMM, we cannot boot the operating system without any DRAM. Therefore, to run the tests, we configure applications to bind their memory to a NUMA node with exclusively Optane DC memory.
2.3.2 Persistence Configurations
Our second set of configurations explores the persistence capabilities of Optane DC PMM, and we explore the persistence performance of the Optane DC PMM in Sections 5 and 6. As such, these configurations assume a machine model in which system memory resides in DRAM and we vary the device underlying the file system. These configurations use fsdax mode, which exposes the memory as a persistent memory device under /dev/pmem. This arrangement allows both DAX (direct access) file systems and user-level libraries to directly access the memory using a load/store interface while still supporting block based access for non-DAX file systems.
These configurations, which we prefix by PM (persistent memory), vary the memory media underneath the file system. The configurations are:
PM-Optane This configuration uses Optane DC as persistent memory. The configuration represents a system with both DRAM and large quantities of NVMM used for storage. In it, we set Optane DC to be persistent memory running in App Direct mode. Each persistent memory device has a capacity of 1.5 GB.
PM-LDRAM This configuration uses local DRAM as an emulated persistent memory device. Pretending that DRAM is persistent is a simple way of emulating Optane DC, and has served as a common baseline for research in the past decade. This configuration helps us understand how existing methods of emulating NVMM compare to real Optane DC memory. For this configuration, we create 80 GB emulated pmem devices on the same platform using DRAM. In this setup, Optane DC memory is configured in App Direct mode but not used.
PM-RDRAM Like the previous configuration, this configuration uses DRAM (but in this case remote DRAM) to emulate a persistent memory device. Using DRAM on a remote NUMA node simulates the delay when accessing slower NVMM, and researchers used this configuration to investigate the costs of integrating NVMM into real systems before real Optane DC PMMs were available. Like the previous configuration, we use this configuration to examine how prior emulation methods used in research compare to real NVDIMMs. In this configuration, we allocate a simulated pmem device on one socket, and ensure all applications are run on the other.
For experiments that run on file systems, we can also compare Optane DC PMMs against traditional block based storage devices (see Section 5). For these experiments, we also use the following block-based devices underneath the file system:
SSD-Optane This configuration loads an Intel Optane drive underneath the file system using the NVMe interface. This PCIe device uses Optane media as the underlying storage technology, but is optimized for block-based storage. We use this configuration to compare the load/store interface of the Optane DC PMM with a comparable block-based device using the same storage technology.
SSD-SATA This configuration loads a NAND flash solid state drive beneath the file system using the SATA interface. We use this configuration to compare novel storage devices and interfaces with a more established technology.
3 Basic Performance
The impact of Optane DC on the performance of a particular application depends on the details of Optane DC’s basic parameters. Since Optane DC is persistent, the landscape of its performance characteristics is more complex than DRAM’s. In this section, we measure the performance of reads and writes of various sizes, compare the performance different types of stores, and quantify the costs of enforcing persistence with Optane DC.
In particular, we focus on three questions:
-
1.
What are the performance characteristics of Optane DC memory and how do they differ from local and remote DRAM?
-
2.
What is the cost of performing a persistent write to Optane DC memory?
-
3.
How do access patterns impact the performance of Optane DC media?
In order to answer these questions, we experiment on system configurations that load persistent memory underneath a file system, namely PM-LDRAM, PM-RDRAM, and PM-Optane, and use two different experimental tools, the Intel Memory Latency Checker (MLC) [8], and a self-built tool called LATTester.
Intel MLC is a tool designed to accurately measure memory latencies and bandwidth. In particular, every thread in MLC accesses its own mmapped file created on a pmem device mounted with ext4 file system with direct access (DAX) enabled. MLC also disables hardware prefetching to get accurate memory latency measurements. Finally, for multithreaded microbenchmarks, each thread writes to its own 400 MB buffer.
LATTester is our tool for running microbenchmarks that measure the latency and bandwidth through a combination of load/store (64-byte, 128-byte and 256-byte granularity) and flush (clflush, clflushopt, clwb and non-temporary store) instructions. To ensure timing results are accurate, we take a number of precautions. To avoid interference with other software, we built LATTester as a kernel module that exposes a mock DAX file system interface and works on a pmem device in fsdax mode. It runs kernel threads that pin to specific cores with IRQ disabled, so it will not be descheduled. Like MLC, we disable prefetching. For latency tests, an mfence instruction is inserted after each load/store to prevent pipelining from affecting timing results.
3.1 Latency
In this subsection, we investigate the latency of operations to Optane DC memory under several conditions and explore how its latency changes in comparison to DRAM.
3.1.1 Read Latency
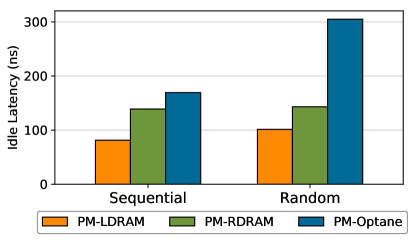
The most basic latency measurement is the latency of a single access to a local Optane DC PMM. Such a measurement assumes that the access misses in the entire cache hierarchy as would happen when the system is idle and the cache is cold. We use MLC to measure the raw read latency by timing the latency of reading a random cacheline on a single core. Since MLC turns off prefetching, this load access is guaranteed to touch Optane DC memory.
Our next experiment investigates the sequential read latency of the Optane DC PMM. We again use MLC to measure the latency of sequential loads with prefetching turned off. Like the previous read latency test, we measure this latency using a single core. Figure 7 shows the evaluation result for both random and sequential accesses, for local Optane DC memory and demonstrates that Optane DC memory improves its performance under sequential accesses, indicating some amount of on-DIMM prefetching and batching logic.
Observation 1.
The read latency of random Optane DC memory loads is 305 ns
This latency is about 3 slower than local DRAM.
Observation 2.
Optane DC memory latency is significantly better (2) when accessed in a sequential pattern.
This result indicates that Optane DC PMMs merge adjacent requests into a single 256
byte access.
3.1.2 Memory Instruction Latency
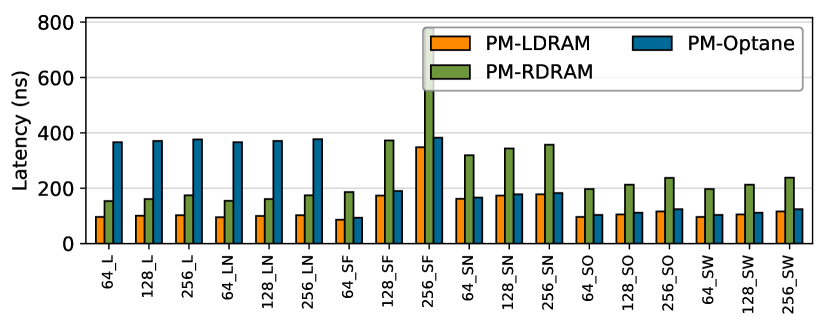
Our next experiment shows the raw latency for a variety of ways of accessing Optane DC memory. Using our LATTester tool, this microbenchmark measures the latency of memory access instructions for a combination of load/store, flush and fence instructions used to access a persistent memory region. The test runs on a single kernel thread over the first 16 GB region of a pmem device. We use 256-bit SSE instructions (64-bit instructions show similar results), and record the timing for each set of instructions executed one million times over sequential and pre-calculated random addresses. We drain the CPU pipeline before each access and issue an mfence after each access.
Figure 8 shows the median latency for a variety of instruction sequences. Along the x-axis, we use Size_Type to identify different types of persistent memory accesses, where the type can be one of the following: L stands for regular loads, LN stands for non-temporal loads, SF stands for stores followed by clflush, SN stands for non-temporal stores, SO stands for stores followed by clflushopt, and SW stands for stores followed by clwb.
As shown in the data, the load latency of PM-Optane is higher, whereas the store latency of PM-Optane is similar to PM-LDRAM since it is hidden within the ADR domain. Finally, for small accesses, clflushopt and clwb give better performance than clflush or non-temporal stores.
Observation 3.
For small accesses, clflushopt and clwb give better performance
than clflush or non-temporal stores.
This result demonstrates the utility of ISA modifications in support
of persistent memory.
3.2 Bandwidth
This subsection investigates the bandwidth of the Optane DC PMM under varying loads and conditions.
3.2.1 Maximum Bandwidth
Our first bandwidth experiment explores the maximum read and write bandwidth of the memory device. We use the MLC tool to spawn threads that spin issuing sequential reads or writes. By gradually increasing the thread count, we find the point at which the memory device’s bandwidth becomes saturated. We use up to 23 threads (leaving one core of the CPU idle to avoid contention). Figure 9 has the result.
For read accesses, PM-Optane keeps scaling with the thread count but at a lower rate than PM-LDRAM. For non-cached writes, PM-Optane peaks at four threads and then stops scaling, whereas both PM-LDRAM and PM-Optane show better scalability.

Observation 4.
Our six interleaved
Optane DC PMMs’ maximum read bandwidth is 39.4 GB/sec, and their
maximum write bandwidth is 13.9 GB/sec. This experiment
utilizes our six interleaved Optane DC PMMs, so accesses are spread across the devices.
Observation 5.
Optane DC reads scale with thread count; whereas writes do not.
Optane DC memory bandwidth scales with thread count, achieving maximum throughput
at 17 threads. However, four threads are enough to saturate Optane DC memory write bandwidth.
3.2.2 Concurrency and Bandwidth
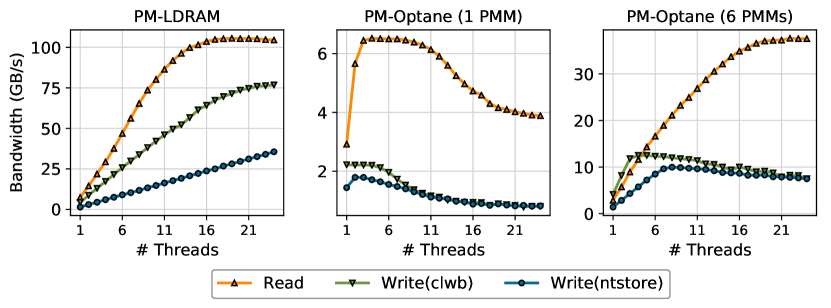
In this section, we measure Optane DC and DRAM bandwidth for random and sequential reads and writes under different levels of concurrency. Figure 10 shows the bandwidth achieved at different thread counts for sequential accesses with 256 B access granularity. We show loads and stores (Write(ntstore)), as well as cached writes with flushes (Write(clwb)). All experiments use AVX-512 instructions and access the data at 64 B granularity. The left-most graph plots performance for interleaved DRAM accesses, while the center and right-most graphs plot performance for non-interleaved and interleaved Optane DC. In the non-interleaved measurements all the accesses go to a single DIMM.
The data shows that DRAM bandwidth is both significantly higher than Optane DC and scales predictably (and monotonically) with thread count until it saturates the DRAM’s bandwidth and that bandwidth is mostly independent of access size.
The results for Optane DC are wildly different. First, for a single DIMM, the maximal read bandwidth is 2.9 of the maximal write bandwidth (6.6 GB/s and 2.3 GB/s respectively), where DRAM has a smaller gap (1.3) between read and write bandwidth.
Second, with the exception of interleaved reads, Optane DC performance is non-monotonic with increasing thread count. For the non-interleaved (i.e., single-DIMM) cases, performance peaks at between one and four threads and then tails off. Interleaving pushes the peak to twelve threads for store+clwb.
3.2.3 Access Size and Bandwidth
Figure 11 shows how performance varies with access size. The graphs plot aggregate bandwidth for random accesses of a given size. We use the best-performing thread count for each curve (given as “load thread count/ntstore thread count/store+clwb thread count” in the figure). Note that the best performing thread count for PM-Optane(Read) varies with different access sizes for random accesses, where 16 threads show good performance consistently.
Note that Optane DC bandwidth for random accesses under 256 B is poor. This “knee” corresponds to the Optane DC’s access granularity of 256 bytes. DRAM bandwidth does not exhibit a similar “knee” at 8 kB (the typical DRAM page size), because the cost of opening a page of DRAM is much lower than accessing a new page of Optane DC.
Interleaving (which spreads accesses across all six DIMMs) adds further complexity: Figure 11(right) measures bandwidth across six interleaved NVDIMMs as a function of access size. Interleaving improves peak read and write bandwidth by 5.8 and 5.6, respectively. These speedups match the number of DIMMs in the system (6) and highlight the per-DIMM bandwidth limitations of Optane DC. The most striking feature of the graph is a dip in performance at 4 KB — we believe this dip is an emergent effect caused by contention at the iMC, and it is maximized when threads perform random accesses close to the interleaving size.
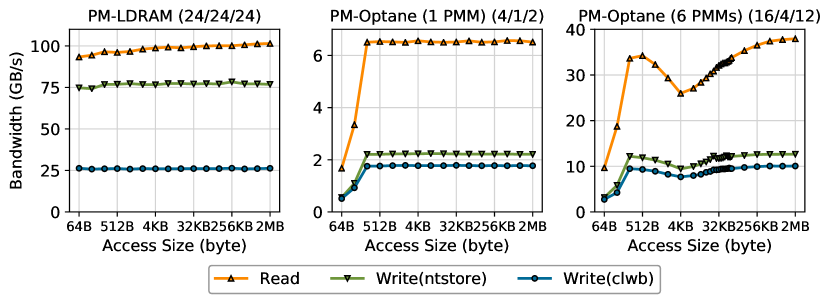
Observation 6.
The application-level Optane DC bandwidth is affected by access size. To fully utilize the Optane DC device bandwidth, 256 byte or larger accesses are preferred.
3.2.4 Bandwidth under Mixed Workloads
This experiment investigates the device’s memory bandwidth under varying patterns of reads and writes. The experiment, using Intel’s MLC tool, measures the bandwidth using multiple threads accessing memory in a sequential pattern, where each thread is performing one configuration that issues reads, writes or non-temporal writes (writes that bypass the CPU caches), or a combination of two types of instructions. Figure 12 shows the results.
Mixing reads and writes hurts Optane DC performance more than DRAM. For pure reads and writes (see Section 3.2.1), the PM-LDRAM outperforms PM-Optane by 2.90 and 5.72, and PM-RDRAM achieves 0.87 performance to PM-Optane on read and outperforms by 2.39 on write. whereas for mixed workloads, both PM-LDRAM and PM-RDRAM outperform PM-Optane by a large margin (up to 12.0 and 7.5 respectively).
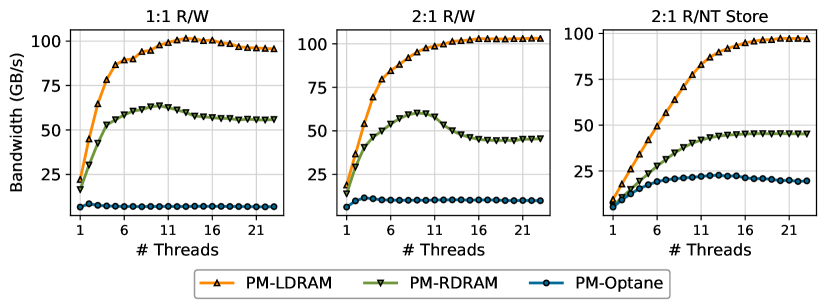
Observation 7.
Optane DC is more affected than DRAM by access patterns. Optane DC memory
is vulnerable to workloads with mixed reads and writes.
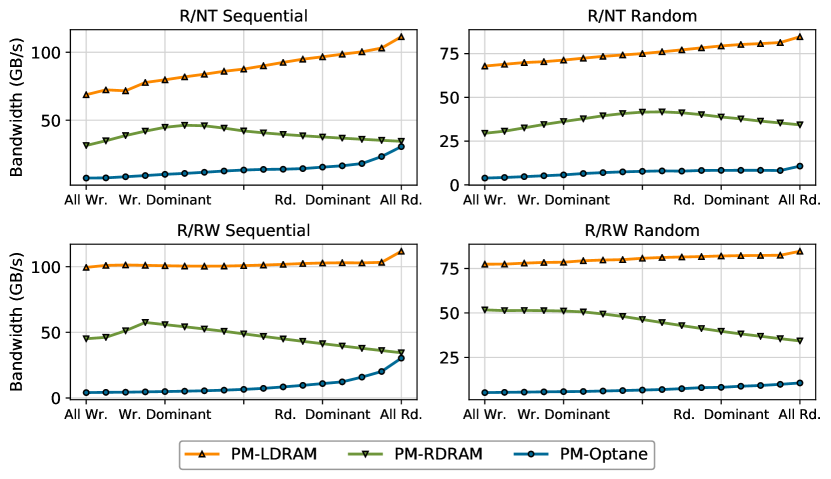
Finally, we run a mix of read and write workloads. For each run, we use sixteen total threads and change the number of read and write threads. Figure 13 shows the result. As expected, PM-Optane shows best result on all-read scenarios, and performs much better on sequential workloads.
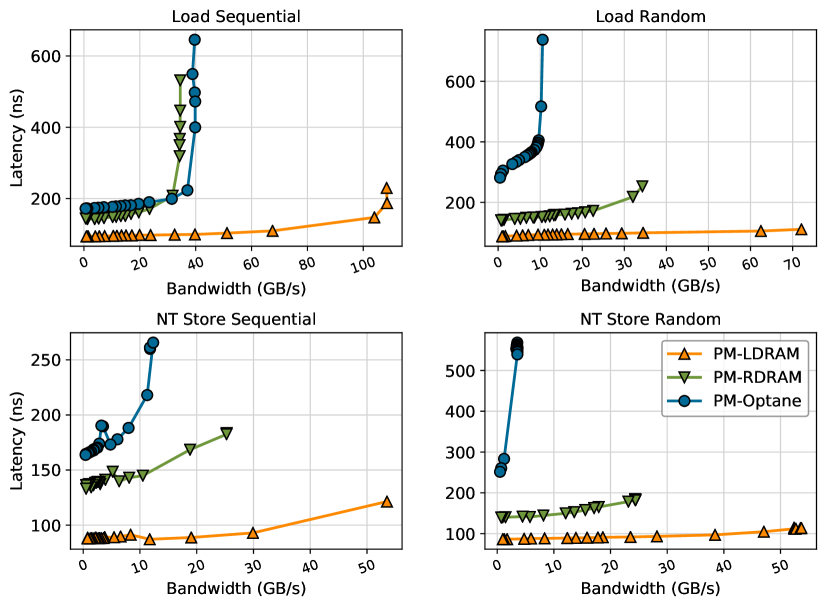
3.2.5 Performance under Load
Our final experiment examines how latency and bandwidth vary under load by gradually increasing the load on the device. In this test, we use MLC and use 23 threads for loads, and, for non-temporal stores, we use 12 threads. Each of the worker threads repeatedly accesses memory. Each thread performs memory accesses to cache lines and delays for a set interval between two accesses. For each delay interval, varying from 0 to 80 s, we plot the latency and bandwidth in Figure 14. When the delay time is zero (corresponding to the right side of the graph), the bandwidth is close to the maximum bandwidth and latency skyrockets as queuing effects dominate. When the delay time is high enough (80 s, corresponding to the left side of the graph), the latency is close to the raw, unloaded, latency. The “knee” in the graph shows the point at which the device is able to maintain steady bandwidth without suffering from queuing effects. The experimental results show that the Optane DC PMM’s performance deviates significantly from DRAM. In particular, the Optane DC PMM’s read bandwidth tops out much lower limits than DRAM: 38.9 GB/sec for Optane DC vs 105.9 GB/sec for DRAM on sequential accesses, and 10.3 GB/sec for Optane DC vs 70.4 GB/sec for DRAM on random accesses. We observe a similar effect on sequential writes: Optane DC PMM’s write bandwidth tops out around 11.5 GB/sec while the DRAM achieves 52.3GB/sec when fully loaded.
Observation 8.
Optane DC bandwidth is significantly higher (4) when accessed in a sequential pattern.
This result indicates that Optane DC PMMs contain access to merging logic to merge overlapping
memory requests — merged, sequential, accesses do not pay the write amplification cost associated
with the NVDIMM’s 256 byte access size.
4 Optane DC as Main Memory
The advent of Intel® Optane™ DC Persistent Memory Modules means that large memory devices are now more affordable — the memory capacity of a single host has increased, and the unit cost of memory has decreased. By using Optane DC PMMs, customers can pack larger datasets into main memory than before.
In this section, we explore Optane DC memory’s performance when placed in the role of a large main memory device, and therefore use system configurations that vary the device underlying the DRAM interface (MM-LDRAM, MM-Optane-Cached, and MM-Optane-Uncached). Naturally, two questions arise:
-
1.
How does slower Optane DC memory affect application performance?
-
2.
Is the DRAM cache effective at hiding Optane DC’s higher latency and lower bandwidth?
To understand how slower Optane DC memory impacts performance when used as application memory, we run existing applications on Optane DC without modifying them. These applications generate memory footprints that fit in both DRAM and Optane DC, and can be found in Sections 4.1 and 4.2. In these tests, Optane DC memory can be considered to be a larger capacity (but slower) alternative to DRAM. These tests include three standardized benchmark suites: SPEC CPU 2006 [18], SPEC CPU 2017 [3], and PARSEC [40].
To investigate the effectiveness of using DRAM as a cache for Optane DC memory, we run applications with workloads that exceed the DRAM capacity of the system. We use two in-memory data stores (Memcached [22] and Redis [30]), and adjust their workset size to exceed DRAM capacity. These experiments can be found in Sections 4.3 and 4.4
4.1 SPEC CPU 2006 and 2017
SPEC CPU [18, 3] is a popular benchmark suite for measuring CPU performance. We use SPEC CPU to investigate how Optane DC memory impacts system performance when used as the primary main memory device, since SPEC CPU exercises both the processor and memory hierarchy. SPEC CPU contains a wide range of benchmarks, and these benchmarks can be divided into integer and floating point groups, indicating what the majority of their computation handles. The included benchmarks are different between the 2006 and 2017 versions of SPEC — as such we used both for our tests. The memory footprint of SPEC CPU workloads varies from several megabytes to several gigabytes [21], so they easily fit into memory on our test system.
Both SPEC suites include speed and rate variants, called SPECspeed and SPECrate respectively. SPECspeed tests the system with a single instance of the benchmark (all benchmarks are single threaded). In contrast, SPECrate measures the system throughput with multiple task copies running as separate processes. SPEC 2006 uses the same benchmarks for both rate and speed, whereas SPEC 2017 creates different versions of a benchmark for rate and speed (therefore SPEC 2017 contains four benchmark sub-suites: int speed, int rate, float speed and float rate). For SPECrate, we use 24 copies of each benchmark to fully occupy all the cores on a single socket. We use the default configuration throughout all tests.
We report our results in terms of speedup relative to the execution time of the local DRAM configuration (MM-LDRAM). These results can be found in Figures 16 through 18.
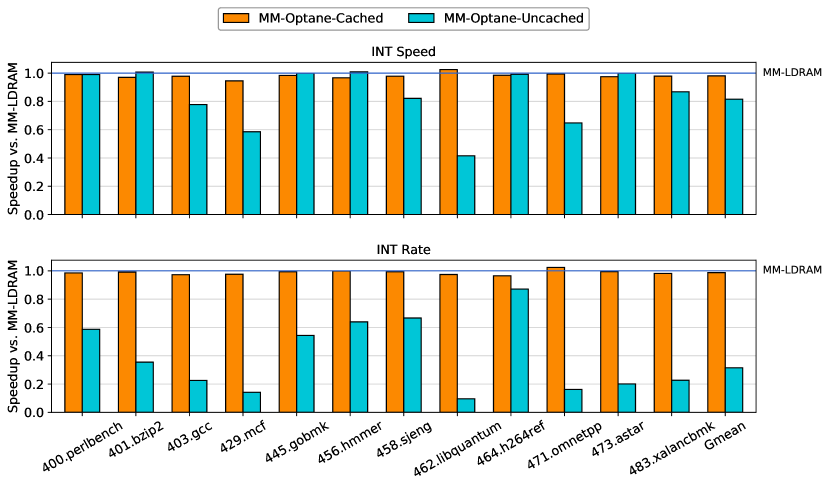
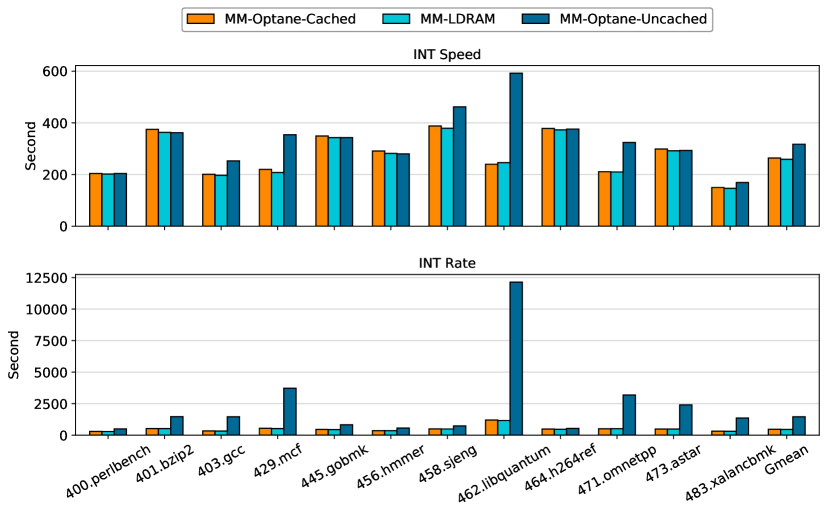
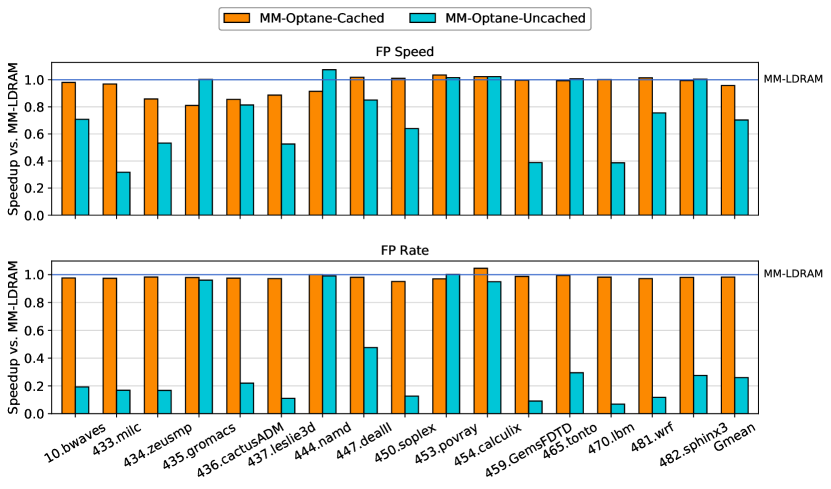
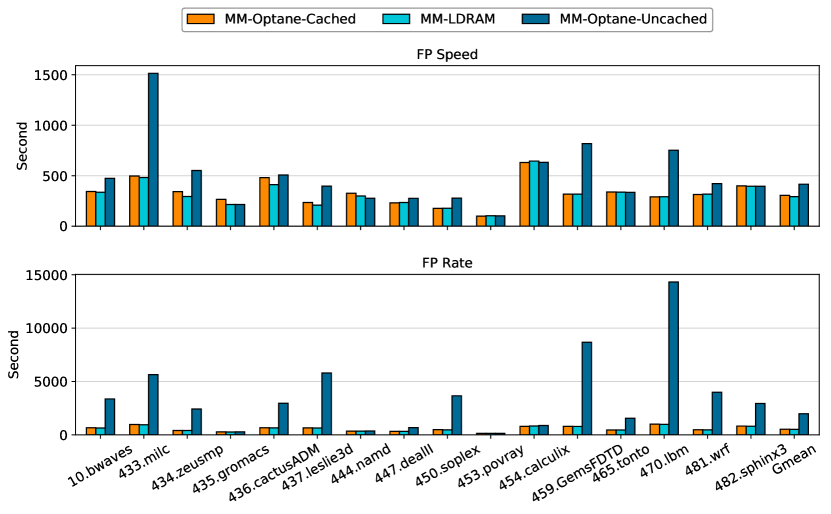
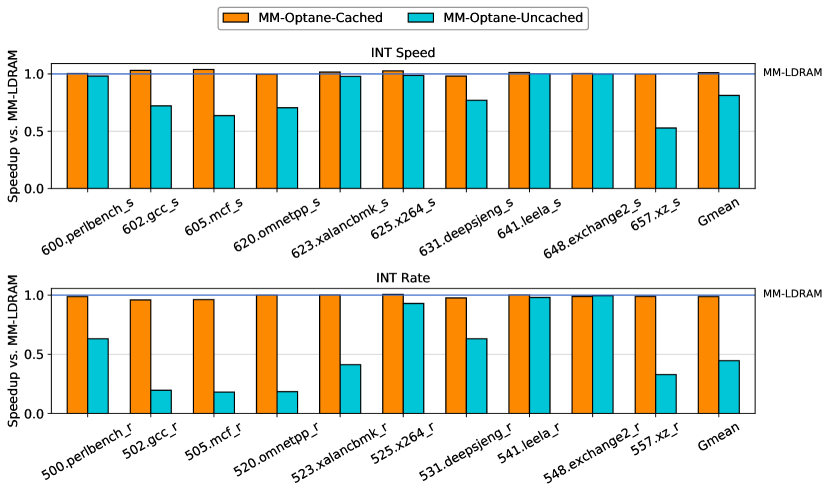
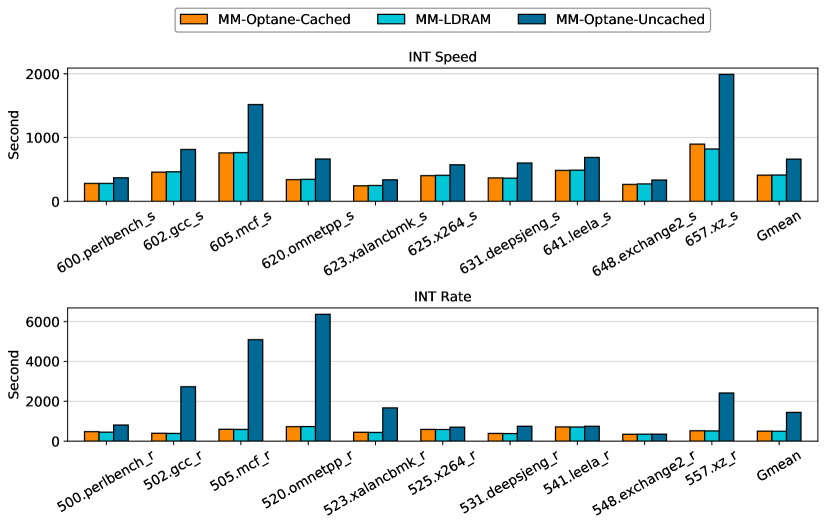
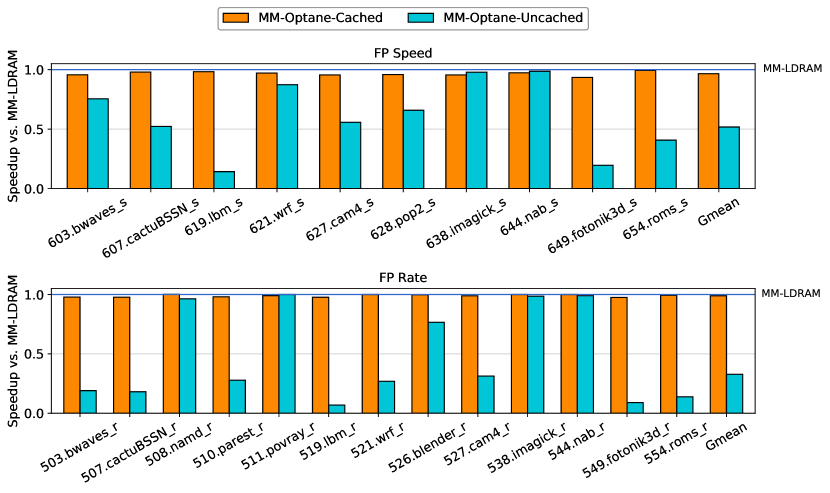
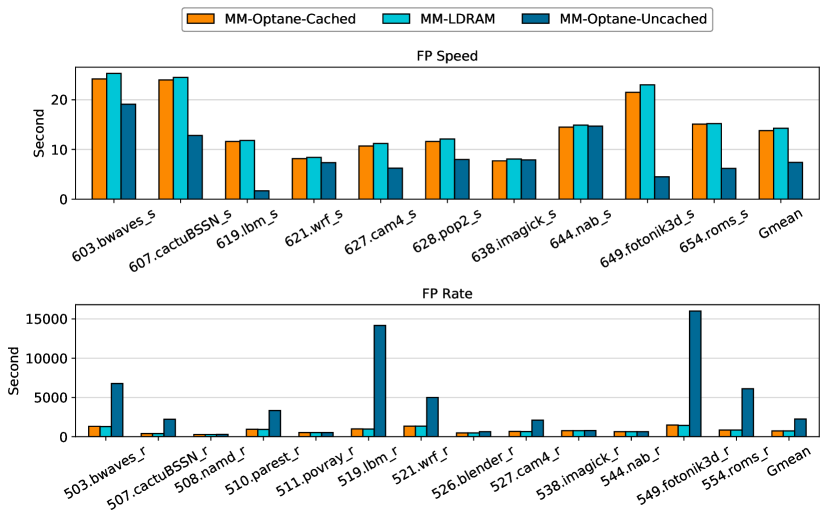
Our SPEC CPU tests demonstrate a number of points. First, in general, DRAM outperforms cached Optane DC memory, and cached outperforms uncached Optane DC. Second, uncached Optane DC memory is significantly slower in the rate test as multiple copies of the same workloads in the rate test saturate the memory bandwidth. Third, cached Optane DC memory is almost as fast as DRAM, which indicates the effectiveness of DRAM cache for relatively small memory footprints. Finally, certain workloads show better performance on uncached Optane DC memory than DRAM in the speed test; we are still investigating this result.
Observation 9.
The DRAM cache is effective for workloads with small memory footprints.
With the Optane DC PMM cached mode, workloads that fit in DRAM are unaffected by Optane DC memory’s
higher latency and lower throughput.
4.2 PARSEC
PARSEC [40] is a benchmark suite for testing multi-processors. Similar to SPEC, PARSEC tests the CPU and memory hierarchy of the system, however, unlike SPEC, PARSEC is a multi-threaded benchmark suite. Users can specify the number of threads, and we scale the thread count from one to sixteen for each benchmark throughout our tests. We use the largest default input to create the largest possible memory footprint. We tuned the iteration parameter to run the benchmark for an adequate length of time, but we keep the rest of the configuration set to its default values.
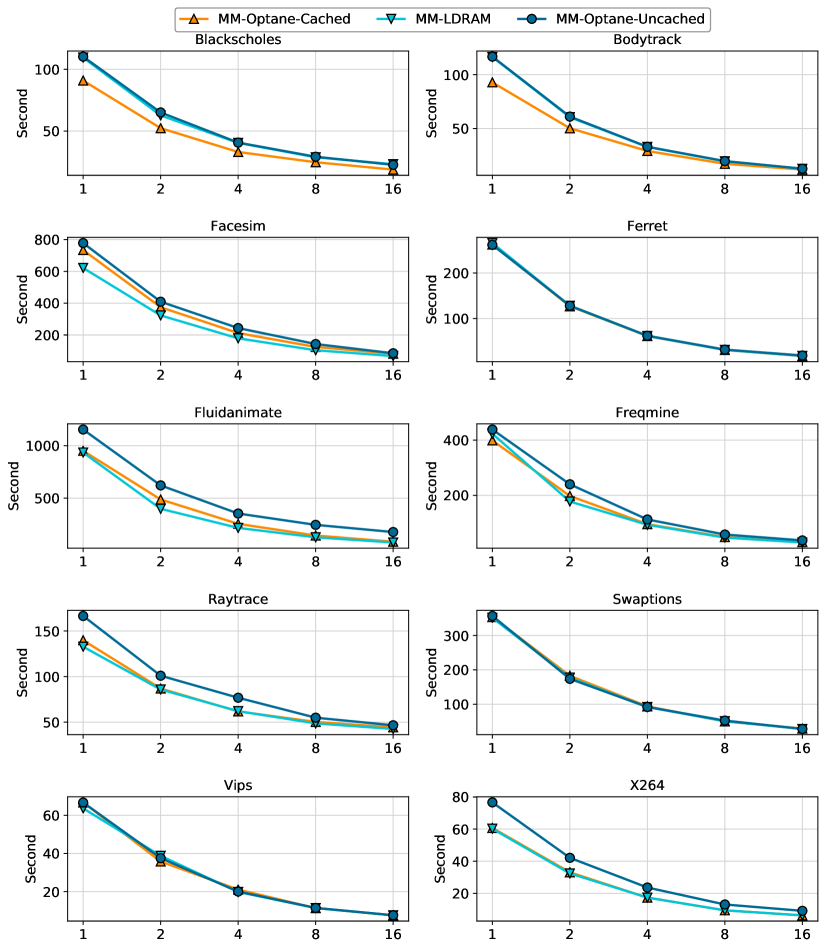
As Figure 19 shows, we only observe performance differences on facesim, fluidanimate, raytrace, freqmine and x264, because the memory footprints for the rest of the benchmarks can fit into the last level cache on chip. Among those workloads that display differences, we observe a performance gap between uncached Optane DC memory and DRAM that increases as the number of threads increases and the Optane DC memory bandwidth gets saturated. In general, DRAM outperforms the other two memory settings, while cached Optane DC has a close performance to DRAM, indicating the DRAM cache’s utility for small memory footprints.
Observation 10.
Optane DC memory’s lower bandwidth can impact real-world applications.
Optane DC memory’s bandwidth can be saturated with real-world multi-threaded applications,
resulting in a performance overhead when using uncached Optane DC as main memory.
4.3 Memcached
Memcached [22] is a popular in-memory key-value store used to accelerate web applications. It uses slab allocation to allocate data and maintains a single hash-table for keys and values. We investigated memcached performance for both different types of workloads (read or write dominant) and different total data sizes.
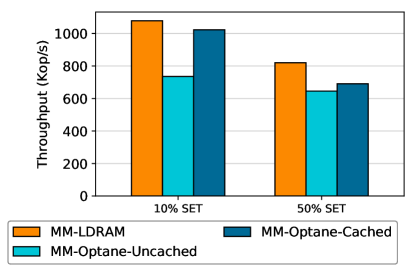
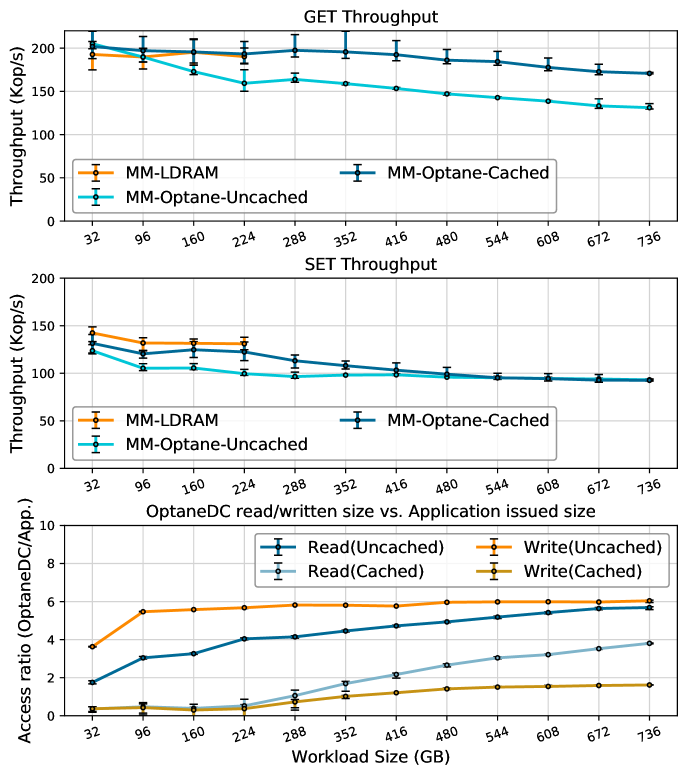
In our first experiment, to investigate how read/write performance is impacted by memory type, we run two workloads: a GET-dominant (10% SET) workload, and a SET-dominant (50% SET) workload. The key size is set at 128 Byte and the value size is set as 1 KB, and the total memcached object storage memory size is set to 32 GB. For each run, we start the memcached server with an empty cache. We use the memaslap [1] tool to generate the workload, and set the thread count to 12 and the concurrency to 144 (each thread can have up to 144 requests pending at once). Both server and client threads are bound to dedicated cores on the same physical CPU. Figure 20 shows the throughput among different main memory configurations. This result demonstrates the real-world impact of Optane DC memory’s asymmetry between reads and writes, since the DRAM cache is effective at hiding read latency, but has more trouble hiding write latency.
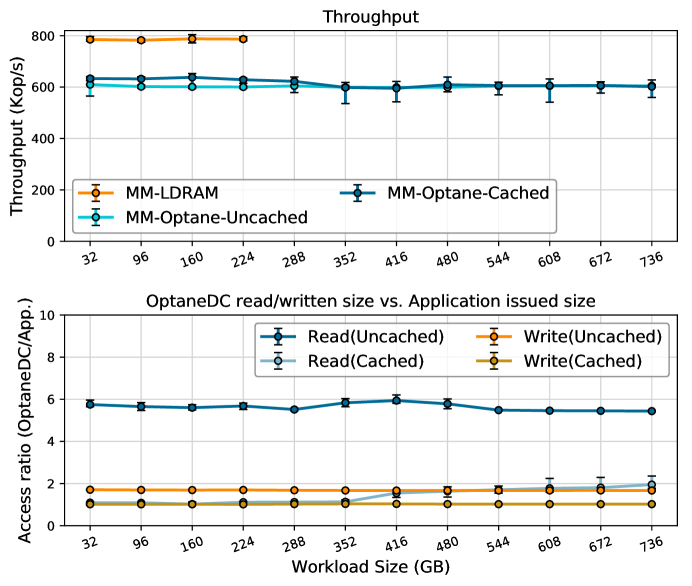
In our second experiment, we vary the total size of the memcached object store. We run memcached with the 50% SET workload as above and adjust the total size of the memcached store (between 32 GB and 768 GB). For each run, we add a warm-up phase before test execution. The warm-up time and execution time are increased proportionally to the memcached store size.
Figure 21 shows two types of graphs. The top shows the throughput of the different main memory configurations. The lower graph, in order to view the effectiveness of the DRAM cache, shows the size ratio between client-requested accesses (that is, key and value size as reported by memaslap) and the total size of accesses that actually reached Optane DC memory in MM-Optane-Cached and MM-Optane-Uncached mode using device-level counters on the Optane DC PMM. Note the machine has 192 GB DRAM on the local socket and another 192 GB on the remote socket, so at some point the memcached store no longer only fits in the DRAM cache. Due to write amplification, both within the application and within the Optane DC PMM itself, Optane DC memory may experience more bytes written than total bytes requested from the client.
4.4 Redis
Redis [30] is an in-memory key-value store widely used in website development as a caching layer and for message queue applications. While Redis usually logs transactions to files, we turned off this capability in order to tests its raw memory performance. Our Redis experiment uses workloads issuing pure SETs followed by pure GETs. Each key is an 8-byte integer and each value is 512 bytes, and we run both the server and 12 concurrent clients on the same machine. As with memcached, for the Optane DC memory modes, we recorded the proportion of memory accesses that were seen by Optane DC memory versus the combined value size of the requests issued by the client. Figure 22 shows the result (thoughput in the top two graphs, and access ratio below).
In this experiment, MM-Optane-Cached is effective when the workload fits into DRAM. The benefit of the cache on SET requests decreases as the workload size increases. As with memcached, the DRAM cache can effectively reduce the data accesses to the actual Optane DC media.
5 Optane DC as Persistent Storage
Intel® Optane™ DC Persistent Memory Modules have the potential to profoundly affect the performance of storage systems. This section explores the performance of Optane DC as a storage technology underlying various file systems. For this section, we use DRAM as the system memory, and use either memory-based (e.g. Optane DC or DRAM) or disk-based (e.g. Optane or Flash SSD) storage underneath the file system. These options correspond to the system configurations PM-LDRAM, PM-RDRAM, PM-Optane, SSD-Optane, and SSD-SATA.
We are interested in answering the following questions about Optane DC memory as storage:
-
1.
How well do existing file systems exploit Optane DC memory’s performance?
-
2.
Do custom file systems for NVMM give better performance than adaptations of block-based file systems?
-
3.
Can using a load/store interface (DAX) interface to persistent memory improve performance?
-
4.
How well do existing methods of emulating NVMM (namely, running the experiment on DRAM) actually work?
We explore the performance of Optane DC memory as a storage device using a number of different benchmarks. We first investigate basic performance by running raw file operations in Section 5.1, synthetic I/O in Section 5.2, and emulated application performance in Section 5.3. Next, in Sections 5.4 through 5.10, we explore application performance with the workloads listed in Table 4.
We evaluate seven file systems and file system configurations with these benchmarks. Each benchmark runs on all file systems, mounted on the three memory configurations and the two SSD configurations (when compatible).
Ext4 Ext4 is a widely deployed Linux file system. This configuration runs Ext4 in normal (i.e., non-DAX) mode with its default mount options and page cache. Ext4 only journals its metadata for crash consistency, but not data, which means a power failure that occurs in the middle of writing a file page can result in a torn page.
Ext4-DJ This mode of Ext4 provides stronger consistency guarantees than its default setting by journaling both file system metadata and file data updates. It ensures every write() operation is transactional and cannot be torn by a power failure.
Ext4-DAX Mounting Ext4 with the DAX option bypasses the page cache. Therefore, Ext4-DAX accesses data directly in memory (that is, on the Optane DC device). It is not compatible with the data journaling feature, so Ext4-DAX can not provide consistency guarantees for file data writes.
XFS XFS is another popular Linux file system. This configuration uses the file system in its default (i.e., non-DAX) mode. Similar to Ext4, XFS also uses the page cache and does not provide failure-atomic data writes to files.
XFS-DAX This is the DAX mode for XFS. Similar to Ext4-DAX, this mode does not use the page cache and also does not provide data consistency guarantees.
NOVA NOVA [37, 38] is a purpose-built NVMM file system. It implements a log-structured metadata and a copy-on-write mechanism for file data updates to provide crash-consistency guarantees for all metadata and file data operations. NOVA only operates with Optane DC devices in DAX mode, bypassing the page cache, and consequentially is incompatible with block-based devices.
NOVA-Relaxed In this mode, NOVA relaxes its consistency guarantees for file data updates, by allowing in-place file page writes, to improve write performance for applications that do not require file data consistency for every write. This mode still guarantees metadata consistency for all file system operations.
5.1 File Operation Latency
We begin by taking basic performance measurements on our file systems. We measure single-threaded system call latencies for the following file system operations:
-
•
Create: Create a file with open(), and close() it, without writing any file data or calling fsync().
-
•
Append (4K): open() an existing file, write() 4 KB of data to its end, call fsync(), and close() the file.
-
•
Write (4K): open() an existing file, write() 4 KB of data to the middle, call fsync(), and close() the file.
-
•
Write (512B): open() an existing file, write() 512 bytes of data to the middle, call fsync(), and close() the file.
-
•
Read (4K): open() an existing file, read() 4 KB of data, and close() the file.
Figure 23 shows the measured operation latencies. Non-DAX file systems (hatched bars) experience the longest latencies on the SATA SSD. Their write performance, however, is the best on the Optane SSD, implying their write() and fsync() paths are not optimized for memory-type storage.
On DRAM and Optane DC devices, Ext4-DAX and XFS-DAX show better write latency numbers than their non-DAX counterparts. Purpose-built NOVA and NOVA-Relaxed file systems outperform conventional file systems for create and append operations. NOVA’s write latency is longer than Ext4-DAX, especially for 512 byte writes, because NOVA performs page-level copy-on-write for file data consistency. NOVA-Relaxed regains performance by allowing in-place file data writes.
For memory-type storage devices, Optane DC’s longer latency than DRAM affects all file systems, increasing their operation latencies by between 3.3% (XFS-DAX) and 156% (NOVA).
DAX-enabled file systems (Ext4-DAX, XFS-DAX, NOVA, and NOVA-Relaxed) all have similar read latency numbers, and they all increase latency when moving from DRAM to Optane DC. In comparison, read latencies of non-DAX file systems are less affected because they still leverage the DRAM-based page cache to hide the Optane DC memory’s latency.
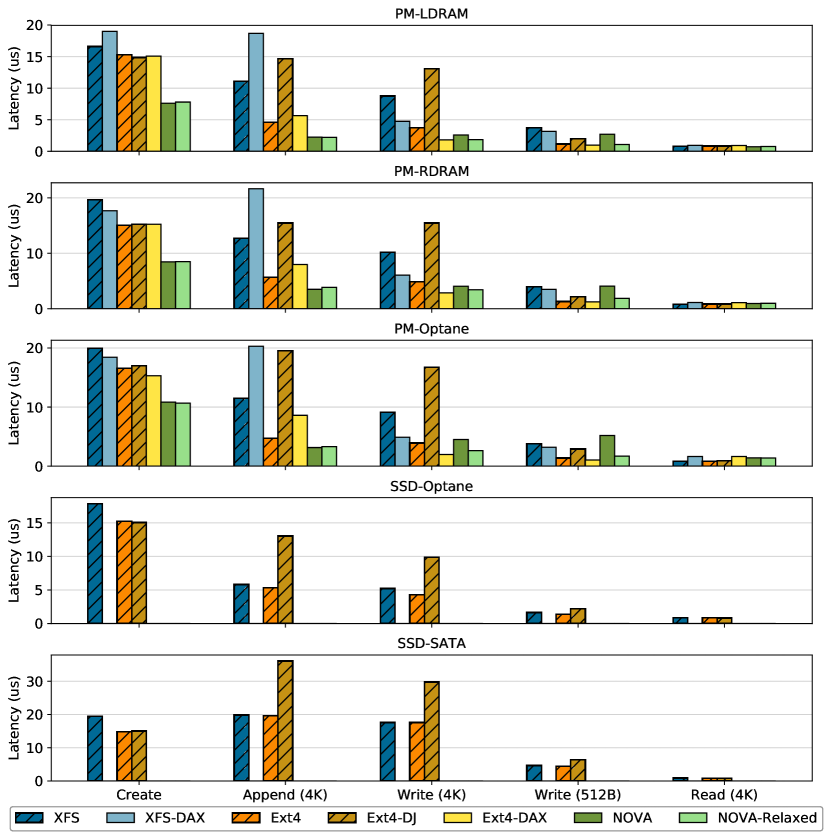
Observation 11.
Non-DAX file systems can outperform DAX file systems on Optane DC because
non-DAX file systems benefit from the fast DRAM page cache. For non-DAX systems, the page cache
can serve to hide the read latency of Optane DC memory.
Observation 12.
The relatively long latency of Optane DC can amplify small
inefficiencies in file system designs. NOVA’s copy-on-write
mechanism for ensuring strong consistency of data writes incurs extra latency overhead.
5.2 FIO Bandwidth
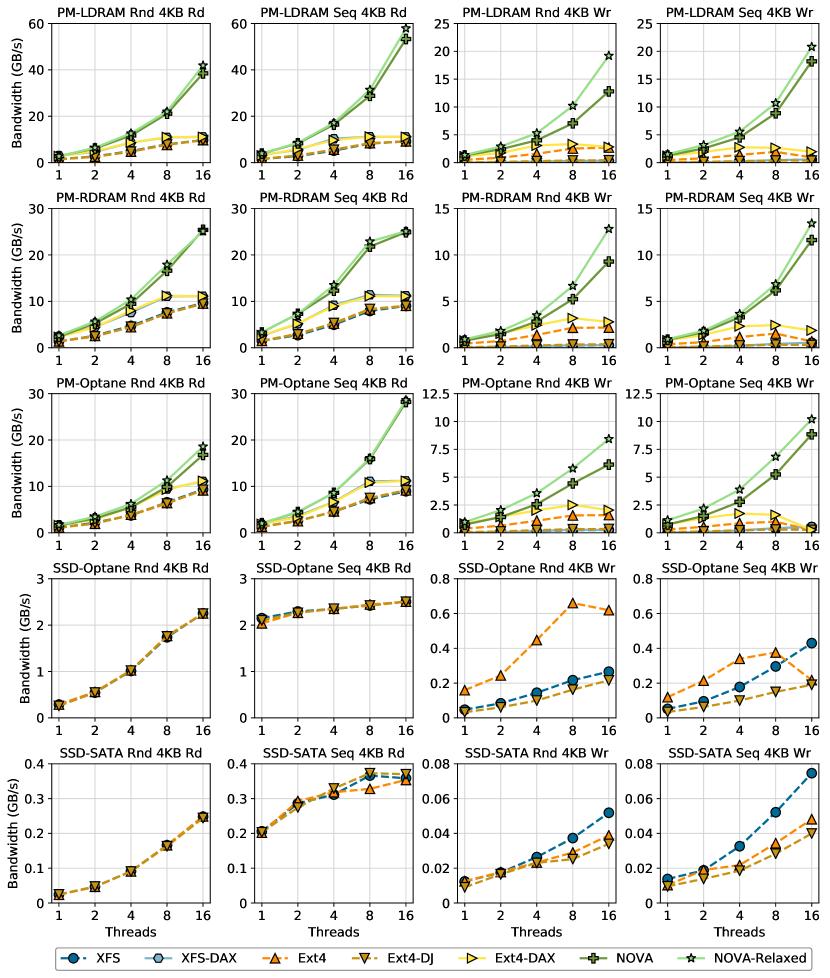
FIO is a versatile storage benchmark tool that can generate synthetic I/O traffic to emulate practical workloads. We run FIO to measure the bandwidth of basic read/write file operations.
We run FIO v3.11 using the “sync” ioengine with four types of read/write workloads: sequential read, random read, sequential write, and random write. All workloads use a 512 MB file size per thread and 4 KB read or write size (“blocksize”). For write workloads, we issue an fsync() after writing every 4 KB file data. Each workload runs for 30 seconds, and the number of threads vary from one to sixteen, with each thread accessing a different file. FIO by default invalidates a file’s page cache before performing each IO operation, and therefore, for non-DAX file systems (Ext4, Ext4-DJ, and XFS) their read paths copy data twice: first from the storage media to the page cache, and then from the page cache to a user buffer. Figure 24 illustrates the FIO bandwidths with different file system and storage configurations.
5.3 Filebench
Filebench [33] is a popular storage benchmark suite that mimics the behavior of common storage applications. We ran four of the predefined workloads, and their properties are summarized in Table 3.
| Fileserver | Varmail | Webproxy | Webserver | |
| nfiles | 500 K | 1 M | 1 M | 500 K |
| meandirwidth | 20 | 1 M | 1 M | 20 |
| meanfilesize | 128 K | 32 K | 32 K | 64 K |
| iosize | 16 K | 1 M | 1 M | 1 M |
| nthreads | 50 | 50 | 50 | 50 |
| R/W Ratio | 1:2 | 1:1 | 5:1 | 10:1 |
-
1.
fileserver emulates the I/O activities of a file server with write-intensive workloads. It performs mixed operations of creates, deletes, appends, reads, and writes.
-
2.
varmail emulates a mail server that saves each email in a separate file, producing a mix of multi-threaded create-append-sync, read-append-sync, read, and delete operations.
-
3.
webproxy emulates the I/O activities of a a simple web proxy server. The workload consists of create-write-close, open-read-close, delete, and proxy log appending operations.
-
4.
webserver emulates a web server with read-intensive workloads, consisting of open-read-close activities on multiple files and log appends.
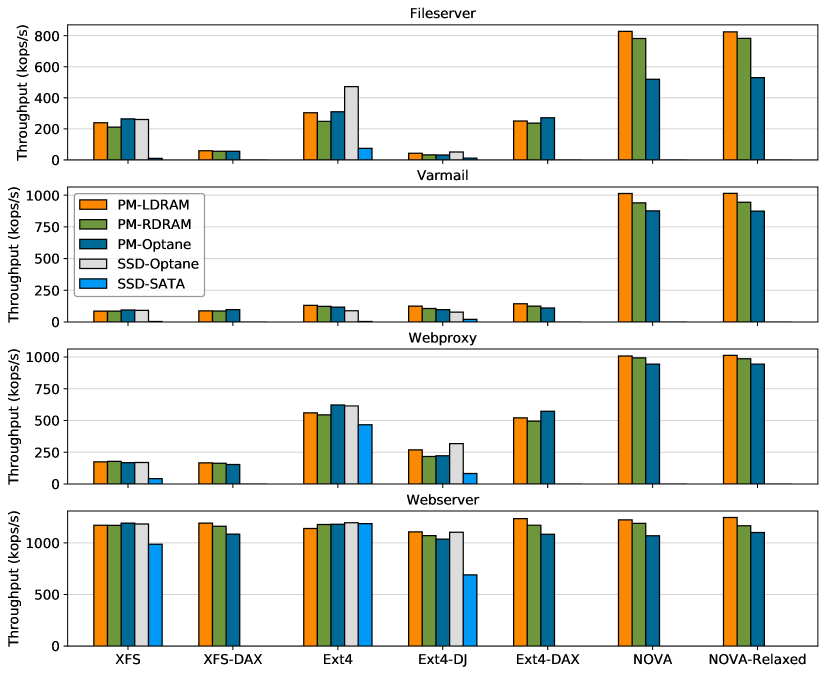
Figure 25 presents the measured throughput using Filebench workloads. The tested file systems perform similarly on read-intensive workloads (e.g. webserver), however, NOVA and NOVA-Relaxed outperform others when more write traffic is involved (e.g. fileserver and varmail). On average, NOVA is faster than other evaluated file systems by between 1.43 and 3.13, and NOVA-Relaxed is marginally faster than NOVA. Interestingly, ext4 performs better on block devices than even DRAM. Investigation of this anomaly suggested inefficiencies in ext4’s byte-granularity code path are responsible.
Observation 13.
Small random writes can result in drastic performance differences between
DRAM emulation and real Optane DC memory. PM-Optane impacts NOVA
and NOVA-Relaxed most with the fileserver workload because it generates lots
of small random writes that consequently cause write amplification on
Optane DC PMMs.
5.4 RocksDB
Having taken simple measurements using microbenchmarks and emulated workloads for basic system performance, we transition to larger scale application workloads; detailed workload descriptions and their runtime arguments can be found in Table 4.
| Application | Version | Type | Benchmark | Workload |
|---|---|---|---|---|
| RocksDB | 5.4 | Embedded | db_bench | K/V=16B/100B, 10M random SET, 1 thread |
| Redis | 3.2 | Client/server | redis-benchmark | K/V=4B/4B, 1M random MSET, 1 thread |
| Kyoto Cabinet | 1.2.76 | Embedded | kchashtest | K/V=8B/1KB, 1M random SET, 1 thread |
| MySQL | 5.7.21 | Client/server | TPC-C | W10, 1 client for 5 minutes |
| SQLite | 3.19.0 | Embedded | Mobibench | 1M random INSERT, 1 thread |
| LMDB | 0.9.70 | Embedded | db_bench | K/V=16B/96B, 10M sequential SET, 1 thread |
| MongoDB | 3.5.13 | Client/server | YCSB | 100k ops of Workload A,B, 1 thread |
RocksDB [16] is a high-performance embedded key-value store, designed by Facebook and inspired by Google’s LevelDB [13]. RocksDB’s design is centered around the log-structured merge tree (LSM-tree), which is designed for block-based storage devices, absorbing random writes and converting them to sequential writes to maximize hard disk bandwidth.
RocksDB is composed of two parts: a memory component and a disk component. The memory component is a sorted data structure, called the memtable, that resides in DRAM. The memtable absorbs new inserts and provides fast insertion and searches. When applications write data to an LSM-tree, it is first inserted to the memtable. The memtable is organized as a skip-list, providing O(log n) inserts and searches. To ensure persistency, RocksDB also appends the data to a write-ahead logging (WAL) file. The disk component is structured into multiple layers with increasing sizes. Each level contains multiple sorted files, called the sorted sequence table (SSTable). When the memtable is full, it is flushed to disk and becomes an SSTable in the first layer. When the number of SSTables in a layer exceeds a threshold, RocksDB merges the SSTables with the next layer’s SSTables that have overlapping key ranges. This compaction process reduces the number of disk accesses for read operations.
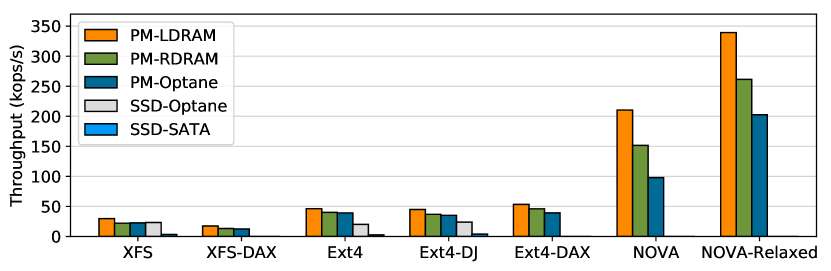
RocksDB makes all I/O requests sequential to make the best use of hard disks’ sequential access strength. It supports concurrent writes when the old memtable is flushed to disk, and only performs large writes to the disk (except for WAL appends). However, WAL appending and sync operations can still impact performance significantly on NVMM file systems. Using the db_bench benchmark, we investigate the SET throughput with 20-byte key size and 100-byte value size, syncing the database after each SET operation. We illustrate the result in Figure 26. Note that the frequent use of sync operations in the application significantly hurts the performance of most file systems, though NOVA-type file systems maintain their performance through the use of an NVM-optimized sync operation.
5.5 Redis
Redis [30] is an in-memory key-value store widely used in website development as a caching layer and for message queue applications. Redis uses an “append-only file” (AOF) to log all the write operations to the storage device. At recovery, it replays the log. The frequency at which Redis flushes the AOF to persistent storage allows the administrator to trade-off between performance and consistency.
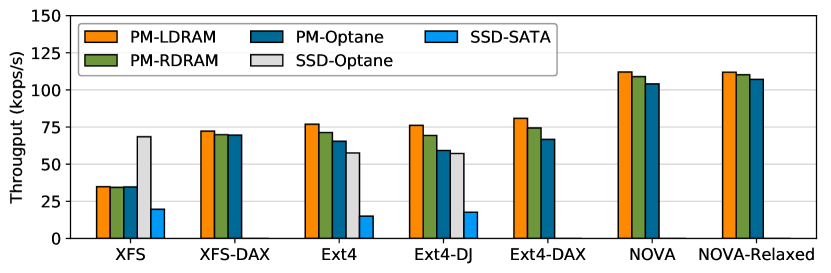
Figure 27 measures Redis’s MSET (multiple sets) benchmark performance where each MSET operation updates ten key/value pairs (190 bytes). One MSET operation generates a 335 byte log record and appends it to the AOF. Redis supports three fsync modes - “always”, “everysec”, “no” - for flushing the AOF to the persistent storage. For our experiment, we chose the “always” fsync policy where fsync is called after every log append. This version of Redis is “persistent” since it ensures that no data is lost after recovery. We measure this mode to see how the safest version of Redis performs on different NVMM file systems. We put Redis server and client processes in the same machine for this experiment, though the processes communicate via TCP. As with RocksDB, the strong consistency requirement of Redis and its frequent use of syncs results in a performance win for NOVA-type file systems. Interestingly, XFS performs better on block-based devices than even DRAM. Investigation into this anomaly suggested inefficiencies in xfs’s byte-granularity code path are responsible and manifest in a few other benchmarks.
5.6 Kyoto Cabinet
Kyoto Cabinet [17] (KC) is a high-performance database library. It stores the database in a single file with database metadata at the head. Kyoto Cabinet memory maps the metadata region, uses load/store instructions to access and update it, and calls msync to persist the changes. Kyoto Cabinet uses write-ahead logging to provide failure atomicity for SET operations.
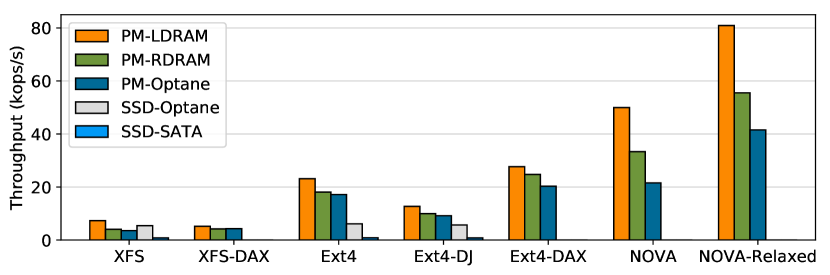
We measure the throughput for SET operations on Kyoto Cabinet’s HashDB data structure (Figure 28). HashDB is a hash table implementation where each bucket is the root of the binary search tree. A transaction on HashDB first appends an undo log record to the WAL and then updates the target record in place. During commit, it flushes the updated data using msync and truncates the WAL file to invalidate log records. We use KC’s own benchmark, kchashtest order, to measure the throughput of HashDB’s with one million random SET transactions, where, for each transaction, the key size is 8 bytes, and the value size is 1024 bytes. By default, each transaction is not persisted (i.e., not fsync’d) during commit, so we modified the benchmark such that every transaction persists at its end. In these experiments, we uncovered a performance issue when msync is used on transparent huge pages with DAX-file systems; performance dropped over 90%. Switching off huge pages fixed the issue — DAX file systems for this benchmark are reported with huge pages turned off and we are continuing to investigate the bug.
5.7 MySQL
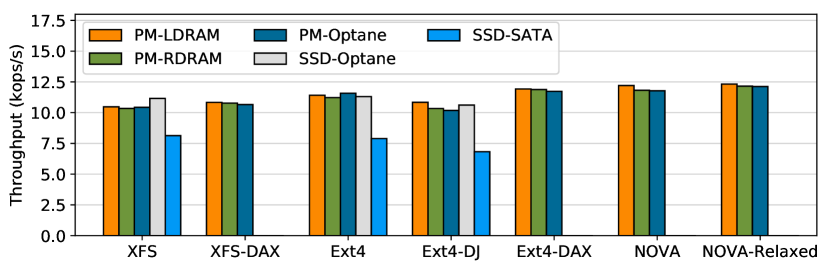
We further evaluate the throughput of databases on Optane DC with MySQL [28], a widely-used relational database. We measure the throughput of MySQL with TPC-C [26], a workload representative of online transaction processing (OLTP). We use ten warehouses, and each run takes five minutes. Figure 29 shows the MySQL throughput. As MySQL’s default settings include aggressive use of the buffer pool and also a checkpointing mechanism to avoid writing to persistence regularly and to hide access latency, performance remains surprisingly stable across file systems and storage device.
5.8 SQLite
SQLite [31] is a lightweight embedded relational database that is popular in mobile systems. SQLite stores data in a B+tree contained in a single file. To ensure consistency, SQLite can use several mechanisms to log updates. We configure it to use write-ahead, redo logging (WAL) since our measurements show it provides the best performance.
We use Mobibench [20] to test the SET performance of SQLite in WAL mode. The workload inserts 100 byte values into a single table with one thread. Figure 30 shows the result. NOVA-Relaxed performs the best on this benchmark and significantly improves over regular NOVA. This difference, which can be attributed solely to the in-place update optimization, is significant in SQLite due to its randomly distributed writes to a B+tree contained in a single file.
5.9 LMDB
Lightning Memory-Mapped Database Manager (LMDB) [32] is a Btree-based, lightweight database management library. LMDB memory-maps the entire database so that all data accesses directly load and store the mapped memory region. LMDB performs copy-on-write on data pages to provide atomicity, a technique that requires frequent msync calls.
We measure the throughput of sequential SET operations using LevelDB’s db_bench benchmark. Each SET operation is synchronous and consists of 16-byte key and 96-byte value. Figure 31 shows the result.
5.10 MongoDB
MongoDB is an open-source, NoSQL, document-oriented database program [24]. It supports pluggable storage engines, which are components of the database that manage storage and retrieval of data for both memory and storage. In this section, we use MongoDB 3.5.13 with its default storage engine, WiredTiger (WT). The WT engine maintains data in memory, journals updates to the database to ensure immediate persistence of committed transactions, and creates periodic checkpoints of the in-memory data [23].
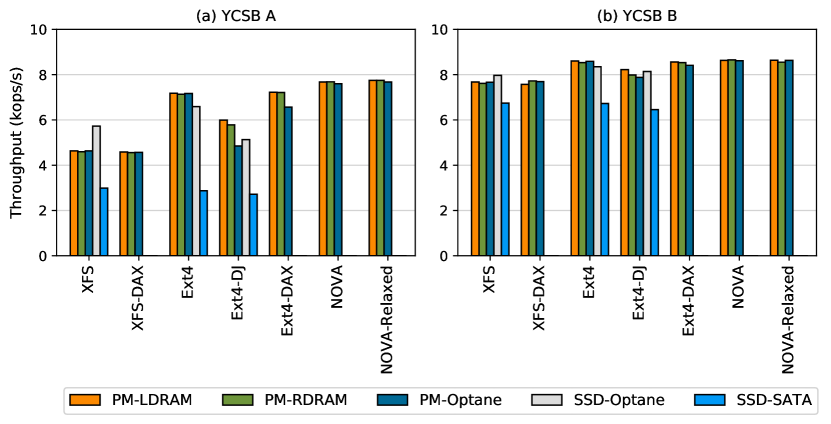
We use the Yahoo Cloud Serving Benchmark (YCSB [7]) to evaluate the performance of MongoDB using its default engine. YCSB allows running a write-dominant (YCSB-A with 50% reads and 50% updates) and a read-dominant (YCSB-B with 95% reads and 5% updates) workload against MongoDB through a user-level client that interacts with the MongoDB server via TCP/IP. We have configured YCSB to populate the database with 100 K entries (26 byte keys and 1024 byte values) prior to executing 100 K operations (based on the workload characteristics) against the database.
We run both server (MongoDB) and client (YCSB) processes on the same socket and report the single threaded throughput for YCSB-A and YCSB-B workloads. Figure 32 shows the result.
Observation 14.
Applications generally perform slower on real Optane DC than on emulated persistent memory, and the gap grows when the file system is fast.
This result is expected given the latency differences observed in the previous sections.
Observation 15.
Block-oriented file systems are not necessarily slower than their DAX counterparts
in real-world application benchmarks,
especially on read-oriented workloads.
This result seems to indicate the importance of using the DRAM page cache for boosting
application performance.
Observation 16.
Native NVMM file systems (NOVA, NOVA-Relaxed) generally provide better performance than adapted file systems throughout all applications we studied, especially those that use frequent sync operations. Although this trend might not be the case for other types of applications or workloads, our result highlights the value of native NVMM file systems and efficient sync mechanisms.
6 Optane DC as Persistent Memory
While the Intel® Optane™ DC Persistent Memory Module can be used as either a memory or storage device, perhaps the most interesting, and novel, use case is when it is both; that is, when it is a persistent memory device. In this role, Optane DC memory provides user space applications with direct access to persistent storage using a load/store interface. User space applications that desire persistent memory access can mmap a file into their virtual address space. The application can then use simple loads and stores to access persistent data, and use cache line flushes to ensure that writes leave the caches and become persistent on Optane DC memory. In this section, we investigate the performance of software designed to access persistent memory from user space, without the need for an intervening file system. Like the previous section on storage, we again expose the memory as a pmem device, and use the relevant configurations (PM-LDRAM, PM-RDRAM, and PM-Optane).
6.1 Redis-PMEM
Our first persistent memory application is a modified version of Redis [30] (seen previously in Sections 4.4 and 5.5). We used a forked repository of Redis 3.2 [11] that uses PMDK’s libpmemobj [9] for ensuring that its state is persistent (and no longer uses a logging file, as was done previously in Section 5.5). As with Section 5.5, we use the redisbenchmark executable to measure the throughput. In order to compare the results side-by-side, we used the same configuration as the Section 5.5: 4B for both key and value, 12 clients generated by a single thread, and a million random MSET operations.
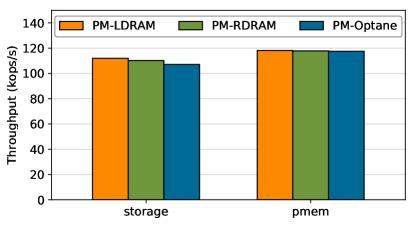
Figure 33 shows Redis’s throughput with two potential usages of the Optane DC PMM. The left set of bars are a direct copy from section 5.5, where Redis used a backing file on the NOVA-Relaxed file system to ensure data persistence. The right set is the PMDK version of Redis when using Optane DC as user-space persistent memory. Interestingly, the PMDK version of Redis outperforms the file-backed Redis, even when the file-backed Redis is run on an NVMM-aware file system. This result indicates that custom user-space persistent libraries are likely to be useful for performant applications, and in order for programmers to capture the promise of fast NVMM persistence, application level changes may be required.
6.2 RocksDB-PMEM
Our next persistent memory application is a modified version of RocksDB. Since the volatile memtable data structure in RocksDB contains the same information as the write-ahead log (WAL) file, we can eliminate the latter by making the former a persistent data structure, thereby making RocksDB an NVMM-aware user space application. Among the several data structures that RocksDB supports, we modified the default skip-list implementation and made it crash-consistent in NVMM using PMDK’s libpmem library [9]. In our RocksDB experiment, we used the same benchmark as in Section 5.4 and compare to the best results that used the write-ahead log file (NOVA-Relaxed for this benchmark). Figure 34 shows the throughput of both modes.
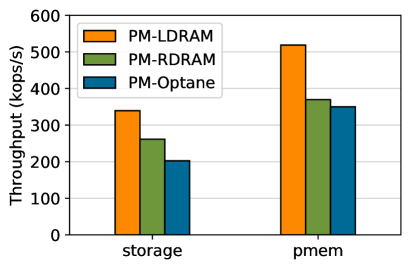
The left set of bars (storage) is the result of volatile memtable backed by WAL using NOVA-Relaxed, and the right set of bars (pmem) is the result of crash-consistent memtable made persistent in NVMM. As with our Redis results in Section 6.1, the persistent data structure provides better performance than using both a volatile data structure and file-backed logging mechanism. Unlike Redis, which has network stack overheads, RocksDB is embedded software, and, consequently, its achieved gain is much larger (73% on PM-Optane).
6.3 MongoDB-PMEM
Our third persistent memory application is MongoDB. We extend the experiment setup in Section 5.10 to measure the performance implications of replacing MongoDB’s default storage engine (WT) with Intel’s persistent memory storage engine for MongoDB (PMem [10]). The PMem engine uses Intel’s PMDK [9] to transactionally manage MongoDB’s data and to obviate the need to create snapshots and/or journal.
Figure 35 shows the performance impact of using PM-LDRAM, PM-RDRAM, and PM-Optane to store MongoDB’s data using either the default WT storage engine (with a snapshots and journaling) or using the PMem storage engine. We run both server (MongoDB) and client (YCSB) processes on the same socket and report the single-threaded throughput for YCSB-A and YCSB-B workloads.
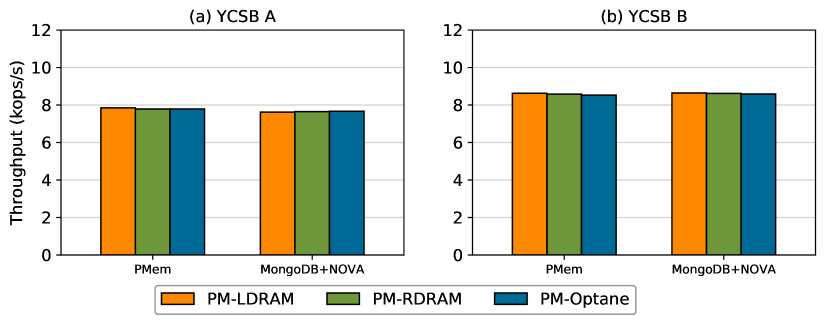
Observation 17.
Switching between PM-LDRAM, PM-RDRAM, and PM-Optane does not have a considerable
impact on the performance (i.e., throughput) of running YCSB-A and YCSB-B workloads against
MongoDB storage engines. We believe this observation correlates to the high cost of the client-server communications
between the YCSB client and MongoDB server as well as the software overhead of MongoDB’s query
processing engine.
Observation 18.
PMem storage engine provides similar performance to MongoDB’s default storage engine
(WiredTiger) for both write-dominant (YCSB A) and read-dominant (YCSB B) workloads.
6.4 PMemKV
Intel’s Persistent Memory Key-Value Store (PMemKV [12]) is an NVMM-optimized key-value data-store. It implements various tree data structures (called “storage engines”) to index programs data and uses the Persistent Memory Development Kit (PMDK [9]) to manage its persistent data.
We run our evaluation using PMemKV’s benchmark tool to test the two available storage engines: kvtree2 and btree. The kvtree2 engine adopts PMDK to implement a B+Tree similar to NV-Tree [39], where only the leaf nodes are persistent and the internal nodes are reconstructed after a restart. The btree engine employs copy-on-write to maintain a fully-persistent B+Tree.
Figure 36 reports average latency for five single-threaded runs for each configuration, with each run performing 2 million operations with 20 byte keys and 128 byte values against a 16 GB memory-mapped file backed by NOVA. Each configuration varies the operation performed: either random insert (fillrandom), sequential insert (fillseq), overwrite, random read (readrandom) and sequential read (readseq) operations.
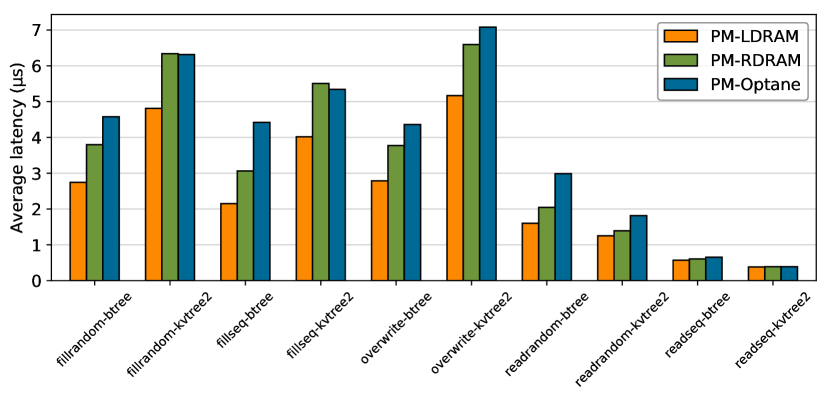
Observation 19.
For sequential reads in applications, Optane DC memory provides comparable latency to DRAM. In comparison to PM-LDRAM, running PMemKV on PM-Optane increases the latency by 2% to 15%
for sequential read and between 45% and 87% for random read operations.
Observation 20.
Optane DC incurs up to 2.05 higher latency
for PMemKV write operations in comparison to PM-LDRAM. This result agrees with the write performance gap between
Optane DC memory and DRAM measured in Section 3.
6.5 WHISPER
The Wisconsin-HPL Suite for Persistence (WHISPER [25]) is a benchmark suite for non-volatile main memories. It provides an interface to run a set of micro and macro benchmarks against a particular NVMM setup (e.g., PM-LDRAM, PM-RDRAM, and PM-Optane) and reports the total execution time of each benchmark. WHISPER also provides a knob to configure the size of the workloads to be small, medium, or large — we use the large configuration in our test. Figure 37 reports the execution time of running each benchmark normalized to its PM-LDRAM execution time as well as the average for all benchmarks.
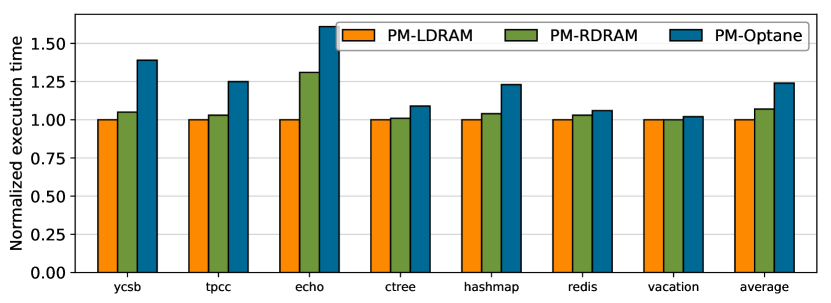
Observation 21.
In comparison to PM-LDRAM, PM-Optane increases execution time of WHISPER benchmarks by an
average of 24%. This is an expected outcome due to the performance gap between Optane DC memory and DRAM.
Observation 22.
The performance difference between PM-Optane and PM-LDRAM is greatest for persistent data
structures and lowest for client-server applications. We observe that the portion of persistent memory accesses of each benchmark correlates to the
gap between its PM-LDRAM and PM-Optane execution times.
6.6 Summary
In summary, we offer a global look at applications run across all different devices, file systems, and with user-space persistence (Figure 38). This graph demonstrates not only the wide range of options for providing persistent storage, but also the benefits of deeply integrating Optane DC memory into the system stack. As we accelerate the storage media and remove software overheads on the critical path to persistence, real-world applications get significantly faster. This figure represents the storage outlook of the near future as we migrate from old devices and interfaces onto a far flatter and faster storage stack.
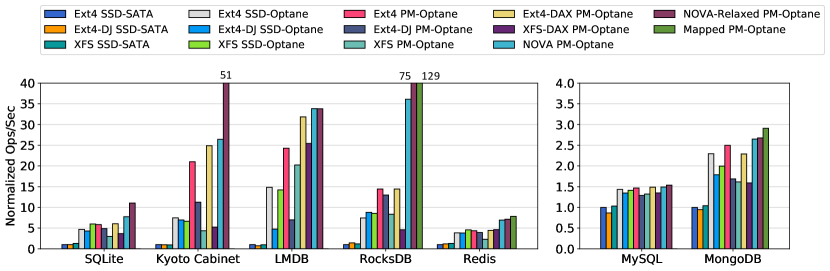
Observation 23.
Performance improves as Optane DC memory becomes more integrated into the
storage stack. The major performance difference between Optane DC memory and previous
storage media means that software modifications at the application level may reap
significant performance benefits.
7 Conclusion
This paper has provided a large sampling of performance experiments on Intel’s new Intel® Optane™ DC Persistent Memory Module. These experiments confirm that the Optane DC PMM creates a new tier of memory technology that lies between DRAM and storage, and that its performance properties are significantly different from any medium that is currently deployed.
Our experiments, though early, were able to come to some conclusions. Optane DC memory, when used in cached mode, provides comparable performance to DRAM for many of the real world applications we explored and can greatly increase the total amount of memory available on the system. Furthermore, Optane DC memory provides significantly faster access times than hard drives or SSDs and seem well positioned to provide a new layer in the storage hierarchy when used in an uncached mode. For many real-world storage applications, using Optane DC memory and an NVMM-aware file system will drastically accelerate performance. Additionally, user-space applications that are NVMM-aware can achieve even greater performance benefits, particularly when software overheads are already low. That said, it appears that previous research exploring persistent memory software systems have been overly optimistic in assuming that Optane DC memory will have comparable performance to DRAM (both local and remote), and further work remains to be done in adapting these new designs to real Optane DC memory.
In closing, we hope that the data presented here will be useful to other researchers exploring these new memory devices. Compared to what we now know about other memory technologies, this report is only the beginning. We believe important questions remain both unasked and unanswered, and that future work is necessary to complete our understanding.
References
- [1] Brian Aker. memaslap - Load testing and benchmarking a server. http://docs.libmemcached.org/bin/memaslap.html.
- [2] Bill Bridge. NVM Support for C Applications, 2015. Available at http://www.snia.org/sites/default/files/BillBridgeNVMSummit2015Slides.pdf.
- [3] James Bucek, Klaus-Dieter Lange, and Jóakim v. Kistowski. Spec cpu2017: Next-generation compute benchmark. In Companion of the 2018 ACM/SPEC International Conference on Performance Engineering, ICPE ’18, pages 41–42, New York, NY, USA, 2018. ACM.
- [4] Dhruva R. Chakrabarti, Hans-J. Boehm, and Kumud Bhandari. Atlas: Leveraging Locks for Non-volatile Memory Consistency. In Proceedings of the 2014 ACM International Conference on Object Oriented Programming Systems Languages & Applications, OOPSLA ’14, pages 433–452, New York, NY, USA, 2014. ACM.
- [5] Joel Coburn, Adrian M. Caulfield, Ameen Akel, Laura M. Grupp, Rajesh K. Gupta, Ranjit Jhala, and Steven Swanson. NV-Heaps: Making Persistent Objects Fast and Safe with Next-generation, Non-volatile Memories. In Proceedings of the Sixteenth International Conference on Architectural Support for Programming Languages and Operating Systems, ASPLOS ’11, pages 105–118, New York, NY, USA, 2011. ACM.
- [6] Jeremy Condit, Edmund B. Nightingale, Christopher Frost, Engin Ipek, Benjamin Lee, Doug Burger, and Derrick Coetzee. Better I/O through byte-addressable, persistent memory. In Proceedings of the ACM SIGOPS 22nd Symposium on Operating Systems Principles, SOSP ’09, pages 133–146, New York, NY, USA, 2009. ACM.
- [7] Brian F. Cooper, Adam Silberstein, Erwin Tam, Raghu Ramakrishnan, and Russell Sears. Benchmarking Cloud Serving Systems with YCSB. In Proceedings of the 1st ACM Symposium on Cloud Computing, SoCC ’10, pages 143–154, New York, NY, USA, 2010. ACM.
- [8] Intel Corporation. Intel® Memory Latency Checker v3.5. Available at https://software.intel.com/en-us/articles/intelr-memory-latency-checker.
- [9] Intel Corporation. Persistent Memory Development Kit. Available at http://pmem.io/pmdk/.
- [10] Intel Corporation. Persistent Memory Storage Engine for MongoDB. Available at https://github.com/pmem/pmse.
- [11] Intel Corporation. pmem-redis. Available at https://github.com/pmem/redis.
- [12] Intel Corporation. pmemkv. Available at https://github.com/pmem/pmemkv.
- [13] Jeffrey Dean and Sanjay Ghemawat. LevelDB. https://github.com/google/leveldb.
- [14] Z. Duan, H. Liu, X. Liao, and H. Jin. Hme: A lightweight emulator for hybrid memory. In 2018 Design, Automation Test in Europe Conference Exhibition (DATE), pages 1375–1380, March 2018.
- [15] Subramanya R. Dulloor, Sanjay Kumar, Anil Keshavamurthy, Philip Lantz, Dheeraj Reddy, Rajesh Sankaran, and Jeff Jackson. System Software for Persistent Memory. In Proceedings of the Ninth European Conference on Computer Systems, EuroSys ’14, pages 15:1–15:15, New York, NY, USA, 2014. ACM.
- [16] Facebook. RocksDB, 2017. http://rocksdb.org.
- [17] FAL Labs. Kyoto Cabinet: a straightforward implementation of DBM, 2010. http://fallabs.com/kyotocabinet/.
- [18] John L. Henning. Spec cpu2006 benchmark descriptions. SIGARCH Comput. Archit. News, 34(4):1–17, September 2006.
- [19] Joseph Izraelevitz, Terence Kelly, and Aasheesh Kolli. Failure-atomic persistent memory updates via JUSTDO logging. In Proceedings of the 21st International Conference on Architectural Support for Programming Languages and Operating Systems, ASPLOS XXI, pages 427–442, New York, NY, USA, April 2016. ACM.
- [20] Sooman Jeong, Kisung Lee, Jungwoo Hwang, Seongjin Lee, and Youjip Won. AndroStep: Android Storage Performance Analysis Tool. In Software Engineering (Workshops), volume 13, pages 327–340, 2013.
- [21] Ankur Limaye and Tosiron Adegbija. A workload characterization of the spec cpu2017 benchmark suite. In Performance Analysis of Systems and Software (ISPASS), 2018 IEEE International Symposium on, pages 149–158. IEEE, 2018.
- [22] Memcached. http://memcached.org/.
- [23] MongoDB, Inc. WiredTiger Storage Engine. Available at https://docs.mongodb.com/manual/core/wiredtiger.
- [24] MongoDB, Inc. MongoDB, 2017. https://www.mongodb.com.
- [25] Sanketh Nalli, Swapnil Haria, Mark D. Hill, Michael M. Swift, Haris Volos, and Kimberly Keeton. An Analysis of Persistent Memory Use with WHISPER. In Proceedings of the Twenty-Second International Conference on Architectural Support for Programming Languages and Operating Systems, ASPLOS ’17, pages 135–148, New York, NY, USA, 2017. ACM.
- [26] Raghunath Nambiar, Meikel Poess, Andrew Masland, H. Reza Taheri, Andrew Bond, Forrest Carman, and Michael Majdalany. Tpc state of the council 2013. In Revised Selected Papers of the 5th TPC Technology Conference on Performance Characterization and Benchmarking - Volume 8391, pages 1–15, Berlin, Heidelberg, 2014. Springer-Verlag.
- [27] Intel Newsroom. Details and Mitigation Information for L1 Terminal Fault.
- [28] Oracle Corporation. MySQL. https://www.mysql.com/.
- [29] pmem.io. Persistent Memory Development Kit, 2017. http://pmem.io/pmdk.
- [30] redislabs. Redis, 2017. https://redis.io.
- [31] SQLite. SQLite, 2017. https://www.sqlite.org.
- [32] Symas. Lightning Memory-Mapped Database (LMDB), 2017. https://symas.com/lmdb/.
- [33] Vasily Tarasov, Erez Zadok, and Spencer Shepler. Filebench: A flexible framework for file system benchmarking. USENIX; login, 41, 2016.
- [34] Haris Volos, Sanketh Nalli, Sankarlingam Panneerselvam, Venkatanathan Varadarajan, Prashant Saxena, and Michael M. Swift. Aerie: Flexible File-system Interfaces to Storage-class Memory. In Proceedings of the Ninth European Conference on Computer Systems, EuroSys ’14, pages 14:1–14:14, New York, NY, USA, 2014. ACM.
- [35] Haris Volos, Andres Jaan Tack, and Michael M. Swift. Mnemosyne: Lightweight Persistent Memory. In ASPLOS ’11: Proceeding of the 16th International Conference on Architectural Support for Programming Languages and Operating Systems, New York, NY, USA, 2011. ACM.
- [36] Xiaojian Wu and A. L. Narasimha Reddy. SCMFS: A File System for Storage Class Memory. In Proceedings of 2011 International Conference for High Performance Computing, Networking, Storage and Analysis, SC ’11, pages 39:1–39:11, New York, NY, USA, 2011. ACM.
- [37] Jian Xu and Steven Swanson. NOVA: A Log-structured File System for Hybrid Volatile/Non-volatile Main Memories. In 14th USENIX Conference on File and Storage Technologies (FAST 16), pages 323–338, Santa Clara, CA, February 2016. USENIX Association.
- [38] Jian Xu, Lu Zhang, Amirsaman Memaripour, Akshatha Gangadharaiah, Amit Borase, Tamires Brito Da Silva, Steven Swanson, and Andy Rudoff. NOVA-Fortis: A Fault-Tolerant Non-Volatile Main Memory File System. In Proceedings of the 26th Symposium on Operating Systems Principles, SOSP ’17, pages 478–496, New York, NY, USA, 2017. ACM.
- [39] Jun Yang, Qingsong Wei, Cheng Chen, Chundong Wang, Khai Leong Yong, and Bingsheng He. Nv-tree: Reducing consistency cost for nvm-based single level systems. In 13th USENIX Conference on File and Storage Technologies (FAST 15), pages 167–181, Santa Clara, CA, 2015. USENIX Association.
- [40] Xusheng Zhan, Yungang Bao, Christian Bienia, and Kai Li. Parsec3.0: A multicore benchmark suite with network stacks and splash-2x. SIGARCH Comput. Archit. News, 44(5):1–16, February 2017.