The lifetime of binary black holes in Sérsic galaxy models
Abstract
In the local universe, black holes of are hosted in galaxies displaying a variety of stellar profiles and morphologies. These black holes are the anticipated targets of LISA, the Laser Interferometer Space Antenna that will detect the low-frequency gravitational-wave signal emitted by binary black holes in this mass interval. In this paper, we infer upper limits on the lifetime of binary black holes of and up to , forming in galaxy mergers, exploring two underlying stellar density profiles, by Dehnen and by Prugniel & Simien, and by exploiting local scaling relations between the mass of the black holes and several quantities of their hosts. We focus on the phase of the dynamical evolution when the binary is transitioning from the hardening phase ruled by the interaction with single stars to the phase driven by the emission of gravitational waves. We find that different stellar profiles predict very distinct trends with binary mass, with lifetimes ranging between fractions of a Gyr to more than 10 Gyr, and with a spread of about one order of magnitude, given by the uncertainties in the observed correlations, which are larger in the low-mass tail of the observed black hole population.
keywords:
black hole physics – gravitational waves – methods: numerical – galaxies: evolution – galaxies: kinematics and dynamics.1 Introduction
The formation of a binary of two massive black holes in the aftermath of a galaxy-galaxy collision and its hardening down to the gravitational-wave (GW) domain is a challenging problem in stellar dynamics. Detailing the black hole dynamics from the large scale of a cosmological galactic merger (hundreds of kpc) to the tiny scale of GW inspiral (of the order of a few pc) is instrumental in predicting the rate of black hole coalescences expected to occur during the hierarchical assembly of galaxies (Enoki et al., 2005; Rhook & Wyithe, 2005; Sesana et al., 2011a; Plowman et al., 2011; Klein et al., 2016; Tamanini et al., 2016; Bonetti et al., 2019; Dayal et al., 2019; Ricarte & Natarajan, 2018). The environment in which black hole pairing, binary formation, and contraction occur varies immensely. After years of studies, we learned that gas-free and gas-rich galaxy mergers show both extremely complex and non-universal black hole dynamics (Colpi, 2014; Mayer, 2013).
There exist three main phases that black holes experience along the path to coalescence: (I) the early phase of pairing under dynamical friction in the stellar bulge of the post-merger galaxy, ending with the formation of a close Keplerian binary; (II) the phase of hardening by close encounters with single stars plunging on nearly radial orbits on to the binary or by viscous/gravitational angular momentum transport with gas in a circumbinary disc; and finally (III) the phase of GW inspiral.
With advances in numerical simulations, the duration of each phase is modulated by complex, interrelated processes. The inclusion of cosmology-driven initial conditions, cosmic gas inflows, rich galaxy morphology, asymmetries in the stellar distributions, gas dynamics, and a wider spectrum of galaxy and black hole mass ratios reveals the occurrence of failures, bottlenecks, delays, rapid sinking, and/or erratic dynamics (Begelman et al., 1980; Milosavljević & Merritt, 2003; Berczik et al., 2006; Mayer et al., 2007; Dotti et al., 2007; Callegari et al., 2008; Lodato et al., 2009; Callegari et al., 2011; Khan et al., 2011; Sesana et al., 2011b; Khan et al., 2013; Fiacconi et al., 2013; Vasiliev, 2014; Capelo et al., 2015; Roškar et al., 2015; del Valle et al., 2015; Lupi et al., 2015; Mayer et al., 2016; Goicovic et al., 2017; Capelo & Dotti, 2017; Souza Lima et al., 2017; Pfister et al., 2017; Tamburello et al., 2017; Tremmel et al., 2017; Bonetti et al., 2018).
In this paper, we study the stellar hardening of binary black holes in the mass interval These binaries are key targets for LISA, the Laser Interferometer Space Antenna (Amaro-Seoane et al., 2017; Barack et al., 2018) that will primarily explore the low-mass tail of the supermassive black hole mass distribution. These black holes are now being discovered in nearby dwarf galaxies through their electromagnetic emission (Reines et al., 2013; Sartori et al., 2015; Pardo et al., 2016; Mezcua, 2017).
As black hole coalescences of can be detected with LISA from redshift up to –20, when seed black holes form (Latif & Ferrara, 2016), the environment in which they form and couple at dynamical level varies and evolves with redshift at the rhythm of the cosmic assembly of structures. High-resolution zoom-in simulations indicate that the stellar component, even in a gas-rich galaxy merger, is instrumental in driving the black holes to coalescence. A dense stellar cusp surrounding one or both black holes may form following a merger-driven, central gas inflow (Van Wassenhove et al., 2014; Khan et al., 2016), and it is in this dense environment that dynamical friction and later scattering of stars in a triaxial remnant guide the binary contraction.
Very recently, Tamfal et al. (2018) investigated the early phase of pairing of two black holes of in a merger between two dark-matter-dominated dwarf galaxies, using collisionless -body simulations. They found that the efficiency of pairing, prior to binary formation and stellar hardening, depends sensibly on the steepness of the central dark matter density profile. Only cuspy dark matter profiles appear to be favourable to forming a Keplerian binary (of mean eccentricity ), i.e. a bound state on sub-pc scales, when the mass in stars and dark matter inside the orbit decreases below the sum of the black hole masses. Due to the limited resolution (1 pc) of these simulations, the dynamics of the black holes could not be reliably followed down to the stages in which close encounters with single stars and GW emission become important.
In this paper, we explore this next stage using analytical tools in order to guide future simulations on the dynamical evolution of black holes in dwarfs. We aim at determining the binary lifetime in its hardening phase over a mass range that extends from down to the least massive supermassive black holes of .
Direct -body simulations of black hole hardening in a triaxial stellar background indicate that a departure from spherical symmetry in the stellar nucleus of the galaxy (after the merger) keeps the rate of interaction of stars with the binary at a high enough level, even when the system is collisionless, so that the binary continues to shrink rather rapidly. A sufficiently high number of stars moving on centrophilic orbits appears to be present in non-spherical potentials to let the binary enter the GW driven phase (Merritt & Poon, 2004; Holley-Bockelmann & Sigurdsson, 2006). Using a Monte Carlo method, Vasiliev et al. (2015) confirmed this trend in triaxial galaxies without relaxation and showed that even a moderate departure from axisymmetry is sufficient to keep the binary shrinking (Vasiliev, 2016). After performing a detailed comparison between direct -body simulations and a hybrid model based on three-body scattering experiments (see, e.g. Quinlan, 1996; Sesana et al., 2006), Sesana & Khan (2015) conjectured that the (-body) binary hardening rate is equivalent to that of a binary embedded in a field of stars inside a spherical potential where key quantities such as the stellar density and velocity dispersion are evaluated at the binary gravitational sphere of influence. This enables to estimate the lifetime of the binary forming in a merger, based solely on a few key parameters of the host. Sesana & Khan (2015) confined their analysis to galaxies described by a Dehnen (1993) stellar profile and black holes with masses in excess of finding hardening time-scales ranging from a fraction of a Gyr to 10 Gyr, with a strong dependence on the binary eccentricity. In light of recent findings that attribute to dwarf galaxies a variety of morphologies, the choice of the stellar density and velocity dispersion profile becomes then critical.
Reines et al. (2013; hereafter RGG) assembled the largest sample of local dwarf galaxies (with stellar masses in the interval ) hosting a nuclear black hole with median mass of , detected as a low-luminosity active galactic nucleus (see Mezcua et al. 2018 for a sample at high redshift). These galaxies display different morphologies, presence or absence of central pseudo-bulges, and different levels of compactness, with Sérsic (1963, 1968) indices varying from 0.8 to 6. As an example, the dwarf disc galaxy RGG 118 hosts the least massive black hole ever detected with mass . It contains a pseudo-bulge of , fit by an inner Sérsic profile of index , placing the black hole mass below the extrapolated value from the – relation defined by elliptical/S0 more massive galaxies (Baldassare et al., 2015, 2017), where is the total mass of the stellar spheroidal. The departure from the – relation is observed in a much wider sample of dwarf and spiral mega-maser galaxies (Kormendy & Ho, 2013; Läsker et al., 2016; Reines & Volonteri, 2015; Greene et al., 2008).
Savorgnan et al. (2013) have highlighted the occurrence of a correlation between the black hole mass and the Sérsic index of the host, showing that less massive black holes (below and of interest for LISA) live preferentially in galaxies with low values of . To anchor the black hole mass and, by extrapolation, the mass of the binary to the stellar profile of the underlying host, we here use the – correlation, and the looser relation – as inferred in Kormendy & Ho (2013), Scott et al. (2013), Savorgnan et al. (2013), and Davis et al. (2019). We recall that the Sérsic profile describes the surface brightness of a galaxy, and the index controls its degree of curvature, representing the generalization of the de Vaucoulers’ law (; de Vaucouleurs, 1948, 1959). The smaller is the value of , the shallower and less concentrated the profile. Most galaxies are fit by Sérsic profiles with indices in the range such that brighter, more massive galaxies tend to be fit with larger .
In this paper, we provide an estimate of the black hole binary hardening times relevant for LISA considering either a Dehnen profile (for a comparison with the work of Sesana & Khan, 2015) and a Prugniel & Simien (1997) profile, the latter relating the stellar distribution to the Sérsic surface brightness profile. We also adopt values of scaling relations that correlate the black hole mass with the stellar mass, the stellar velocity dispersion, and the Sérsic index. We warn that, due to the large scatter in the cited relations present at the low masses explored and to the non universality of the stellar profiles that characterise these galaxies, our analysis provides median estimates of the black hole lifetimes.
We further note that two competing mechanisms, not included in our treatment, can affect our estimates. In galaxies flattened by rotation (induced by a merger), coalescence times are found to be shorter than in non-rotating galaxies (Holley-Bockelmann & Khan, 2015). Additional inputs in the modelling, such as counter-rotation, inclination of the binary orbital plane relative to the galaxy rotation, and initial eccentricity lead to shorter-lived binaries (Mirza et al., 2017). By contrast, binary hardening is in general conducive to core scouring (Merritt, 2006). This process turns a power-law stellar profile into a cored profile (Merritt, 2006) if the time-scale for loss-cone refilling is long compared to the lifetime of the galaxy. This is particularly relevant in massive galaxies with long relaxation time-scales (Merritt, 2006; Khan et al., 2012a). We recall that the mass deficit in stars caused by binary hardening is of the order of 50 per cent of the total mass of the binary (Merritt, 2006). Thus, scouring has a tangible effect in large elliptical galaxies for which the black hole-to-stellar mass ratio is large (Kormendy & Ho, 2013). At lower masses, the steepening of the ‘black hole mass–stellar mass’ relation may reduce the effect of stellar scouring, due to the larger stellar mass content compared to the black hole mass. Letting the power index of the Dehnen profile and Sérsic index vary in our model, it is a way to capture all these uncertainties.
The paper is organized as follows. In Section 2, we model the transition between the hardening and GW emission as in Sesana & Khan (2015), in order to define the longest time of residence of a black hole binary in a given stellar background, which we refer to as binary lifetime. We then introduce the Dehnen (1993) and Prugniel & Simien (1997) models (Sections 2.1 and 2.2, respectively) and calculate characteristic time-scales and black hole binary separations for different values of the mass ratio and binary eccentricity, although in the rest of the paper we adopt circular binaries to focus on the stellar density at the binary black hole sphere of influence. We then consider the data sample of Graham & Scott (2015), and a study by Nguyen et al. (2018) to link these time-scales to the dormant black holes that we observe in the near universe. In Section 3, we show the strong dependence of our results on the choice of scaling relations, whereas a comparison between the two models is reported in Section 4. In Section 5, we derive our conclusions.
2 Binary lifetime
Consider the case of a black hole binary embedded in a stellar spherical background. The binary hardens via scattering off single stars plunging on nearly radial orbits, and GW emission, which intervenes at the shortest distances. The evolution of the semi-major axis is ruled by the two mechanisms and is given by the sum of two terms which have different scalings with (Sesana & Khan, 2015):
| (1) |
where the coefficients
| (2) |
describe the three-body ‘star–black hole binary’ close interaction and GW dissipation, respectively. The binary has total mass and mass ratio . is the gravitational constant and is the speed of light in vacuum. The coefficient depends on the ratio between the stellar density and velocity dispersion at the black hole binary sphere of influence. Thus, information of the mass of the binary is implicitly contained in the values of the density and velocity dispersion of the underlying stellar system. is a dimensionless hardening rate inferred from three-body scattering experiments, of the order of 15–20 (Quinlan, 1996; Sesana et al., 2006), which we set equal to 15. The coefficient related to the GW energy loss, is a sensitive function of the binary eccentricity , with the factor (Peters & Mathews, 1963).
Since the stellar hardening rate is and the GW hardening rate is , binaries spend most of their time at the transition separation that can be estimated setting
| (3) |
This occurs at a distance
| (4) |
corresponding to a maximum in the hardening time-scale
| (5) |
which we refer to as binary lifetime in the following. displays a weak dependence on the mass ratio , scaling as and a stronger dependence on the eccentricity, scaling as (e.g. a reduction of a factor of 3.2 can be attained when the eccentricity is 0.9 compared to ).
Scattering experiments and direct -body numerical simulations (e.g. Sesana et al., 2011b; Khan et al., 2012b; Khan et al., 2018a; Khan et al., 2018b) indicate that the binary eccentricity increases during the hardening phase by three-body scatterings. Thus, we couple Equation (1) with the evolution equation for , which accounts for the effects of stellar scatterings and GW cicularisation,
| (6) |
where the eccentricity growth rate is a numerical factor, calibrated against scattering experiments, which depends on and is of order 0 (for low values of ) and 0.2 otherwise (Quinlan, 1996; Sesana et al., 2006).
Before proceeding, we need to estimate and . We do this for two different physical models.
2.1 Dehnen density profile
Sesana & Khan (2015) calculated the coalescence time of a binary using as a reference model for the galaxy remnant the density profile described by Dehnen (1993):
| (7) |
where is the scale radius and the inner logarithmic slope. The velocity dispersion profile associated to this model is
| (8) |
The Dehnen profile (see also Tremaine et al., 1994) is an analytical model which is a generalisation of widely used models such as the Hernquist (1990; ) and Jaffe (1983; ) profiles. In projection, for , it resembles quite well the de Vaucouleurs’ law profile (de Vaucouleurs, 1948, 1959), which describes how the surface brightness of ellipticals and bulges of spirals varies as a function of the projected distance from the centre.
To evaluate the density and velocity dispersion at the black hole binary sphere of influence , we need to correlate the black hole binary mass with the stellar mass. Under the assumption that scaling relations can be applied to the binary, when the merger is near completion, we proceed as follows:
-
•
The stellar (bulge) mass is inferred from the – relation taken from Kormendy & Ho (2013):
-
•
The effective radius is a function of the galaxy stellar mass and depends on the nature of the galaxy host. For massive ellipticals, bulges of spirals, and ultra-compact dwarfs, Dabringhausen et al. (2008) found
-
•
The scale radius is connected to the bulge effective radius through the relation (Dehnen, 1993).
-
•
The influence radius, defined as the radius containing twice the binary mass in stars, i.e. , is given by .
-
•
The stellar density is obtained from Equation (7) at the influence radius.
- •
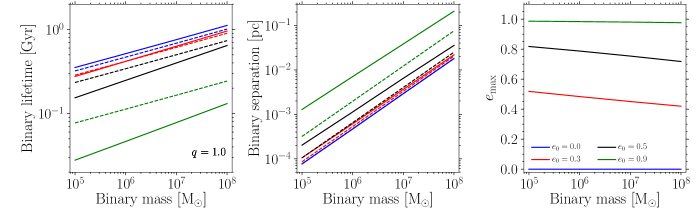
With the above prescriptions, we relate in a unique way to the properties of the host galaxy: , and This enables us to solve Equations (1) and (6), for different values of the initial eccentricity and an initial binary separation equal to the radius at which the enclosed stellar mass is equal to (when a Keplerian binary forms). We then compute the characteristic separation and the corresponding lifetime as a function of the binary mass, from Equations (4) and (5), for a given value of , , and . This is illustrated in Figure 1, where we fix and consider two values of the mass ratio and 1 (we do not consider lower values of the mass ratio, as minor mergers with may lead to wandering black holes; Callegari et al. 2008, 2011; Colpi 2014). In Figure 1, is the maximum binary eccentricity attained during evolution.
We note that lifetimes cover a wide range, from 30 Myr up to 1 Gyr, show very weak dependence on , and depend sensitively on . LISA black hole binaries need to attain tiny separations compared to galactic scales, of the order of pc () and pc () for the lightest binaries of . These relations, computed using the expression of the velocity dispersion at the gravitational sphere of influence of the binary, are close to the ones computed by Sesana & Khan (2015), who assumed non-evolving values of the eccentricity at the transition between stellar hardening and GW emission. We note that accounting for the eccentricity evolution reduces the binary lifetime by a factor of 2–10. Thus, in the following analysis, we treat the eccentricity as a constant and equal to zero, so that time-scales provide an upper limit. Note that, if the relevant radius at which the loss cone is kept full is , then the time-scales decrease by a factor of 2.
2.2 Prugniel and Simien density profile
Galaxies in the Graham & Scott (2015) data set are divided in Sérsic and core-Sérsic galaxies. The term Sérsic galaxy is used to denote galaxies (ellipticals and bulges of disc galaxies) whose surface brightness is described by the Sérsic model (Sérsic, 1963, 1968), . The term Core-Sérsic galaxy refers to a galaxy whose main spheroidal component has a partially depleted core (i.e. a central stellar deficit of light that is not due to dust, enclosed in a radius ) such that the surface brightness profile is well described by the core-Sérsic model (Graham et al., 2003), which joins a single inner power-law profile to an outer Sérsic profile. Scott et al. (2013) have found that the – relation is different for this type of galaxies: core-Sérsic galaxies follow a linear relation, whereas Sérsic galaxies a quadratic one. The bend in the relation occurs at , with Sérsic galaxies hosting the smallest black holes.
We calculate again the binary lifetime considering only Sérsic galaxies, which host central black holes in the range of interest of LISA. This time, however, we use the density profile developed by Prugniel & Simien (1997) to describe Sérsic galaxies (a complete analysis of the model is reported in Terzić & Graham, 2005). Density as a function of radius is given by
| (9) |
which depends on the curvature of the profile , the normalization factor , and the effective radius . The parameters and are a function of as described below. The velocity dispersion is given by
| (10) |
where , and here is the lower incomplete Gamma function.
The parameters used in these equations are calculated from the following relations:
-
•
The stellar mass of the spheroid is inferred either from (Scott et al., 2013)
(11) -
•
is connected to the stellar mass through the relation for the bulges of spirals and ultra-compact dwarfs (Dabringhausen et al., 2008).
-
•
The index n is connected to the black hole mass through the relation taken from Savorgnan et al. (2013) for Sérsic bulges:
(12) -
•
is connected to by , for and (Márquez et al., 2000). This relation is obtained through a high-quality match between the exact, de-projected Sérsic profiles (solved numerically) and the above expression of .
-
•
is chosen to ensure that contains half the (projected) galaxy light and is obtained by solving the equation , where and are the Gamma and lower incomplete Gamma function, respectively. A good approximation of for is (Prugniel & Simien, 1997).
-
•
The density is inferred from Equation (9) through integration over the mass distribution.
-
•
The binary influence radius has been deduced for every galaxy in the sample from the relation
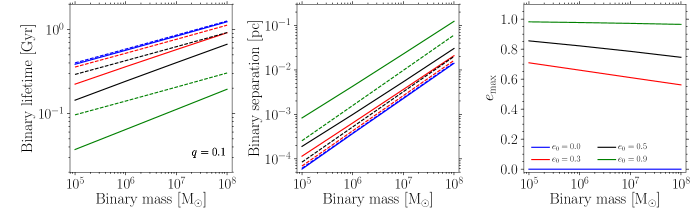
In Figure 2, we plot the binary lifetime and separation as a function of for different values of (unevolved) eccentricity and mass ratio. In Sérsic galaxy models, the binary lifetime increases with decreasing binary mass, in contrast to the Dehnen model (Figure 1). This trend mirrors the correlation between the black hole mass and the index , as lower-mass black holes are hosted in galaxies with lower values of . The binary lifetime is proportional to [see Equations (4) and (5)] which, in Prugniel & Simien models with low , increases with decreasing . We find that the transition separation falls in a similar way to that of the Dehnen models.
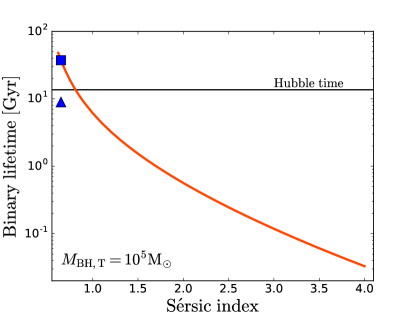
Figure 3 shows the lifetime of a binary black hole of in a host galaxy of as a function of the Sérsic index to illustrate the dependence of this time-scale on this index, which determines both the density and dispersion velocity at the binary black hole influence radius.
3 Lifetimes: black hole mass versus Sérsic index
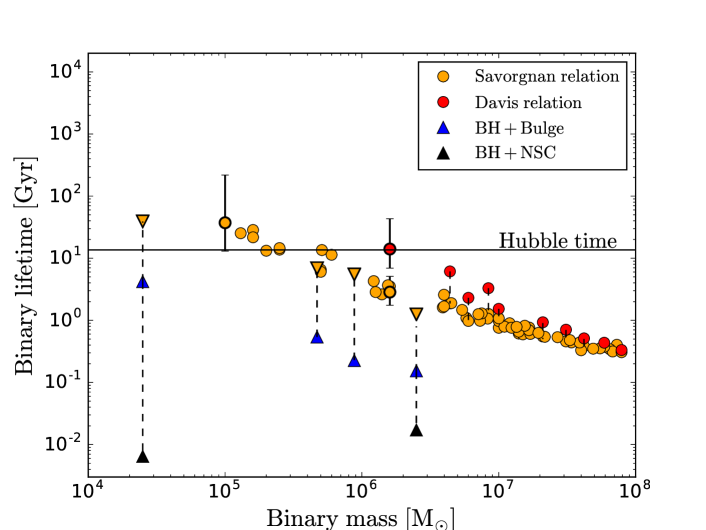
In this section, we show the strong dependence of the binary lifetimes on the Sérsic index. In Figure 4, we plot with orange dots the binary lifetime calculated for the black holes in the Graham & Scott (2015) sample (for the case ) using Equation (12). Lifetimes range between 0.3 Gyr and the Hubble time for black hole binaries with masses above a few , but exceed the Hubble time for lighter binaries. These lifetimes are upper limits, as binaries are expected to develop large eccentricities during the hardening which reduce the value by factors of 2–5 (see Figure 2).
Recently, Davis et al. (2019) proposed a revised version of the – relation:
| (13) |
This new relation gives lower values of for a given (low) black hole mass, compared to the relation by Savorgnan et al. (2013). Red dots in Figure 4 indicate binary lifetimes inferred using Equation (13), for a few select black holes.
Both relations have a very large scatter, and we computed the uncertainty on for two select black hole mass ( and M⊙) highlighted in Figure 4 with black circles and associated errors. For example, using the Davis et al. (Savorgnan et al.) relation and scatter, the uncertainty on when M⊙ is of a factor of 7–8 (of 2). For , the scatter is 10 using Savorgnan et al.
Nguyen et al. (2018) published a high-resolution study of four black holes hosted in nearby low-mass early-type galactic nuclei (M32, NGC 205, NGC 5102, and NGC 5206), providing the values of the black hole mass, host galaxy stellar mass, Sérsic index and effective radius of the bulge (and of the NSC, when possible), and black hole influence radius. We computed the expected binary lifetimes using the published values of , , and the Prugniel & Simien model for the density and stellar dispersion at , and compared them with the ones we inferred using Equation (12). In Figure 4, we show how the binary lifetime decreases by one or more orders of magnitude when, instead of using the relations in Section 2.2 (orange triangles), we use the data given in Nguyen et al. (2018) of the bulge (blue triangles) or the NSC (black triangles).
This illustrates how sensitive is the dependence of the binary lifetimes on the underlying properties of the stellar background.
4 Dehnen versus Prugniel & Simien
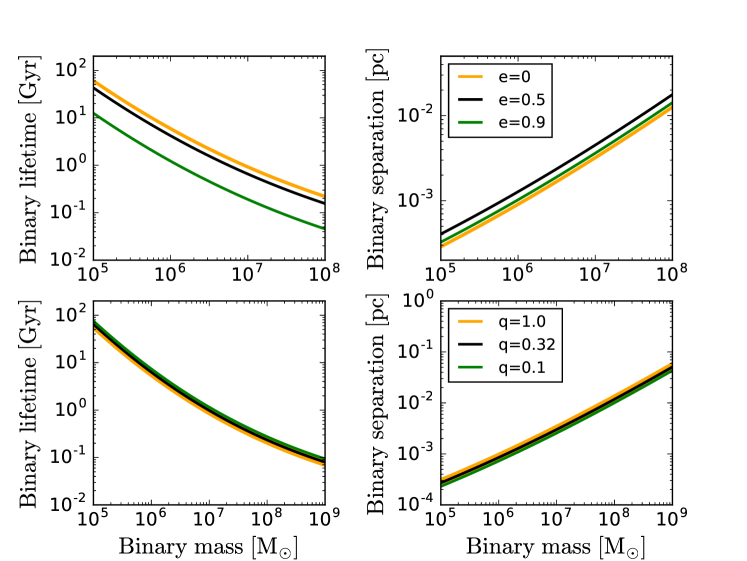
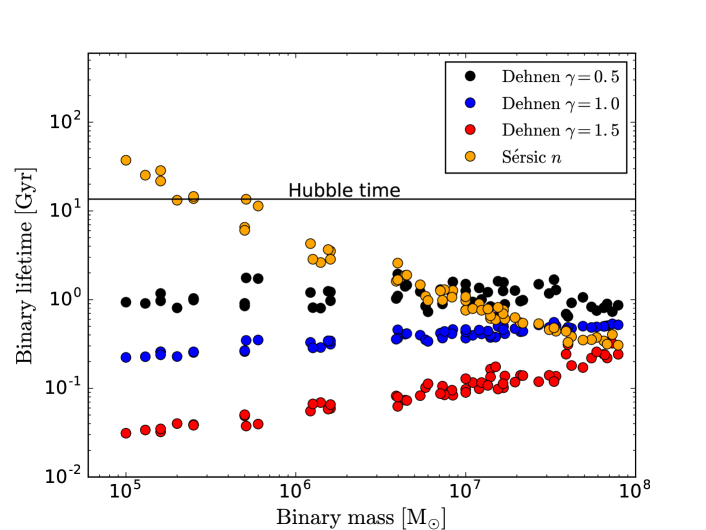
It is interesting to carry out a direct comparison between the two models. To this purpose, we calculate the binary lifetime for the galaxies of the Graham & Scott (2015) sample, using both the Denhen profile (varying ), and the Prugniel & Simien model along the – correlation of Equation (12). For consistency, we define the binary influence radius as for both models. Figure 5 gives in black, blue, and red the time-scales corresponding to the Dehnen slopes , 1.0, and 1.5, respectively. In orange, we give the result of the Prugniel Simien model to contrast the different trends of with the black hole binary mass.
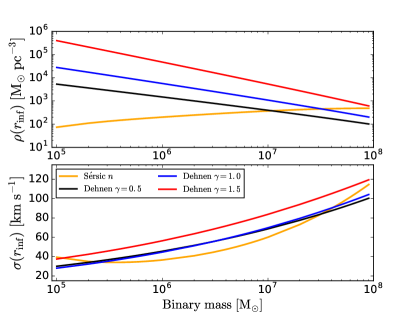
This difference can be understood by comparing, amongst the different models, the values of the density and velocity dispersion at the binary gravitational influence radius as highlighted in Figure 6. The dependence of both density and velocity dispersion on comes from the correlations –, –, and –, and from itself. We note a remarkable difference among the values of the densities between the Dehnen and the Prugniel & Simien models. In all Dehnen profiles, the stellar density is a decreasing function of the black hole binary mass and can reach values as high as for M⊙ and . Moreover, the change in stellar density is more pronounced for higher values of . By contrast, in Sérsic galaxies, the run of versus is the opposite, with remarkably lower values, down to about for M⊙. The density changes by a factor of 10 over the entire range of black hole binary masses. There is no noticeable difference instead in the values of the stellar velocity dispersion between the two families of models.
5 Conclusions
In this paper, we carried on an estimate of the hardening time of black hole binaries in the mass interval between and , relevant for LISA (Amaro-Seoane et al., 2017), under the assumption that binary contraction is driven by individual scatterings off stars. To this aim, we employed the empirical relation for the binary lifetime described in Sesana & Khan (2015), assuming that the black holes inhabit the stellar, central environment of local galaxies. In the analysis, we used two different models for the underlying stellar density and velocity dispersion profiles: the Dehnen (1993) model and the Prugniel & Simien (1997) model, the latter describing galaxies with surface brightness fit by the Sérsic profile. Using local observed correlations between the black hole mass and the mass of the spheroid (Kormendy & Ho, 2013; Scott et al., 2013), and the Sérsic index (Savorgnan et al., 2013; Davis et al., 2019) of the underlying host galaxy, we find different trends and a large spread of the binary lifetimes.
In Sérsic galaxies, described by a Prugniel & Simien profile, binary lifetimes increase with decreasing mass and exceed the Hubble time below . These time-scales have been computed assuming null eccentricity, thus providing upper limits. In high-resolution simulations of isolated collisions between dwarf galaxies, Tamfal et al. (2018) find that, when a binary forms, it already carries a rather large eccentricity, with mean . Furthermore, we know that binaries increase their eccentricity during the hardening phase by stellar scattering. Thus, when considering the eccentricity evolution, lifetimes are comparable to/smaller than the Hubble time. We further caution that uncertainties in the observed correlations (which are larger in the low-mass tail of the observed black hole population) give a spread of about one order of magnitude.
If Dehnen profiles represent the underlying stellar population of galaxies hosting black holes, we find that binary lifetimes display a nearly constant or decreasing trend with decreasing black hole binary mass. Depending on the slope of the Dehnen profile, lifetimes are overall in the range between 30 Myr and 2 Gyr. If Dehnen profiles and high Sérsic indices are representative only of the high-mass tail () of the black hole population, the black holes for which LISA will be most sensitive are subject to time delays that can span a wide range, depending on how steeply the stellar profiles rise within their gravitational sphere of influence.
Recent high-resolution observations of four strongly nucleated dwarf elliptical galaxies which host a central black hole (Nguyen et al., 2018) provided Sérsic indices for the bulge component systematically larger ( for the bulge component) than those expected from the correlations by Savorgnan et al. (2013) and Davis et al. (2019), yielding lifetimes even lower than 1 Gyr. For two galaxies (M32 and NGC 205), there is also clear evidence of a central NSC with a mass in excess of that of the central black hole, a Sérsic index larger than that of the bulge, and an effective radius larger than the black hole gravitational sphere of influence (Nguyen et al., 2018). Under these hypotheses, the inferred lifetimes are of the order of 10 Myr. In the sample from Graham et al. (2003) and Graham & Scott (2015), the black holes with mass are hosted in galaxies with stellar masses in the range between a few and , highlighting the high degree of dispersion of the black hole–stellar mass correlation. However, we note that it is in this mass range that galaxies in cluster environments such as Virgo, Coma, and Fornax (Sánchez-Janssen et al., 2018) host NSCs. The nucleation fraction has its peak of 90 per cent around a mass of , and declines at lower and higher stellar masses. Thus, we speculate that accounting for the presence of a NSC during the hardening of a black hole binary might lead to (i) shorter lifetimes and (ii) a turn over in the trend just around a pivotal mass of . Numerical simulations of black hole binary hardening in nucleated galaxies have never been explored in the literature, so far, and work is in progress along this line. At galaxy masses below , NSCs are not any longer ubiquitous (as shown in fig. 2 of Sánchez-Janssen et al., 2018) and observations of dwarfs show that their inner logarithmic slopes range widely (Gebhardt et al., 1996; Glass et al., 2011; Geha et al., 2017; Muñoz et al., 2018), with a tendency to have steeper profiles out to magnitudes of at least about -16 (Gebhardt et al., 1996). Entering the realm of dwarf galaxies makes extrapolations of scaling relations and dynamics extremely uncertain and troublesome.
Only a small fraction of dwarf spheroidals or galaxies of similar mass are however expected to host central black holes (Van Wassenhove et al., 2010). For black holes hosted in low-mass galaxies with cored profiles and dark matter-dominated, such as dwarf spheroidals, a bottleneck exists along the path to coalescence in the early stages of the merger, ruled by dynamical friction (Read et al., 2006). The drag exerted on the black hole mainly by the dark matter background is not effective enough and this leads to a failure (or major delay) in the formation of a binary, which is the phase anticipating that of stellar hardening (Tamfal et al., 2018). Thus, LISA coalescence events with binary black holes of a few require dense environments.
We remind the reader that our results rely on observations (e.g. scaling relations) of the local universe. Thus, our estimates of the lifetimes depict hypothetical mergers at . At higher redshifts (), galaxies show evolution in their averaged size (at fixed stellar galaxy mass) with scaling as , with varying from 0.7 (for late-type galaxies) to 1.48 (for early-type galaxies) (van der Wel et al., 2014). Thus, at , a factor of 4 in the reduction of the effective radius can lead to an increase of 64 in the density, if the galaxy model can be scaled self-similarly. Indeed, one recent study on massive galaxy mergers (Khan et al., 2016) showed the hardening time of two massive black holes to decrease from 10 Gyr at to yr at (see also the discussion in Mayer 2017). We expect the trend to be in the same direction, and there is the need to enlarge the sample of high-resolution simulations to consolidate this argument. However, one should remain aware that also simulations have uncertainties and results, especially for very local quantities, are dependent on sub-grid physics and resolution.
Mergers of LISA black holes at very high redshift () are even more difficult to model, as cosmological simulations are hampered by lack of resolution on the low-mass scales involved in this process (Tremmel et al., 2017). The black hole dynamics is by far more complex to describe, as halos are non-relaxed systems and subjected to repeated, multiple interactions. Gas clumps can make the dynamics stochastic, and star formation and feedback can change the underlying background, broadening significantly the lifetime distribution for the binaries in the LISA-relevant mass range (Bellovary et al., 2019; Pfister et al., 2019). Delay times between halo-halo mergers and black hole mergers can be computed using semi-analytical models which include also the formation of triple systems as a vehicle for the formation and coalescence of these light black holes (Bonetti et al., 2019).
References
- Amaro-Seoane et al. (2017) Amaro-Seoane P., et al., 2017, preprint, (arXiv:1702.00786)
- Baldassare et al. (2015) Baldassare V. F., Reines A. E., Gallo E., Greene J. E., 2015, ApJ, 809, L14
- Baldassare et al. (2017) Baldassare V. F., Reines A. E., Gallo E., Greene J. E., 2017, ApJ, 850, 196
- Barack et al. (2018) Barack L., et al., 2018, preprint, (arXiv:1806.05195)
- Begelman et al. (1980) Begelman M. C., Blandford R. D., Rees M. J., 1980, Nature, 287, 307
- Bellovary et al. (2019) Bellovary J. M., Cleary C. E., Munshi F., Tremmel M., Christensen C. R., Brooks A., Quinn T. R., 2019, MNRAS, 482, 2913
- Berczik et al. (2006) Berczik P., Merritt D., Spurzem R., Bischof H.-P., 2006, ApJ, 642, L21
- Bonetti et al. (2018) Bonetti M., Haardt F., Sesana A., Barausse E., 2018, MNRAS, 477, 3910
- Bonetti et al. (2019) Bonetti M., Sesana A., Haardt F., Barausse E., Colpi M., 2019, MNRAS, 486, 4044
- Callegari et al. (2008) Callegari S., Mayer L., Kazantzidis S., 2008, Mem. Soc. Astron. Italiana, 79, 1302
- Callegari et al. (2011) Callegari S., Kazantzidis S., Mayer L., Colpi M., Bellovary J. M., Quinn T., Wadsley J., 2011, ApJ, 729, 85
- Capelo & Dotti (2017) Capelo P. R., Dotti M., 2017, MNRAS, 465, 2643
- Capelo et al. (2015) Capelo P. R., Volonteri M., Dotti M., Bellovary J. M., Mayer L., Governato F., 2015, MNRAS, 447, 2123
- Colpi (2014) Colpi M., 2014, Space Sci. Rev., 183, 189
- Dabringhausen et al. (2008) Dabringhausen J., Hilker M., Kroupa P., 2008, MNRAS, 386, 864
- Davis et al. (2019) Davis B. L., Graham A. W., Cameron E., 2019, ApJ, 873, 85
- Dayal et al. (2019) Dayal P., Rossi E. M., Shiralilou B., Piana O., Choudhury T. R., Volonteri M., 2019, MNRAS, 486, 2336
- de Vaucouleurs (1948) de Vaucouleurs G., 1948, Annales d’Astrophysique, 11, 247
- de Vaucouleurs (1959) de Vaucouleurs G., 1959, Handbuch der Physik, 53, 275,311
- Dehnen (1993) Dehnen W., 1993, MNRAS, 265, 250
- del Valle et al. (2015) del Valle L., Escala A., Maureira-Fredes C., Molina J., Cuadra J., Amaro-Seoane P., 2015, ApJ, 811, 59
- Dotti et al. (2007) Dotti M., Colpi M., Haardt F., Mayer L., 2007, MNRAS, 379, 956
- Enoki et al. (2005) Enoki M., Inoue K. T., Nagashima M., Sugiyama N., 2005, Annual Report of the National Astronomical Observatory of Japan, 7, 34
- Fiacconi et al. (2013) Fiacconi D., Mayer L., Roškar R., Colpi M., 2013, ApJ, 777, L14
- Gebhardt et al. (1996) Gebhardt K., et al., 1996, AJ, 112, 105
- Geha et al. (2017) Geha M., et al., 2017, ApJ, 847, 4
- Glass et al. (2011) Glass L., et al., 2011, ApJ, 726, 31
- Goicovic et al. (2017) Goicovic F. G., Sesana A., Cuadra J., Stasyszyn F., 2017, MNRAS, 472, 514
- Graham & Scott (2015) Graham A. W., Scott N., 2015, ApJ, 798, 54
- Graham et al. (2003) Graham A. W., Erwin P., Trujillo I., Asensio Ramos A., 2003, AJ, 125, 2951
- Greene et al. (2008) Greene J. E., Ho L. C., Barth A. J., 2008, ApJ, 688, 159
- Hernquist (1990) Hernquist L., 1990, ApJ, 356, 359
- Holley-Bockelmann & Khan (2015) Holley-Bockelmann K., Khan F. M., 2015, ApJ, 810, 139
- Holley-Bockelmann & Sigurdsson (2006) Holley-Bockelmann K., Sigurdsson S., 2006, preprint, (arXiv:astro-ph/0601520)
- Jaffe (1983) Jaffe W., 1983, MNRAS, 202, 995
- Khan et al. (2011) Khan F. M., Just A., Merritt D., 2011, ApJ, 732, 89
- Khan et al. (2012a) Khan F. M., Preto M., Berczik P., Berentzen I., Just A., Spurzem R., 2012a, ApJ, 749, 147
- Khan et al. (2012b) Khan F. M., Berentzen I., Berczik P., Just A., Mayer L., Nitadori K., Callegari S., 2012b, ApJ, 756, 30
- Khan et al. (2013) Khan F. M., Holley-Bockelmann K., Berczik P., Just A., 2013, ApJ, 773, 100
- Khan et al. (2016) Khan F. M., Fiacconi D., Mayer L., Berczik P., Just A., 2016, ApJ, 828, 73
- Khan et al. (2018a) Khan F. M., Berczik P., Just A., 2018a, A&A, 615, A71
- Khan et al. (2018b) Khan F. M., Capelo P. R., Mayer L., Berczik P., 2018b, ApJ, 868, 97
- Klein et al. (2016) Klein A., et al., 2016, Phys. Rev. D, 93, 024003
- Kormendy & Ho (2013) Kormendy J., Ho L. C., 2013, ARA&A, 51, 511
- Läsker et al. (2016) Läsker R., Greene J. E., Seth A., van de Ven G., Braatz J. A., Henkel C., Lo K. Y., 2016, ApJ, 825, 3
- Latif & Ferrara (2016) Latif M. A., Ferrara A., 2016, Publ. Astron. Soc. Australia, 33, e051
- Lodato et al. (2009) Lodato G., Nayakshin S., King A. R., Pringle J. E., 2009, MNRAS, 398, 1392
- Lupi et al. (2015) Lupi A., Haardt F., Dotti M., Colpi M., 2015, MNRAS, 453, 3437
- Márquez et al. (2000) Márquez I., Lima Neto G. B., Capelato H., Durret F., Gerbal D., 2000, A&A, 353, 873
- Mayer (2013) Mayer L., 2013, Classical and Quantum Gravity, 30, 244008
- Mayer (2017) Mayer L., 2017, in Journal of Physics Conference Series. p. 012025 (arXiv:1703.00661), doi:10.1088/1742-6596/840/1/012025
- Mayer et al. (2007) Mayer L., Kazantzidis S., Madau P., Colpi M., Quinn T., Wadsley J., 2007, Science, 316, 1874
- Mayer et al. (2016) Mayer L., Tamburello V., Lupi A., Keller B., Wadsley J., Madau P., 2016, ApJ, 830, L13
- Merritt (2006) Merritt D., 2006, ApJ, 648, 976
- Merritt & Poon (2004) Merritt D., Poon M. Y., 2004, ApJ, 606, 788
- Mezcua (2017) Mezcua M., 2017, International Journal of Modern Physics D, 26, 1730021
- Mezcua et al. (2018) Mezcua M., Civano F., Marchesi S., Suh H., Fabbiano G., Volonteri M., 2018, MNRAS, 478, 2576
- Milosavljević & Merritt (2003) Milosavljević M., Merritt D., 2003, in Centrella J. M., ed., American Institute of Physics Conference Series Vol. 686, The Astrophysics of Gravitational Wave Sources. pp 201–210 (arXiv:astro-ph/0212270), doi:10.1063/1.1629432
- Mirza et al. (2017) Mirza M. A., Tahir A., Khan F. M., Holley-Bockelmann H., Baig A. M., Berczik P., Chishtie F., 2017, MNRAS, 470, 940
- Muñoz et al. (2018) Muñoz R. R., Côté P., Santana F. A., Geha M., Simon J. D., Oyarzún G. A., Stetson P. B., Djorgovski S. G., 2018, ApJ, 860, 66
- Nguyen et al. (2018) Nguyen D. D., et al., 2018, ApJ, 858, 118
- Pardo et al. (2016) Pardo K., et al., 2016, ApJ, 831, 203
- Peters & Mathews (1963) Peters P. C., Mathews J., 1963, Physical Review, 131, 435
- Pfister et al. (2017) Pfister H., Lupi A., Capelo P. R., Volonteri M., Bellovary J. M., Dotti M., 2017, MNRAS, 471, 3646
- Pfister et al. (2019) Pfister H., Volonteri M., Dubois Y., Dotti M., Colpi M., 2019, MNRAS, 486, 101
- Plowman et al. (2011) Plowman J. E., Hellings R. W., Tsuruta S., 2011, MNRAS, 415, 333
- Prugniel & Simien (1997) Prugniel P., Simien F., 1997, A&A, 321, 111
- Quinlan (1996) Quinlan G. D., 1996, New Astron., 1, 35
- Read et al. (2006) Read J. I., Goerdt T., Moore B., Pontzen A. P., Stadel J., Lake G., 2006, MNRAS, 373, 1451
- Reines & Volonteri (2015) Reines A. E., Volonteri M., 2015, ApJ, 813, 82
- Reines et al. (2013) Reines A. E., Greene J. E., Geha M., 2013, ApJ, 775, 116
- Rhook & Wyithe (2005) Rhook K. J., Wyithe J. S. B., 2005, MNRAS, 361, 1145
- Ricarte & Natarajan (2018) Ricarte A., Natarajan P., 2018, MNRAS, 474, 1995
- Roškar et al. (2015) Roškar R., Fiacconi D., Mayer L., Kazantzidis S., Quinn T. R., Wadsley J., 2015, MNRAS, 449, 494
- Sánchez-Janssen et al. (2018) Sánchez-Janssen R., et al., 2018, preprint, (arXiv:1812.01019)
- Sartori et al. (2015) Sartori L. F., Schawinski K., Treister E., Trakhtenbrot B., Koss M., Shirazi M., Oh K., 2015, MNRAS, 454, 3722
- Savorgnan et al. (2013) Savorgnan G., Graham A. W., Marconi A., Sani E., Hunt L. K., Vika M., Driver S. P., 2013, MNRAS, 434, 387
- Scott et al. (2013) Scott N., Graham A. W., Schombert J., 2013, ApJ, 768, 76
- Sérsic (1963) Sérsic J. L., 1963, Boletin de la Asociacion Argentina de Astronomia La Plata Argentina, 6, 41
- Sérsic (1968) Sérsic J. L., 1968, Atlas de Galaxias Australes. Observatorio Astronomico
- Sesana & Khan (2015) Sesana A., Khan F. M., 2015, MNRAS, 454, L66
- Sesana et al. (2006) Sesana A., Haardt F., Madau P., 2006, ApJ, 651, 392
- Sesana et al. (2011a) Sesana A., Gair J., Berti E., Volonteri M., 2011a, Phys. Rev. D, 83, 044036
- Sesana et al. (2011b) Sesana A., Gualandris A., Dotti M., 2011b, MNRAS, 415, L35
- Souza Lima et al. (2017) Souza Lima R., Mayer L., Capelo P. R., Bellovary J. M., 2017, ApJ, 838, 13
- Tamanini et al. (2016) Tamanini N., Caprini C., Barausse E., Sesana A., Klein A., Petiteau A., 2016, J. Cosmology Astropart. Phys., 4, 002
- Tamburello et al. (2017) Tamburello V., Capelo P. R., Mayer L., Bellovary J. M., Wadsley J. W., 2017, MNRAS, 464, 2952
- Tamfal et al. (2018) Tamfal T., Capelo P. R., Kazantzidis S., Mayer L., Potter D., Stadel J., Widrow L. M., 2018, ApJ, 864, L19
- Terzić & Graham (2005) Terzić B., Graham A. W., 2005, MNRAS, 362, 197
- Tremaine et al. (1994) Tremaine S., Richstone D. O., Byun Y.-I., Dressler A., Faber S. M., Grillmair C., Kormendy J., Lauer T. R., 1994, AJ, 107, 634
- Tremmel et al. (2017) Tremmel M., Karcher M., Governato F., Volonteri M., Quinn T. R., Pontzen A., Anderson L., Bellovary J., 2017, MNRAS, 470, 1121
- Van Wassenhove et al. (2010) Van Wassenhove S., Volonteri M., Walker M. G., Gair J. R., 2010, MNRAS, 408, 1139
- Van Wassenhove et al. (2014) Van Wassenhove S., Capelo P. R., Volonteri M., Dotti M., Bellovary J. M., Mayer L., Governato F., 2014, MNRAS, 439, 474
- van der Wel et al. (2014) van der Wel A., et al., 2014, ApJ, 788, 28
- Vasiliev (2014) Vasiliev E., 2014, Classical and Quantum Gravity, 31, 244002
- Vasiliev (2016) Vasiliev E., 2016, in Meiron Y., Li S., Liu F.-K., Spurzem R., eds, IAU Symposium Vol. 312, Star Clusters and Black Holes in Galaxies across Cosmic Time. pp 92–100 (arXiv:1411.1762), doi:10.1017/S1743921315007607
- Vasiliev et al. (2015) Vasiliev E., Antonini F., Merritt D., 2015, ApJ, 810, 49