DISCOVERY OF HIGHLY BLUESHIFTED BROAD BALMER AND METASTABLE HELIUM ABSORPTION LINES IN A
TIDAL DISRUPTION EVENT
Abstract
We report the discovery of non-stellar hydrogen Balmer and metastable helium absorption lines accompanying a transient, high-velocity (0.05) broad absorption line (BAL) system in the optical spectra of the tidal disruption event (TDE) AT2018zr (). In the HST UV spectra, absorption of high- and low-ionization lines are also present at this velocity, making AT2018zr resemble a low-ionization broad absorption line (LoBAL) QSO. We conclude that these transient absorption features are more likely to arise in fast outflows produced by the TDE than absorbed by the unbound debris. In accordance with the outflow picture, we are able to reproduce the flat-topped H emission in a spherically expanding medium, without invoking the typical prescription of an elliptical disk. We also report the appearance of narrow (1000 km s-1) N iii 4640 Å, He ii , H, and H emission in the late-time optical spectra of AT2018zr, which may be a result of UV continuum hardening at late time as observed by Swift. Including AT2018zr, we find a high association rate (3 out of 4) of BALs in the UV spectra of TDEs. This suggests that outflows may be ubiquitous among TDEs and may be less sensitive to viewing angle effects compared to QSO outflows.
1 Introduction
Occasionally, a star passing too close to a black hole may be disrupted by tidal stresses. This results in an observable transient flare of radiation powered by the accretion of about half of the stellar debris onto the black hole (Rees, 1988; Phinney, 1989). A significant amount of theoretical work has been devoted to predicting the rate at which the stellar debris fall back to the pericenter. For black holes with , the fallback rate, and the accretion rate if circularization is efficient, may exceed the Eddington rate at early times (Evans & Kochanek, 1989; Ulmer, 1999; Strubbe & Quataert, 2009; Lodato & Rossi, 2011; Metzger & Stone, 2016; Wu et al., 2018), leading to the formation of radiation powered winds or jets.
Observations across all wavelengths have revealed that outflows may be ubiquitous among TDEs. In the well-studied TDE ASASSN-14li, highly ionized outflows have been detected at both low (a few ; Miller et al., 2015) and high velocities (0.2; Kara et al., 2018) in the X-ray. Radio observations of ASASSN-14li also revealed the presence of a sub-relativistic outflow (Alexander et al., 2016) or an off-axis relativistic jet (van Velzen et al., 2016; Pasham & van Velzen, 2018).
Spectroscopy is a powerful tool for probing the kinematics and physical conditions in TDEs. Especially in the far-UV (FUV), spectroscopy can shed light on the ionization structures owing to the wealth of atomic transitions encompassed in this wavelength range. For the three TDEs that were observed with the Space Telescope Imaging Spectrograph (STIS) onboard the Hubble Space Telescope (HST), blueshifted absorption lines at FUV wavelengths that signify the presence of outflows were detected in all three sources, namely, ASASSN-14li, iPTF16fnl, and iPTF15af (Cenko et al., 2016; Brown et al., 2018; Blagorodnova et al., 2018a). These absorption lines are thought to be “intrinsic”, meaning that the absorbing gas is physically close to the TDE. In particular, the broad, saturated absorption troughs of high-ionization transitions in iPTF15af are reminiscent of those seen in broad absorption line (BAL) QSOs. Blagorodnova et al. (2018a) concluded that these features could only form in absorbers with high column densities .
Although the current sample of UV spectroscopy of TDEs is small, a few spectroscopic distinctions between TDEs and QSOs have emerged in the past few years. For example, common quasar emission lines such as Mg ii and C iii] are either weak or entirely missing in TDE spectra. The absence of Mg ii may be explained if these TDEs have a hotter continuum that has photoionized most Mg to higher ionization states (Cenko et al., 2016; Brown et al., 2018). On the other hand, the prominent N iii] relative to C iii] in TDEs may imply abundance anomalies due to CNO cycle in the pre-disrupted star (Cenko et al., 2016; Kochanek, 2016). Simulations have shown that the anomalous abundance features should be present after the time of peak fallback rate () and are more significant in higher mass stars (Kochanek, 2016; Yang et al., 2017; Gallegos-Garcia et al., 2018).
Observationally, TDEs have been discovered at a rate of 1–2 per year. Starting in 2018, we expect to see an order of magnitude increase in TDE discovery rate from the combined yield of ground-based optical surveys (e.g. Hung et al., 2018). In light of this opportunity, we have started a monitoring campaign to obtain a series of UV spectra of newly discovered TDEs with HST. AT2018zr (aka PS18kh) is the first target of this campaign (Program ID 15331; PI Cenko). In this paper, we present the analysis of intensive spectroscopic observations of the TDE AT2018zr spanning across the UV and optical wavelengths in the first three months since discovery, plus two late time ( d and 248 d) optical spectra.
While inspecting the data, we discovered a high-velocity (0.05) broad absorption line (BAL) system that is accompanied by non-stellar hydrogen Balmer and metastable helium absorptions, the first time this has been observed in a TDE. The high S/N optical spectra enabled us to propose that a spherically expanding outflow is preferred over the elliptical disk model (Holoien et al., 2018) for generating the observed flat-topped H line.
This paper is structured as follows. We summarize the discovery and photometric observations of AT2018zr in § 2, detail the observation configurations and data reduction for the UV and optical spectra in this work in § 3, describe our analysis of the emission and absorption features identified in the data in § 4, and compare these observations with other TDEs and discuss the results in § 5. We summarize our findings in § 6.
2 Discovery of AT2018zr
AT2018zr (aka PS18kh) is a tidal disruption event first discovered by Pan-STARRS1 on UT 2018 Mar 02 (Tucker et al., 2018; Holoien et al., 2018). The flare is coincident (offset 0.1″) with the galaxy SDSS J075654.53+341543.6 at a redshift of (§ 3.2). Archival observations of this galaxy suggest the galaxy is dominated by an old stellar population ( Gyr) with a stellar mass of (van Velzen et al., 2019). The lack of X-ray emission prior to the TDE flare suggests little or no AGN activity (Holoien et al., 2018). A black hole mass of is inferred from the host photometry (Holoien et al., 2018; van Velzen et al., 2019). While the Zwicky Transient Facility (ZTF; Bellm et al., 2019; Graham et al., 2019) was still in the commissioning phase, the survey serendipitously observed this object since 2018 Feb 7. A complete set of ZTF light curves of this source can be found in van Velzen et al. (2019).
Holoien et al. (2018) and van Velzen et al. (2019) analyzed the broadband multi-wavelength (UV/optical/X-ray/radio) properties of AT2018zr. Before the object was Sun-constrained, they found the UV and optical emission of this source corresponds to a constant blackbody temperature of K in the first 40 days then increased to K (Holoien et al., 2018; van Velzen et al., 2019). A weak, thermal ( 100 eV) X-ray source two orders of magnitude less luminous than the UV was detected (van Velzen et al., 2019). The late-time ( 170 days) UV/optical photometric observations show a significant increase in the blackbody temperature ( K) while the X-ray flux remained almost the same (van Velzen et al., 2019).
Holoien et al. (2018) also analyzed the optical spectra of AT2018zr. Their observations were made in the period before the target became sun-constrained, while ours extend to later epochs when the target was visible again. Their analysis used a combination of wind, elliptical disk, and spiral arm to fit the H line profile, and inferred a large size for the accretion disk ( and ).
3 Observations
After it was confirmed that AT2018zr was bright in the UV from Swift (Neil Gehrels Swift Observatory; Gehrels et al., 2004) observations, we triggered a series of spectroscopic follow-up observations with HST STIS as well as other ground-based optical telescopes. No observations were made when the target went behind the Sun between 2018 June and 2018 August. Nevertheless, we resumed following up this source when it became visible again in 2018 September. All the spectra presented in this paper have been corrected for galactic extinction using the Schlafly & Finkbeiner (2011) dust map. Assuming a Cardelli et al. (1989) extinction curve, using = 3.1 and at this position corresponds to a galactic visual extinction of mag. Throughout this paper, we adopt a flat CDM cosmology with Mpc-1, , and . The time difference () is expressed in rest-frame time with respect to the band maximum at MJD 58194.49.
3.1 HST STIS Spectra
We obtained 5 epochs of UV spectra of AT2018zr with HST STIS (GO 15331; PI Cenko) on 2018 April 11 (=23 d), 25 (=36 d), 30 (=41 d), May 20 (=59 d), and 23 (=62 d). The spectra were obtained through a 52″ 0.″2 aperture. For the near-UV (NUV) and FUV MAMA detectors, the G140L and G230L gratings were used in order to cover the spectral range of 1570–3180 Å and 1150–1730 Å at a resolution of 1.2 Å and 3.2 Å, respectively. During each visit, the observation was obtained over 3 HST orbits, with 3 equal exposures of 674 s in the NUV and 6 equal exposures of 920 s in the FUV. We combined the 1-dimensional spectra for each epoch using inverse-variance weighting.
3.2 Optical Spectra
We obtained 14 optical spectra of AT2018zr in total. The observing configuration for each spectrum is detailed in Table 1. The data obtained with the Spectral Energy Distribution Machine (SEDm), an integral-field-unit (IFU) spectrograph, were automatically processed by the data reduction pipeline and were flux-calibrated with the observations of spectrophotometric standard stars (Blagorodnova et al., 2018b).
Spectra obtained with the Auxiliary-port CAMera (ACAM) on the 4.2-m William Herschel Telescope (WHT), the Deveny spectrograph on the Discovery Channel Telescope (DCT), the Double Beam Spectrograph (DBSP) on the Palomar 200-inch (P200) telescope, and with Gemini/GMOS-N were reduced with standard IRAF routines. We performed bias subtraction and flat-fielding in the raw science frames and extracted the 1D spectrum. Afterwards, we performed wavelength and flux calibration using observations of the arc lamp and flux standard stars from the same night.
Data obtained with the Keck Low-Resolution Imaging Spectrometer (LRIS) (Oke et al., 1995) were reduced with the LRIS automated reduction pipeline 111http://www.astro.caltech.edu/~dperley/programs/lpipe.html.
We measured a redshift of using Ca H+K 3969, 3934 and the near infrared Ca II triplet (8498, 8542 and 8662 Å) absorption lines that originated from the host galaxy from the late-time Keck spectrum obtained in December 2018.
| Obs Date | Phase (days) | Telescope + Instrument | Slit Width | Grism/Grating | Exp Time (s) |
|---|---|---|---|---|---|
| 2018-03-07 | -10 | P60 + SEDm | N/A | 1800 | |
| 2018-03-26 | 8 | P60 + SEDm | N/A | 1800 | |
| 2018-03-27 | 9 | P60 + SEDm | N/A | 2700 | |
| 2018-03-28 | 10 | WHT + ACAM | 1.0″ | V400 | 3200 |
| 2018-04-04 | 16 | DCT + DeVeny | 1.5″ | 300g/mm | 2400 |
| 2018-04-11 | 23 | DCT + DeVeny | 1.5″ | 300g/mm | 2400 |
| 2018-04-17 | 28 | Keck1 + LRIS | 1.0″ | 400/3400 + 400/8500 | 1250 |
| 2018-04-19 | 30 | Gemini + GMOS-N | 1.0″ | B600 | 600 |
| 2018-05-05 | 45 | Gemini + GMOS-N | 1.0″ | B600 | 600 |
| 2018-05-06 | 46 | DCT + DeVeny | 1.5″ | 300g/mm | 3000 |
| 2018-05-10 | 50 | Keck1 + LRIS | 1.0″ | 600/4000 + 400/8500 | |
| 2018-05-13 | 53 | DCT + DeVeny | 1.5″ | 300g/mm | 1800 |
| 2018-05-19 | 58 | DCT + DeVeny | 1.5″ | 300g/mm | 900 |
| 2018-09-14 | 169 | Keck1 + LRIS | 1.0″ | 600/4000 + 400/8500 | 1200 |
| 2018-12-08 | 248 | Keck1 + LRIS | 1.0″ | 600/4000 + 400/8500 | 3600 |
4 Analysis
The interpretation of the UV and optical spectra are complicated by the presence of a high velocity transient BAL system at (§ 4.1). This BAL system manifests in UV and optical absorption troughs on top of the TDE continuum or, sometimes, the emission lines. The rest-frame optical broad absorption lines such as the hydrogen Balmer series and the metastable helium lines are particularly rare even in BALQSOs. In the following subsections, we carefully account for these absorption features while identifying and measuring the UV and optical emission lines.
4.1 Absorption Lines
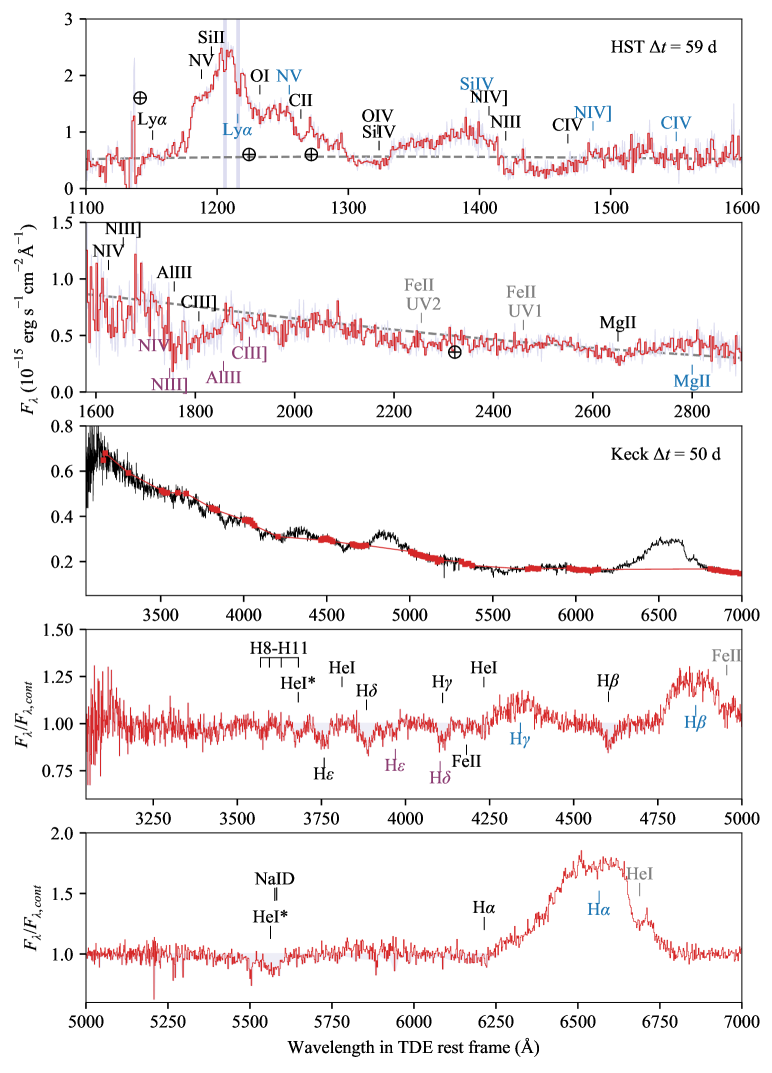
We identified highly blueshifted hydrogen Balmer series, He i , and He i transitions in the Keck optical spectrum from =50 d. These features can be easily seen when the spectrum is normalized with respect to the continuum, as shown in Figure 1. We modelled these lines with a single Gaussian and present the EW and FWHM measurements for the hydrogen and helium absorption lines in Table 2. Because the H Balmer and He i absorption lines are often accompanied by contamination from nearby features, the definition of local continuum is more uncertain. For example, the EW measured for the H absorption should be viewed as a lower limit since the blueshifted H absorption is close to the broad blue wing of the H emission. Given the blueshifted H absorption may be susceptible to H emissions in the TDE rest frame, the measured EW should also be considered as a lower limit. We measured a FWHM of 2720200 km s-1 for H absorption, which is the strongest blueshifted optical absorption line that is free from contamination. From these lines, we derived a mean velocity of (15,500400) km s-1 by employing the relativistic Doppler equation. Absorptions at this velocity also match with the troughs seen in the HST STIS spectra in both high (N v , Si iv , N iv] , C iv , N iii] , C iii] , Al iii ) and low (Si ii , C ii , [O i] , and Mg ii ) ionization lines in the last two epochs (day 59 and day 62). We stacked the two HST spectra as there is little spectroscopic evolution during this time, and tabulated a list of detected UV absorption lines in Table 3. We also include measurements of the absorption central wavelength and the width in TDE rest frame, where possible.
| Line | f | EW | FWHM | ||
|---|---|---|---|---|---|
| (Å) | (km s-1) | (Å) | ( km s-1) | ||
| H | 6564.64 | 0.641080 | 16,560 560 | 2.771.53a | 2.52 1.32 |
| HeI | 5875.00 | 0.610230 | 15,230 120 | 9.101.07 | 3.12 0.21 |
| H | 4862.70 | 0.119380 | 15,380 90 | 5.000.39 | 2.72 0.20 |
| H | 4341.69 | 0.044694 | 15,530 120 | 3.550.86a | 2.32 0.25 |
| H | 4102.90 | 0.022105 | 15,390 80 | 5.160.13a | 2.98 0.20 |
| H | 3970.00 | 0.012711 | 15,870 120 | 4.110.16 | 3.01 0.29 |
| HeI* | 3888.65 | 0.064474 | 15,640 160 | 2.440.14 | 2.32 0.35 |
Note. — EW measured in TDE rest frame.
aMeasurements are subject to contamination from nearby spectroscopic features.
| Line | velocity | FWHM | ||
|---|---|---|---|---|
| Å | Å | km s-1 | km s-1 | |
| NV | 1240 | 1182–12032 | ||
| SiII | 1263 | 1182–12032 | ||
| OI | 1302 | 1230 | 16,900 | 3,300 |
| CII | 1334.43 | 1263 | 16,500 | 2,000 |
| SiIV | 1398.0 | 1320 | 18,000 | 9,800 |
| NIII | 1500.0 | 1422 | 16,100 | 1,800 |
| CIV | 1548.20 | 1460 | 19,000 | 8,800 |
| AlIII | 1856.76 | 1760 | 16,500 | 1,900 |
| CIII] | 1909.0 | 1810 | 16,000 | 1,1000 |
| MgII | 2796.3, 2803.4 | 2652 | 16,200 | 2,600 |
The relative line intensities of multiple hydrogen Balmer transitions are often used to constrain neutral hydrogen column density. Assuming all photons irradiated by the continuum pass through the same amount of gas at a given velocity, the observed radiation should have the form
| (1) |
where is the radiation of the continuum source and is the line excitation temperature. Assuming that is negligible compared to the continuum temperature (), the relative line depression can be expressed as
| (2) |
where is the normalized intensity of the absorption trough, is the line-of-sight (LOS) covering factor of the absorber in percentage and is the optical depth of the given transition. We note that in the case where the above assumption is invalid ( is non-negligible), the EW of the line will be altered by a factor of . This effect on the observed line EW is degenerate with that of the covering factor.
The column density of an ionic species can be expressed as
| (3) |
where is the oscillator strength and is the rest wavelength in Å. The optical depth ratio can be derived under the assumption that the absorbing gas is in local thermodynamic equilibrium. The relative line center opacity () between transitions 1 and 2 can be simplified to (Arav et al. 2010)
| (4) |
where is the statistical weight of the lower level, is the oscillator strength, and is the wavelength of the transition.
It is clear from the line ratios that the H Balmer absorption lines are quite saturated. If the H Balmer absorptions were optically thin, the EW ratio for the H Balmer series should be close to :::: 81.5: 11.2: 3.8: 1.8: 1. However, as shown in Table 2, the observed EW of all the H Balmer lines are very similar, suggesting these lines are largely suppressed due to non-negligible optical depth.
From the normalized spectrum, we also noticed that the absorptions are non-black, meaning they do not extend down to zero. This is a clear sign of partial covering, where the absorbing material does not cover the photoionizing continuum entirely.
We first model the observed Balmer absorption lines with Equation 2 by locking the relative opacity for each transitions and assuming a constant covering factor () across all the hydrogen line profiles. The best-fit parameters from directly fitting the observed spectrum are and . We convert this to a H i column density of cm-2 with Equation 2. However, the optical depth and therefore the H i column density derived from direct fitting may underestimate the actual values. The opacity is strongly suppressed by the fitting routine since the model line shape becomes flat-topped as it saturates, while the observed absorption features are more peak-like. One possibility is that each absorption trough is comprised of multiple unresolved narrow components with different velocities rather than a single broad component.
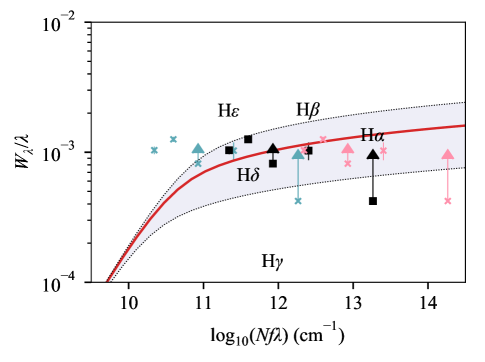
Rather than fitting the line profile, we instead use the curve of growth method to model the total opacity summed over the H Balmer transitions. We exclude the use of the H and H in the fit due to uncertain contribution from nearby emission lines. Shown in Figure 2, our best-fit Gaussian parameter (), ionic column density (), and covering factor are km s-1, cm-2, and , respectively. The high opacity of the Balmer lines place the data points on the logarithmic regime of the curve, where the equivalent width () is relatively insensitive to (). The large uncertainty in may be attributed to the fact that this parameter is degenerate with the covering factor. However, the absorber needs to cover at least 15% of the continuum as measured from H. Therefore, must be narrower than 500 km s-1, which translates to a FWHM of 900 km s-1. Considering these effects, the true should be even higher, placing a lower limit for .
4.2 UV Spectroscopy
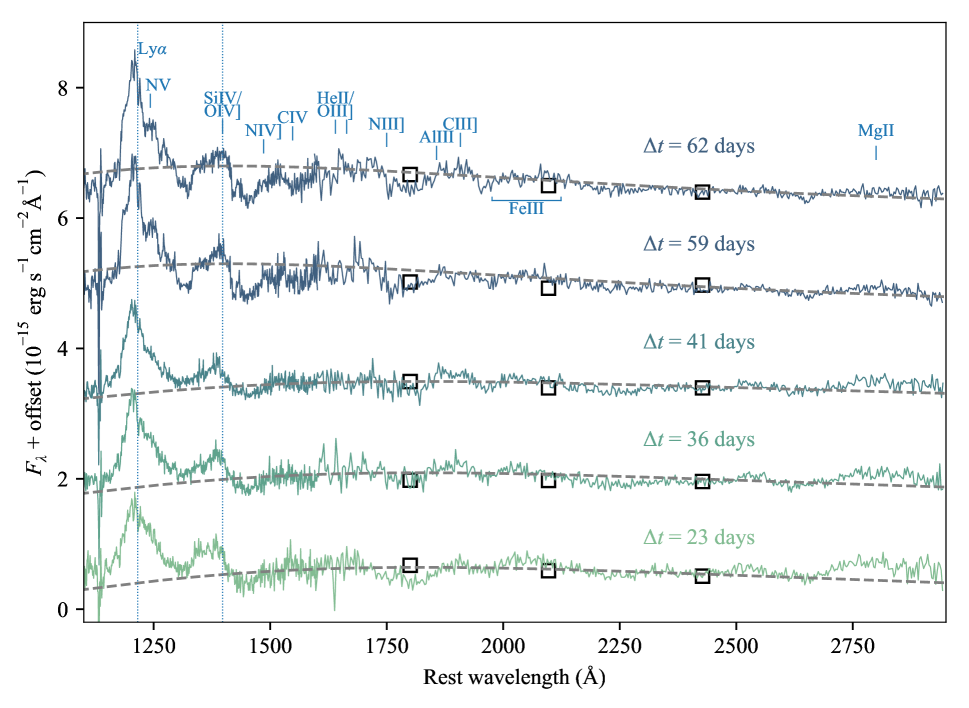
We present 5 epochs of HST spectra in Figure 3, where blackbody spectra with temperatures derived from the broadband NUV and optical photometry (see van Velzen et al. 2019) are overplotted with grey dashed lines. Traditionally, observers found the UV and optical photometry measured by Swift in TDEs in agreement with a blackbody spectrum with K (e.g. Holoien et al., 2016a; Hung et al., 2017). However, this agreement has not been carefully examined blueward of the Swift band (central wavelength 1928 Å). In fact, previous works have also suggested that a significant amount of TDE radiation may be emitted in the extreme UV (e.g. Dai et al., 2018). Therefore, while the blackbody spectrum captures the general shape of the NUV spectra in all 5 epochs, the FUV continuum cannot be determined as accurately. We also note that this blackbody spectrum cannot account for the X-ray flux that was observed in AT2018zr. A second blackbody of eV is required to describe the entire SED (van Velzen et al., 2019).
The UV spectra of AT2018zr show complex features, where broad emission and absorption are variable and often blended together, making it difficult to measure these lines accurately. In particular, the high-velocity BAL features (§ 4.1) only become discernible in the UV spectra in later epochs. Despite the uncertainties in FUV continuum placement, we conclude the evolution of the FUV lines by assuming the underlying continuum is a single blackbody, with temperatures extrapolated from NUV and optical observations. Here we summarize the observed properties of these features qualitatively.
-
1.
The Ly emission line is blueshifted by about km s-1 in all 5 epochs. Assuming no additional source of FUV continuum flux, Ly becomes 50% more prominent after days.
-
2.
High ionization N v emission may be present but is blended with the red wing of the broad Ly, therefore the N v emission peak cannot be individually resolved.
-
3.
High ionization emission line Si iv is also blueshifted with respect to the rest frame of the host.
-
4.
In the first two epochs, there is a marginally detected broad feature (FWHM km s-1) at the rest wavelength of Mg ii .
- 5.
-
6.
None of the emission peaks shifted significantly over the monitoring period, which suggests that the kinematics of the UV line emitting region did not vary much in the first two months.
-
7.
The absorption features at km s-1 are weak or completely absent in the first 3 epochs. In the last two epochs, absorption lines including high ionization lines N v , Si iv , C iv , and low ionization lines [O i] , C ii , Si ii , C iii , Al iii , and Mg ii are detected in the spectra. These UV absorption features detected in AT2018zr fit in the low-ionization BAL (LoBAL) category.
-
8.
The UV broad absorption lines are saturated and non-black, suggesting partial covering of the continuum source. In the later two epochs, the UV absorptions are also seen to be shallower than the emission lines (e.g. Ly), which indicates that the BAL system does not cover the line emitting region entirely, either.
4.3 Optical Spectroscopy
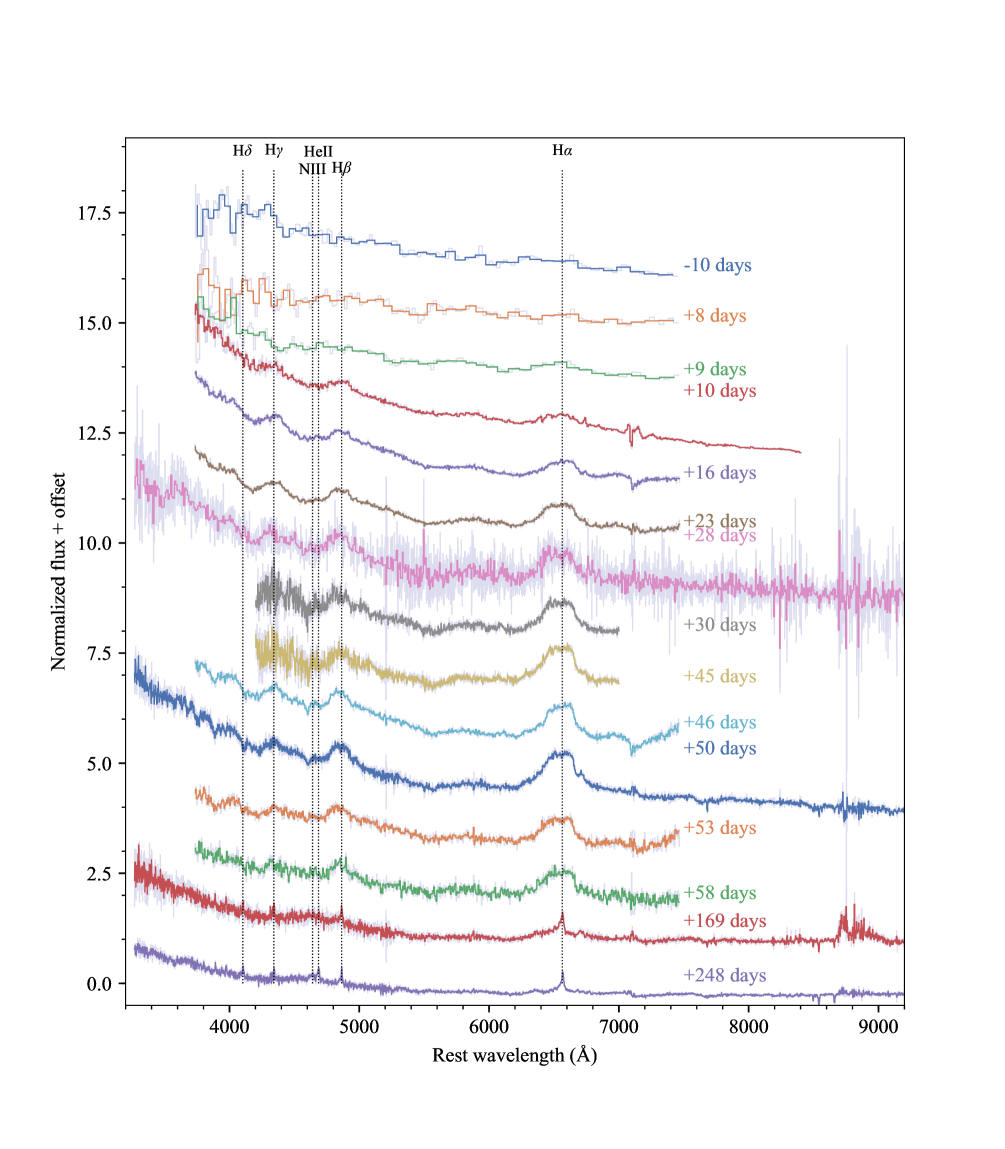
At optical wavelengths, host galaxy contributes a non-negligible amount of flux to the observed spectrum. Since there was no pre-flare spectrum of the host galaxy, we estimated the host flux by fitting a synthetic galaxy spectrum with SDSS model magnitudes (van Velzen et al., 2019). To perform subtraction of the host flux, we calibrated the flux level in each optical spectrum against Swift V-band photometry, interpolated to the spectroscopic epochs. We then convolved the synthetic host galaxy spectrum with a Gaussian kernel to account for instrumental broadening and subtracted the broadened, synthetic spectrum from our observed spectra. A montage of the host-subtracted spectra is shown in Figure 4. The flux is normalized to the 5500–6000 Å region in rest wavelength and offset from each other for better visualization.
We describe our analysis of the optical spectra before and after the Sun-constrained break separately, because the line profiles were dramatically different after the break.
Both broad H and H lines were readily detected in the spectra from day 10 onward. The strength of these lines grew monotonically with time in the first two months. In the earlier set of spectra with good S/N, we noticed that the H and H emission profiles were asymmetric, with what appeared to be a ‘dent’ in the red wing (Figure 1). Although the positions of these ‘dents’ are consistent with He i and Fe ii blueshifted by the same velocity as the BAL system, the width and depth are broader and stronger than the other optical absorption lines. Given the similarity in the line profile shapes of H and H (Figure 5 and Figure 7), this asymmetry is more likely the result of emission line region geometry than contamination from neighboring absorption lines.
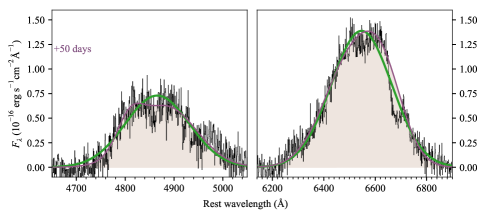
Interestingly, the flat-topped H Balmer emission profiles in AT2018zr in the earlier monitoring period differ from the Gaussian emission lines seen in other TDEs. This motivated Holoien et al. (2018) to fit these lines with a model that combines the effects of an elliptical disk, spiral arm, and wind. Here, we use two different approaches to model the observed lines, including (1) phenomenological fitting with two Gaussians and (2) radiative transfer equation in a spherical outflow.
4.3.1 Double Gaussian Model
In our initial attempt to fit these lines, we noticed that the line profiles, especially H, cannot be well described by a single Gaussian (green solid line in Figure 5). Therefore, we chose to fit each flat-topped Balmer line with two Gaussians simultaneously. Note that the choice of model was not motivated by the underlying physics of line formation, but rather to obtain satisfactory description of the line profiles. This allows us to measure the FWHM and line luminosity for comparison with other TDEs.
We first measured the continuum level in the spectral lines by performing a quadratic fit to the region enclosing the lines (4630–5150 Å for H and 5950–6950 Å for H). Although we have subtracted the synthetic galaxy from our observed spectra prior to measuring the lines, we find the spectra near H and H line centers to be noisy, and may still have residual contribution from the host. Therefore, we masked the line centers while fitting the emission lines. In the two-component fit, we set constraints for the two components to center blueward and redward of the rest wavelength of the line and allowed the linewidths and amplitudes to vary freely.
The best-fit two-component model is marked in purple in Figure 5. From the best-fit models, we measured the luminosity, equivalent width (EW), and FWHM for both H and H lines. These parameters are tabulated in Table 4 and Table 5.
| Phase | FWHM | EW | Luminosity |
|---|---|---|---|
| (days) | ( km s-1) | (Å) | ( erg s-1) |
| 10 | 1.350.81 | 8617 | 2.00.2 |
| 16 | 1.260.17 | 894 | 1.90.3 |
| 23 | 1.390.12 | 1464 | 3.40.4 |
| 28 | 1.421.62 | 188403 | 4.08.9 |
| 30 | 1.420.10 | 1983 | 4.40.4 |
| 45 | 1.390.09 | 2242 | 5.20.2 |
| 46 | 1.280.13 | 2027 | 3.80.4 |
| 50 | 1.440.21 | 26526 | 5.31.5 |
| 53 | 1.350.13 | 1594 | 3.20.3 |
| 58 | 1.420.38 | 19011 | 4.20.3 |
| 169 | 0.430.18 | 0.20.1 | |
| 248 | 0.350.07 | 0.1 | |
| 169n | 0.110.07 | (8.72.0) | |
| 248n | 0.070.03 | (4.90.8) |
Note. — n denotes the measurements for the narrow components. We do not calculate the equivalent width in late time spectra due to the complexity in separating the broad and narrow components.
| Phase | FWHM | EW | Luminosity |
|---|---|---|---|
| (days) | ( km s-1) | (Å) | ( erg s-1) |
| 10 | 1.140.22 | 212 | 1.00.2 |
| 16 | 1.050.56 | 2711 | 1.10.6 |
| 23 | 1.230.18 | 333 | 1.20.2 |
| 28 | 1.172.78 | 46283 | 1.65.3 |
| 30 | 1.170.22 | 422 | 1.40.2 |
| 45 | 0.960.63 | 3913 | 1.20.5 |
| 46 | 0.960.59 | 4111 | 1.30.5 |
| 50 | 1.200.09 | 471 | 1.50.1 |
| 53 | 1.110.36 | 2712 | 0.90.4 |
| 58 | 0.891.04 | 3448 | 1.10.9 |
| 169 | 0.150.05 | 0.1 | |
| 248 | 0.190.02 | 0.1 | |
| 169n | 0.050.02 | (2.01.4) | |
| 248n | 0.040.01 | (1.80.4) |
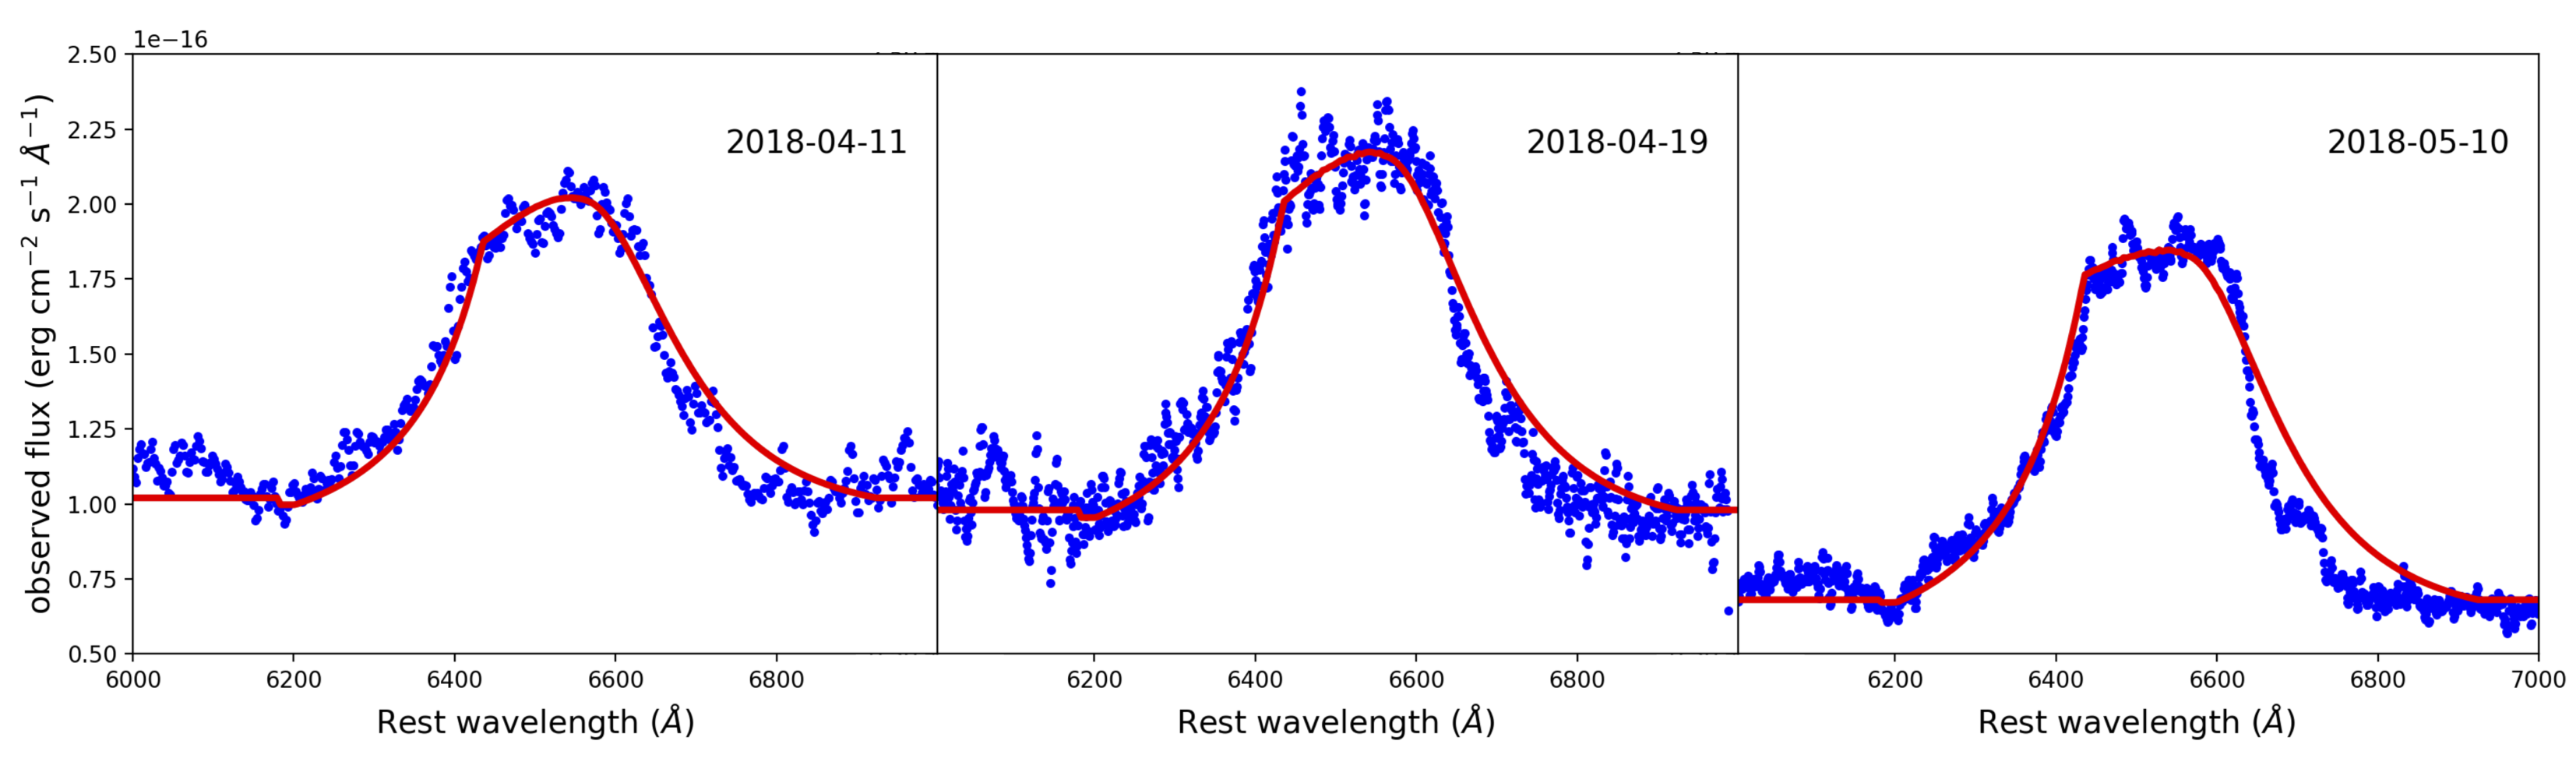
4.3.2 Spherical Outflow Model for Emission Lines
Roth & Kasen (2018) demonstrated that in TDE outflows, the blue absorption wing of a classical P-Cygni profile may appear mostly as emission if the line excitation temperature is sufficiently high. Given the similarity of their theoretical line profile to our observations, we also fit the H emission with this radiative transfer model proposed by Roth & Kasen (2018) for three different epochs.
We consider a spherically symmetric, homologously expanding () medium. A continuum photosphere is located at radius , which is responsible for emitting the observed continuum flux at wavelengths near H at the time of interest. The gas density falls off as at radii beyond out to a maximum radius , where the velocity is . The line absorption opacity and the line Doppler width are set to single values at all positions outside the continuum photosphere. The line excitation is set by where and are chosen so that the line excitation temperature equals a specified value at the photosphere, and at . The Sobolev approximation can then be used to calculate the observed emission by integrating the line source function along lines of sight passing through the line-emitting material, as in Jeffery & Branch (1990); Roth & Kasen (2018). The strength of the emission line with respect to the continuum flux is then related to the Sobolev depth at each radius:
| (5) |
For the conditions considered here, the electron scattering optical depth is negligible for the line photons.
Rather than perform a full multi-dimensional fit, we set all the parameters to the fiducial values listed in Table 6 and then adjusted the value of between spectral epochs until we judge by eye that a satisfactory fit has been achieved. The continuum flux is also adjusted between epochs to match what is observed. The resulting values are listed in Table 7. Given the definition of , the values of and are degenerate in this formulation, since only their product enters into the calculation, as long as . The results are plotted in Figure 6
| (cm) | (cm) | (104 km s-1) | (g cm-3) | (K) | (K) |
|---|---|---|---|---|---|
| 1.75 |
| (days) | 23 | 30 | 50 |
|---|---|---|---|
| 0.39 | 0.48 | 0.47 | |
| Continuum flux | |||
| (erg cm-2 s-1 Å-1) |
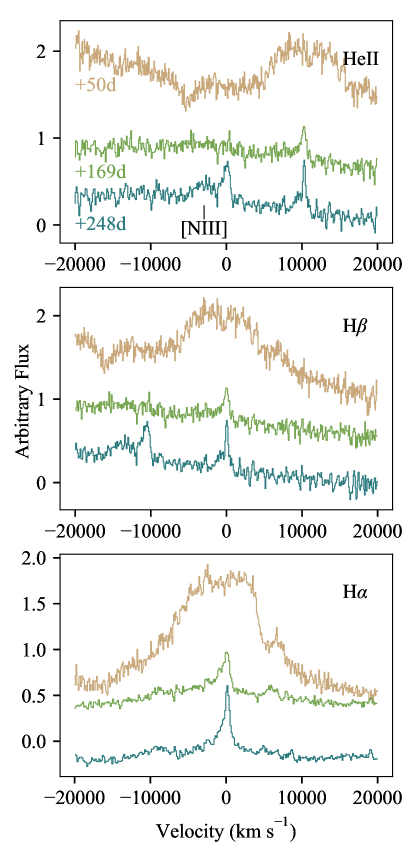
4.3.3 Late-Time Optical Spectrum
The spectroscopic features showed dramatic changes (Figure 7) at late times (= 169 d and 248 d), . First, He ii and N iii 4640 Å, a strong transition of the Bowen fluorescence (BF) mechanism, emission lines are readily detected on day 248, while the detections are somewhat tentitive on day 169. In BF, the He ii Ly photons at 303.783 Å can excite a number of nearby transitions, which decay into optical emission lines such as O iii (at 3133, 3429, and 3444 Å) and N iii 4640 Å. BF emission lines have been detected in systems such as planetary nebulae and X-ray binaries and also in TDE iPTF-15af (Blagorodnova et al., 2018a).
The late appearance of the He ii emission is unlike most of the other TDEs (e.g. PS1-10jh, Gezari et al. 2012), where hydrogen emission is often suppressed relative to helium at early times (Roth et al., 2016). From the point of view of photoionization, the absence of the He ii line may be attributed to the lack of He ii ionizing photons ( eV) at earlier times. This is supported by the fact that the blackbody temperature of AT2018zr is cooler than many other TDEs at first, but warms up drastically at later times (van Velzen et al., 2019). The hot continuum indicated by the late-time Swift observations would naturally explain the emergence of the He ii emission.
The broad H and H emission became extremely weak when we revisited this source on d. Instead, narrow H and H emission emerged. The most striking difference is found in the H and H line, which are now dominated by two strong narrow components whereas the broad H and H emission have vastly diminished, though they can still be seen. We measured H and H in the late-time spectra with a double Gaussian model, where both broad and narrow components are initially centered at the rest wavelength of the transition. We show the best-fit results in Table 4 and Table 5. The newly formed narrow H and H emission have FWHMs on the order of km s-1, corresponding to a virial radius of cm.
5 Discussion
5.1 UV Spectra of TDEs
AT2018zr is the fourth optically discovered TDE with HST UV spectroscopic observations. We compare its HST spectrum with the other three—ASASSN-14li, iPTF15af, and iPTF16fnl—in Figure 8 (Cenko et al., 2016; Brown et al., 2018; Blagorodnova et al., 2018a). In particular, iPTF16fnl is the only other TDE with a UV spectroscopic sequence (Brown et al., 2018). For comparison, we also show a composite spectrum of low-ionization broad absorption line (LoBAL) QSOs from the FIRST Bright Quasar Survey (Brotherton et al., 2001) in green.
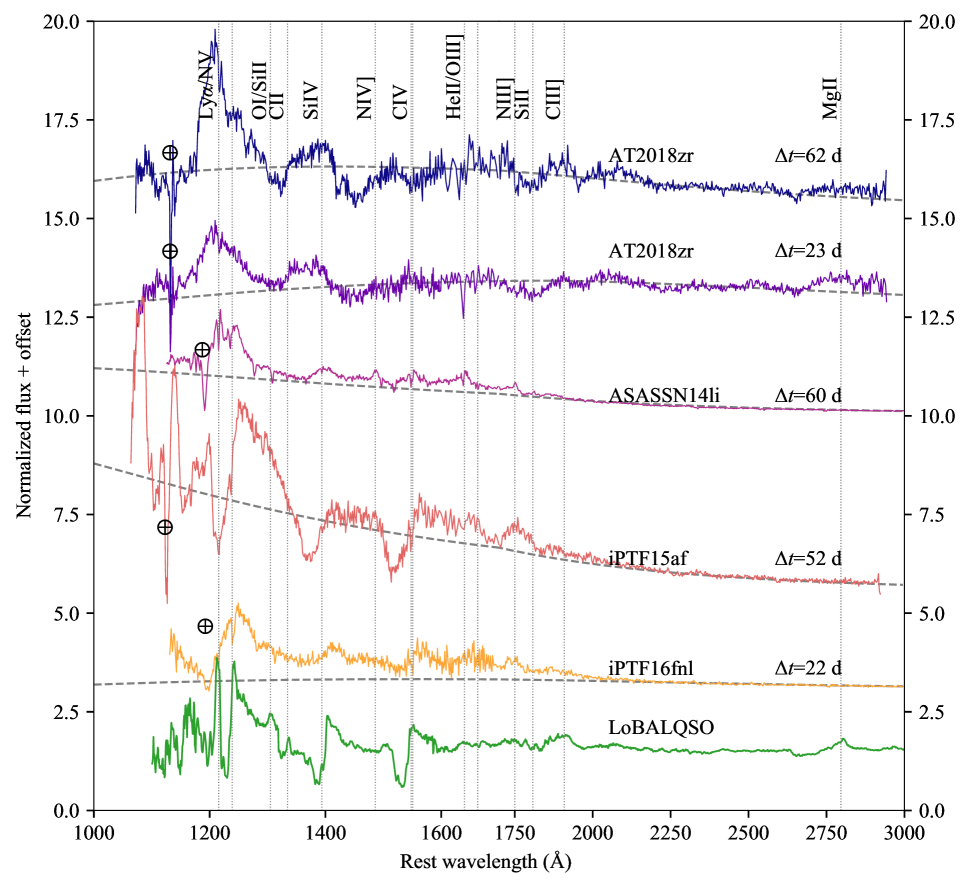
Because the high-velocity absorption features were weak or completely absent in the first two HST epochs, we are able to identify that the emission peaks of Ly and Si iv are blueshifted with respect to the TDE rest frame. AT2018zr is the only object that exhibit blueshifted UV emission (Ly, Si iv ) among the TDEs. In ASASSN-14li, the emission lines are near the systemic host velocity (Cenko et al., 2016) while in iPTF15af and iPTF16fnl the emission lines are systematically redshifted (Blagorodnova et al., 2018a; Brown et al., 2018). The velocity of the emission lines may arise from a combination of effects, including the geometry, kinematics, and optical depth. In iPTF15af, the redshifted broad emission lines are most likely caused by the absorption of the blue wing at km s-1. Brown et al. (2018) obtained 3 epochs of HST spectra of iPTF16fnl, spanning a time coverage of a month. While analyzing the evolution of iPTF16fnl, they found different evolution of the central wavelength for high- and low-ionization lines. Specifically, they found the high-ionization emission lines were initially redshifted by km s-1 but then evolved to peak near the wavelengths of the corresponding transitions at later times while the low-ionization lines showed no apparent shift at any given time. Since the UV spectrum of iPTF16fnl exhibits blueshifted absorption troughs for Si iv and C iv (FWHM6000km s-1), they suggest that the redshifted emission peaks may be due to the blue wings of the emission lines being significantly absorbed, as a result of an outflow, at earlier times. This would be consistent with our finding that the BAL system is fast-evolving, on a timescale of days to weeks.
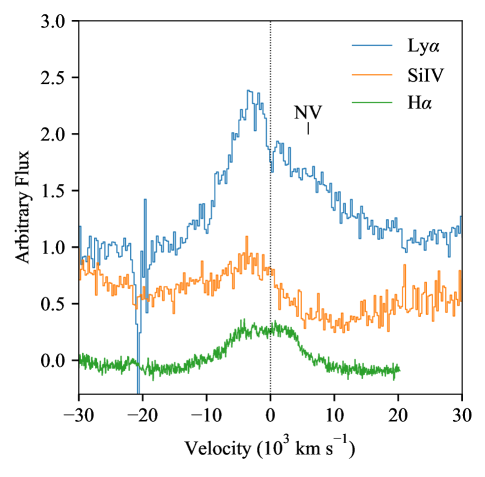
It is commonly observed in QSOs that the high-ionization lines (e.g. C iv ) are systematically blueshifted with respect to the low-ionization lines (e.g. Gaskell, 1982; Richards et al., 2002). This blueshift is often attributed to the presence of a radiatively driven wind (Murray et al., 1995), which may also be responsible for blueshifting ( km s-1) the Si iv and even the Ly emission in AT2018zr. In fact, the velocity profile of the strong, blueshifted Ly emission is more similar to the Si iv emission than to the H emission (Figure 9). In the class of AGNs with double-peaked broad Balmer emission lines, it has been observed that the Ly emission tends to be single-peaked and narrower in width (Eracleous & Halpern, 2003). This difference has been attributed to Ly being emitted from a higher-ionization gas originating in a wind, compared to higher-density gas in the accretion disk producing the low-ionization lines (Eracleous & Halpern, 2003). Based on the similar velocity, the observed Ly emission may naturally form in the same outflowing gas with intermidiate velocity ( km s-1) as the Si iv emission. We measured a Ly luminosity of erg s-1 from the first HST epoch, which is at least two orders of magnitude stronger than the H emission observed on the same night and 10 times larger than the expected value from case B recombination ( 8.7).
5.2 Broad Balmer Emission Lines
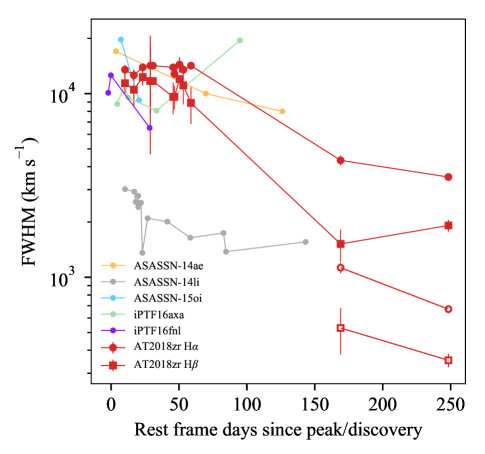
In Figure 10, we show the evolution of the full width at half-maximum (FWHM) of H and H measured with the best-fit double-Gaussian model. The H linewidth of AT2018zr is comparable to ASASSN-14ae at earlier times but is broader than that of the other TDEs by a factor of 30%. The FWHMs of the broad H and H components show little evolution before the 3-month-long observational gap but decreased by a factor of 3 at late time. This long term trend of line narrowing is also seen in other TDEs (Figure 10), such as in ASASSN-14ae and ASASSN-14li (Holoien et al., 2014, 2016b), though the blackbody luminosity in AT2018zr did not decrease monotonically like in the other TDEs van Velzen et al. (2019). As derived by van Velzen et al. (2019), the blackbody luminosity of AT2018zr decreased with time until 70 days post peak and remained nearly constant up to 250 d. Nevertheless, neither the line width evolution in AT2018zr nor that in other TDEs conform with the results of AGN reverberation mapping, where the H line width increases as the luminosity decreases due to less recombination at outer radii (Holoien et al., 2016b), hence the absence of the low velocity dispersion components.
The earlier () broad H FWHM corresponds to a virial radius of cm, assuming a black hole mass of (van Velzen et al., 2019). During this period, the broad H/H line ratio follows the case B value closely, with a mean of 3.1 and a standard deviation of 0.8. At late time, the average H/H line ratio is 7.10.9. The measured narrow He ii/H ratio from the last spectrum ( d) is 0.4, which is consistent with the case B prediction assuming solar abundance (Hung et al., 2017).
The flat-topped line profile in AT2018zr is unique among the optical TDEs discovered so far. In AGNs, the flat-topped line shape is often attributed to the orbital motion of a Keplerian disk. Double-peaked emission lines have been observed in many AGNs, which are believed to originate from the outer part of an accretion disk at (e.g. Chen et al., 1989; Eracleous & Halpern, 1994; Strateva et al., 2003) illuminated by a central ionizing source. In addition to Doppler broadening, relativistic effects are incorporated to model the asymmetries seen in the double-peaked emission lines. For example, a circular relativistic disk model (Chen et al., 1989) is often employed to explain AGN spectra where the emission lines have a double-peaked shape with a stronger blue peak. The opposite case in which the red peak is stronger could be achieved with a elliptical disk (Eracleous et al., 1995). Such model has been employed in fitting TDE lines in several cases, for example, PTF09djl (Liu et al., 2017) and ASASSN-14li (Cao et al., 2018).
Motivated by the theoretical line profiles of an elliptical disk, Holoien et al. (2018) have modeled the H line of AT2018zr (PS18kh) at different epochs with the combining effects of an elliptical disk, spiral arm, and wind. Their model provides a reasonable fit to the observed H emission line shape. However, we find very little evidence for the double-peaked H line profile as claimed by Holoien et al. (2018) in our host-subtracted spectra. We suspect the dip around line center in their data is most likely due to the host starlight, which may not have been cleanly removed. As shown by their fit, the observed line center flux always drops more steeply than what the elliptical disk model can reproduce. Furthermore, for a pure Keplerian disk, a flat-top line is only expected under very specific conditions, i.e. when the disk rotation axis is 15 (Landt et al., 2014).
In addition, the X-ray observations favor the presence of an accretion disk (van Velzen et al., 2019), which is not expected in the elliptical disk model. In the case where the debris streams do not circularize efficiently, the streams may retain high eccentricities without forming a standard accretion disk (Svirski et al., 2017). In this model, streams may plunge directly into the black hole when some of the angular momentum is removed, without losing any energy. Lastly, the outer radius of the elliptical disk derived by Holoien et al. (2018) is on the order of , which is almost two orders of magnitude greater than the self-intersection radius of a non-spinning black hole with (e.g. Wevers et al., 2017).
Overall, we do not find it necessary to invoke the elliptical disk model to interprete the spectral line shape. Our spherical outflow model provides a natural explanation for the flat-topped line shape. Interestingly, the maximum outflow velocity km s-1 employed by our model is consistent with the velocity of the BAL system. This coincidence may be explained if the absorption lines are produced by this spherically expanding material at its outer edge when it scatters photons outside our line of sight.
5.3 High Velocity Transient BAL System
Observations of AT2018zr indicate the presence of the first transient LoBAL system in a TDE, in which both high- and low-ionization absorption lines are present. In addition, this transient LoBAL system contains intrinsic hydrogen Balmer and He i∗ absorption features. It turns out that such systems are very rare even in QSOs. Blueshifted, broad high-ionization absorption lines are seen in about 10–20% of the optically-selected QSOs (Hewett & Foltz, 2003; Reichard et al., 2003; Trump et al., 2006; Ganguly et al., 2007) and are often attributed to accretion disk outflows. However, only about 15% of the BALQSOs also show low ionization broad absorption lines (LoBALs) such as Mg ii . A small fraction (15%) of the LoBAL QSOs that show Fe II or Fe III absorptions, such as that in Mrk 231, are dubbed as FeLoBALs (e.g. Veilleux et al., 2016). Since AT2018zr lacks common FeII absorptions in the NUV, it does not fit in the FeLoBAL category. Currently, there are only a handful of BALQSOs that exhibit hydrogen Balmer absorption lines (e.g. Aoki, 2010; Ji et al., 2012; Zhang et al., 2015; Shi et al., 2016; Sun et al., 2017; Schulze et al., 2018)
Although Balmer absorption lines are often seen in galaxy spectra, it is unlikely that the ones we see in AT2018zr are due to intervening galaxies or clouds because of the following reasons. First, high-ionization absorption troughs are detected at the same velocities as the H Balmer absorption lines, suggesting a dynamical association between them. Second, multi-epoch optical spectra captured the appearance and disappearance of the H Balmer absorptions on a timescale of days, which is unexpectedly short if the absorption were due to intervening gas. Third, the He i line must arise from the metastable 2 level, which is mainly populated by recombination of singly ionized helium ions that requires a significant amount of photons with eV (Rudy et al., 1985). He i is not commonly seen in the ISM since the diffuse stellar background offers too few photons that can ionize helium and too many with eV that can ionize the electron in its metastable state. Lastly, since the TDE is relatively nearby, we should be able to resolve the intervening galaxies with imaging yet we do not find any.
5.3.1 Outflows
Following a star’s disruption, the mass initially falls back at a super-Eddington rate and gradually decreases below the Eddington rate. Super-Eddington accretion is capable of driving of powerful outflows with radiation pressure (e.g. King & Pounds, 2003; Ohsuga et al., 2005). Strubbe & Quataert (2011) made the first predictions of the spectroscopic signatures of super-Eddington outflows in a TDE environment. Their predicted spectrum is characterized by broad, blueshifted ( to 0.1.) absorption features in the super-Eddington phase. Most of these absorption features are high-ionization lines ( eV) because of the assumption of a hot continuum with a temperature K. Since the velocity and density of the outflow is viewing angle-dependent, their model is also able to produce spectra with more NUV and optical absorption lines, such as Mg ii and the hydrogen Balmer lines, as a result of softer continuum. In general, their model predicts a spectrum similar to that of a BALQSO hence is similar to our observations of AT2018zr. However, they predict a rapid photospheric temperature evolution and a steep (Strubbe & Quataert, 2009; Lodato & Rossi, 2011) decline in optical flux which is not seen in the data.
More recent work has refined the theoretical understanding of how TDEs might be associated with wide-angle outflows. Miller (2015) suggested that winds launched by radiation pressure on absorption lines may remove material as it is drawn in through an extended disk, which would lead to a range of outflow velocities. Metzger & Stone (2016) studied mass-loaded winds launched from both accretion luminosity and energy released during debris circularization. They found minimum outflow velocities of km/s, similar to the velocities measured here. They also point out that a shell of promptly launched material will surround the wind consisting of material that has fallen back more recently. Colder material at the edge of this shell might provide the origin of the blueshifted absorption troughs seen in the optical specra of this event.
Another approach has been to perform hydrodynamic simulations of super-Eddington accretion flows, accounting for the effects of radiation pressure, magnetic fields, and general relativity, and apply these findings to TDEs (Sa̧dowski et al., 2014; Jiang et al., 2017; Dai et al., 2018; Curd & Narayan, 2019). In particular, Dai et al. (2018) emphasized the viewing-angle dependence of the outflow and its resulting emission. While material ejected in the polar direction had relativistic velocity and was transparent to X-rays, material launched closer to mid-plane had slower velocity due to mass-loading, and X-ray emission was highly suppressed along those lines of sight. The results for such a viewing geometry are consistent with many aspects of this event, although the time-dependent behavior of this model requires further study.
The simplest super-Eddington outflow models assume that the wind velocity is a near-unity fraction of the escape velocity of the gas from the position where it is launched (Strubbe & Quataert, 2009; Lodato & Rossi, 2011). This would require the outflowing gas to be launched from a radius of cm to match the observed velocity of 0.05 for the absorption features, though the black hole mass estimation may be somewhat uncertain. However, this radius derived from the velocity of the absorption features appears to be in tension with the blackbody radius derived from the UV and optical photometry. The blackbody radius is found to be steadily decreasing from cm near peak to cm at d (van Velzen et al., 2019). In this picture, the outflow would be launched at a radius slightly larger than that traced by the blackbody radius in AT2018zr when we first observed the H absorption on day 30. Meanwhile, our modeling of the emission lines requires the continuum photosphere to be located within the edge of the outflow. Accounting for deviations from a pure blackbody emitter as appropriate for a scattering-dominated atmosphere would only move the thermalization radius of the continuum to smaller radii (e.g. Roth et al., 2016), exacerbating the problem. A natural solution is for mass-loading to reduce the final velocity of the outflow (Metzger & Stone, 2016), allowing it to be originally launched from smaller radii while matching the velocity seen in the absorption features.
PS1-11af is the only other TDE in a quiescent galaxy that exhibits transient broad absorption features (in that case Mg ii ) with a comparable blueshift (13,000 km s-1) to AT2018zr (Chornock et al., 2014). The velocity of the absorbing material in PS1-11af is consistent with an outflow launched near the blackbody radius (Chornock et al., 2014). On the other hand, the line width of Mg ii (FWHM 10,200 km s-1) in PS1-11af is much broader than the absorption lines in AT2018zr (FWHMs 3,000 km s-1 for low-ionization lines and 10,000 km s-1 for high-ionization lines). The broad absorption lines are expected in the super-Eddington phase due to the wide range of gas velocities present in the outflow. This gives rise to a linewidth that is similar to the wind velocity (Strubbe & Quataert, 2011). The fact that the absorption lines in AT2018zr are narrower and detached from their emission peaks may be a viewing angle effect. For example, a few BALQSOs have been reported with detached absorption troughs (e.g. PG 1254+046; Hamann, 1998). This may happen when our line of sight does not align with the wind such that the materials have already been substantially accelerated when it intersects our line of sight.
Although many TDE spectroscopic features resemble that of BALQSOs, at least a fraction of the BALQSOs have low Eddington ratio (; Grupe & Nousek, 2015), which must have a different mechanism to drive strong outflows. Indeed, BALQSO wind is thought to be driven by line opacity in a partially ionized gas. In the line-driven wind framework proposed by Murray et al. (1995), dense gas that shields the soft X-ray near the hot QSO ionizing source is required to avoid overionization and drive the BAL outflows. Interestingly, the analysis of X-ray observations of AT2018zr also suggests some X-ray obscuring material residing outside the TDE photosphere (van Velzen et al., 2019). It is therefore also possible that the LoBAL in AT2018zr is powered by line opacity, though most BALQSOs are associated with black holes that are too massive ( ) to tidally disrupt solar-type stars (Strubbe & Quataert, 2011).
Despite the TDE sample with UV spectroscopic observations being still small, the fraction of TDEs that exhibit BAL features in the UV (3 out of 4; §5.1) seems to be higher than the fraction ( 20%) of BALQSOs, which is often attributed to the orientation effect in disk winds. This may suggest that the TDE outflows have different geometries than QSO outflows and are less sensitive to viewing angle. Future HST observations of TDEs are desirable for verifying the large fraction of BALs in TDEs.
5.3.2 Unbound Debris
Although the blueshifted absorption features are known to form in disk winds, we also consider the unbound stellar debris as a possible absorber. In a tidal disruption, about half of the disrupted star gains enough energy to escape the black hole on a hyperbolic trajectory, reaching a terminal velocity of 11,000 km s-1 (Krolik et al., 2016). Simulations by Strubbe & Quataert (2009) showed that the unbound debris irradiated by the accretion disk will produce emission lines at the optical-IR wavelengths. It is therefore possible that the rapid evolution in density () and column density () of the unbound debris, where and , is causing the variability of the Balmer absorption seen on the timescale of a few days.
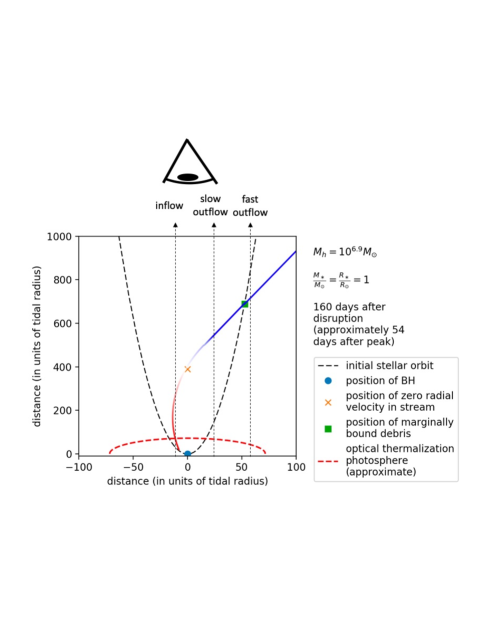
However, the orientation required for an observer to see the high-velocity unbound debris stream, as depicted in Figure 11, will also cover the slower portions of the stream, as well as the infalling bound stellar debris. The emergent spectra should therefore have braoder linewidths and even inflow signatures. However, these are clearly inconsistent with our obervations, where the photosphere is eclipsed by material at radial velocity of 15,500 km s-1 with a small dispersion of only 3,000 km s-1.
5.3.3 Physical Conditions
Through out the monitoring period, no significant acceleration or deacceleration in the absorbing material is detected given the fact that the absorption features did not show any significant velocity offset between different epochs. Assuming the absorbing material has been traveling at constant velocity ( km s-1) since peak light (), it would have reached a distance of cm by the time we first observed the H absorption on day. This distance is just outside of the continuum photosphere estimated from the blackbody fit (van Velzen et al., 2019).
Observations have revealed a handful of QSOs with hydrogen Balmer and/or metastable helium lines in their BAL systems. Comparisons of these observations with photoionization models have constrained the ionization parameters and densities of the outflows with the photoionization code CLOUDY, which in turn can constrain the kinetic luminosities of the outflows. Below we summarize the physical conditions that give rise to the hydrogen Balmer and helium lines based on these works, though we remind the readers to take these values with a grain of salt as the ionizing continuum is likely to be different for TDEs and AGNs.
Strong helium transitions from the metastable 2s level occur at 3889 and 10830, which correspond to transition from the metastable state to 3 and 2 states, respectively. Although once considered a rare phenomenon, Liu et al. (2015) have found a high association rate between He i and the Mg ii doublet among BALQSOs with high S/N spectra (93% at S/N 35). Leighly et al. (2011) have demonstrated that the He i and He i lines can serve as a powerful diagnostic of high column density outflow. This is due to the large ratio of 23.3, which makes the HeI∗ lines sensitive to a wide range of high column densities () before saturating. Unfortunately, we are unable to carry out similar analysis due to the He i line falling outside our spectroscopic coverage. The presence of He i provides additional constraints on the ionized gas. Unlike He i , He i arises from an energy state that is not metastable, which is readily depopulated by permitted radiative decays via the 10830 transition when the gas density is low. Photoionization calculations have shown that a gas density of and an ionised column density of are required to produce (5876) 0.1 (Hamann et al., 2019).
The blueshift velocity of AT2018zr is the highest amongst QSOs with Balmer BALs (Zhang et al., 2015). Behind the hydrogen recombination front, the partially ionized regions that give rise to the H Balmer absorption lines usually have high densities (typically cm-3; Zhang et al., 2015, and references therein). Our analysis of the H Balmer absorption lines have shown that even the high-order hydrogen Balmer transitions are saturated. Photoionization modelling with CLOUDY suggests that a density of and a column density of are required to produce a (H) 1.3 regardless of the ionization parameter (Hamann et al., 2019).
With the above estimation of density and column density, a cloud size of can be inferred from (assuming and . Assuming a spherical cloud, we estimate a total mass of and a kinetic energy of ergs. The mass and kinetic energy of the outflow in AT2018zr are about an order of magnitude greater than that in ASASSN-14li, which is known to host an outflow with comparable velocity (km s-1) as derived from radio observations (Alexander et al., 2016). Note that radio emission, which is expected as the outflow shocks against the circumnuclear matter (CNM), is not detected in AT2018zr at a upper limit of 1037 erg s-1 at 10 GHz (van Velzen et al., 2019). While the HST data show unambiguous evidence for the presence of an outflow, the non-detection at radio frequency may be due to the radio signal being buried by the dense CNM.
Detailed, accurate characterization of the broad emission and absorption lines in the UV is necessary for robust estimatation of the transient absorber properties (e.g. column density). In particular, the column density and density are critical parameters to measure the kinetic luminosity, which can be used to examine different TDE outflow models and assess its importance in the context feedback in galaxy evolution.
6 Conclusion
We report the results of our analysis of multi-epoch UV and optical spectra of the TDE AT2018zr observed between 2018 March and 2018 December. The wide wavelength coverage of the HST STIS UV spectra ( 1150–3000 Å) together with the Keck LRIS spectra ( 3500–9000 Å) allows us to identify highly blueshifted (15,500 km s-1, or 0.05) broad absorption lines in the UV and optical, including the high- and low-ionization transitions seen in LoBALQSOs.
In this BAL system, we identified the first hydrogen Balmer and metastable HeI transitions, which are known to be rare in QSOs, in a TDE. We conclude that this BAL system is more likely the result of a high velocity outflow launched by TDE accretion flows, instead of the unbound debris. Given the presence of broad UV absorption lines are more common in TDEs (3 out of 4) than in QSOs, this may suggest that the outflow launching mechanisms in TDEs are less subjective to orientation effects than that in QSOs.
Our curve of growth analysis shows that even the high-order hydrogen Balmer absorption lines are saturated and the absorbing material only covers the background source partially. By comparing with photoionization models for AGNs, we conclude that the ionized gas must be characterized by high density and high column based on the detection of He i and He i . In order to give rise to the H Balmer absorption, the partially ionized gas behind the hydrogen recombination front must also have high column densities. More UV and optical spectroscopic observations of TDEs will allow detailed photoionization modeling to assess whether TDE outflows provide significant “feedback” in the context of galaxy evolution.
Using radiative transfer model, we show that the emission profile seen in expanding TDE outflows (Roth & Kasen, 2018) is similar to the flat-topped H line shape in our observations. We find that the spherical outflow model alone, with a maximum velocity of km s-1 close to the velocity of the aforementioned BAL, provides a satisfactory fit to the observed line profile. While the elliptical disk model have been invoked to interprete emission lines in several TDEs, it requires stringent conditions in order to produce the line shape in AT2018zr. Furthermore, the implied disk size from the elliptical disk model is two orders of magnitude larger than the stream self-intersection radius, which is difficult to explain from the perspective of debris stream dynamics.
We report the appearance of narrow He ii , H, and H emission lines in the late-time optical spectra of AT2018zr. The line widths of these transitions imply a virial radius on the order of cm. We suggest that the presence of He ii and N iii 4640 emission in later observations may be driven by the temperature increase in the late-time UV and optical continuum.
TDE spectra are thought to be rather featureless hence the spectroscopic analysis has been focused on the emission lines in the past. We emphasize that subtle features, such as the highly blueshifted H Balmer absorption lines in AT2018zr, may also be present in TDE spectra as a result of outflows. High S/N spectra with broad wavelength coverage is critical for identifying these absorption features in the UV and optical. We also recommend monitoring future TDEs with spectroscopy on a weekly basis, since, as we have shown with AT2018zr, the spectroscopic features—both emission and absorption—are variable on such timescale.
7 Acknowledgements
T.H. thanks Fred Hamann for sharing a copy of his draft prior to publication and Jane Dai for helpful discussions. The UCSC team is supported in part by NSF grant AST-1518052, the Gordon & Betty Moore Foundation, the Heising-Simons Foundation, and from a fellowship from the David and Lucile Packard Foundation to R.J.F. S.V. acknowledges support from a Raymond and Beverley Sackler Distinguished Visitor Fellowship and thanks the host institute, the Institute of Astronomy, where this work was concluded. S.G is supported in part by NSF grant 1454816. S.V. also acknowledges support by the Science and Technology Facilities Council (STFC) and by the Kavli Institute for Cosmology, Cambridge. N. B. acknowledges that this work is part of the research programme VENI, with project number 016.192.277, which is (partly) financed by the Netherlands Organisation for Scientific Research (NWO). M. R. S. is supported by the National Science Foundation Graduate Research Fellowship Program under Grant No. 1842400. A.G.-Y. is supported by the EU via ERC grant No. 725161, the ISF, the BSF Transformative program and by a Kimmel award. The research of Y.Y. is supported through a Benoziyo Prize Postdoctoral Fellowship. Y.Y. thanks support astronomers at La Palma for assisting the WHT observation in service mode.
Based on observations made with the NASA/ESA Hubble Space Telescope, obtained from the Data Archive at the Space Telescope Science Institute, which is operated by the Association of Universities for Research in Astronomy, Inc., under NASA contract NAS 5-26555. The results made use of the Discovery Channel Telescope at Lowell Observatory. Lowell is a private, non- profit institution dedicated to astrophysical research and public appreciation of astronomy and operates the DCT in partnership with Boston University, the University of Maryland, the University of Toledo, Northern Arizona University, and Yale University. Some of the data presented herein were obtained at the W. M. Keck Observatory, which is operated as a scientific partnership among the California Institute of Technology, the University of California and the National Aeronautics and Space Administration. The Observatory was made possible by the generous financial support of the W. M. Keck Foundation. The authors wish to recognize and acknowledge the very significant cultural role and reverence that the summit of Maunakea has always had within the indigenous Hawaiian community. We are most fortunate to have the opportunity to conduct observations from this mountain. The William Herschel Telescope is operated on the island of La Palma by the Isaac Newton Group of Telescopes in the Spanish Observatorio del Roque de los Muchachos of the Instituto de Astrofísica de Canarias. The ACAM spectroscopy was obtained as part of OPT/2018A/017. The results in this work are based on observations obtained with the Samuel Oschin Telescope 48-inch and the 60-inch Telescope at the Palomar Observatory as part of the Zwicky Transient Facility project. ZTF is supported by the National Science Foundation under Grant No. AST-1440341 and a collaboration including Caltech, IPAC, the Weizmann Institute for Science, the Oskar Klein Center at Stockholm University, the University of Maryland, the University of Washington, Deutsches Elektronen-Synchrotron and Humboldt University, Los Alamos National Laboratories, the TANGO Consortium of Taiwan, the University of Wisconsin at Milwaukee, and Lawrence Berkeley National Laboratories. Operations are conducted by COO, IPAC, and UW. SED Machine is based upon work supported by the National Science Foundation under Grant No. 1106171.
References
- Alexander et al. (2016) Alexander, K. D., Berger, E., Guillochon, J., Zauderer, B. A., & Williams, P. K. G. 2016, ApJ, 819, L25
- Aoki (2010) Aoki, K. 2010, PASJ, 62, 1333
- Bellm et al. (2019) Bellm, E. C., Kulkarni, S. R., Graham, M. J., et al. 2019, PASP, 131, 018002
- Blagorodnova et al. (2018a) Blagorodnova, N., Kulkarni, S. B. C. S. R., Arcavi, I., et al. 2018a, ArXiv e-prints, arXiv:1809.07446
- Blagorodnova et al. (2018b) Blagorodnova, N., Neill, J. D., Walters, R., et al. 2018b, PASP, 130, 035003
- Brotherton et al. (2001) Brotherton, M. S., Tran, H. D., Becker, R. H., et al. 2001, ApJ, 546, 775
- Brown et al. (2018) Brown, J. S., Kochanek, C. S., Holoien, T. W.-S., et al. 2018, MNRAS, 473, 1130
- Cao et al. (2018) Cao, R., Liu, F. K., Zhou, Z. Q., Komossa, S., & Ho, L. C. 2018, MNRAS, 480, 2929
- Cardelli et al. (1989) Cardelli, J. A., Clayton, G. C., & Mathis, J. S. 1989, ApJ, 345, 245
- Cenko et al. (2016) Cenko, S. B., Cucchiara, A., Roth, N., et al. 2016, ApJ, 818, L32
- Chen et al. (1989) Chen, K., Halpern, J. P., & Filippenko, A. V. 1989, ApJ, 339, 742
- Chornock et al. (2014) Chornock, R., Berger, E., Gezari, S., et al. 2014, ApJ, 780, 44
- Coughlin et al. (2016) Coughlin, E. R., Nixon, C., Begelman, M. C., & Armitage, P. J. 2016, MNRAS, 459, 3089
- Curd & Narayan (2019) Curd, B., & Narayan, R. 2019, MNRAS, 483, 565
- Dai et al. (2018) Dai, L., McKinney, J. C., Roth, N., Ramirez-Ruiz, E., & Miller, M. C. 2018, ApJ, 859, L20
- Eracleous & Halpern (1994) Eracleous, M., & Halpern, J. P. 1994, ApJS, 90, 1
- Eracleous & Halpern (2003) —. 2003, ApJ, 599, 886
- Eracleous et al. (1995) Eracleous, M., Livio, M., Halpern, J. P., & Storchi-Bergmann, T. 1995, ApJ, 438, 610
- Evans & Kochanek (1989) Evans, C. R., & Kochanek, C. S. 1989, ApJ, 346, L13
- Gallegos-Garcia et al. (2018) Gallegos-Garcia, M., Law-Smith, J., & Ramirez-Ruiz, E. 2018, ApJ, 857, 109
- Ganguly et al. (2007) Ganguly, R., Brotherton, M. S., Cales, S., et al. 2007, ApJ, 665, 990
- Gaskell (1982) Gaskell, C. M. 1982, ApJ, 263, 79
- Gehrels et al. (2004) Gehrels, N., Chincarini, G., Giommi, P., et al. 2004, ApJ, 611, 1005
- Gezari et al. (2012) Gezari, S., Chornock, R., Rest, A., et al. 2012, Nature, 485, 217
- Graham et al. (2019) Graham, M. J., Kulkarni, S. R., Bellm, E. C., et al. 2019, arXiv e-prints, arXiv:1902.01945
- Grupe & Nousek (2015) Grupe, D., & Nousek, J. A. 2015, AJ, 149, 85
- Hamann (1998) Hamann, F. 1998, ApJ, 500, 798
- Hamann et al. (2019) Hamann, F., Tripp, T. M., Rupke, D. S. N., & Veilleux, S. 2019, submitted to ApJ
- Hewett & Foltz (2003) Hewett, P. C., & Foltz, C. B. 2003, AJ, 125, 1784
- Holoien et al. (2014) Holoien, T. W.-S., Prieto, J. L., Bersier, D., et al. 2014, MNRAS, 445, 3263
- Holoien et al. (2016a) Holoien, T. W.-S., Kochanek, C. S., Prieto, J. L., et al. 2016a, MNRAS, 463, 3813
- Holoien et al. (2016b) —. 2016b, MNRAS, 455, 2918
- Holoien et al. (2018) Holoien, T. W.-S., Huber, M. E., Shappee, B. J., et al. 2018, ArXiv e-prints, arXiv:1808.02890
- Hung et al. (2017) Hung, T., Gezari, S., Blagorodnova, N., et al. 2017, ApJ, 842, 29
- Hung et al. (2018) Hung, T., Gezari, S., Cenko, S. B., et al. 2018, ApJS, 238, 15
- Jeffery & Branch (1990) Jeffery, D. J., & Branch, D. 1990, Jerusalem Winter School for Theoretical Physics
- Ji et al. (2012) Ji, T., Wang, T.-G., Zhou, H.-Y., & Wang, H.-Y. 2012, Research in Astronomy and Astrophysics, 12, 369
- Jiang et al. (2017) Jiang, Y.-F., Stone, J., & Davis, S. W. 2017, ArXiv e-prints, arXiv:1709.02845
- Kara et al. (2018) Kara, E., Dai, L., Reynolds, C. S., & Kallman, T. 2018, MNRAS, 474, 3593
- King & Pounds (2003) King, A. R., & Pounds, K. A. 2003, MNRAS, 345, 657
- Kochanek (2016) Kochanek, C. S. 2016, MNRAS, 458, 127
- Krolik et al. (2016) Krolik, J., Piran, T., Svirski, G., & Cheng, R. M. 2016, ApJ, 827, 127
- Landt et al. (2014) Landt, H., Ward, M. J., Elvis, M., & Karovska, M. 2014, MNRAS, 439, 1051
- Leighly et al. (2011) Leighly, K. M., Dietrich, M., & Barber, S. 2011, ApJ, 728, 94
- Liu et al. (2017) Liu, F. K., Zhou, Z. Q., Cao, R., Ho, L. C., & Komossa, S. 2017, MNRAS, 472, L99
- Liu et al. (2015) Liu, W.-J., Zhou, H., Ji, T., et al. 2015, The Astrophysical Journal Supplement Series, 217, 11
- Lodato & Rossi (2011) Lodato, G., & Rossi, E. M. 2011, MNRAS, 410, 359
- Metzger & Stone (2016) Metzger, B. D., & Stone, N. C. 2016, MNRAS, 461, 948
- Miller et al. (2015) Miller, J. M., Kaastra, J. S., Miller, M. C., et al. 2015, Nature, 526, 542
- Miller (2015) Miller, M. C. 2015, ApJ, 805, 83
- Murray et al. (1995) Murray, N., Chiang, J., Grossman, S. A., & Voit, G. M. 1995, ApJ, 451, 498
- Ohsuga et al. (2005) Ohsuga, K., Mori, M., Nakamoto, T., & Mineshige, S. 2005, ApJ, 628, 368
- Oke et al. (1995) Oke, J. B., Cohen, J. G., Carr, M., et al. 1995, PASP, 107, 375
- Pasham & van Velzen (2018) Pasham, D. R., & van Velzen, S. 2018, ApJ, 856, 1
- Phinney (1989) Phinney, E. S. 1989, in IAU Symposium, Vol. 136, The Center of the Galaxy, ed. M. Morris, 543
- Rees (1988) Rees, M. J. 1988, Nature, 333, 523
- Reichard et al. (2003) Reichard, T. A., Richards, G. T., Schneider, D. P., et al. 2003, AJ, 125, 1711
- Richards et al. (2002) Richards, G. T., Vanden Berk, D. E., Reichard, T. A., et al. 2002, AJ, 124, 1
- Roth & Kasen (2018) Roth, N., & Kasen, D. 2018, ApJ, 855, 54
- Roth et al. (2016) Roth, N., Kasen, D., Guillochon, J., & Ramirez-Ruiz, E. 2016, ApJ, 827, 3
- Rudy et al. (1985) Rudy, R. J., Foltz, C. B., & Stocke, J. T. 1985, ApJ, 288, 531
- Sa̧dowski et al. (2014) Sa̧dowski, A., Narayan, R., McKinney, J. C., & Tchekhovskoy, A. 2014, MNRAS, 439, 503
- Schlafly & Finkbeiner (2011) Schlafly, E. F., & Finkbeiner, D. P. 2011, ApJ, 737, 103
- Schulze et al. (2018) Schulze, A., Misawa, T., Zuo, W., & Wu, X.-B. 2018, ApJ, 853, 167
- Shi et al. (2016) Shi, X., Zhou, H., Shu, X., et al. 2016, ApJ, 819, 99
- Strateva et al. (2003) Strateva, I. V., Strauss, M. A., Hao, L., et al. 2003, AJ, 126, 1720
- Strubbe & Quataert (2009) Strubbe, L. E., & Quataert, E. 2009, MNRAS, 400, 2070
- Strubbe & Quataert (2011) —. 2011, MNRAS, 415, 168
- Sun et al. (2017) Sun, L., Zhou, H., Ji, T., et al. 2017, ApJ, 838, 88
- Svirski et al. (2017) Svirski, G., Piran, T., & Krolik, J. 2017, MNRAS, doi:10.1093/mnras/stx117
- Trump et al. (2006) Trump, J. R., Hall, P. B., Reichard, T. A., et al. 2006, ApJS, 165, 1
- Tucker et al. (2018) Tucker, M. A., Huber, M., Shappee, B. J., et al. 2018, The Astronomer’s Telegram, 11473
- Ulmer (1999) Ulmer, A. 1999, ApJ, 514, 180
- van Velzen et al. (2016) van Velzen, S., Anderson, G. E., Stone, N. C., et al. 2016, Science, 351, 62
- van Velzen et al. (2019) van Velzen, S., Gezari, S., Cenko, S. B., et al. 2019, ApJ, 872, 198
- Veilleux et al. (2016) Veilleux, S., Meléndez, M., Tripp, T. M., Hamann, F., & Rupke, D. S. N. 2016, ApJ, 825, 42
- Wevers et al. (2017) Wevers, T., van Velzen, S., Jonker, P. G., et al. 2017, MNRAS, 471, 1694
- Wu et al. (2018) Wu, S., Coughlin, E. R., & Nixon, C. 2018, MNRAS, 478, 3016
- Yang et al. (2017) Yang, C., Wang, T., Ferland, G. J., et al. 2017, ApJ, 846, 150
- Zhang et al. (2015) Zhang, S., Zhou, H., Shi, X., et al. 2015, ApJ, 815, 113