Photocatalytic activity of exfoliated graphite-TiO2 nanocomposites
Abstract
We investigate the photocatalytic performance of nanocomposites prepared in a one-step process by liquid-phase exfoliation of graphite in the presence of TiO2 nanoparticles (NPs) at atmospheric pressure and in water, without heating or adding any surfactant, and starting from low-cost commercial reagents. The nanocomposites show enhanced photocatalytic activity, degrading up to 40 more pollutants with respect to the starting TiO2-NPs. In order to understand the photo-physical mechanisms underlying this enhancement, we investigate the photo-generation of reactive species (trapped holes and electrons) by ultrafast transient absorption spectroscopy. We observe an electron transfer process from TiO2 to the graphite flakes within the first picoseconds of the relaxation dynamics, which causes the decrease of the charge recombination rate, and increases the efficiency of the reactive species photo-production.
I Introduction
Air and water pollution are major environmental risks to human healthwho . According to the World Health Organization (WHO)who , in the last decade one out of every nine deaths was related to air pollutionpollution , while at least 1.8bn people used a contaminated drinking-water sourcepollution2 . For air pollution remediation, environmental contaminantsHoffmann1995 (e.g. NO, NO2, SO2, suspended organic particulate, volatile organic compounds, aromatic hydrocarbons, etc.) must be turned into harmless compounds. This can be achieved exploiting photocatalysts to absorb light and produce reactive holes (h) and electrons (e) that degrade the pollutants via redox processesHirakawa_1 . The photocatalytic quantum efficiency (PQE, adimensional) is defined as the ratio between the rate at which the target molecules undergo photo-degradation (moles of molecules per unit time) [mol s-1], and the rate of photon absorption (moles of absorbed photons per unit time) [mol s-1]Serpone_1 ; Serpone_2 . Since photocatalytic degradation relies on the Sun and on the photocatalyst, not consumed during the processHoffmann1995 ; ZhangQ2015 , this is a potentially low-cost and environment friendly approach for pollution abatementHoffmann1995 .
Amongst oxide semiconductor photocatalystsHoffmann1995 (such as ZnO, FeO3, WO3), titanium dioxide nanoparticles (TiO2-NPs) have a wide range of applications, including self-cleaningLai2016 , sterilization of surfacesNishimoto2013 , airMamaghani2017 and waterYu2016 purification. TiO2-NPs have the advantages of stability in waterHoffmann1995 , non-toxicityXia2006 and low cost (1900USD/Ton at 2016 pricesTiO2cost ). Due to its wide band gap (3.25 eVHoffmann1995 ), TiO2 absorbs only the UV part of the solar spectrumLinsebigler1995 . TiO2-NPs with diameter10nmSerpone_2 do not display quantum confinement effects, which would result in a blue shift of the absorption spectraSerpone_1 . Hence, TiO2-NPs exploit just the UV part (4Foyomoreno2003 ) of the solar radiation to perform photodegradationHoffmann1995 ; ChenX2007 ; Fujishima2008 ; Linsebigler1995 , wasting96 of the usable spectrum. Even considering only the UV component, TiO2-NPs have a modest PQE10Serpone_2 , limited by the recombination of the photo-generated e-h pairs that occurs with 90 quantum efficiencySerpone1997 . The PQE increases with the number of generated e-h pairs per absorbed photon, i.e. the photo-generation yieldSerpone1997 , and with the carriers’ lifetimeSerpone_2 . Integration with materials able to accept e or h may slow down charge recombination, leading to a PQE increase.
The integration of TiO2 with carbon materials, such as nanotubesDai2009 , dotsSun2014 , graphene oxide (GO)Reddy2015 and reduced graphene oxide (RGO)Han2012 , was pursued to enhance PQEReddy2015 ; Han2012 ; Leary2011 ; Tu2013 ; WangH2013 ; ZhangN2015 ; ZhangN2012 ; Chen2010 ; Du2011 ; Gao2012 ; Guo2011 ; Jiang2011 ; KimC2012 ; KimI2011 ; Li2011 ; Liang2010 ; Liang2011 ; Liang2012 ; Liu2011 ; LiuS2013 ; Pan2012 ; Pastrana-Martinez2012 ; Shah2012 ; Shen2011 ; Thuy-Duong2011 ; WangP2013 ; WangY2010 ; Williams2008 ; YangN2013 ; Zhang2010 ; ZhangJ2011 ; ZhangL2008 ; ZhangP2011 ; ZhangY2010 ; ZhangY2011 ; ZhangY2012 ; Zhao2012 ; Yang2010 ; Yeh2013 ; Morais2016 . The e-h pair generation and evolution in TiO2/carbon composites, such as TiO2/RGOWang_1 ; Manga_1 ; Morais2016 and TiO2/graphene quantum dots (GQD)Kenrick_1 , was investigated by transient absorption (TA) spectroscopyDeSilvestri2017 . In TiO2/GQDKenrick_1 , TiO2/RGOWang_1 and Ti0.91O2/RGOManga_1 , TiO2 acts as e acceptor when excited with visible light below the TiO2 optical gap. In TiO2/GQD, the e-injection occurs with a time constant15fsWang_1 . In Ti0.91O2/RGO with 0.1 wt RGO, RGO was found to act as e acceptor, decreasing the recombination rate in TiO2Morais2016 . Thus, when excited with UV photons above the TiO2 gap, RGO acts as e-acceptor causing the decrease of the charge carriers’ recombination rate, resulting in PQE enhancement. However, Ref.Morais2016, did not quantify the lifetime of the photo-generated carriers, because of the limited time resolution used (sSchneider2018 ). Ref.Long_1, theoretically investigated the charge transfer processes, predicting that charge and energy transfer in TiO2/single layer graphene (SLG) would proceed in both directions, depending on the energy of the excited charges. Here, we apply ultrafast transient absorption spectroscopy to investigate charge separation in exfoliated graphite/TiO2. Our results explain the mechanism responsible for the increased PQE in TiO2/carbon composites.
Our TiO2/exfoliated graphite (TiO2/Gr) photocatalyst is prepared by sonication-assisted exfoliation of graphite in presence of TiO2-NPs, using commercial starting materials suitable for large scale production. Liquid-phase exfoliation (LPE) of graphite typically exploits surfactantsHernandez2008 ; BonaMatToday , such as sodium deoxycholateLotya2010 and pluronicsNanoscale2015 . Here we use the TiO2-NPs themselves to exfoliate graphite in water and produce the photocatalytic composite. The exfoliation process is investigated varying both sonication time and concentration of TiO2-NPs and comparing the chemical composition and crystal structure by high-resolution powder X-Ray diffraction (HR-PXRD). The photocatalytic activity is evaluated by measuring the rate of degradation of a model organic compound (Rhodamine B) in water under UV irradiation. An increase up to100 of the degradation rate, with respect to the TiO2-NPs used as starting material, is observed. The photophysical mechanism underlying this enhanced photocatalytic activity is investigated by ultrafast TA spectroscopy with sub-200fs time resolution and broad spectral coverage (430-1400nm). We compare the decays of photo-generated e-h pairs in the composite with those in pristine TiO2 and we observe that TiO2-NPs inject e into the graphite flakes. The increased photo-production of reactive species explains the photocatalytic activity improvement, with exfoliated graphite acting as e-acceptor.
II Results and Discussion
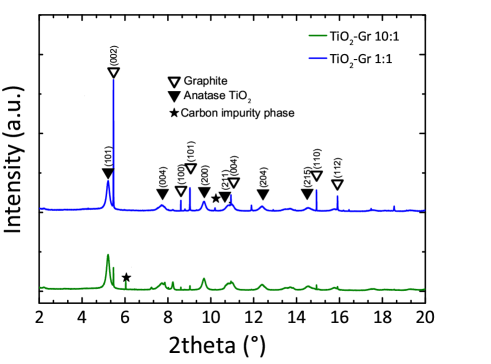
The composites are prepared via ultra sonication of graphite in a 2mg/ml aqueous dispersion of TiO2-NPs for 4 hours (ELMATransonicT460/H-35kHz) at 40 ∘C. The exfoliation is performed in Millipore ultrapure water (resistivity 18.2 Mcm at 25∘C). We use flakes from Sigma-Aldrich with size150m and TiO2-NPs in the anatase form from HOMBIKAT AHP 200, Sachtleben Chemie GmbH (purity of the crystalline phase94w/w, average surface area193m2/g). To explore a wide range of conditions, two TiO2-graphite mass ratios are used: 1:1 in TiO2-Gr1:1 and 10:1 in TiO2-Gr10:1.
In order to study the effect of TiO2-NPs during liquid-phase sonication, we perform HR-PXRD measurements as a function of sonication time. Samples are loaded into 1mm borosilicate glass capillaries and diffraction patterns collected at ambient temperature with an incident X-ray wavelength of 0.319902Å. The full width at half maximum (FWHM) of the graphite diffraction peak is deduced by the Rietveld refinement methodYoung_1 , using the General Structure Analysis System (GSAS) program and EXPGUI interfaceTanaike1997 ; Fitch2004 .
Diffraction patterns collected after 30min sonication are shown in Fig.1. For longer time, up to 4h, further structural changes are not observed. Thus samples sonicated for 30min can be considered as the final products. Fig.1 confirms the presence of TiO2 anatase (as for The Joint Committee on Powder Diffraction Standards, JCPDS 21-1272bookJC ) and graphite (JCPDS 75-2078)Toby2001 . Moreover, the basal reflection shifts towards higher d-spacings (d002=3.357Å) with respect to graphite (JCPDS 75-2078, d002=3.347ÅToby2001 ). This suggests that TiO2-NPs assisted exfoliation increases the interplanar spacing of the resulting flakes. The diffraction peak of TiO2-Gr10:1 has lower intensity than in TiO2-Gr1:1. This indicates that an increase in TiO2-NPs concentration leads to a decrease in the number of planes oriented along Toby2001 . As the concentration of TiO2-NPs increases, the 002 reflection broadens and the corresponding FWHM increases. The broadened FWHM is due to a smaller crystallite sizeToby2001 ; Holcomb1973 (195nm, 241nm and 255nm for TiO2-Gr10:1, TiO2-Gr1:1 and graphite, respectively) as determined by the Rietveld methodYoung_1 using the software GSAS-II of Ref.Toby2013, .
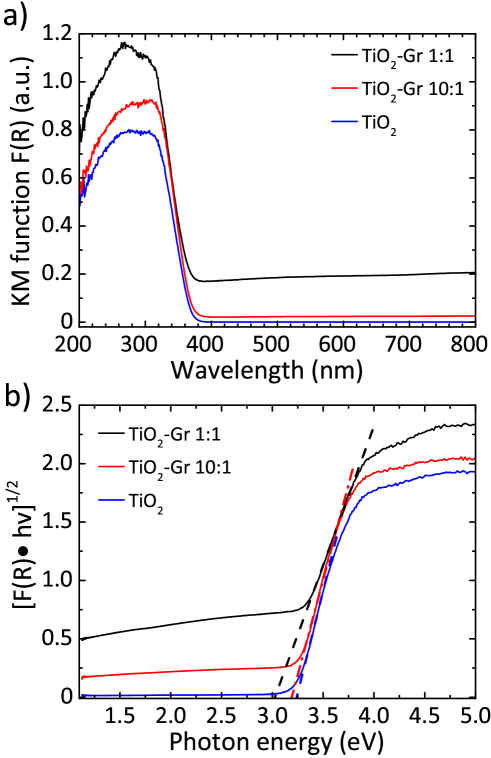
We then investigate the photo-physical properties of the samples by UV-visible (UV-Vis) diffuse reflectance spectrometry with a Perkin Elmer Lambda45 UV-Vis spectrophotometer with Harricks praying mantis diffuse reflectance. For each sample, 10mg is mixed with a 500mg NaCl matrix. We use a quartz cuvette with 0.5cm optical path. The reflectance background of NaCl (reference) is taken as baseline for each measurement. The diffuse reflectance can be linked to the absorption coefficient through the Kubelka-Munk(KM) functionKubelka1931 F(R). For a sample thickness3mmKortum2012 ; Workman1998 , with no light transmission, F(R) can be written asChristy1995 :
| (1) |
where R is the absolute reflectance, K [cm-1] is the absorption coefficient, s [cm-1] is the scattering coefficient, is the absorptivity [Lcm-1] and c is the concentration [M]. Since the samples are dispersed into a non-absorbing matrix (NaCl), s in Eq(1) can be assumed to be that of NaCl and constantJackson_1 . As a consequence, F(R) is proportional to K. Fig.2a plots the spectra of pristine TiO2, TiO2-Gr10:1 and TiO2-Gr1:1. A transition from the valence to the conduction band of TiO2 can be seen at340-360nm in all samples, as expected for anatase based compositesReddy_1 ; Murphy_1 . The presence of exfoliated graphite gives rise to absorption from 400 to 800nmSmausz2017 , and F(R) is higher with respect to pristine TiO2. An estimation of the band gap can be obtained applying the Tauc equation, which relates absorption edge, energy of incident photons and Tauc gap Ngamta2013 :
| (2) |
where A is a proportionality constant and the index n depends on the interband transitions dominating the absorption. In TiO2 n=2 is appliedNgamta2013 because the interband transitions are indirect. ET can be determined by a linear extrapolation of (F(R)h)1/2 versus h, Fig.2. We get E for pristine TiO2 decreasing to and for TiO2-Gr10:1 and TiO2-Gr1:1.

The photocatalytic activity is investigated by measuring the photo-degradation of a molecular non-azo-dye (rhodamineB; RhB). This compound is taken as model for organic volatile pollutants since its molecular structure is close to that of the environmental contaminants used in industry and agricultureJain_1 . This test follows the same procedures used to characterize other TiO2-carbon compositesZhangN2012 ; Liang2010 . TiO2, TiO2-Gr10:1 and TiO2-Gr1:1 are dispersed in an aqueous solution and sonicated for 4h. In order to understand the effect of the graphite flakes on PQE, the amount of TiO2-Gr10:1 and TiO2-Gr1:1 is chosen to guarantee the same concentration of TiO2 (2mg/ml) inside each suspension. We test 10ml mixtures comprising 2.86ml of an aqueous solution of RhB (0.05mg/ml,110-4M), 2.14 ml H2O and 50 suspension of TiO2-Gr10:1 or TiO2-Gr1:1. Considering the affinity of graphitic flakes, due to the - stacking of their aromatic systems, for polycyclic aromatic and cationic compounds like RhBGuidetti2016 , the suspensions are magnetically stirred for 40min in the dark, in order to attain adsorption-desorption equilibrium between composite and dye. Ref.Guidetti2016, reported that, when RhB is adsorbed onto 2-3 layers graphene flakes, there is a ground state interaction that leads to a decrement in the intensity of UV/Vis absorption and photoluminescence (PL) of the dye independent of photodegradation. It is thus necessary to determine the fraction of RhB that remains free inside the solution, since this is required to discriminate whether the change in the dye concentration under irradiation is due to a photoreaction or to adsorption. To obtain the adsorption, after stirring in the dark, 0.75ml of the RhB-composite suspension is taken and centrifuged at 9000rpm for 10min at T=25oC in order to separate the sample from the RhB solution. The upper 0.5ml is collected and diluted with water (1:6 ratio) to reach the 3ml volume of analysis of a standard cuvette for a UV/Vis spectrophotometer. The concentration CD (mol L-1) of free RhB after incubation in the dark is derived from UV/Vis absorption spectra (max=554nm) recorded at 25∘ with a Cary300 UV-Vis spectrophotometer and a 180m path-length cuvette. The percentage Ads of RhB adsorbed is calculated starting from the initial concentration C0 (molL-1) of the used dye, asPATIL :
| (3) |
| TiO2 | TiO2-Gr10:1 | TiO2-Gr1:1 | |
|---|---|---|---|
| P(20min) | 38 | 54 | 45 |
| P(40min) | 66 | 87 | 64 |
| Ads | 5 | 5 | 35 |
The photoreactivity after photoexcitation of TiO2 is investigated by exposing each sample to a lamp emitting in the UVA/UVB range (280-400nm), matching the absorption spectra of the composites,Fig.2. The lamp has irradiance, i.e. emitted power per unit area, I3W/m2 in the UVA (280-315nm) and13.6 W/m2 in UVB (315nm-400nm), at 0.5m from the source. The samples are placed 35cm from the lamp. We use 1mW UVA/UVB for 60mins, sampling 0.75ml every time interval t of 10mins. The collected volumes are centrifuged, diluted and analyzed with the same procedure used for the determination of CD, detecting the concentration C(t) of RhB not degraded after t from the beginning of the irradiation. The percentage of RhB photodegraded, P (t) isNatarajan2011 :
| (4) |
Using this approach, the photocatalytic activity is assessed independently of the possible adsorption of the dye onto the surface of the photoactive material, since the concentration of the dye after pre-equilibration is taken as a reference. For TiO2-Gr10:1, Table 1 shows an increment of P(t) with respect to TiO2 of16 after 20mins and21 after 40mins. For TiO2-Gr1:1, the increment is7 after 20mins while a decrement2 occurs after 40mins. The adsorption of RhB increases from5 in TiO2-Gr10:1 to35 in TiO2-Gr1:1. These results indicate that TiO2-Gr1:1 does not show improvement in photocatalytic activity with respect to TiO2. The reason for this is the presence of a residual of graphite that is not electronically interacting with TiO2 in TiO2-Gr1:1. This excess of graphite is demonstrated by the broad absorption in the 400-800 nm region in Fig.2. This graphite adsorbs RhB as demonstrated by the increase of the adsorbed fraction from 5 to 35 but it is not photocatalyically active. As a result, the fraction of light absorbed by this non-photochemically active component is dissipated without giving photodegradation of RhB, causing a decrease of P. We thus identify TiO2-Gr10:1 as a promising photocatalytic compound since it gives an enhanced P(t) with respect to TiO2, for a similar RhB adsorption. The observed lack of improvement in photocathalytic activity of TiO2-Gr1:1 with respect to TiO2 is in agreement with Refs.ZhangN2012, ; WangY2010, ; Zhang2010, ; Zhu2012, , where the adsorption and photocatalytic activity of TiO2 composites with GO and RGO was reported: a GO/TiO2 or RGO/TiO2 weight10 w/w was associated with a decrease of photocatalytic activity. Hence, we focus on TiO2-Gr10:1 hereafter.
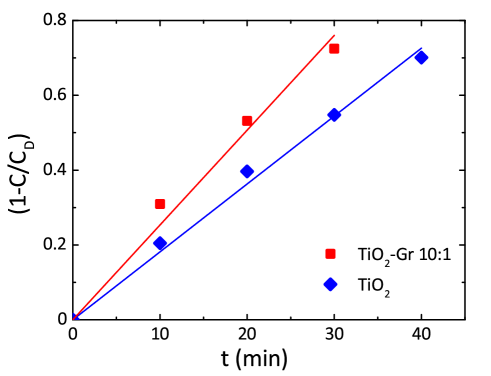
Fig.3 compares the concentration of RhB during photodegradation upon UV irradiation for: i) TiO2-Gr10:1, ii) reference TiO2, iii) graphite, iv) no photocatalyst. The trends indicate that the dye’s degradation temporal profile is a combination of a zero-order and a first-order kinetics. In zero-order kinetics, the rate is independent of the reactant concentration and the RhB concentration decreases linearly with timeZhou2018 , while in first order, the rate is proportional to the dye concentration.
Since neither zero-order nor first order models fit the data of Fig.3, we use a pseudo-zero-order kinetic model commonly adopted in the case of organic dye photodegradation in heterogeneous systemsRajeshwar_1 :
| (5) |
where k(min-1) is the kinetic constant. Fig.4 fits the data with Eq.5. This gives k(min-1)0.018 and0.025 for TiO2 and TiO2-Gr10:1, again indicating that TiO2-Gr10:1 has higher photoactivity than TiO2.
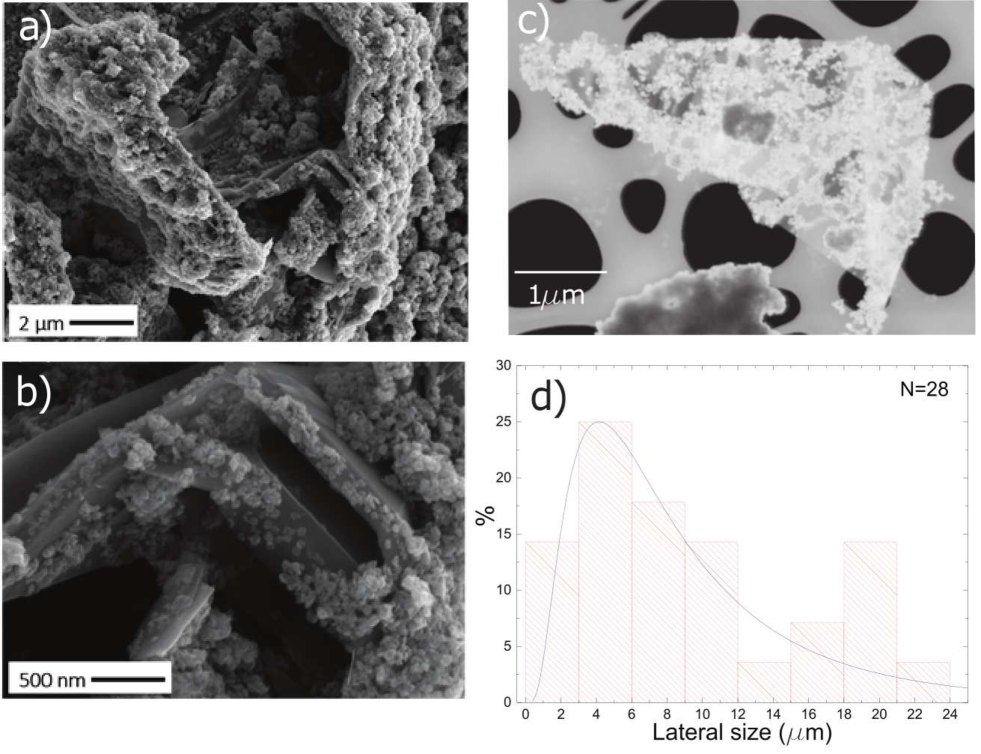
The morphology of TiO2-Gr10:1 is investigated by scanning electron microscopy (SEM, Quanta3D, FEI Company). Fig.5a shows graphitic flakes covered by TiO2-NPs. The higher magnification image Fig.5b indicates that the flakes edges are decorated by NP agglomerates. The lateral size of the flakes is evaluated by Scanning Transmission Electron Microscopy (STEM, Magellan 400L FEI) depositing20l TiO2-Gr10:1 on a holey carbon Cu grid (300 mesh). From a statistical analysis of isolated flakes similar to that in Fig.5c, an average lateral size5m is estimated, Fig.5d.
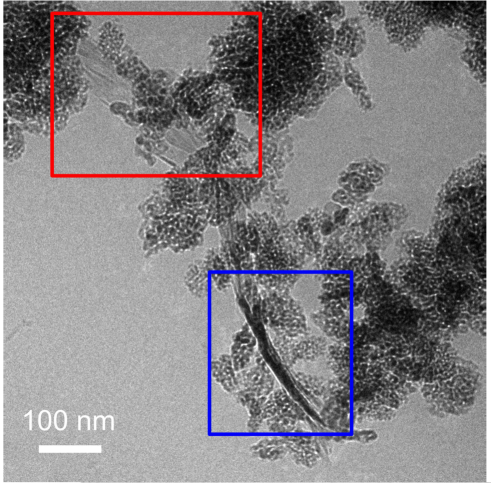
To exclude that the TiO2-NPs adhesion to the flakes is due to the drying of the TiO2-Gr10:1 suspension, we perform Cryo-TEM (CRyoTitan FEI) experiments. 20l TiO2-Gr10:1 is deposited on a holey carbon grid (Quantifoil R2/2 200mesh), then the sample is loaded into the chamber of a FEI VitrobotTM Mark III, that maintains 100 humidity at 4oC. Inside the chamber there are two blotting papers on either side of the sample, which close on the grid and leave a layer of suspensionhundreds nm thickfei . The sample is then plunged into liquid ethane at -183.3 oC, which avoids the formation of ice crystalsbib3 , creating a vitreous ice (amorphous solid form of water)bib3 . This allows us to investigate the morphology of TiO2-Gr10:1 in the liquid phase, confirming that TiO2-NPs adhere to the flakes, both on the surface (red rectangle) and at the edges (blue rectangle), Fig.6.
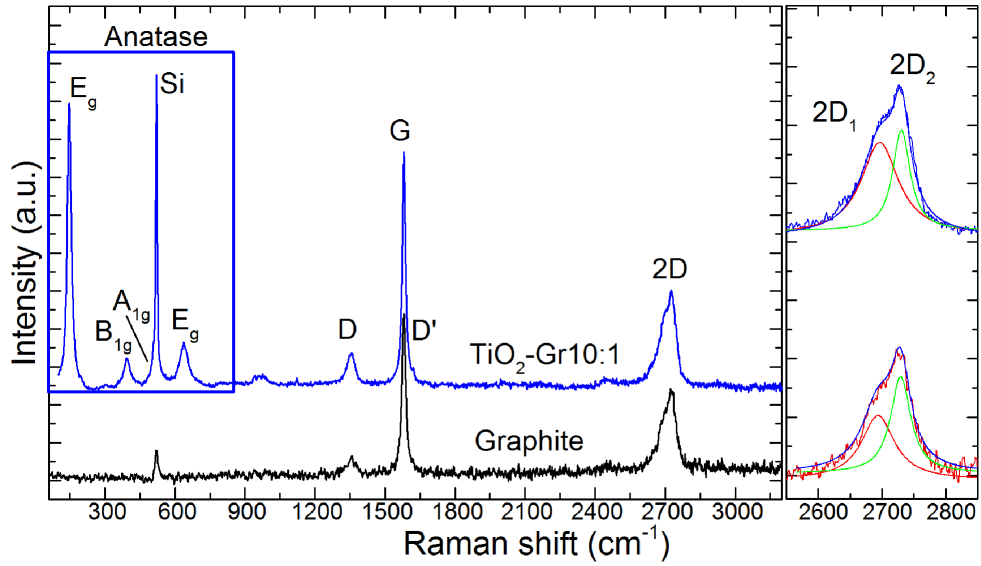
TiO2-Gr10:1 and the starting graphite are also characterized by Raman spectroscopy. 60l is drop cast onto a Si/SiO2 substrate, then heated at 100 ∘C for 20mins, to ensure water evaporation. Raman spectra are acquired at 514.5nm using a Renishaw InVia spectrometer with a Leica DM LM microscope and a 50x objective. The power on the sample is kept below 1mW to avoid any possible damage and heating. The spectral resolution is1cm-1. A statistical analysis is performed as follows: the substrate is divided into 4 regions500500 m2 and in each 5 points are acquired. Fig.7 plots representative Raman spectra of the starting graphite (black line) and of TiO2-Gr10:1 (blue line) both on Si/SiO2. The peaks at 144, 397, 518 and 639 cm-1 are the Eg, B1g, A1g and Eg modes of anatase TiO2Ohsaka1978 . The TiO2 peak at 518cm-1 is very close to the first order peak of silicon 521cm-1Temple1973 and they are partially overlapping. The crystallite size of TiO2-NPs can be estimated from the position Pos(Eg@144cm-1) and FWHM(Eg@144cm-1)Swamy2005 . In our case Pos(Eg@144cm-1)147cm-1 and FWHM20cm-1 correspond to a NPs size7nmSwamy2005 , in agreement with an estimate from TEM images, as in Fig.6, of5-10nm. Figs.8a,b show no significant difference between Pos(G) and FWHM(G) of graphite and TiO2-Gr10:1. The 2D peak shape for TiO2-Gr10:1 still resembles that of graphiteFerrariPRL2006 with two components (2D1, 2D2), but their intensity ratio I(2D2)/I(2D1) is reduced from 2.4 to 1.4, Fig.8c. This indicates that the bulk flakes have undergone exfoliationFerrari2000 .
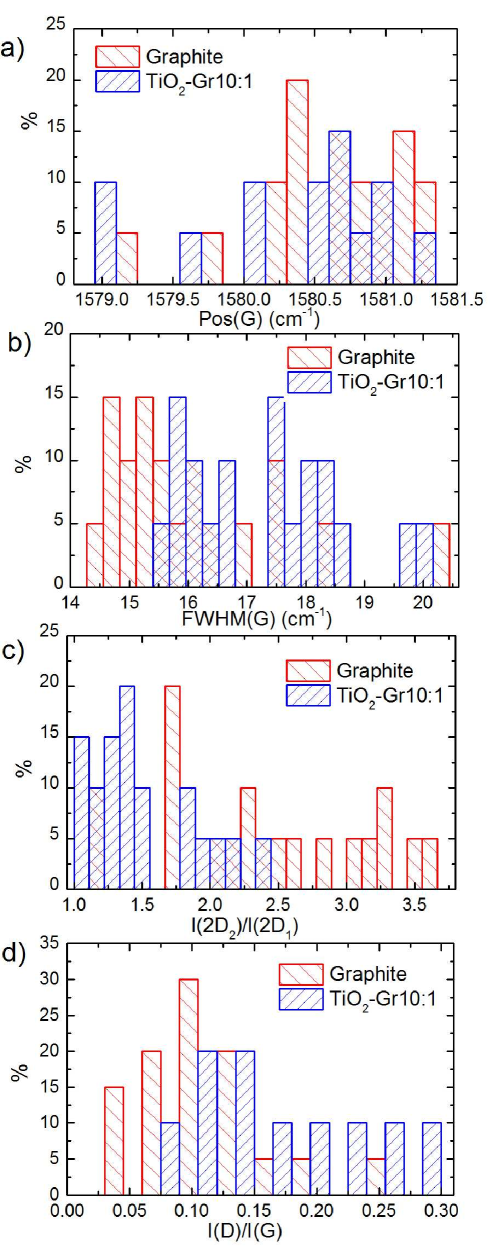
When compared to the initial graphite, TiO2-Gr10:1 has a higher I(D)/I(G) and FWHM(G). I(D)/I(G) varies inversely with the crystal size, La, according to the Tuinstra and Koenig (TK) equation: I(D)/I(G)4.4nm/LaFerrari2000 ; Tuinstra1970 . Alternatively, this can be seen as proportional to the average interdefect distance, LD: I(D)/I(G)130nm/LCancado2011 . I(D)/I(G) can also be affected by dopingBruna2014 . The lack of up shift of Pos(G) and of FWHM(G) narrowing in TiO2-Gr10:1 when compared to graphite suggests a level of doping similar to the starting graphite, with a negligible effect on I(D)/I(G). We get L31nm and L33nm for TiO2-Gr10:1 while for graphite these are43nm and63nm. Given the average flakes lateral size in Fig.6, these numbers reflect the defective nature of the starting graphite, and show that defects increase after sonication. La determined by Raman is consistent with that derived from HR-PXRD, although lower.
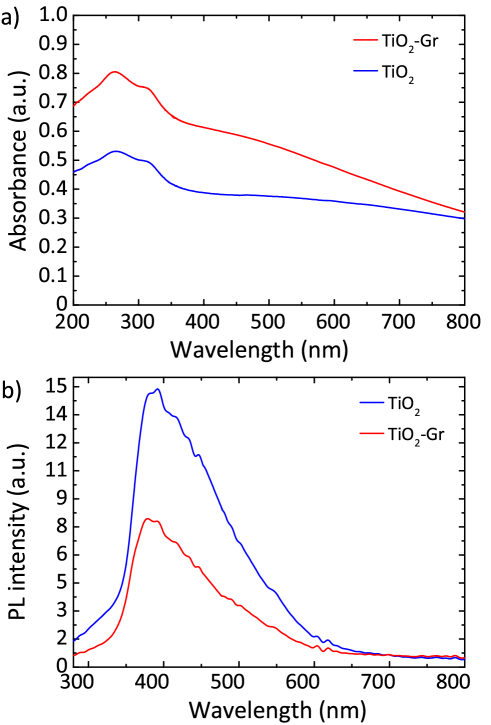
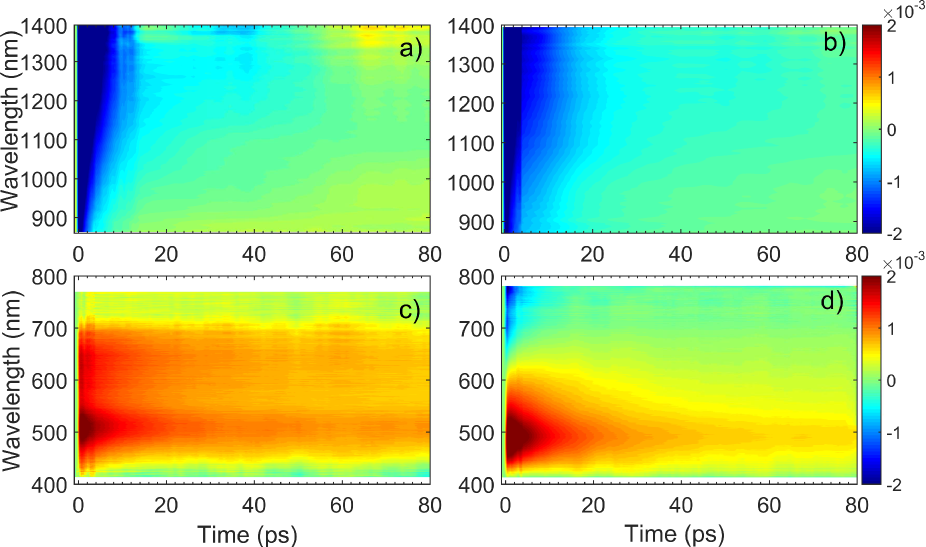
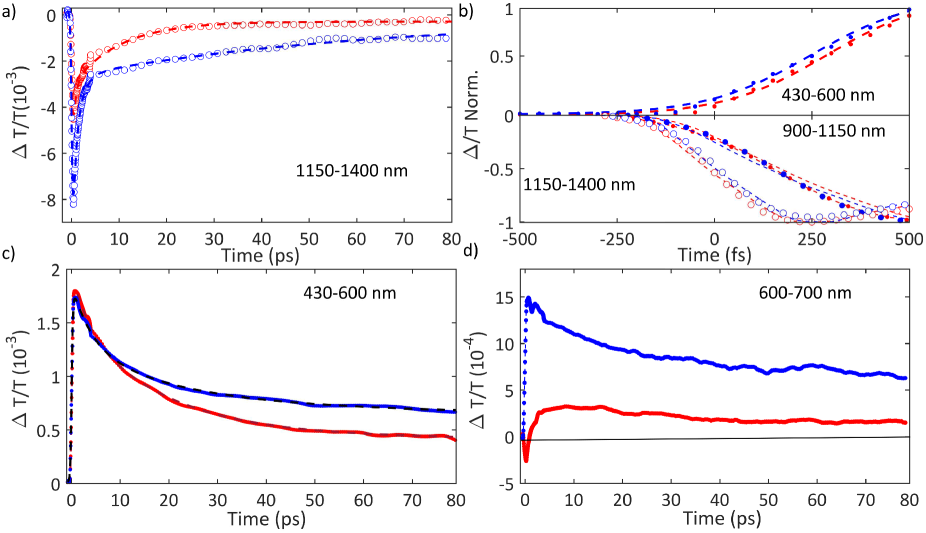
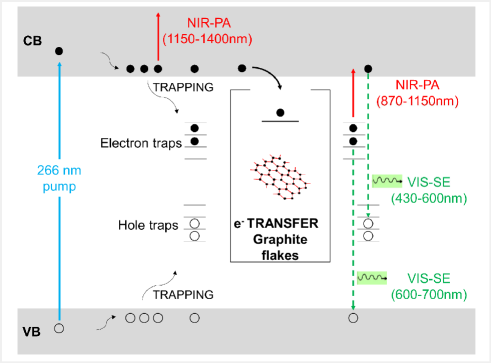
Fig.9a plots the UV-Vis absorbance, -log10(T), with T the transmittance of TiO2 and TiO2-Gr10:1. These have two bands in the UV region at 270 and 306nm, characteristic of TiO2-NPsGu2008 , assigned to the first allowed vertical transitions that occur at the center of the Brillouin zone of TiO2-NPsSerpone_2 . The PL spectra of TiO2 and TiO2-Gr10:1 in the liquid phase, following excitation at 266nm, are reported in Fig.9b. While the shape of the spectra is similar, the PL intensity quenching in TiO2-Gr10:1 points to an interaction between the excited TiO2 and the exfoliated graphite, which prevents radiative recombination of the photogenerated e-h pairs.
The generation of reactive oxygen speciesHirakawa_1 (ROS) was identified as the photodegradation mechanism of organic pollutantsZhangY2010 and RhBGao2012 . The presence of exfoliated graphite in TiO2-Gr10:1 may result in a higher ROS generation, due to e-transfer from TiO2 to graphite, allowing a more stable charge separation in TiO2. The first step of the photocatalytic degradation reaction is the photo-excitation of e-h pairs in TiO2-NPs by absorption of UV photons with energy exceeding the TiO2 gap. The ROS generation depends on the competition between charge recombination, either radiative or non-radiative, and the separation of the photo-excited charges required to initiate the oxidative (reductive) pathwaysHirakawa_1 . Accordingly, the enhancement of photocatalytic activity may be traced back to modifications of the relaxation channels of photoexcited e-h in TiO2, induced by graphite flakes.
In order to identify these channels, we perform a comparative study of charge-carriers dynamics in pristine TiO2 and TiO2-Gr10:1 using broadband TA spectroscopy with sub-200fs time-resolution. We use an amplified Ti:sapphire laser (Coherent, Libra) with 100fs, 500J pulses at 800nm and 1kHz. The 266nm-pump pulse is generated by frequency tripling the laser output and it is modulated with a chopper at 500Hz. The broadband probe pulse is obtained by white light continuum generation in a plate of sapphire, for the visible, or yttrium aluminium garnet (YAG), for the near-infrared (NIR). The probe spectrum is detected by an optical multichannel analyzer with a wavelength resolution1nm. The parallel linearly polarized pump and probe pulses are focused on the sample in a non-collinear geometry with spot sizes180 and80m, in order to guarantee homogeneous excitation of the detected sample region. The pump power is 1.6mW, corresponding to an incident fluence3mJ/cm2 (1016 photons cm-2). The measured signal is the delay-dependent differential transmission spectrumDeSilvestri2017 , defined as )=Ton(, )/Toff()-1, where Ton and Toff are the probe spectra transmitted through the excited and the unexcited sample, respectively, is the probe wavelength and the pump-probe delay, controlled with a motorized translation stage. The temporal resolution is180fs. We excite with UV pulses at 266nm, well above the band gap of TiO2Hoffmann1995 , and measure from 430 to 1400nm.
Fig.10 plots () maps as a function of and . In the NIR, Figs.10a,b, both TiO2 and TiO2-Gr10:1 exhibit broad photo-induced absorption (PA, 0) from 870 to 1400nm. We assign it to intraband transitions of the photo-excited free e from the conduction band (CB) edge, as reported for anatase TiO2-NPsSzczepankiewicz2002 ; Yoshihara2004 ; YamakataA2001 ; Yamakata2001 . An additional source of PA in the NIR comes from the transition of trapped e to the CBKnorr2008 . A large variety of trapping states is expected in TiO2, with energy distribution dependent on sample preparationSchneider2014 . According to Refs.Yoshihara2004, ; Tamaki2006, the contribution of trapped e to the PA signal should dominate in the range 870-1150nm, while the free e absorption, which scales as with n=1.7Yoshihara2004 , dominates at longer wavelengths. In the NIR, both SLGBreusing2011 and multilayer grapheneSun2008 show a positive , corresponding to photo-bleaching (PB) due to Pauli blockingBreusing2011 ; Sun2008 from the hot e distribution in the CBBrida2012 ; Tomadin2013 . Since the TA spectrum of TiO2-Gr10:1 in the NIR consists of a PA band, we conclude that its optical response is dominated by TiO2, due both to the higher intensity of the transient signal from TiO2 and to the higher concentration of TiO2 with respect to graphite flakes.
The TA maps of TiO2-Gr10:1 and TiO2 in the NIR differ for their time decay, as shown in Fig.11a. The portion of the PA band in the range 1150-1400nm can be attributed to free e, as confirmed by the resolution limited formation of the signal in Fig.11b, and by the monotonic increase of the signal with probe wavelength. For TiO2, this PA relaxes following a bi-exponential decay with time constants , . In the presence of exfoliated graphite, the relaxation dynamics is best fit by a three-exponential decay with time constants , , . In both TiO2 and TiO2-Gr10:1, the first sub-ps decay component is associated to the trapping of free eTamaki2006 ; Iwata2004 ; Tamaki2007 . The appearance of an additional decay channel, and the overall shortening of the PA bands lifetime observed in the composite with respect to the pristine TiO2-NPs can be explained by ultrafast charge transfer from TiO2 to the graphite flakes, which act as e scavengers. The PA dynamics in the range 870-1150nm, mainly related to absorption from trapped eYoshihara2004 ; Tamaki2006 , appears almost unperturbed by the presence of exfoliated graphite, suggesting that e transfer mostly involves free e. In both samples, this PA band shows a build-up with a 400-500fs time constant (Fig.11b), related to e trapping. This rise time, consistent with the200fs time constant measured in Pt-loaded TiO2 particlesFurube2001 , matches the sub-ps decay component (indicated as , ) of PA in the range 1150-1400nm, observed in both TiO2 and TiO2-Gr10:1, which we attribute to free e trapping. Further evidence of e transfer from TiO2 to flakes can be found in the out-of-equilibrium optical response in the visible range, Figs.10c,d. In the TiO2 sample we observe an increase in transmission (0) in the visible which, considering the vanishing ground state absorption in this spectral range, can be assigned to stimulated emission (SE), i.e. amplification of the probe beam due to optical gainDeSilvestri2017 . We identify two overlapping SE bands: the first, in the range 430-600nm, due to the recombination of free e with trapped h. The second, in the range 600-700nm, due to recombination of trapped e with free h. In TiO2-Gr10:1 the second, red shifted SE band is strongly quenched and a residual component appears few ps after excitation, Fig.11d. The SE band in the range 430-600nm, related to trapped h recombination can be observed in both samples, but in TiO2-Gr10:1 it decreases faster to equilibrium, see Fig.11c. This band has a single exponential build up with 400-500fs time constant, possibly due to h trapping, Fig.11b. The SE relaxation dynamics can be fit by a bi-exponential decay on top of a long-lasting component related to the emission on the ns timescaleYamakata2001 . In TiO2, we get , , while in TiO2-Gr10:1 we have , (Fig.11c). While could depend on the lifetime of the trapped h, the other three relaxation components , and , match those observed for the PA decay in the NIR (equal to , , ) indicating that the SE band at 430-600nm and the PA band at 1150-1400nm decay with similar dynamics. These components can be associated to the population dynamics of free e, whose lifetime in TiO2-Gr10:1 is limited by the charge transfer to graphitic flakes, which occurs on a time-scale4-20ps. Previous ultrafast spectroscopy studiesTamaki2007 ; Furube2001 on Pt loaded TiO2-NPs suggested a similar e transfer time of several ps. In our case, e transfer to the graphitic flakes increases the trapped h lifetime, because it inhibits one of their recombination channels, enhancing the oxidative photocatalytic reactivity of the composite.
Fig.12 summarizes the photoexcitation and relaxation pathways of TiO2 and TiO2-Gr10:1 derived from our ultrafast TA experiments. In pristine TiO2, the free e and h photo-excited into CB and VB by the UV-pump pulse (blue arrow), can either be excited by the probe pulse into higher energy states via intraband transitions responsible for the instantaneous PA band in the range 1100-1500nm, or they can relax into intragap trapped states. The trapped charge carriers can radiatively recombine with free charges giving rise to the SE bands in the range 430-600nm and 600-700nm. Trapped e can also be photo-excited into CB as indicated by the PA bands in the range 870-1150nm. All the bands related to the relaxation of trapped charge carriers share the same build-up dynamics due to the trapping. The interaction with graphitic flakes influences the optical properties of TiO2-Gr, when compared to TiO2, by opening an additional relaxation channel for the free e, which can efficiently transfer to the graphite flakes, thus slowing down e-h recombination, enhancing the photocatalytic activity.
III Conclusions
We reported TiO2/Gr composites with enhanced photocatalytic activity with respect to pristine TiO2-NPs. These are produced via liquid phase exfoliation of graphite in presence of TiO2-NPs, without surfactants which could prevent the energy or charge transfer between TiO2 and graphite flakes. The observed photo-degradation kinetics consists of a combination of zero-order and first-order processes. We assigned the increase in photocatalytic activity to electron transfer from TiO2 to the graphite flakes, which occurs within the first ps of the relaxation dynamics. Due to the simplicity and cost effectiveness of the preparation procedure of our samples, we anticipate applications to smart photoactive surfaces for environmental remediation.
IV Acknowledgments
We acknowledge funding from the EU Graphene Flagship, EU Neurofibres, ERC Minegrace and Hetero2D, EPSRC Grants EP/509K01711X/1, EP/K017144/1, EP/N010345/1, EP/M507799/ 5101, and EP/L016087/1.
References
- (1) http://www.who.int/topics/en (accessed Oct 2017)
- (2) http://www.who.int/mediacentre/news/releases/2016/air-pollution-estimates/en (accessed Oct 2017)
- (3) https://www.unicef.org/publications/files/Progress_on_Drinking_Water_Sanitation_and_Hygiene_2017.pdf (accessed Oct 2017)
- (4) M. R. Hoffmann, S. T. Martin, W. Y. Choi and D. W. Bahnemann, Chem. Rev. 95, 69 (1995).
- (5) T. Hirakawa and Y. Nosaka, Langmuir 18, 3247 (2002).
- (6) N. Serpone, D. Lawless, R. Khairutdinov and E. Pelizzetti, J. Phys. Chem. 99, 16655 (1995).
- (7) N. Serpone, D. Lawless and R. Khairutdinov, J. Phys. Chem. 99, 16646 (1995).
- (8) Q. Zhang, Q. An, X. Luan, H. Huang, X. Li, Z. Meng, W. Tong, X. Chen, P. K. Chu and Y. Zhang, Nanoscale 7, 14002 (2015).
- (9) Y. Lai, J. Huang, Z. Cui, M. Ge, K. Zhang, Z. Chen and L. Chi, Small 12, 2203 (2016).
- (10) S. Nishimoto and B. Bhushan, Rsc Adv. 3, 671 (2013).
- (11) A. Mamaghani, F. Haghighat and C. S. Lee, Appl. Catal. B-Environ. 203, 247 (2017).
- (12) C. Yu, W. Zhou, H. Liu, Y. Liu and D. D. Dionysiou, Chem. Eng. J. 287, 117 (2016).
- (13) T. Xia, M. Kovochich, J. Brant, M. Hotze, J. Sempf, T. Oberley, C. Sioutas, J. I. Yeh, M. R. Wiesner and A. E. Nel, Nano lett. 6, 1794 (2006).
- (14) http://www.cnchemicals.com/Press/88893-CCM
- (15) A. L. Linsebigler, G. Q. Lu and J. T. Yates, Chem. Rev. 95, 735 (1995).
- (16) I. Foyo-Moreno, I. Alados, F.J. Olmo and L. Alados-Arboledas, Agric. For. Meteorol. 120, 101 (2003).
- (17) X. Chen and S. S. Mao, Chem. Rev. 107, 2891 (2007).
- (18) A. Fujishima, X. Zhang and D. A. Tryk, Surf. Sci. Rep. 63, 515 (2008).
- (19) N. Serpone, J. Photoch. Photobio. A 104, 1 (1997).
- (20) K. Dai, T. Peng, D. Ke and B. Wei, Nanotechnology 20, 125603 (2009).
- (21) M. Sun, X. Ma, X. Chen, Y. Sun, X. Cui and Y. Lin, RSC Adv. 4, 1120 (2014).
- (22) K. R. Reddy, M. Hassan and V. G. Gomes, Appl. Catal. A- Gen. 489, 1 (2015).
- (23) L. Han, P. Wang and S. Dong, Nanoscale 4, 5814 (2012).
- (24) R. Leary and A. Westwood, Carbon 49, 741 (2011).
- (25) W. Tu, Y. Zhou and Z. Zou, Adv. Funct. Mater. 23, 4996 (2013).
- (26) H. X. Wang, Q. Wang, K. G. Zhou and H. L. Zhang, Small 9, 1266 (2013).
- (27) N. Zhang, M. Q. Yang, S. Liu, Y. Sun and Y. J. Xu, Chem. Rev. 115, 10307 (2015).
- (28) N. Zhang, Y. Zhang and Y. J. Xu, Nanoscale 4, 5792 (2012).
- (29) C. Chen, W. Cai, M. Long, B. Zhou, Y. Wu, D. Wu and Y. Feng, ACS Nano 4, 6425 (2010).
- (30) J. Du, X. Lai, N. Yang, J. Zhai, D. Kisailus, F. Su, D. Wang and L. Jiang, ACS Nano 5, 590 (2011).
- (31) Y. Gao, X. Pu, D. Zhang, G. Ding, X. Shao and J. Ma, Carbon 50, 4093 (2012).
- (32) J. Guo, S. Zhu, Z. Chen, Y. Li, Z. Yu, Q. Liu, J. Li, C. Feng and D. Zhang, Ultrason. Sonochem. 18, 1082 (2011).
- (33) B. Jiang, C. Tian, Q. Pan, Z. Jiang, J. Q. Wang, W. Yan and H. Fu, J. Phys. Chem. C 115, 23718 (2011).
- (34) C. H. Kim, B. H. Kim and K. S. Yang, Carbon 50, 2472 (2012).
- (35) I. Y. Kim, J. M. Lee, T. W. Kim, H. N. Kim, H. I. Kim, W. Choi and S. J. Hwang, Small 8, 1038 (2012).
- (36) N. Li, G. Liu, C. Zhen, F. Li, L. Zhang and H. M. Cheng, Adv. Funct. Mater. 21, 1717 (2011).
- (37) Y. Liang, H. Wang, H. S. Casalongue, Z. Chen and H. Dai, Nano Res. 3, 701 (2010).
- (38) Y. T. Liang, B. K. Vijayan, K. A. Gray and M. C. Hersam, Nano Lett. 11, 2865 (2011).
- (39) Y. T. Liang, B. K. Vijayan, O. Lyandres, K. A. Gray and M. C. Hersam,J. of Phys. Chem. Lett. 3, 1760 (2012).
- (40) J. Liu, Z. Wang, L. Liu and W. Chen, Phys. Chem. Chem. Phys. 13, 13216 (2011).
- (41) S. Liu, H. Sun, S. Liu and S. Wang, Chem. Eng. J. 214, 298 (2013).
- (42) X. Pan, Y. Zhao, S. Liu, C. L. Korzeniewski, S. Wang and Z. Fan, ACS Appl. Mater Inter. 4, 3944 (2012).
- (43) L. M. Pastrana-Martinez, S. Morales-Torres, V. Likodimos, J. L. Figueiredo, J. L. Faria, P. Falaras and A. M. T. Silva, Appl. Catal. B-Environ. 123, 241 (2012).
- (44) M. S. A. S. Shah, A. R. Park, K. Zhang, J. H. Park and P. J. Yoo, ACS Appl. Mater. Inter. 4, 3893 (2012).
- (45) J. Shen, M. Shi, B. Yan, H. Ma, N. Li and M. Ye, Nano Res. 4, 795 (2011).
- (46) N. P. Thuy-Duong, P. Viet Hung, E. W. Shin, P. Hai-Dinh, S. Kim, J. S. Chung, E. J. Kim and S. H. Hur, Chem. Eng. J. 170, 226 (2011).
- (47) P. Wang, J. Wang, T. Ming, X. Wang, H. Yu, J. Yu, Y. Wang and M. Lei, ACS Appl. Mater. Inter. 5, 2924 (2013).
- (48) Y. Wang, R. Shi, J. Lin and Y. Zhu, Appl. Catal. B-Environ. 100, 179 (2010).
- (49) G. Williams, B. Seger and P. V. Kamat, ACS Nano 2, 1487 (2008).
- (50) N. Yang, Y. Liu, H. Wen, Z. Tang, H. Zhao, Y. Li and D. Wang, ACS Nano 7, 1504 (2013).
- (51) H. Zhang, X. Lv, Y. Li, Y. Wang and J. Li, ACS Nano 4, 380 (2010).
- (52) J. Zhang, Z. Xiong and X. S. Zhao, J Mater. Chem. 21, 3634 (2011).
- (53) L. W. Zhang, H. B. Fu and Y. F. Zhu, Adv. Funct. Mater. 18, 2180 (2008).
- (54) P. Zhang, C. Shao, Z. Zhang, M. Zhang, J. Mu, Z. Guo and Y. Liu, Nanoscale 3, 2943 (2011).
- (55) Y. Zhang, Z. R. Tang, X. Fu and Y. J. Xu, ACS Nano 4, 7303 (2010).
- (56) Y. Zhang, Z. R. Tang, X. Fu and Y. J. Xu, ACS Nano 5, 7426 (2011).
- (57) Y. Zhang, N. Zhang, Z. R. Tang and Y. J. Xu, Phys. Chem. Chem. Phys. 14, 9167 (2012).
- (58) D. Zhao, G. Sheng, C. Chen and X. Wang, Appl. Catal. B-Environ. 111, 303 (2012).
- (59) N. Yang, J. Zhai, D. Wang, Y. Chen and L. Jiang, ACS Nano 4, 887 (2010).
- (60) T. F. Yeh, J. Cihlaárř, C. Y. Chang, C. Cheng and H. Teng, Mater. Today 16, 78 (2013).
- (61) A. Morais, C. Longo, J. R. Araujo, M. Barroso, J. R. Durrant and A. F. Nogueira, Phys. Chem. Chem. Phys. 18, 2608 (2016).
- (62) P. Wang, N. M. Dimitrijevic, A. Y. Chang, R. D. Schaller, Y. Liu, T. Rajh and E. A. Rozhkova, ACS Nano 8, 7995 (2014).
- (63) K. K. Manga, Y. Zhou, Y. Yan and K. P. Loh, Adv. Funct. Mater. 19, 3638 (2009).
- (64) K. J. Williams, C. A. Nelson, X. Yan, L. S. Li and X. Zhu, ACS Nano 7, 1388 (2013).
- (65) S. De Silvestri, C. Manzoni, R.Borrego-Varillas, A. Oriana and G. Cerullo, Riv. Nuovo Cimento 41, 1 (2017).
- (66) J. Schneider and D. Bahnemann, J. Phys. Chem. C 122, 13979 (2018).
- (67) R. Long, N. J. English and O. V. Prezhdo, J. Am. Chem. So. 134, 14238 (2012).
- (68) Y. Hernandez, V. Nicolosi, M. Lotya, F. M. Blighe, Z. Sun, S. De, I. McGovern, B. Holland, M. Byrne, Y. K. Gun’Ko et al., Nat. Nanotechnol. 3, 563 (2008).
- (69) F. Bonaccorso, A. Lombardo, T. Hasan, Z. Sun, L. Colombo and A. C. Ferrari, Mater. Today 15, 564 (2012).
- (70) M. Lotya, P. J. King, U. Khan, S. De and J. N. Coleman, ACS Nano 4, 3155 (2010).
- (71) A. C. Ferrari, F. Bonaccorso, V. Fal’ko, K. S. Novoselov, S. Roche, P. Boggild, S. Borini, F. H. L. Koppens, V. Palermo, N. Pugno et al., Nanoscale 7, 4598 (2015).
- (72) R. A. Young, The Rietveld method, (International union of crystallography, 1993).
- (73) O. Tanaike and M. Inagaki, Carbon 35, 831 (1997).
- (74) A. N. Fitch, J. Res. Natl. Inst. Stand. Technol. 109, 133 (2004).
- (75) W. Li, R. Liang, A. Hu, Z. Huang, Y. N. Zhou, RSC Adv. 4, 36959 (2014).
- (76) B. H. Toby, J. Appl. Crystallogr. 34, 210 (2001).
- (77) C. E. Holcombe, Report Y 1887, (USAEC Oak Ridge Y 12 Plant, 1973).
- (78) B. H. Toby, R. B. Von Dreele, J. Appl. Crystallogr. 46, 544 (2013).
- (79) P. Kubelka and F. Munk, Zeitschrift für Technische Physik 12, 593 (1931).
- (80) G. Kortüm, Reflectance spectroscopy: principles, methods, applications, (Springer Science & Business Media, 2012).
- (81) J. Workman Jr and A. Springsteen, Applied spectroscopy: a compact reference for practitioners, (Academic Press, 1998).
- (82) A. A. Christy, O. M. Kvalheim and R. A. Velapoldi, Vib. Spectrosc. 9, 19 (1995).
- (83) S. D. Jackson and J. S. J. Hargreaves, Metal Oxide Catalysis, (John Wiley & Sons, 2009).
- (84) K. M. Reddy, S. V. Manorama and A. R. Reddy, Mater. Chem. Phys. 78, 239 (2003).
- (85) A. Murphy, Sol. Energy Mater Sol. Cells 91, 1326 (2007).
- (86) T. Smausz, B. Kondász, T. Gera, T. Ajtai, N.Utry, M. D. Pintér, G. Kiss-Albert, J. Budai, Z. Bozóki, G. Szabo et al., Appl. Phys. A 123, 633 (2017).
- (87) S. Ngamta, N. Boonprakob, N. Wetchakun, K. Ounnunkad, S. Phanichphant, B. Inceesungvorn, Mater. Lett. 105, 76 (2013).
- (88) R. Jain, M. Mathur, S. Sikarwar and A. Mittal, J. Environ. Manage. 85, 956 (2007).
- (89) G. Guidetti, A. Cantelli, R. Mazzaro, L. Ortolani, V. Morandi and M. Montalti, Nanoscale 8, 8505 (2016).
- (90) S. P. Patil, B. Bethi, G. H. Sonawane, V. S. Shrivastava, S. Sonawane, J. Ind. Eng. Chem. 34, 356 (2016).
- (91) T. S. Natarajan, M. Thomas, K. Natarajan, H. C. Bajaj and R. J. Tayade, Chem. Eng. J. 169, 126 (2011).
- (92) P. Zhu, A. S. Nair, S. Peng, S. Yang and S. Ramakrishna, ACS Appl. Mater. Inter. 4, 581 (2012).
- (93) F. Zhou, C. Yan, T. Liang, Q. Sun and H. Wang, Chem. Eng. Sci. 183, 231 (2018).
- (94) K. Rajeshwar, M. Osugi, W. Chanmanee, C. Chenthamarakshan, M. Zanoni, P. Kajitvichyanukul and R. Krishnan-Ayer, J. Photoch. Photobio. C 9, 171 (2008).
- (95) http://www.fei.com/products/vitrobot (accessed Oct 2017).
- (96) H. Friedrich, P. M. Frederik, G. de With, N. A. Sommerdijk, Angew. Chem. Int. Ed. Engl. 49, 7850 (2010).
- (97) T. Ohsaka, F. Izumi and Y. Fujiki, J. Raman Spectrosc. 7, 321 (1978).
- (98) P. A. Temple and C. E. Hathaway, Phys. Rev. B 7, 3685 (1973).
- (99) V. Swamy, A. Kuznetsov, L. S. Dubrovinsky, R. A. Caruso, D. G. Shchukin and B. C. Muddle, Phys. Rev. B 71, 184302 (2005).
- (100) A. C. Ferrari et al., Phys. Rev. Lett. 97, 187401 (2006).
- (101) A. C. Ferrari, J. Robertson, Phys. Rev. B 61, 14095 (2000).
- (102) F. Tuinstra, J. L. Koenig, J. Chem. Phys. 53, 1126 (1970).
- (103) M. Bruna, A. K. Ott, M Ijaes, D. Yoon, U. Sassi, A. C. Ferrari ACS Nano 8, 74327441 (2014).
- (104) L. G. Cancado, A. Jorio, E. H. Martins Ferreira, F. Stavale, C. A. Achete, R. B. Capaz, M. V. O. Moutinho, A. Lombardo, T. S. Kulmala, and A. C. Ferrari Nano Letters 11, 3190 (2011).
- (105) D. E. Gu, Y. Lu and B. c. Yang, Chem. Commun. 21, 2453 (2008).
- (106) S. H. Szczepankiewicz, J. A. Moss and M. R. Hoffmann, J. Phys. Chem. B 106, 2922 (2002).
- (107) T. Yoshihara, R. Katoh, A. Furube, Y. Tamaki, M. Murai, K. Hara, S. Murata, H. Arakawa and M. Tachiya, J. Phys. Chem. B 108, 3817 (2004).
- (108) A. Yamakata, T. A. Ishibashi and H. Onishi, Chem. Phys. Lett. 333, 271 (2001).
- (109) A. Yamakata, T. A. Ishibashi and H. Onishi, J. Phys. Chem. B 105, 7258 (2001).
- (110) F. J. Knorr, C. C. Mercado and J. L. McHale, J. Phys. Chem. C 112, 12786 (2008).
- (111) J. Schneider, M. Matsuoka, M. Takeuchi, J. Zhang, Y. Horiuchi, M. Anpo and D. W. Bahnemann, Chem. Rev. 114, 9919 (2014).
- (112) Y. Tamaki, A. Furube, R. Katoh, M. Murai, K. Hara, H. Arakawa and M. Tachiya, C. R. Chim. 9, 268 (2006).
- (113) M. Breusing, S. Kuehn, T. Winzer, E. Malić, F. Milde, N. Severin, J. P. Rabe, C. Ropers, A. Knorr and T. Elsaesser, Phys. Rev. B 83, 153410 (2011).
- (114) D. Sun, Z. K. Wu, C. Divin, X. Li, C. Berger, W. A. de Heer, P. N. First and T. B. Norris, Phys. Rev. Lett. 101, 157402 (2008).
- (115) D. Brida, A. Tomadin, C. Manzoni, Y. J. Kim, A. Lombardo, S. Milana, R. R. Nair, K.S. Novoselov, A. C. Ferrari, G. Cerullo and M. Polini, Nat. Commun. 4, 1987 (2013).
- (116) A. Tomadin, D. Brida, G. Cerullo, A. C. Ferrari and M. Polini, Phys. Rev. B 88, 035430 (2013).
- (117) K. Iwata, T. Takaya, H. O. Hamaguchi, A. Yamakata, T. A. Ishibashi, H. Onishi and H. Kuroda, J. Phys. Chem. B 108, 20233 (2004).
- (118) Y. Tamaki, A. Furube, M. Murai, K. Hara, R. Katoh and M. Tachiya, Phys. Chem. Chem. Phys. 9, 1453 (2007).
- (119) A. Furube, T. Asahi, H. Masuhara, H. Yamashita and M. Anpo, Chem. Phys. Lett. 336, 424 (2001).