Extracting localized information from a Twitter corpus for flood prevention
Abstract
In this paper, we discuss the collection of a corpus associated to tropical storm Harvey, as well as its analysis from both spatial and topical perspectives. From the spatial perspective, our goal here is to get a first estimation of the quality and precision of the geographical information featured in the collected corpus. From a topical perspective, we discuss the representation of Twitter posts, and strategies to process an initially unlabeled corpus of tweets.
1 Introduction
Twitter is a popular micro-blogging service based on short textual posts. Its users interact by sharing their opinions, experiences or moods. Its availability on mobile platforms lets users react in real time to catastrophic events such as forest fires, earthquakes or floods. Modelling and predicting flood outbreak and spread are essential in order to mitigate the ecological and economical impact of such events. The classical approach for prediction relies on simulations of the flow and saturation resulting from rainwater [3]. More recently, assimilation models were proposed as means to incorporate external information, such as multispectral satellite imagery, to ensembles of physical models [17]. The Publimape project explores the extension of this approach to social data, as posted on platforms such as Twitter or Instagram. The tropical storm Harvey, occurred in 2017 and widely discussed then111https://en.wikipedia.org/wiki/Hurricane_Harvey, is used as a validation use case in the course of the project.
Using social data to perform event detection has been considered from two perspectives in the literature. From the one hand, Volunteered Geographical Information explicitly asks users to go out on the field, and capture information linked to the event of interest [15]. This point of view somehow relates to a crowdsourcing campaign. On the other hand, Participatory Sensing views Twitter users as units of a sensor network [7, 10]. Relevant information is then collected passively. The latter perspective is considered in the context of Publimape.
In this paper, we discuss the collection of a corpus associated to tropical storm Harvey, as well as its analysis from both spatial and topical perspectives. From the spatial perspective, our goal here is to get a first estimation of the quality and precision of the geographical information featured in the collected corpus. From a topical perspective, we discuss the representation of Twitter posts, and strategies to process an initially unlabeled corpus of tweets.
In section 2, we first review methodologies and constraints inherent to Twitter content collection in the context of event detection. The design choices for our use case is then described in section 3. We also showcase insights derived from geographical information featured in Twitter content in section 4. Adapted textual representations are discussed in section 5, and their categorization in section 6.
2 Collecting Tweets for Event Detection
Twitter exposes an API that enables the real-time collection of posted messages222https://developer.twitter.com/en/docs/tweets/filter-realtime/overview. It allows to filter the Twitter stream w.r.t. hashtags, keywords, or GPS bounding boxes. It is also possible to obtain a fully random sample of the stream, limited to 1% of the complete stream rate of flow [8]. It is also possible to query content for a past period, but this is a paying feature (i.e. Twitter Enterprise API333https://developer.twitter.com/en/enterprise).
Tweets obtained via one of these APIs are collected as JSON objects, i.e. dictionary objects where fields may be literals (numbers or strings), or themselves dictionary objects, implementing a hierarchical data structure.
Among the root fields of a tweet object (approx. 30), in the context of this paper we will pay special attention to the following fields:
-
•
coordinates: the geotag (i.e. GPS coordinates) of the tweet,
-
•
place.full_name: the place attached to the tweet,
-
•
place.bounding_box: the bounding box of the above-mentioned place (bbox in the remainder of the document),
-
•
user.location: the place featured in the profile of the user that posted the tweet. Specifically, this is a free form text field.
-
•
text: the actual tweet textual content. Whenever the truncated field is true, text is a truncated version, and the full version has to be fetched from extended_tweet.full_text.
Sharing tweet databases is forbidden a priori. However, sharing collections of tweet IDs is allowed, delegating the charge of hydrating them to full objects to the recipient. In the context of non-commercial research projects, it is hence possible to share ID collections of unlimited size444https://developer.twitter.com/en/developer-terms/agreement-and-policy.html.
For collecting tweets in the context of event detection, the usage of keywords has been contrasted to that of geographical bounding boxes [26]. Filtering w.r.t. keywords or hashtags has been commonly used [30], for example in the context of a 2011 earthquake [10]. Spatio-temporal distributions of the filtered results may then be estimated [29, 16].
In [8], the authors claim that collecting according to keywords neglects diffusion effects, i.e. when users copy and paste tweet text without explicitly using the retweet mechanism. Even if experiments in [28] show a moderate impact of this phenomenon, collecting according to a geographical filter completely alleviates this bias [26]. Geographical filters are also used in [14], excluding retweets and non-English language afterwards. Let us note here that the free streaming Twitter API is limited w.r.t. the Entreprise API in that it is impossible to query tweets posted by user having their profile in the Region of Interest (RoI). Only content explicitly tied to the RoI (i.e. coordinates or place fields) is retrieved. Our usage of geographical filters is described in section 3.
Initiatives have recently emerged in favor of persistently sharing tweet collections. Harvard Dataverse555https://dataverse.harvard.edu/ stores such sets as an incentive for reproducible research. Actually, a set of 35M tweet IDs associated to hurricanes Harvey and Irma can be found there [21]. Those were collected using keyword and hashtag filters: it is hence somehow complementary to the corpus introduced in section 3. The former corpus served as basis for a MediaEval task recently [5], where task managers selected a subset of 10K tweets featuring a picture, and had those pictures annotated w.r.t. the presence of a passable or flooded street using the Figure Eight platform666https://www.figure-eight.com.
3 Creation of the Harvey corpus
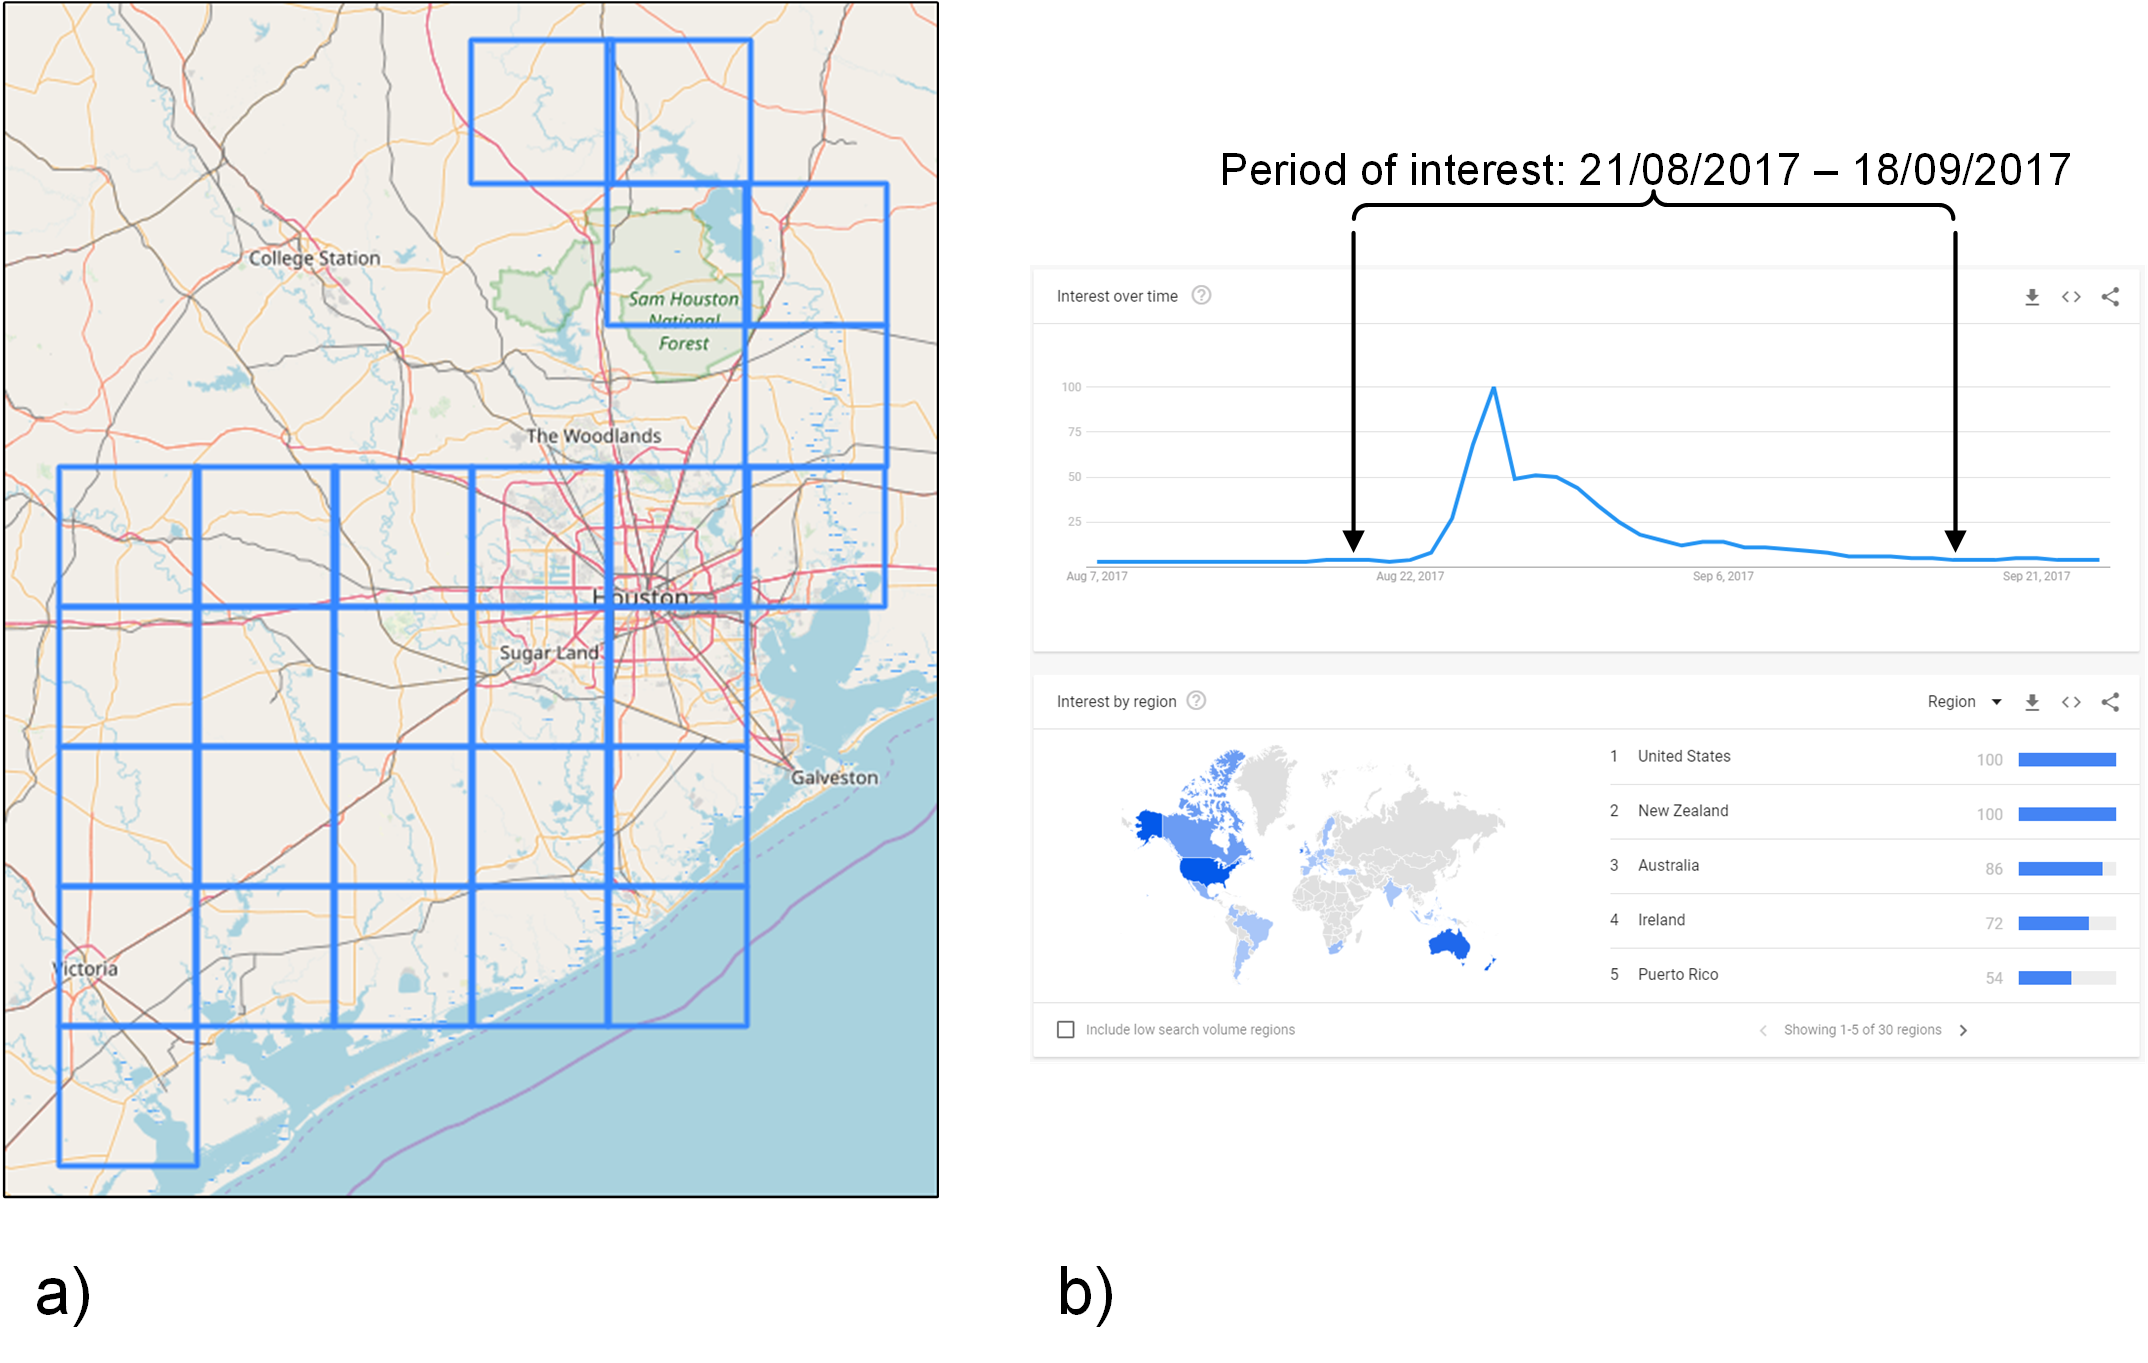
With hydrologist partners in the project, we defined the RoI as indicated in figure 1a, for the period spanning from the 19 of August to the 21 of September. In figure 1b, we see this period is linked to a peak of queries featuring the term harvey.
Using such an ensemble of rectangular bounding boxes is required when using Twitter APIs. Using the Enterprise API, we query tweets with any of coordinates, places, or user.location fields overlapping the RoI, for the period mentioned above. This lead to the collection of 7.5M tweets.
We store this data set as a document collection in a NoSQL database. In order to facilitate further spatial analysis, annotations of these documents are stored in a separate collection. An annotation is made of a tweet ID, and a type (geotag or bbox). For annotations of the geotag type, GPS coordinates are attached directly as a field. We also created a specific place collection, that stores the detailed information for bbox annotations (including the bounding box coordinates themselves). bbox annotations refer to IDs from the place collection as foreign keys.
Tweets obtained via the Enterprise API have an extended user field (user.derived), featuring normalized place names, but no associated bounding boxes, merely the geotag a geographical centroid. As means to encode annotations of bbox type, we used the Nominatim777https://nominatim.openstreetmap.org/ geocoding service to recover the bounding boxes. The risk of false recovery is limited by the fact that derived place names are obtained from Twitter’s own geocoding service. We use the first retrieved bounding box that contains the geographical centroid. We distinguish bounding boxes obtained from user profiles by creating annotations with type pbbox (i.e. profile bounding box). All types considered, we stored approximately 8.3M annotations, referring to 8434 distinct places.
Tweets were collected whether their coordinates, place or user field overlaps the RoI defined in figure 1a. Let us note that tweets posted by a user profile matching the RoI, but with coordinates or place field out of the RoI is unlikely to be relevant for our use case (e.g. Houston inhabitant in vacation in Europe). Thus we post-process the annotation set, by excluding situations highlighted above. This led to exclude approximately 170K annotations and 4700 places, so approx. 2% of annotations and more than 50% of places. These numbers are consistent with the discussion above, and removes noise a priori from the analysis presented in the next section.
4 Geographical analysis of the corpus
One of the objectives of the project introduced in this paper is to map content posted on Twitter with as much spatial precision as possible. We initially assume that geotag fields are exact. They make up for approximately 1% of the annotation collection, as indicated in figure 4, and reported previously in the literature [24].
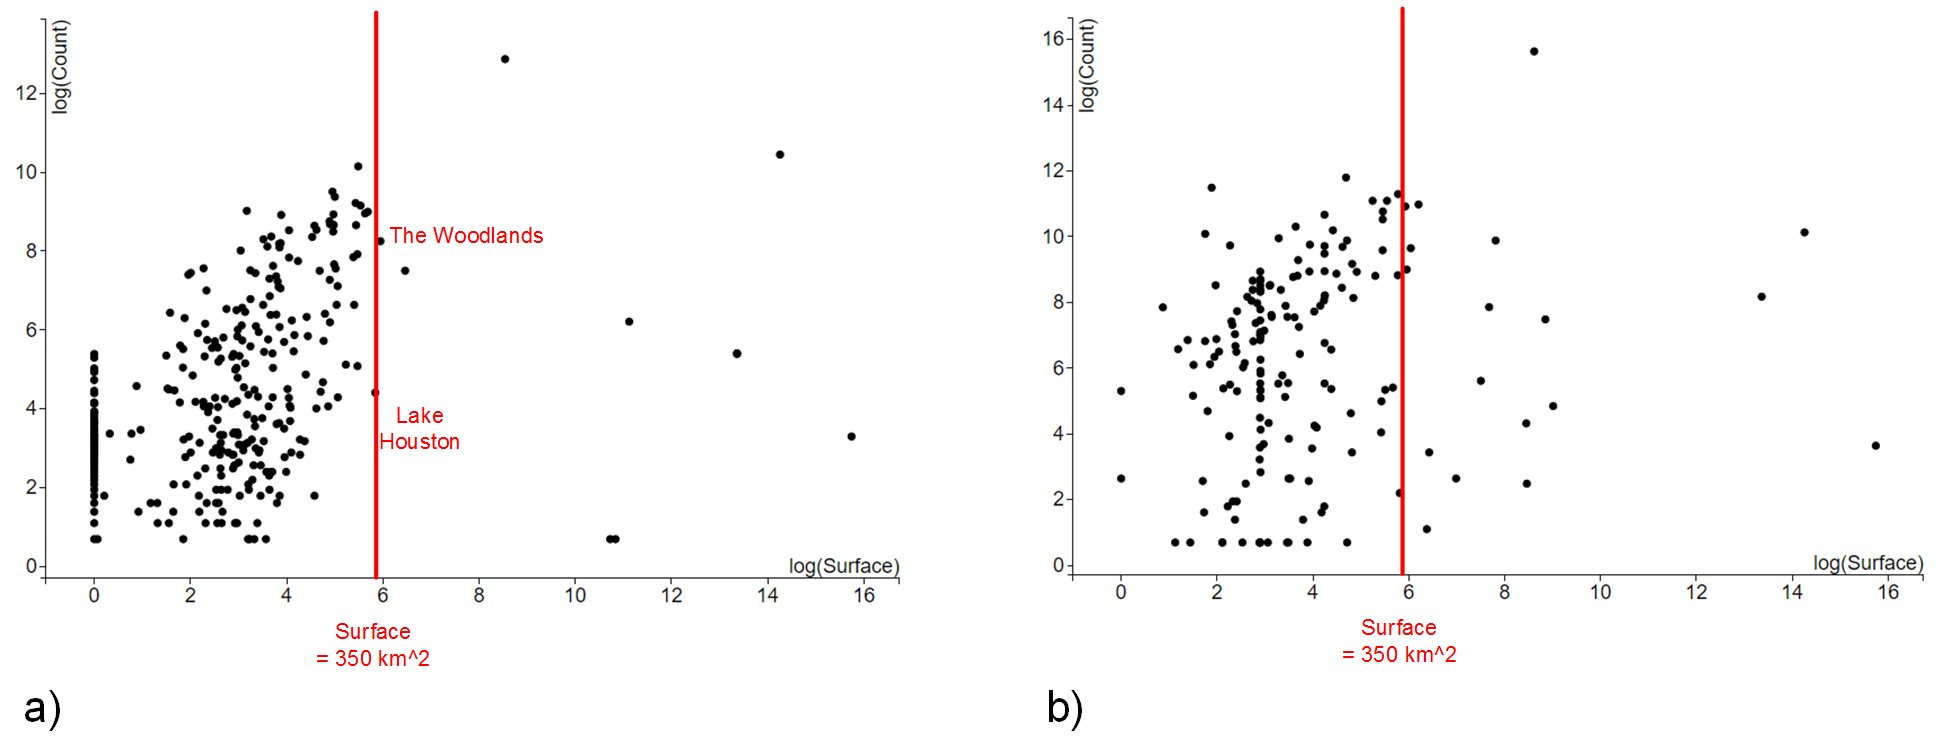
Hence we focus on the surfaces of the places identified in the corpus, specifically on the link between the surface of a bounding box and its frequency in the corpus: is a place with a large surface more frequent? Scatterplots in figure 2 display this link. A log-log scale is used for better legibility, as surfaces and frequencies, taken independently, are both exponentially distributed. Graphics in figure 2 were obtained from an interactive application where hovering over glyphs reveals the place name, its surface and its frequency, as means to facilitate exploration. bbox and pbbox annotations are represented separately.
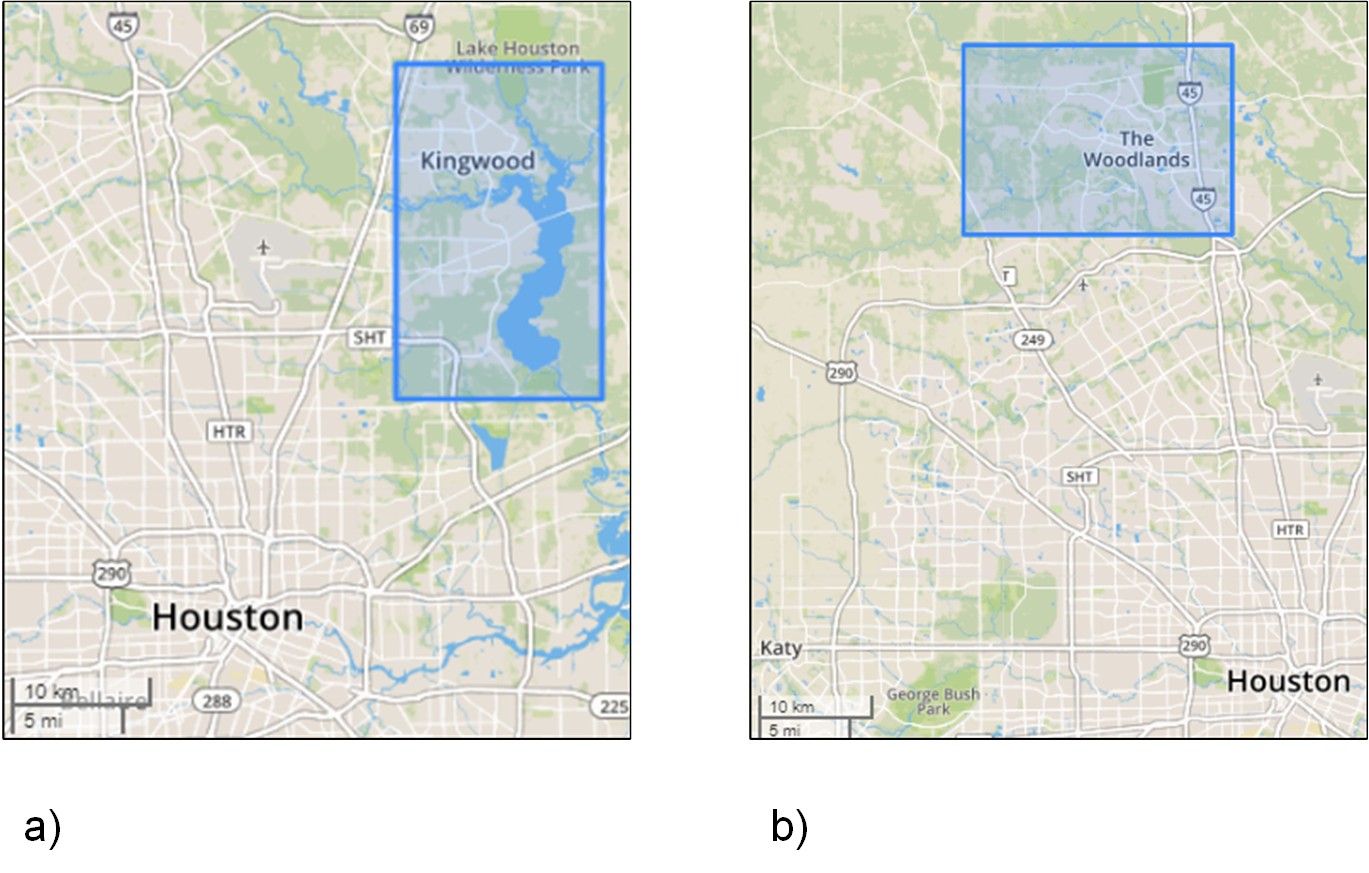
For the bbox case, a significant correlation exists according to Pearson’s and Kendall’s tests (), with an estimation of for the Pearson correlation coefficient. Inspecting figure 2a, we see that highly specific places like Cypress Park High School are mentioned only 3 times, when Houston, TX and Texas, USA appear in respectively 3.9M and 34K tweets. For reliable social mapping, the latter places are not specific enough. In practice, we use figure 2a to establish a specificity threshold beyond which a bounding box is not relevant for the use case of interest. We qualitatively set this threshold to 350 km2, excluding points on the r.h.s. of 2a. This value separates Lake Houston from The Woodlands (see figure 3): this surface range is considerable, practically limiting the risk of excluding useful information from our study.
We transferred this threshold to the pbbox annotations on figure 2b. In the latter case, Pearson and Kendall are small ( in both cases) and weakly significant ( for Pearson’s test). Users often indicate a town as their profile location, which are generally less specific than locations given as examples before. However the chosen threshold retains most of them.
We define sub-categories to bbox and pbbox according to our threshold (s for small and l for large). The cross distribution between annotation types is displayed in figure 4. There we see that only 17.4% of the given geographical information is usable in our applicative context.
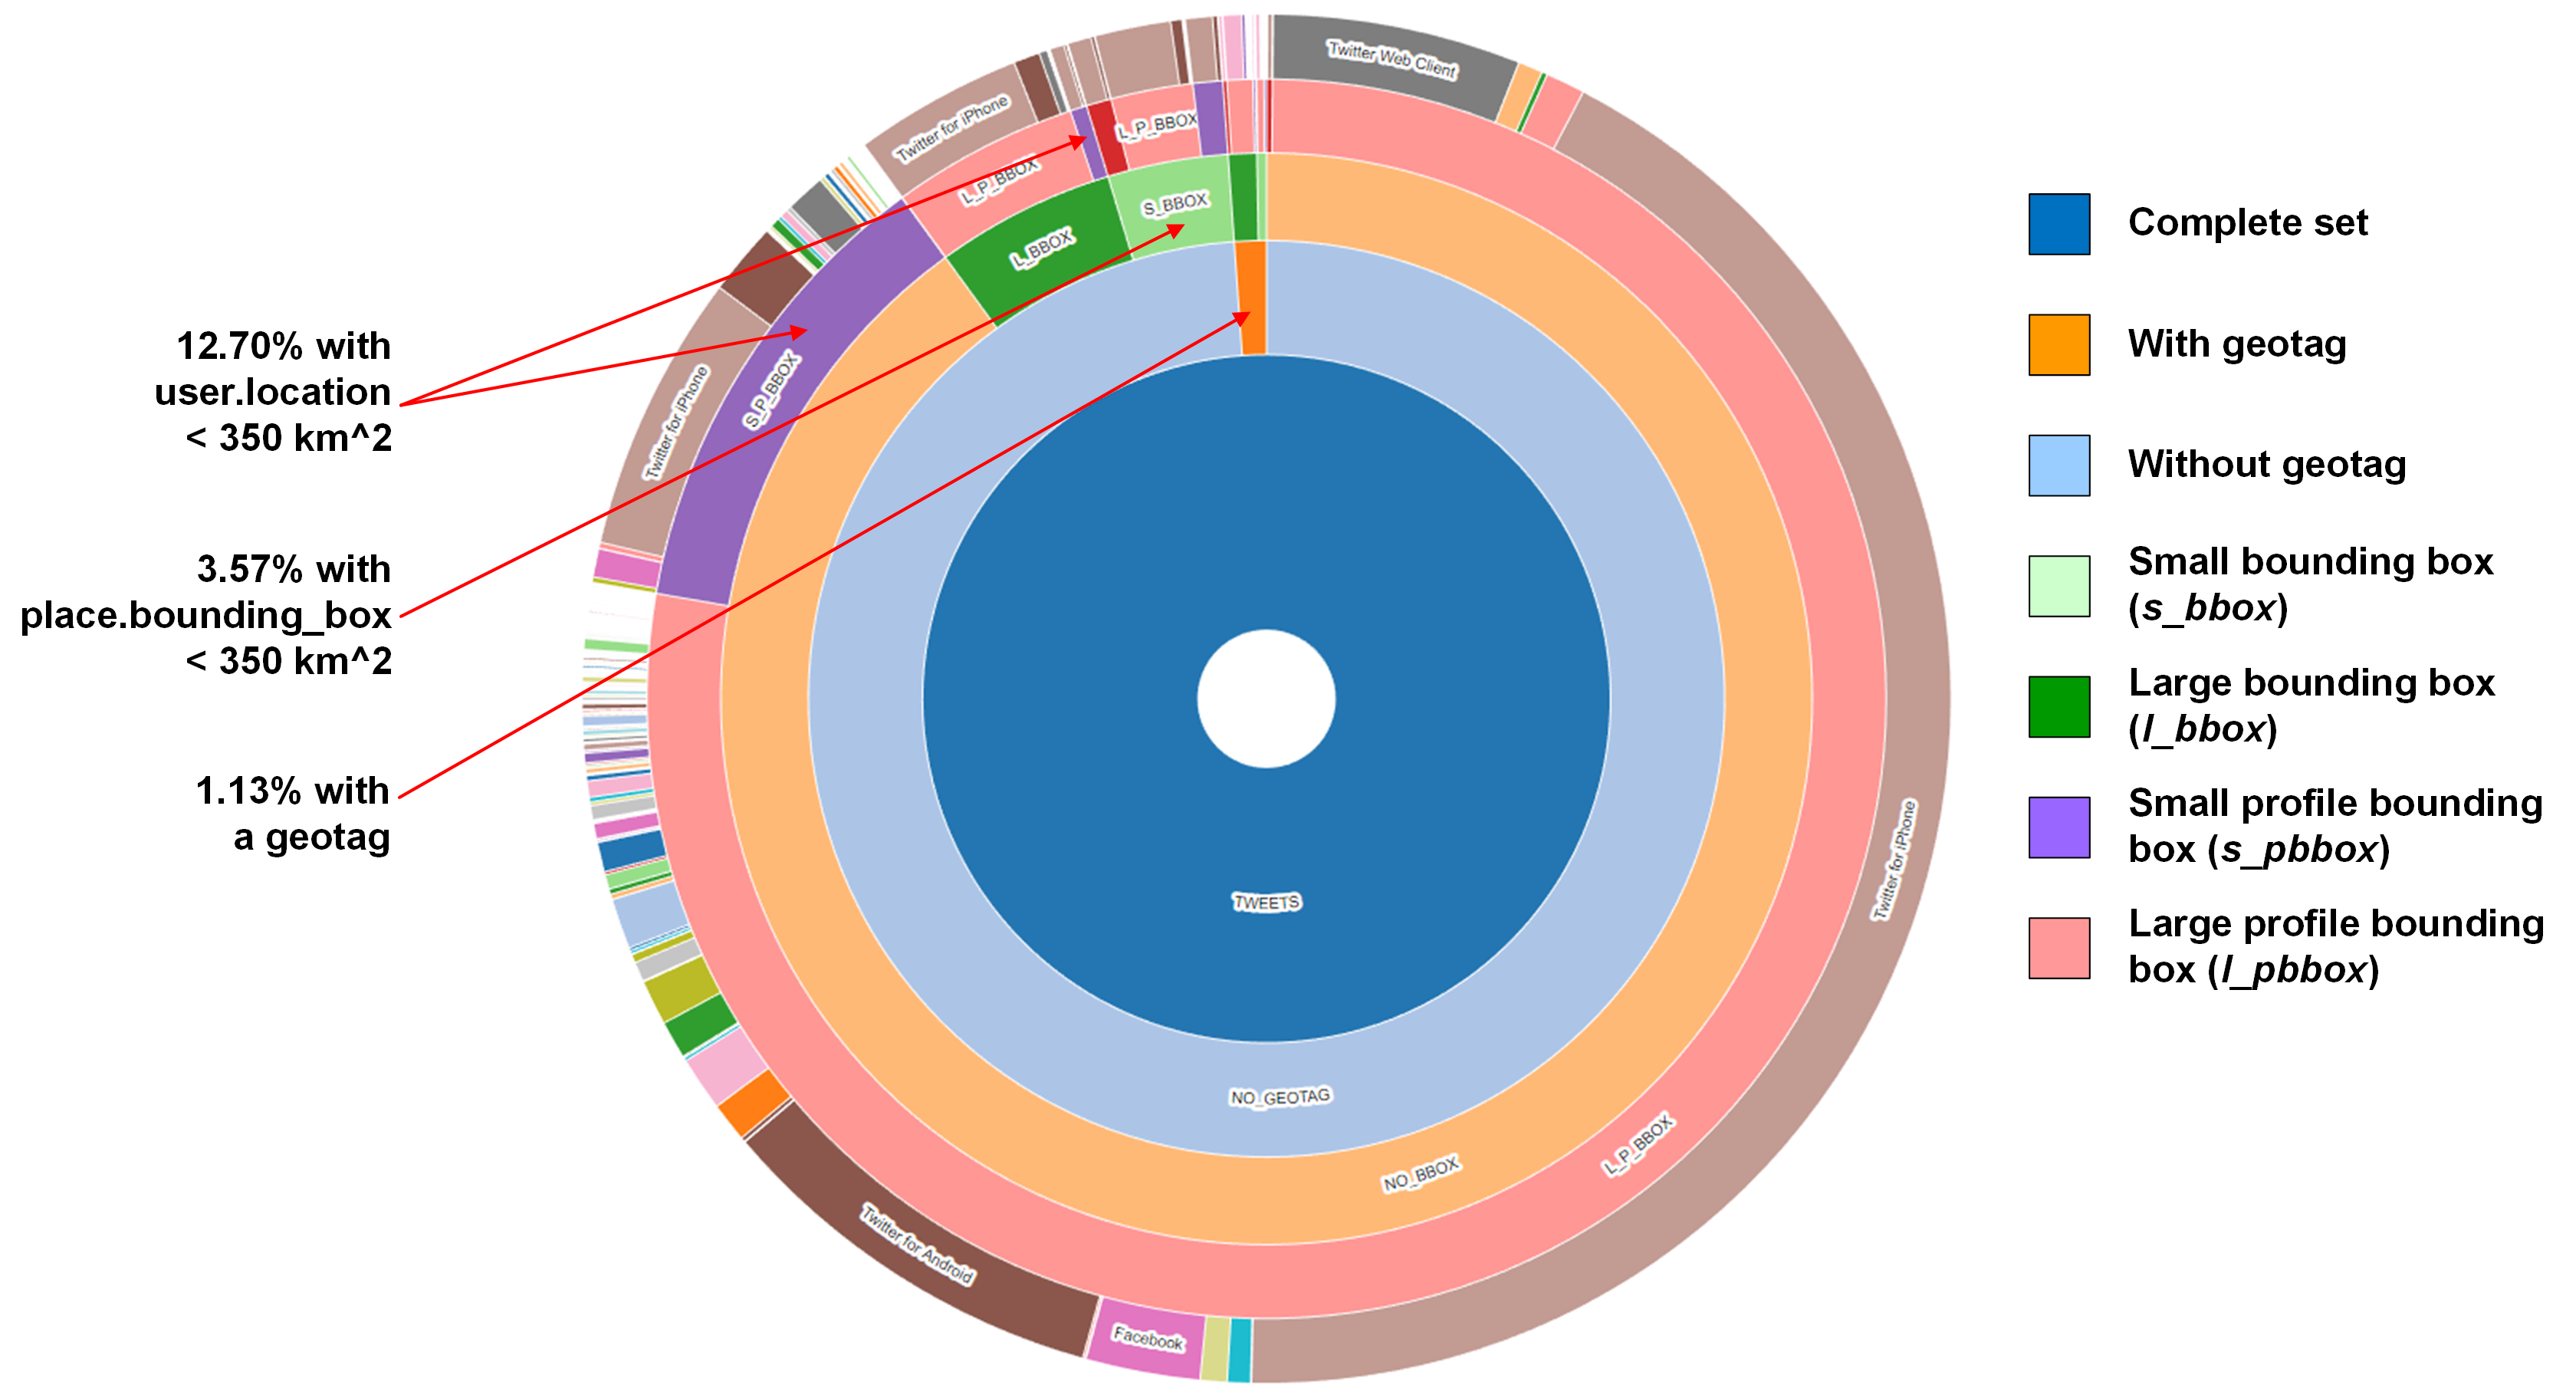
On figure 4, the source field, indicating the originating application of the tweet, is also reported. The vast majority of tweets is emitted from iPhone, Android and web Twitter clients ( for these 3 cumulated categories). Next most popular sources are other social platforms ( for Facebook and for Instagram) and secondary Twitter clients ( for both iPad and TweetDeck). Content posted by bots has minor presence in our corpus: the two first are SocialOomph and IFTTT with each.
Thanks to the interactive version of the view in figure 4, we focus on geographical information relevant to us (i.e. type geotag, and the small sub-types). Instagram is the origin of most tweets annotated by a geotag (). Focusing on geotag annotations also reveals several minority resources relevant for our use case, e.g. meteorological (CWIS Twitter Feed) and traffic (TTN HOU Traffic) reports. However we still have to evaluate the reliability of geotags emitted by such automated resources.
A large majority of annotations in the s_bbox sub-category is sent from official Twitter clients. The latter also make up for 3 quarters of the s_pbbox sub-category. The last quarter gathers less popular clients mentioned above with many minor sources (e.g. most of IFTTT). Hence it is reasonable to first focus on geotag and s_pbbox annotations.
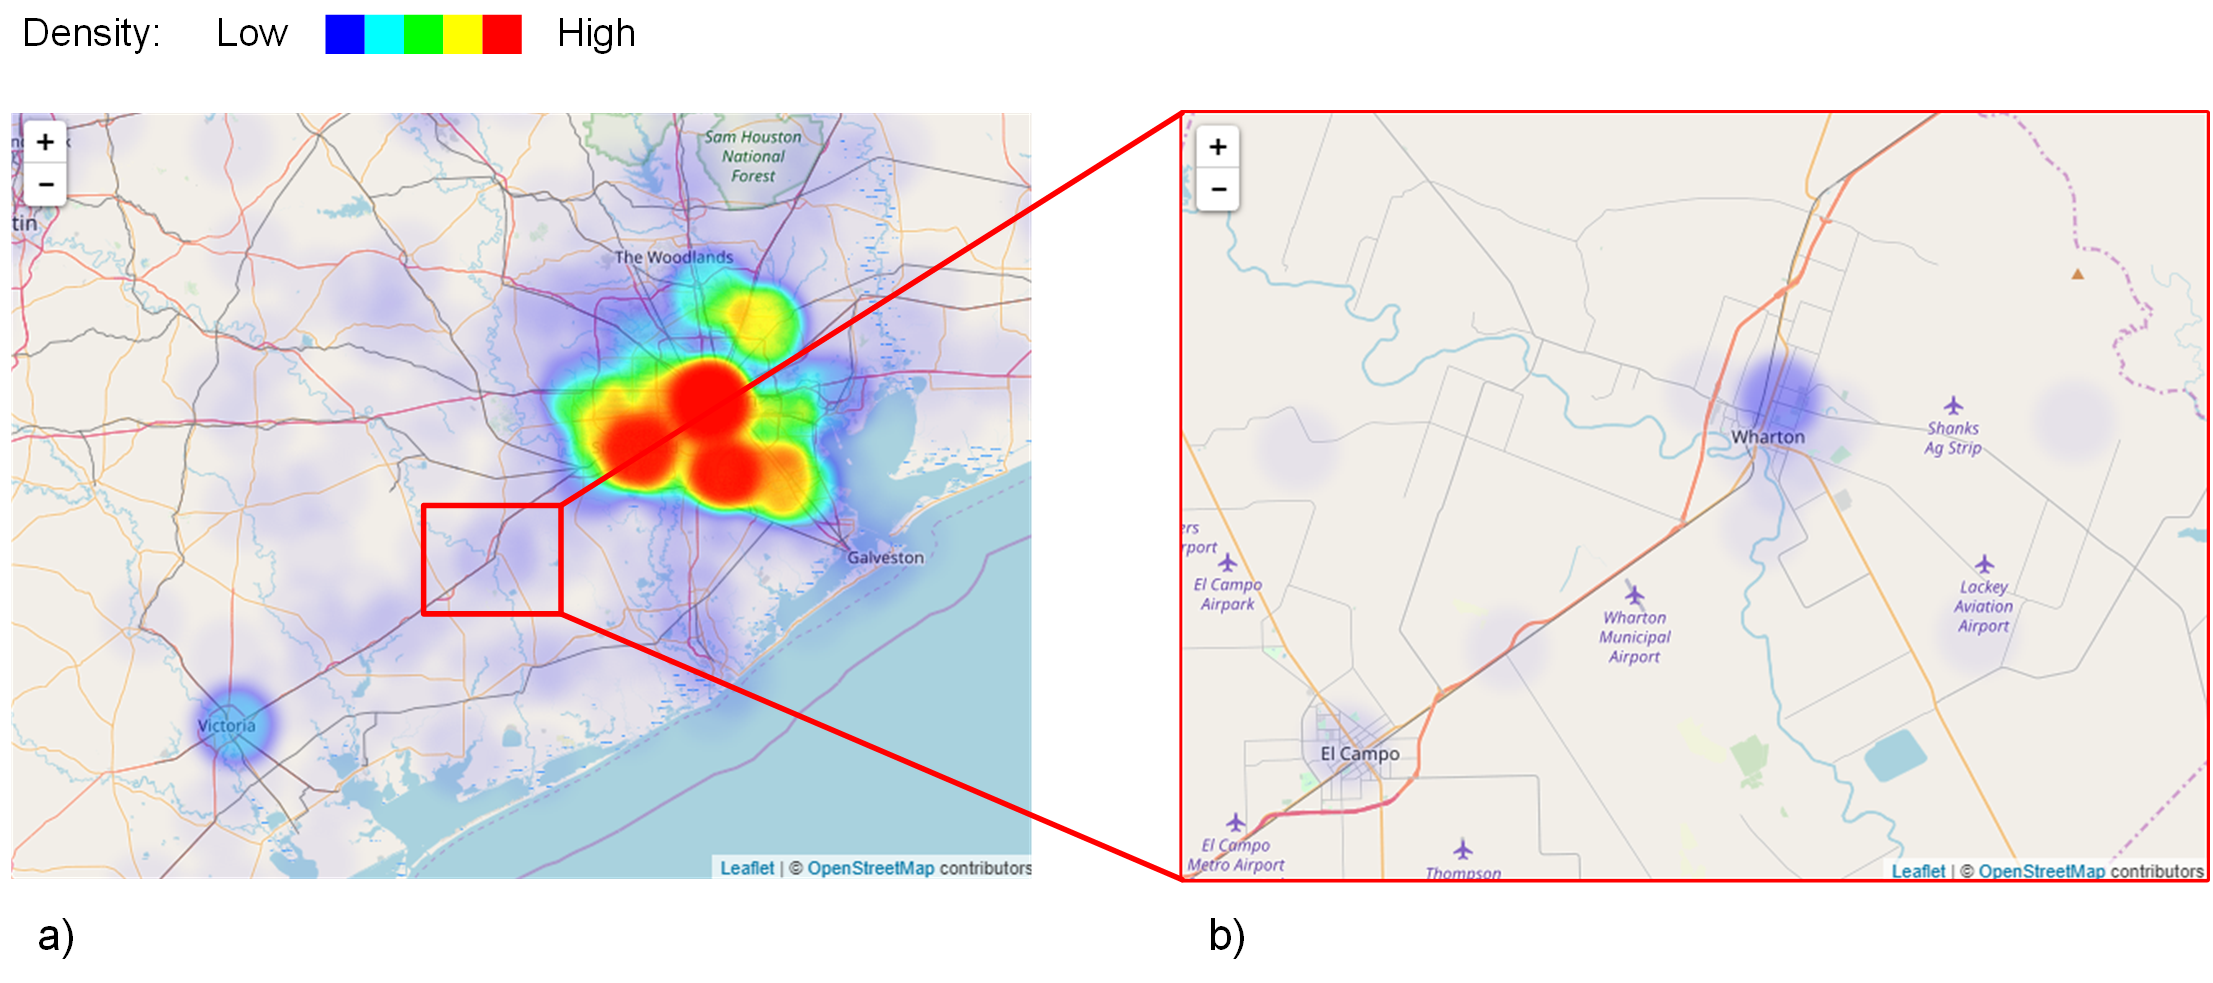
In order to facilitate discussions with hydrologist partners, among the geotag and s_bbox categories, we filtered out tweets featuring flood or harvey in their text. We display the resulting 19K tweets on a density map (see figure 5a). Specifically, hydrologists wanted to evaluate whether it was a priori possible to extract social map information for the Wharthon area. Zooming the map in this region, we identify 81 potentially interesting tweets (see figure 5b). Removing the textual filter yields approximately 3600 tweets instead. This area therefore represent an almost negligible part of our corpus. Intuitively, the tweet density is strongly tied to the population density. However, the retrieved set is small enough to allow a manual inspection, which can be useful for qualitative tests.
5 Textual content
5.1 Representation space
In order to categorize tweet texts, an adequate representation space has to be chosen. In the literature on event detection and sentiment analysis, the usage of chosen keywords is reported [27], as well as classical representations such as Tf-Idf or Bag-of-Words [14, 19, 4]. These methods are based on word frequencies, and work well with structured and curated text (e.g. Wikipedia pages). However, text posted on social networks contain many abbreviations, slang and typos. Pre-processing such text has been suggested in the literature [20], but this may lead to information loss or distortion.
Alternatively, we chose to use Tweet2Vec, a character-based representation space for social media content [12]. The motivation for character-based embeddings is to be more robust to short and informal text than word-based embeddings. This method relies on extracting the final hidden state of a recurrent neural network trained to predict hashtags contained in tweets. Besides open-sourcing an implementation of their model888https://github.com/bdhingra/tweet2vec, the authors also released pre-trained model parameters, taking 2829 characters as potential input (e.g. characters, digits, punctuation, emoticons), and returning 500-dimensional embedding vectors. This pre-trained model was used for our preliminary experiments. We collected our own corpus of similar size by sampling the Twitter stream in English language for future experiments.
5.2 Named entity extraction
Extracting named entities, specifically place names, can be critical for event detection. In case of natural disasters, there is an important amount of tweets mentioning affected tiers [24] (e.g. "My sister flooded Lumberton, Texas. Walmart on 69.. need help she is stranded and the family from Houston can not get to her" in our corpus). In such situation, tweet geotags can be amended by the detected named entities. This detection can be performed by combining named entity detection libraries999https://github.com/ushahidi/geograpy to Open Street Maps-based geocoding systems such as Nominatim101010https://nominatim.openstreetmap.org/.
In the end, as seen in section 4, only a small portion of our corpus can be localized in a satisfactory way in the context of the targetted application. In future work we will also try to benefit from named entities present in tweet texts, e.g. "The Intersection of Asford Pkwy and Dairy Ashford Rd is singificantly higher than yesterday". Such an extraction has been considered in the literature about event detection in Twitter corpora [24]. Other work has exploited tags and laguage geographicity [18], but such approaches would be difficult to transfer to our regional scale a priori.
6 Content classification
6.1 Active Learning Experiments
We define 3 target categories for tweets, already considered in the literature in a similar context [5]:
-
1.
Non Relevant: the text is not related to the flood event
-
2.
Positive Indication: the text is a report by a person directly affected by the flood
-
3.
Negative Indication: the text is a report of a person safe from the flood
Owing to the size of the collected corpus, and the cost of manual work that prevents exhaustive annotations, we consider active learning [11] as means to reduce the corpus annotation cost. We perform initial experiments anyway, with a sample of 421 tweets annotated by hand (316 for training and 105 for test). To favor class balance, we used the flood keyword in our sampling process.
We then assessed how several active learning strategies behaved in the context of our classification task and representation space. These experiments were coded in Python using the libact library [32] that implements the most common strategies. We compared the Uncertainty sampling to Hierarchical Sampling,with a random sampling strategy as a baseline. We monitored the precision of an SVM classifier during the execution of the strategy. The results were not seen as conclusive, as both strategies do not perform better than random. This may be due to the imbalance between the small sample size and the embedding dimensionality, thus calling for a smart way of acquiring labels.
6.2 Crowdsourcing
In order to train a quality classifier, we need to label our corpus as reliably and exhaustively as possible. In this view, we propose to combine active learning to the usage of a crowdsourcing platform such as Mechanical Turk 111111https://www.mturk.com/ or Figure Eight 121212https://www.figure-eight.com/. Our intuition is to use active learning to select the items that will be pushed to the crowdsourcing platform.
Literature shows that crowdsourcing raises reliability issues that need to be addressed [25]. Related work has been made in the context of image concepts annotation [25, 22], social media analysis [23] and named entity identification [13]. For our task, particular attention will have to be put in the way questions are asked to workers, in order to better guide them and limit the risk of errors.
7 Conclusion
The final objective of the project is to aggregate relevant content w.r.t. a 2D spatial grid. Spatio-temporal classification methods were proposed in the literature [16, 1, 31], sometimes accounting for the out of event local tweet emission rate [14] and trending topic detection [2, 9]. The present paper let us quantify the quantity and reliability of geographical information in our corpus. Besides adapting filtering methods mentionned above, we will evalute the improvement yielded by named entity extraction.
Practically, as discussed in section 6, we will explore the potential of active learning and crowdsourcing in order to identify relevant content more finely than using keywords (e.g. as made in section 4), and harness the multimodality of the content under study (i.e. text, GPS coordinates, time, images) while accounting for potential missing values [6].
8 Acknowledgements
This work was performed in the context of the Publimape project, funded by the CORE programme of the Luxembourgish National Research Fund (FNR).
References
- [1] Pramod Anantharam, Payam Barnaghi, Krishnaprasad Thirunarayan, and Amit Sheth. Extracting City Traffic Events from Social Streams. ACM Trans. Intell. Syst. Technol., 6(4):43:1–43:27, 2015.
- [2] Farzindar Atefeh and Wael Khreich. A Survey of Techniques for Event Detection in Twitter. Computational Intelligence, 31(1):132–164, 2015.
- [3] P. Bates and A. De Roo. A simple raster-based model for flood inundation simulation. Journal of hydrology, 236(1-2):54–77, 2000.
- [4] R. Batool, A. Khattak, J. Maqbool, and S. Lee. Precise tweet classification and sentiment analysis. In IEEE/ACIS 12th International Conference on Computer and Information Science, pages 461–466, 2013.
- [5] Benjamin Bischke, Patrick Helber, Zhengyu Zhao, Jens de Bruijn, and Damian Borth. The Multimedia Satellite Task at MediaEval 2018. In MediaEval 2018, page 3, 2018.
- [6] Etienne Brangbour, Pierrick Bruneau, and Stéphane Marchand-Maillet. Extracting Flood Maps from Social Media for Assimilation. In IEEE eScience, 2018.
- [7] J. Burke, D. Estrin, M. Hansen, A. Parker, N. Ramanathan, S. Reddy, and M. Srivastava. Participatory sensing. In ACM WSW, 2006.
- [8] Tao Cheng and Thomas Wicks. Event Detection using Twitter: A Spatio-Temporal Approach. PLOS ONE, 9(6):e97807, 2014.
- [9] Mário Cordeiro and João Gama. Online Social Networks Event Detection: A Survey. In Stefan Michaelis, Nico Piatkowski, and Marco Stolpe, editors, Solving Large Scale Learning Tasks. Challenges and Algorithms: Essays Dedicated to Katharina Morik on the Occasion of Her 60th Birthday, pages 1–41. Springer International Publishing, 2016.
- [10] A. Crooks, A. Croitoru, A. Stefanidis, and J. Radzikowski. #Earthquake: Twitter as a Distributed Sensor System. Transactions in GIS, 17(1):124–147, 2013.
- [11] A. Dawod. Active learning survey.
- [12] B. Dhingra, Z. Zhou, D. Fitzpatrick, M. Muehl, and W. Cohen. Tweet2vec: Character-Based Distributed Representations for Social Media. arXiv:1605.03481 [cs], 2016.
- [13] T. Finin, W. Murnane, A. Karandikar, N. Keller, J. Martineau, and M. Dredze. Annotating named entities in twitter data with crowdsourcing. In NAACL HLT 2010, pages 80–88, 2010.
- [14] Yizhao Gao, Shaowen Wang, Anand Padmanabhan, Junjun Yin, and Guofeng Cao. Mapping spatiotemporal patterns of events using social media: a case study of influenza trends. International Journal of Geographical Information Science, 32(3):425–449, 2018.
- [15] L. Griesbaum, S. Marx, and B. Höfle. Direct local building inundation depth determination in 3-D point clouds generated from user-generated flood images. Natural Hazards and Earth System Sciences, 17(7):1191–1201, 2017.
- [16] Nathaniel E. Helwig, Yizhao Gao, Shaowen Wang, and Ping Ma. Analyzing spatiotemporal trends in social media data via smoothing spline analysis of variance. Spatial Statistics, 14:491–504, 2015.
- [17] R. Hostache, G. Corato, M. Chini, M. Wood, L. Giustarini, and P. Matgen. A new approach for improving flood model predictions based on the sequential assimilation of SAR-derived flood extent maps. In EGU General Assembly Conference Abstracts, volume 17, 2015.
- [18] G. Kordopatis-Zilos, A. Popescu, S. Papadopoulos, and Y. Kompatsiaris. Placing Images with Refined Language Models and Similarity Search with PCA-reduced VGG Features. In MediaEval 2016, page 3, 2016.
- [19] E. Kouloumpis, T. Wilson, and J. Moore. Twitter sentiment analysis: The good the bad and the omg! In AAAI conference on weblogs and social media, 2011.
- [20] Vasileios Lampos and Nello Cristianini. Nowcasting Events from the Social Web with Statistical Learning. ACM Trans. Intell. Syst. Technol., 3(4):72:1–72:22, 2012.
- [21] J. Littman. Hurricanes Harvey and Irma Tweet ids. https://dataverse.harvard.edu/dataset.xhtml?persistentId=doi:10.7910/DVN/QRKIBW, 2017.
- [22] B. Loni, J. Hare, M. Georgescu, M. Riegler, X. Zhu, M. Morchid, R. Dufour, and M. Larson. Getting by with a Little Help from the Crowd: Practical Approaches to Social Image Labeling. In Proceedings of the 2014 International ACM Workshop on Crowdsourcing for Multimedia - CrowdMM ’14, pages 69–74. ACM Press, 2014.
- [23] Boulos M., B. Resch, D. Crowley, J. Breslin, G. Sohn, R. Burtner, W. Pike, E. Jezierski, and K. Chuang. Crowdsourcing, citizen sensing and sensor web technologies for public and environmental health surveillance and crisis management: trends, OGC standards and application examples. International Journal of Health Geographics, 10(1):67, 2011.
- [24] S. E. Middleton, L. Middleton, and S. Modafferi. Real-Time Crisis Mapping of Natural Disasters Using Social Media. IEEE Intelligent Systems, 29(2):9–17, 2014.
- [25] S. Nowak and S. Rüger. How reliable are annotations via crowdsourcing: a study about inter-annotator agreement for multi-label image annotation. In MIR, page 557, 2010.
- [26] O. Ozdikis, H. Oğuztüzün, and P. Karagoz. A survey on location estimation techniques for events detected in Twitter. Knowledge and Information Systems, 52(2):291–339, 2017.
- [27] T. Sakaki, M. Okazaki, and Y. Matsuo. Earthquake shakes twitter users: real-time event detection by social sensors. In Proceedings of the 19th international conference on World wide web, pages 851–860. ACM, 2010.
- [28] T. Sakaki, M. Okazaki, and Y. Matsuo. Tweet Analysis for Real-Time Event Detection and Earthquake Reporting System Development. IEEE Transactions on Knowledge and Data Engineering, 25(4):919–931, 2013.
- [29] B. Sriram, D. Fuhry, E. Demir, H. Ferhatosmanoglu, and M. Demirbas. Short Text Classification in Twitter to Improve Information Filtering. In Proceedings of the 33rd International ACM SIGIR Conference on Research and Development in Information Retrieval, pages 841–842. ACM, 2010.
- [30] K. Starbird, L. Palen, A. Hughes, and S. Vieweg. Chatter on the Red: What Hazards Threat Reveals About the Social Life of Microblogged Information. In Proceedings of the 2010 ACM Conference on Computer Supported Cooperative Work, CSCW ’10, pages 241–250, New York, NY, USA, 2010. ACM.
- [31] K. Tamura and T. Ichimura. Density-Based Spatiotemporal Clustering Algorithm for Extracting Bursty Areas from Georeferenced Documents. In 2013 IEEE International Conference on Systems, Man, and Cybernetics, pages 2079–2084, October 2013.
- [32] Y. Yang, S. Lee, Y. Chung, T. Wu, S. Chen, and H. Lin. libact: Pool-based active learning in python. arXiv preprint arXiv:1710.00379, 2017.