Black Hole Mass Scaling Relations for Early-Type Galaxies: – and –
Abstract
Analyzing a sample of 84 early-type galaxies with directly-measured super-massive black hole masses—nearly doubling the sample size of such galaxies with multi-component decompositions—a symmetric linear regression on the reduced (merger-free) sample of 76 galaxies reveals with a total scatter of 0.52 dex in the direction. However, and importantly, we discover that the ES/S0-type galaxies with disks are offset from the E-type galaxies by more than a factor of ten in their ratio, with ramifications for formation theories, simulations, and some virial factor measurements used to convert AGN virial masses into . Separately, each population follows a steeper relation with slopes of and , respectively. The offset mass ratio is mainly due to the exclusion of the disk mass, with the two populations offset by only a factor of two in their ratio in the – diagram where and dex depending on the sample. For , we detect no significant bend nor offset in either the – or – relations due to barred versus non-barred, or core-Sérsic versus Sérsic, early-type galaxies. For reference, the ensemble of late-type galaxies (which invariably are Sérsic galaxies) follow – and – relations with slopes equal to and , respectively. Finally, we provide some useful conversion coefficients, , accounting for the different stellar mass-to-light ratios used in the literature, and we report the discovery of a local, compact massive spheroid in NGC 5252.
1 Introduction
There is growing evidence suggesting that black holes exist in a continuum of masses, from stellar mass black holes (a few to ; Belczynski et al., 2010; Abbott et al., 2016) to super-massive black holes (; Lynden-Bell, 1969; Wolfe & Burbidge, 1970; Lynden-Bell & Rees, 1971; Natarajan & Treister, 2009; Inayoshi & Haiman, 2016). In between these two mass ranges lie the intermediate-mass black holes (Miller, 2003; Mapelli, 2016; Mezcua, 2017; Graham et al., 2019, and references therein). A galaxy may contain several thousand (Hailey et al., 2018) to millions (Elbert et al., 2018) of stellar mass black holes, but typically only one central Super-Massive Black Hole (SMBH) for which there are many theories (Miller, 2003; Mayer et al., 2007; Hirano et al., 2017; Morganti, 2017).
In order to obtain insight for these theories, for the last three decades, astronomers have been investigating the underlying relations between SMBHs and various properties of the host galaxies (see the review in Graham, 2016, and references therein). Based on Dressler (1989), and various black hole formation scenarios and feedback models, most astronomers have come to envision a fundamental scaling relation existing between the mass of an SMBH and that of the spheroidal stellar component of the host galaxy.
Building on some of the previous estimates of black hole masses, Dressler & Richstone (1988) predicted an upper limit of for the central SMBH mass of the galaxies with the largest spheroids. Their prediction was based on the central black hole mass () and spheroid stellar mass ( or ) ratios in the two neighboring galaxies M31 and M32. Dressler (1989) directly, and Yee (1992) indirectly, suggested a linear relationship between the black hole mass and bulge mass of a galaxy. Kormendy & Richstone (1995) and Magorrian et al. (1998) subsequently observed a linear relation between and .
Using larger samples of galaxies and updated black hole masses, most astronomers continued to report a near-linear – relation for nearly two decades (e.g. Ho, 1999; Ferrarese & Ford, 2005; Graham, 2007b; Gültekin et al., 2009a; Sani et al., 2011). However, during the same period, some astronomers (Laor, 1998; Wandel, 1999) found a steeper relation due to the addition of low-mass galaxies in their datasets. Salucci et al. (2000) reported that spiral galaxies have a steeper slope than massive elliptical galaxies. Further, Laor (2001) reported from his work on an updated sample of 40 quasars.
Graham (2012) observed two different slopes in the – diagram for galaxies with Sérsic or core-Sérsic spheroids (Graham et al., 2003). He found a near-linear relation for the massive core-Sérsic galaxies (all of which were early-type galaxies), and a “super-quadratic”111The phrase “super-quadratic” was used to describe a power-law with a slope greater than 2 but not as steep as 3. relation for the low-mass Sérsic galaxies (most of which were late-type galaxies). Further, Graham & Scott (2013) and Scott et al. (2013), with their work on a bigger sample of galaxies, recovered this bent relation and Graham & Scott (2015) showed that the so-called pseudobulges (Gadotti & Kauffmann, 2009a; Kormendy et al., 2011) also complied with the non-linear (super-quadratic) arm of the bent relation. The bent relation strongly suggested the need to re-visit various theories and implications based on the previously assumed linear relation. For example, if there is evolution along the – relation, then the steeper relation reveals that the fractional growth of a black hole’s mass is faster than that of low-mass spheroids (Sérsic galaxies), consistent with many other works (e.g. Diamond-Stanic & Rieke, 2012; Seymour et al., 2012; LaMassa et al., 2013; Drouart et al., 2014).
These scaling relations will help us understand the rate at which the black hole mass grows relative to the star formation rate in the host galaxy, which further aids formation and evolution theories of black holes and the galaxies which encase them (e.g. Shankar et al., 2009). It also provides insight into the understanding of AGN feedback models between an SMBH and its host galaxy (e.g. Hopkins et al., 2006). In the past, some simulations have reported steeper (at the low-mass end) and bent – relations (Cirasuolo et al., 2005; Fontanot et al., 2006; Dubois et al., 2012; Khandai et al., 2012; Bonoli et al., 2014; Neistein & Netzer, 2014; Anglés-Alcázar et al., 2017), which partly supports our findings.
Gadotti & Kauffmann (2009b) reported discrepancies between the black hole mass estimated from the – relation and the single linear – relation for all type of (elliptical, lenticular and spiral) galaxies. There are in fact many influential works which have based their predictions on a single linear – relation, for all type of galaxies (Fabian, 1999; Wyithe & Loeb, 2003; Marconi et al., 2004; Springel et al., 2005; Begelman & Nath, 2005; Croton et al., 2006; Di Matteo et al., 2008; Natarajan & Volonteri, 2012). This can affect the inferred science; hence, we recommend that these simulations be revisited using the new scaling relations.
Numerous investigations of the – relation were based on the belief that there is a large possibility of black hole mass correlating better with its host bulge stellar mass, rather than with its host galaxy (or total) stellar mass, reflected by the smaller scatter in the – relation. However, Läsker et al. (2014)222Läsker et al. (2014) had only 4 late-type galaxies in their sample with their (early-type galaxy)-dominated sample of 35 galaxies claimed that black hole mass correlates with total galaxy luminosity equally well as it does with the bulge luminosity. Additionally, there have been several detections of bulge-less galaxies which harbor massive black holes at their center (e.g. Reines et al., 2011; Secrest et al., 2012; Schramm et al., 2013; Simmons et al., 2013; Satyapal et al., 2014). This suggests the possibility of the black hole mass correlating directly with the galaxy mass (), whether this be the stellar, baryonic, or total mass (Ferrarese, 2002; Baes et al., 2003; Sabra et al., 2015; Davis et al., 2018a).
The recent work by Savorgnan et al. (2016) used a larger sample of 66 galaxies—consisting of 47 early-type galaxies (ETGs) and 19 late-type galaxies (LTGs)—and reported that black hole mass correlates equally well with bulge luminosity and total galaxy luminosity only for ETGs, not for LTGs (see their Figures 1 and 2). They also suggested a different idea for the bend in the – relation that was not detected by Läsker et al. (2014). For the core-Sérsic and Sérsic galaxies in Savorgnan et al. (2016), they found and , respectively. These slopes for the two populations have overlapping uncertainties (within the level) and unlike in Scott et al. (2013), which estimated the bulge masses using a morphologically-dependent bulge-to-total ratio for 75 late-type and early-type galaxies, there was no clear bend. Furthermore, Savorgnan et al. (2016) found different trends for their early-type and late-type galaxies, which they referred to as a “red sequence” and a “blue sequence”, respectively, although color information was not shown in that diagram.
Our work on the hitherto largest dataset of 84 early-type galaxies, with directly-measured black hole masses, builds on Savorgnan & Graham (2016a) and nearly doubles their number of ETGs with multi-component decompositions. ETGs consist of ellipticals (E), elliculars333ETGs with intermediate stellar disks (Liller, 1966; Graham et al., 2016a) (ES), and lenticulars (S0), where the latter two types have disks. Ellicular and lenticular galaxies often contain bars, bar-lenses, inner disks, rings, and ansae in addition to the bulge and disk. ETGs are often misclassified, as many catalogs, e.g., Third Reference Catalogue of Bright Galaxies (RC3), de Vaucouleurs et al. (1991), failed to identify disks from a visual inspection of the images. For our set of ETGs, we perform multi-component decompositions to identify disks, and bars, and separate the bulge luminosity from the total galaxy luminosity. We intend to refine how the black hole mass correlates with its host spheroid stellar mass, and determine how it correlates with the host galaxy stellar mass. We investigate whether or not the core-Sérsic and Sérsic galaxies cause the bend in – relation. Also, we combine our work on ETGs with the study of LTGs by Davis et al. (2019, 2018a) to further explore the reason behind the bend in the – relation. We additionally explore the possibility of different – relations depending on the ETG sub-morphology, i.e., for galaxies with and without a disk, and galaxies with and without a bar. In all the cases, we also investigate the prospect of a better or equally likely correlation of black hole mass with total galaxy stellar mass.
In the following Sections, we describe our imaging dataset and primary data reduction techniques. Section 3 illustrates the galaxy modeling and multi-component decomposition of the galaxy light. This section also presents a detailed discussion of the stellar mass-to-light ratios that we applied to the luminosity to determine the stellar masses. We compare the masses of the galaxies calculated using different (color-dependent) stellar mass-to-light ratios, and we provide a conversion coefficient which can be applied to bring them into agreement with alternate prescriptions for the mass-to-light ratio. In Section 4, we present the black hole scaling relations for our ETG sample, along with an extensive discussion of the nature of the – and – relations for various cases: Sérsic and core-Sérsic galaxies; galaxies with and without a disk; galaxies with and without a bar; and ETGs versus LTGs. Finally, in Section 5, we summarize our work and present the main implications. Henceforth, we will be using the terms spheroid and bulge of a galaxy interchangeably.
2 Imaging Data
We have compiled an exhaustive sample of all 84 ETGs currently with a directly measured SMBH mass. We use the black hole masses measured from direct methods, i.e., modeling of stellar and gas dynamics. Gas-dynamical modeling is fundamentally simpler, as gases being viscous, easily settle down and rotate in a circular disk-like structure, while stellar dynamical modeling is complex and computationally expensive (Walsh et al., 2013). Although both have their pros and cons, we prefer to use the black hole masses measured from stellar dynamics, as stars are influenced only by gravitational forces, while gas dynamics are more prone to non-gravitational forces. In order to know more about the above primary methods of black hole mass measurement, readers are directed to the review by Ferrarese & Ford (2005).
Out of a total of 84 ETGs, we obtain SMBH masses, distances, and light profile component parameters for 40 galaxies from Savorgnan & Graham (2016a). For NGC 1271 and NGC 1277, we directly used the SMBH masses, and the bulge and total galaxy stellar masses, from the work on their H- and V- band Hubble Space Telescope (HST) Images retrieved and reduced by Graham et al. (2016a) and Graham et al. (2016b), respectively. The remaining 42 galaxies were modeled by us, which also includes seven galaxies (A3565 BCG, NGC 524, NGC 2787, NGC 1374, NGC 4026, NGC 5845, and NGC 7052) from the dataset of Savorgnan & Graham (2016a) that we remodeled. About 80% of the galaxy images used in this work are Spitzer Space Telescope (SST) m images, taken with the Infra-Red Array Camera (IRAC). The remaining few images are Sloan Digital Sky Survey (SDSS, York et al., 2000) -band images and Two Micron All Sky Survey (2MASS, Jarrett et al., 2003) -band images.
2.1 Image Sources
IRAC m images (IRAC1) are unaffected by dust absorption, have large fields-of-view, and are sufficiently spatially resolved to enable us to visually identify the primary galaxy components, thereby increasing the accuracy of disassembling galaxy images. Hence, for our analysis, we preferred to use IRAC m images. However, for some galaxies whose Spitzer images are not available, we used images from the SDSS archive and 2MASS catalog.
The 42 galaxy images (including seven remodeled) that we modeled were comprised of 33 images in the m band, out of which five images are downloaded from the Spitzer Survey of Stellar Structure in Galaxies (: Sheth et al., 2010; Muñoz-Mateos et al., 2013; Querejeta et al., 2015) pipeline-1, and 28 images are obtained from the Spitzer Heritage Archive (SHA: Levine et al., 2009; Wu et al., 2010; Capak et al., 2013). Of the remaining 9 galaxies, six -band images are obtained from 2MASS (Jarrett et al., 2003) and three -band images are from the SDSS Data Release-8 (Aihara et al., 2011).
Images from the pipeline-1 (P1)444http://irsa.ipac.caltech.edu/data/SPITZER/S4G/docs/pipelines_readme.html are science-ready, calibrated images formed by mosaicking individual Basic Calibrated Data (BCD) frames. The survey is limited to galaxies with a maximum distance of 40 Mpc, brighter than a B-band apparent magnitude of 15.5 mag, and a size limit (Sheth et al., 2010). Hence, we obtained m images of galaxies not fitting this criteria from SHA, which are level-2, post-Basic Calibrated Data (pBCD)555https://irsa.ipac.caltech.edu/data/SPITZER/docs/dataanalysistools/cookbook/6/ images. The pBCD images are a mosaicked form of level-1 corrected Basic Calibrated Data (cBCD) frames. Level-1 cBCD frames have already undergone dark current subtraction, flat-field correction, various instrument artifact corrections, and flux calibration.
The -band images of three galaxies (NGC 6086, NGC 307, NGC 4486B) from the SDSS catalog are also basic corrected and calibrated. Although optical-band images suffer from dust extinction, we justify our choice of SDSS images, as they have a large field-of-view and sufficient resolution to help us identify galaxy components. For the remaining six galaxies (A1836 BCG, MRK 1216, NGC 1550, NGC 4751, NGC 5328, NGC 5516,), we used flux calibrated666https://www.ipac.caltech.edu/2mass/releases/allsky/doc/sec4_1.html, https://www.ipac.caltech.edu/2mass/releases/allsky/doc/sec4_2.html -band images from the 2MASS catalog.
About of the images in our total galaxy sample of 84 are in either the m (roughly L-band) or the m (-band), which helps us obtain a more reliable distribution and measurement of luminosity and stellar mass, due in part to a stable stellar mass-to-light ratio in these bands (described in Section 3.3). Table 1 lists the flux calibration zero points, image pixel scale, stellar mass-to-light ratios used in this work, and solar absolute magnitude in different image pass-bands.
| Image Source | Zero-Point | Pixel Scale | ||
|---|---|---|---|---|
| ( magaaAB magnitude system. ) | ( ″) | mag | ||
| S4G | 21.097bbSalo et al. (2015, their Equation-13). | 0.75 | 0.6ffTaken from Meidt et al. (2014) for m band. | 6.02 |
| SHA | 21.581ccMuñoz-Mateos et al. (2016, their Equation-1). | 0.6 | 0.6ffTaken from Meidt et al. (2014) for m band. | 6.02 |
| 2MASS | Image specificddZero-points specified in image headers were converted from Vega magnitude to AB magnitude using equation (5) from Blanton et al. (2005). | 1 | 0.7ggUsing in the equation from Oh et al. (2008). | 5.08 |
| SDSS | 22.5ee Blanton et al. (2005, their Equation-4). | 0.4 | 2.8hhCalibrated using with . | 4.65 |
Note. — Columns: (1) Image Source. (2) Photo-metric zero-points of images in AB magnitude. (3) Pixel size of images. (4) Stellar mass-to-light ratios used to convert measured luminosities into stellar masses. (5) Absolute magnitude of sun in AB magnitude system.
2.2 Image Reduction and Analysis
All the images obtained from the various telescope pipelines described above have already undergone dark current subtraction, flat fielding, bad pixel and cosmic ray correction, sky-subtraction (except for and 2MASS images), and flux calibration. The automated routines in the telescope pipelines either over or under-estimated the sky-background intensity, which we observed for most of our galaxies. Hence, we started our image analysis by measuring the sky-background intensities, then generating the image masks and calculating the telescope’s point spread function.
2.2.1 Sky Backgrounds
Sky-background level subtraction is one of the crucial steps to measure a galaxy’s luminosity accurately. As our target galaxy images are extended over a large number of pixels in the CCD images that we are using, an error in sky background intensity subtraction will lead to a systematic error in the surface brightness profile, especially at the larger radii and result in an erroneous measurement of the galaxy component at large radii, and in turn the inner components and the galaxy luminosity. The wide-field images that we obtained from the SHA and SDSS pipelines have already undergone sky subtraction, but as we analyzed the intensity distribution of the images, we found that the peak of the sky-background level was offset from zero for almost all of the images. Hence, it was necessary to calculate the correction in order to tune the sky level of these images to zero.
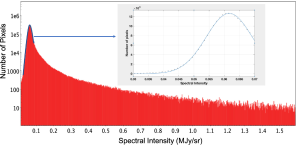
To calculate the sky-background intensity level, we follow a similar procedure as explained in Almoznino et al. (1993). The intensity distribution of the sky-background photons incident on a CCD image ideally follows a Poisson distribution when the only source of systematic error is random emission from the radiating object, in this case, the “sky-background”. However, many other systematic errors are introduced in a CCD image when it undergoes telescope pipelining. In that case, a Gaussian distribution (normal distribution) can be a better approximation for the intensity distribution of the “sky-background”. We constructed the intensity function (pixel number of given intensity versus intensity histogram) of the entire image frame (not just a few portions of the sky that appear free of sources) and fit a Gaussian to the portion of the histogram dominated by the sky (the peak at lower-intensity values), as shown in Figure 1. Intensity values of the pixels occupied by other radiating sources, including our target galaxy, produce the long tail towards higher intensities. The Gaussian fit gives us an optimally accurate mean sky value and the standard deviation (rms error) in any one pixel.
2.2.2 Masking
Images for our galaxy sample have large fields-of-view. Apart from our target galaxy, these images also contain other radiating sources around and overlapping with the target galaxy. Major contaminating sources are background quasars and foreground stars that overlap the pixel area occupied by the galaxy of interest. Hence, for an accurate measurement of the galaxy luminosity, we eliminate the contribution of these contaminating sources by generating a mask file. A mask is either a .fits or .pl file marking (with their pixel coordinates and pixel size) the areas and sources to be discarded during the analysis.
We used the task mskregions in the Image Reduction and Analysis Facility (IRAF) software to read a list of user-specified regions to be masked in our image. The task then generates a mask file (.pl or .fits file) using our galaxy image as a reference for the size of the mask file. The list of contaminating objects and subsequent masks are generated in two parts by us:
-
1.
Source Extractor (Bertin & Arnouts, 1996): It uses a threshold background value to automatically identify all the objects present in an image and makes a catalog of them, designating each object by its physical coordinates in the image. We can identify and remove our target galaxy from this list (knowing its physical coordinates) and generate a mask file using this catalog using the task mskregions.
-
2.
Manual masking: Source-Extractor cannot identify the background and foreground objects overlapping with the pixel area of our target galaxy. However, it is important to mask them in order to avoid biasing the image decomposition; therefore, we need to mask them manually. We carefully find the overlapping sources by observing our galaxy at different brightness (contrast) levels. For this purpose, we use the astronomical imaging and data visualization application SAOImage DS9. We generate the second mask file of contaminating objects with the mskregion task.
We combine the above two mask files using the imarith task in IRAF and further use the final mask as a reference for avoiding the contaminated pixels during extraction and modeling of the target galaxy light. Extra care was taken to manually mask dust in the three SDSS -band images.
2.2.3 PSF determination
The spatial resolution of an image is limited by the telescope’s aperture size, the wavelength of observation, the pixel size of its instrument, and the atmospheric blurring for ground-based observations. A distant star is a point source, whose light profile is ideally described by a delta function, but due to the collective resolution limitations, it is imaged as an extended object, and its light profile becomes a function with a non-zero width. Hence, the Full Width at Half Maximum (FWHM) of the light profile of a star in an image is a measure of the total seeing effect, which is quantified by the Point Spread Function (PSF) of the telescope.
The image of an object obtained by a telescope can be mathematically described as a convolution of its actual profile with the telescope’s PSF. Hence, in order to measure the parameters of the actual light (or surface brightness) profile of a galaxy and its components, we need our fitting functions to be convolved with the telescope’s PSF.
Moffat (1969) describes how the wings of the seeing profile (PSF) of a telescope is represented better by a Moffat function rather than a Gaussian function. A “Moffat function” has the mathematical form
| (1) |
where is the width parameter and controls the spread in the wings of the seeing profile (see Figure 3 in Moffat, 1969). The parameters and are related to the FWHM of the profile through the equation FWHM . The value of and increases with poor seeing (e.g., higher atmospheric turbulence) and gradually, the profile that they describe approaches a Gaussian. We used the IRAF task imexamine to determine the PSF of our images. The imexamine task fits the radial profile of selected stars with a Moffat function and provides the required parameters: FWHM and .
3 Modeling and decomposing the galaxy light
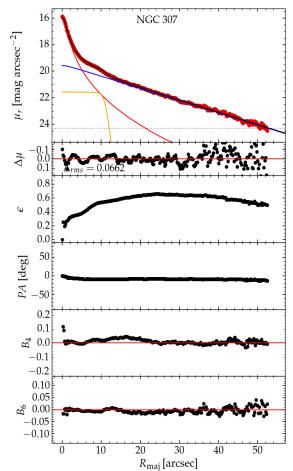
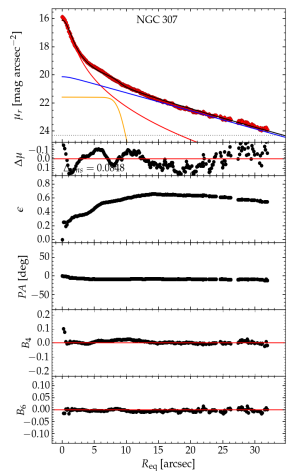
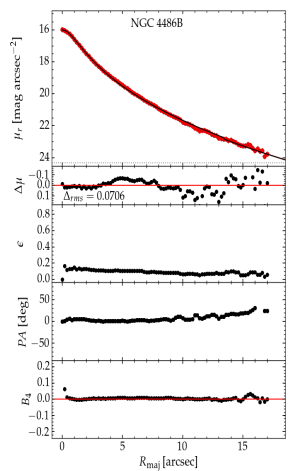
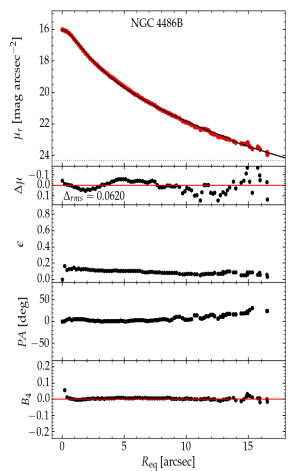
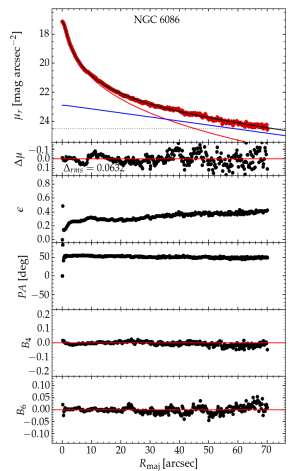
The luminosity of a galaxy is modeled by fitting quasi-elliptical isophotes777A curve which connects the points of equal brightness at each radius along the semi-major axis (). Ciambur (2016), in his introduction section, and Savorgnan & Graham (2016a), in their Section 4.1, employ both 1D (one-dimensional) and 2D (two-dimensional) modeling and provide a critical comparison of the two techniques. Savorgnan & Graham (2016a) had more success modeling the galaxies as a set of 1D profiles; hence we also prefer to use 1D profile modeling, which takes into account the radial variation in all of the isophotal parameters such as ellipticity (), position angle (PA), and the irregularity in an isophote’s shape across the whole azimuthal range as quantified using Fourier harmonic coefficients. Therefore, 1D modeling should not be confused with the light profile obtained only from a one-dimensional cut of a galaxy image.
Early-type galaxies are commonly ill-considered to be featureless (no sub-components) and are expected to have regular elliptical isophotes, a scenario which is only valid for purely elliptical galaxies. Early-type galaxies can be morphologically sub-classified as ellipticals (E) consisting of an extended spheroid, elliculars (ES) consisting of an extended spheroid with an intermediate-scale disk (e.g., Graham et al., 2016a), and lenticulars (S0) comprised of a spheroid and an extended large-scale disk. Apart from these standard components, ETGs may also contain nuclear disks, inner rings, bars, bar-lenses (Sandage, 1961; Laurikainen et al., 2009; Saha et al., 2018), outer rings, and ansae (Saha et al., 2018; Martinez-Valpuesta et al., 2007), which can cause non-elliptical or irregular isophotes in a galaxy.
3.1 One-dimensional Representation of the Galaxy Light
We use the new IRAF tasks Isofit and Cmodel (Ciambur, 2015a) to extract the 1D light profile and associated parameter profiles (e.g., ellipticity, PA, etc.), and create a 2D model of each galaxy. Isofit and Cmodel are upgraded versions of the IRAF tasks Ellipse and Bmodel (Jedrzejewski, 1987a, b), respectively.
In order to extract a galaxy light profile, Isofit reads a 2D image of a galaxy, the associated mask file, and fits quasi-elliptical isophotes at each radius of the galaxy, starting from its photometric center to its apparent edge, thus including every part of the galaxy. Further, Isofit uniformly samples each isophote across the whole azimuthal range, using a natural angular coordinate for ellipses, known as the “Eccentric Anomaly” (, for more details see Section 3 of Ciambur, 2015b), and provides average intensity and associated parameters of the isophotes as a function of semi-major axis radii. The isophotal intensity can be expressed in terms of the average intensity and Fourier perturbations such that
| (2) |
where, and are nth order Fourier harmonic coefficients.
As explained by Ciambur (2015b), while fitting each isophote, Isofit calculates and , these Fourier coefficients when added together, account for the irregular isophotal shapes and give a near-perfect fit. Ciambur (2015b) also mentions that the value of and decreases with increasing order (n); therefore, we calculate a sufficient number of even harmonic coefficients, up to a maximum of . Apart from the harmonic, odd-ordered Fourier harmonic coefficients (etc.) appear to provide almost no refinement in an isophote’s shape; thus we can obtain a very good light profile and galaxy model, without them. Also, for the light profile along the major axis (), the sine terms are zero; hence we corrected our major-axis intensity values only for the cosine perturbations ().
The original Ellipse task is limited to only work well for face-on galaxies with almost purely elliptical isophotes (with few or no additional components), as it does not properly utilize the higher-order harmonics to fit and quantify irregularities in the isophotal shapes. Figure 2 provides a comparison of models obtained for NGC 4762 using the Ellipse and Isofit tasks.
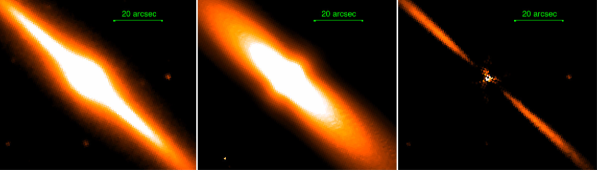
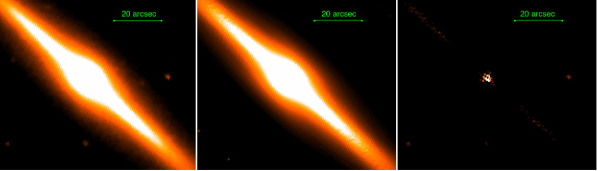
Various isophotal parameters (, PA, and ) obtained from the Isofit task, are sufficient to generate an excellent 2D model of a galaxy using the Cmodel task. The galaxy model can be further subtracted from the galaxy image to obtain a residual image, which is useful to study various foreground and background sources overlapping with the galaxy pixels. The quality of the residual image depends on how accurately the isophotal model emulates the galaxy. The quality of the model generated using the Isofit and Cmodel tasks can be appreciated in Figure 2.
It is evident in Figure 2 that the Ellipse task could not construct a very good fit to the irregular isophotes of NGC 4762 due to the high inclination of the galaxy and its (peanut shell)-shaped bulge associated with the bar (as seen in the light profile, Figure 3). The Ellipse task fails to properly model the galaxy light along the disk, leaving behind the bright stripes in the residual image.
3.2 Disassembling the Galaxy Image
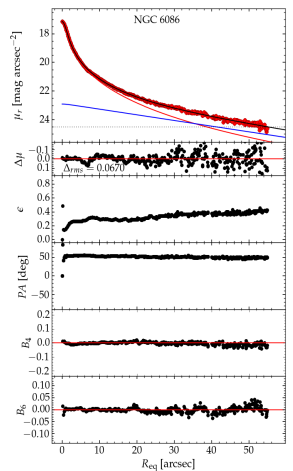
The isophotal table, obtained from Isofit, is used by the software Profiler (Ciambur, 2016) to plot and fit the 1D radial surface brightness profile of a galaxy, with respect to both its semi-major axis radius () and the equivalent axis (). is the geometric mean of and . It is the radius of an imaginary circular isophote equivalent in area to the elliptical isophote with major- and minor-axis radius and , conserving the total surface brightness of the elliptical isophote. This gives , where is the ellipticity of the isophote. Along with the surface brightness profile, Profiler also plots the radial profiles of the isophote’s ellipticity, position angle, and some of the higher-order Fourier harmonic coefficients (B4, B6, B8).
To decompose the galaxy light into its components, we use a wide variety of parametric analytical functions available in Profiler. For example, Sérsic (1963) and Core-Sérsic (Graham et al., 2003) functions for galactic bulges; exponential, truncated/anti-truncated exponential, and inclined-disk models for various types and orientations of disks; Ferrers (1877) function for bars; Sérsic for bar-lenses/pseudobulges, Gaussian for rings, and ansae (centered at the ring/anase radius); and PSFs for nuclear point sources. Table 2 presents the mathematical formulae for the radial surface brightness profiles of these functions and the corresponding expressions to determine the apparent magnitudes from the fit parameters. More details about the surface brightness profiles of the various fitting functions can be found in Section 3 of Ciambur (2016). \movetabledown=2.2in {rotatetable*}
| Function | Radial Surface BrightnessaaThe radial surface brightness profile was obtained from the intensity profile, using + zero-point (see Table 1)., | Apparent Magnitudebb, where luminosity (L), is the radial intensity profile., | Profile Parameters |
|---|---|---|---|
| (mag arcsec-2) | (mag) | ||
| SérsicccFrom Ciotti (1991) and Graham & Driver (2005), the quantity is calculated by solving . | |||
| Core-SérsicddEquation 5 from Graham et al. (2003), and are related through Equation 6 from Graham et al. (2003). The expression for the apparent magnitude is deduced under the approximation, (Equation A20 from Trujillo et al., 2004). | |||
| ExponentialeeEquation 14 from Graham & Driver (2005), for n=1. | |||
| TruncatedffEquation 10 from Ciambur (2016). | (for | ||
| disk | (for | ||
| Inclined diskggEquation 12 from Ciambur (2016) along the major axis, and is the modified Bessel function of the second kind. | Integrated Numerically | ||
| FerrerhhFrom Ferrers (1877); in the apparent magnitude expression represents the hyper-geometric function. | |||
| GaussianiiThe parameter is the peak value of the Gaussian surface brightness profile at the “peak radius” r, and is the width of the Gaussian. |
We disassemble the galaxy light into its components by fitting various features present in the galaxy light profile, using the functions mentioned in Table 2. To help identify the components that are present in a galaxy, we visually inspect the galaxy image at various contrast levels using DS9, and we also inspect various features present in the ellipticity, position angle, , and profiles (if required), which is beneficial in discerning galaxy components. Apart from that, we went through the literature, reviewing previous structural and kinematical studies of our galaxies, which gave us clues about the components present, their relative intensity (or surface brightness) levels, and their radial extents (sizes). In order to distinguish the components, like an inner disk, inner ring, nuclear star cluster, and most importantly, to identify the deficit of light at the center of a galaxy (core-Sérsic), we consulted previous works with highly resolved Hubble Space Telescope images (e.g., Dullo & Graham, 2014).
Having obtained a fit for the light profile—based on real physical structure/components—for the major-axis, we map it to the equivalent-axis (), ensuring the central (R=0) surface brightness of each component remains roughly constant. The equivalent-axis parameters for each component of a galaxy are required so that Profiler can use the circular symmetry of the equivalent-axis to integrate the surface brightness profiles and calculate the apparent magnitudes for all the components and the whole galaxy itself.
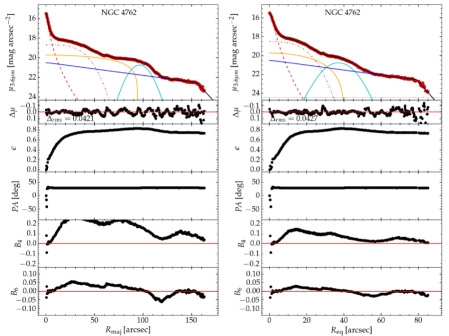
Figure 3 shows the multi-component fit to the surface brightness profile of NGC 4762, for both the major- and equivalent-axes. It is a barred-lenticular galaxy with a small bulge, an (oval-shaped) bar-lens, a bar, ansae, and a truncated disk. Laurikainen et al. (2005, 2007, 2011) observed that many S0 galaxies contain bars and “ovals” (also known as “lenses” or “bar-lenses”), with the inner regions of vertically-heated bars appearing as boxy/(peanut shell)-shaped structures referred to by some as pseudobulges (see Combes & Sanders, 1981; Athanassoula, 2002, 2005). The bumps in the light profile of NGC 4762, as well as the ellipticity, , and profiles at and correspond to the perturbation of the isophotes due to the bar-lens/pseudobulge and the bar, respectively. As shown in the simulations by Saha et al. (2018, their Figure 7), the adjacent bump () and dip () in the profile suggest the presence of an ansae at , at the end of the bar.
We also note that the decomposition results from Saha et al. (2018, e.g., their Figure 11; see also NGC 4026 and NGC 4371 in our Appendix) support the truncated disk model888A truncated disk model has a change in slope beyond the truncation radius in NGC 4762. Also, according to Kormendy & Bender (2012), the warped disk at the outer edge is possibly due to some ongoing tidal encounter. Table 3 lists the fit parameters for the components in NGC 4762. Light profile fits for all other galaxies can be found in the Appendix.
| Component | Function | Major-axis parameters | Equivalent-axis parameters |
|---|---|---|---|
| Bulge | Sérsic | ||
| Barlens | Sérsic | ||
| Bar | Ferrers | ||
| Ansae | Gaussian | ||
| Disk | Truncated Exponential |
Note. — Scale size parameters (, and ) are in units of arcseconds, and surface brightnesses (, and ) pertains to the m-band (AB mag). FWHM of the Gaussian can be related to its standard deviation () by, . Equivalent-axis is also known as the “geometric mean” axis, given by the square root of the product of major- and minor-axis.
3.3 Stellar Mass Calculation
We calculate the absolute magnitudes for all the galaxies, and their spheroids, using their apparent magnitudes measured using Profiler, and the distances in Table 4. These absolute magnitudes, after applying the small corrective term for cosmological dimming999A magnitude of is subtracted to account for the dimming of the observed magnitudes due to the expansion of the Universe, where z is redshift based on the galaxy distance. Red-shift was calculated assuming the latest cosmological parameters , , (Planck Collaboration et al., 2018). (Tolman, 1930) are used to calculate the corresponding intrinsic luminosities. The intrinsic luminosity is derived in terms of the solar luminosity in each band (see Table 1), and these luminosity values are then converted into stellar masses by multiplying them with the stellar mass-to-light ratio () for each band.
Stellar mass-to-light ratios depend on many factors, such as the Initial Mass Function (IMF) of stars in a galaxy, star formation history, metallicity, age, and they can be biased due to attenuation from dust in a galaxy. The interdependence of these factors and their effect on the stellar mass-to-light ratio is not very well known. Therefore, the mass-to-light ratio dependence on these properties has large uncertainties associated with it. Meidt et al. (2014) suggest a constant, optimal, stellar mass-to-light ratio of for the m band, based on the Chabrier (2003) IMF, which is consistent with the age-metallicity relation and can be used for both old, metal-rich and young, metal-poor stellar populations. The emission at m and m is largely unaffected by the luminosity bias due to young stars, and also it undergoes minimal dust extinction (Querejeta et al., 2015), enabling us a somewhat stable mass-to-light ratio. Using in the following equation from Oh et al. (2008):
| (3) |
which relates the stellar mass-to-light ratio at m and that of the -band, we obtained a constant stellar mass-to-light ratio of for the -band images. The latest relation: (J.Schombert, private communication), which is based on a larger m dataset, also revealed a consistent value for .
For our three -band data, we used an average stellar mass-to-light ratio of to obtain the corresponding stellar masses. was calibrated using
| (4) |
ensuring that the galaxy stellar masses are consistent with the masses obtained using -band magnitudes (obtained from 2MASS imaging of these galaxies), and a stellar mass-to-light ratio of . We present the spheroid and total galaxy stellar masses for our galaxies in Table 4.
3.4 Comparison of Stellar Masses
Here we compare the galaxy stellar masses measured using the m-band images (calculated as described above) with the galaxy stellar masses calculated using (already available) , , and -band magnitudes and three different formula for the corresponding stellar mass-to-light ratios. The comparison and the best fit lines are shown in Figure 4, where the horizontal-axis designates the (m-band)-derived masses, labeled , and the vertical-axis depicts the masses based on the , and band magnitudes, labeled .
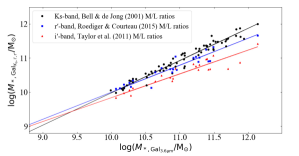
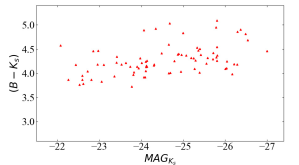
The black dots in Figure 4 show the masses of 71 galaxies calculated here using -band magnitudes and ( color-dependent) -band stellar mass-to-light ratios from Bell & de Jong (2001, their Table 1), placed with respect to our (m-band) stellar masses. The and -band magnitudes were obtained from the 2MASS catalog (Jarrett et al., 2003) and the Third Reference Catalogue (RC3) of Bright Galaxies (de Vaucouleurs et al., 1991), respectively. The -band magnitudes obtained from the 2MASS data reduction pipelines are usually underestimated (Schombert & Smith, 2012), therefore we used Equation 1 from Scott et al. (2013) to correct for this. The size of this correction was mag. The -band stellar mass-to-light ratios were brought to a Chabrier IMF, from the scaled/diet Salpeter IMF used by Bell & de Jong (2001), by subtracting an IMF dependent constant of 0.093 dex (Taylor et al., 2011; Mitchell et al., 2013). In Figure 5, we also present the ()-color versus the -band magnitude for our sample, which is consistent with the color-magnitude diagram presented by Graham & Soria (2019, their Figure 11), implying that our galaxies belong to the red-sequence, which flattens ( ) at bright magnitudes (mag).
The red triangles in Figure 4 are the masses of 23 galaxies calculated using -band magnitudes and ( color-dependent) -band stellar mass-to-light ratios (based on a Chabrier IMF) from Taylor et al. (2011, their Equation 7).
The blue squares represent the masses of 23 galaxies calculated using -band magnitudes and ( color-dependent) -band stellar mass-to-light ratios from Roediger & Courteau (2015), which are based on the Stellar Population Synthesis (SPS) model by Conroy et al. (2009). The apparent galaxy magnitudes in the , , and -bands were obtained from the SDSS data release 6 (Adelman-McCarthy et al., 2008).
The black, blue, and red lines in Figure 4 represent the least-squares fits to the three corresponding types of data points. We found that there is almost a linear one-to-one relationship between the (-band)-derived masses (black line) and our (m)-derived masses. The galaxy stellar masses based on - and -band magnitudes (blue line and red line, respectively) are systematically offset. Although the offset is small, it systematically increases at higher galaxy masses. Such an offset has been noticed in a few other studies (e.g. Taylor et al., 2011; Graham et al., 2019). The systematic offset between the above three lines can be attributed mainly to the initial mass functions, star formation rates, and the stellar evolutionary histories assumed to derive the mass-to-light ratios, and possibly some systematic uncertainties introduced in the apparent magnitudes by various telescope pipeline processes.
Figure 4 mainly serves to depict that the use of different stellar mass-to-light ratio prescriptions for luminosities (magnitudes) obtained in different bands can produce different stellar masses for a galaxy and its components (see Kannappan & Gawiser, 2007, for a detailed comparison of masses calculated using different methods). In passing, we note that we will explore if this may be a factor contributing to the offset observed by (Shankar et al., 2016) between galaxies with directly measured black hole masses and the population at large.
Differences in estimated stellar mass will lead to different estimates of a galaxy’s black hole mass when using the black hole mass scaling relations presented here and elsewhere. Hence, in our forth-coming equations for the – and – relations, we are including a conversion or correcting coefficient, (lower case upsilon), for the stellar masses (see Davis et al., 2019). This stellar mass correcting coefficient accounts for the difference in stellar mass of a galaxy due to either the difference in the stellar mass-to-light ratio () used for the same passband, or due to a different passband magnitude as well as a different mass-to-light ratio applied to it. If is a user-preferred Spitzer m-band stellar mass-to-light ratio, the correction coefficient is given by,
| (5) |
where 0.6 is the stellar mass-to-light ratio for the IRAC1 (m) passband used in this work, adopted from Meidt et al. (2014).
The correcting coefficient (), for the masses (, , ) derived using the -, -, and -band magnitudes with the three stellar mass-to-light ratio trends shown in Figure 4, can be expressed as follows:
| (6) |
| (7) |
| (8) |
3.5 Error Analysis
Our spheroid and galaxy stellar masses depend on three main independent quantities, which are: the stellar mass-to-light ratio (); distance (); and the apparent magnitude (). We have estimated the error in the above three quantities and added them in quadrature.
Our galaxy sample, dominated by near-infrared imaging, enables us to apply a relatively stable stellar mass-to-light ratio adopted from Meidt et al. (2014) and Querejeta et al. (2015). Meidt et al. (2014) recommend the use of a more liberal uncertainty on the m stellar mass-to-light ratio, accounting for an atypical evolutionary history or non-stellar emissions (which are dominant in red colors). As for our -band images are calibrated against 2MASS imaging and , and in turn is derived from , as described in Section 3.3, we assign a constant uncertainty of to the stellar mass-to-light ratios for all the galaxies.
For most of the 42 galaxies (Table 4) that we modeled, we obtained the error in their distances from the publication which presented their directly measured SMBH mass. For the rest of the galaxies (including the galaxies from Savorgnan & Graham (2016a)), we are using a constant error of in their distances, which is a typical percentage error in the ()-corrected Hubble flow distances, obtained from NASA/IPAC Extragalactic Database.
Some of the sources of error in the apparent magnitudes are imprecise sky subtraction; error in the telescope’s PSF size measurement; and error in the decomposition of the galaxy light. The decomposition error can include an error due to neglecting a component of the galaxy; misinterpreting a component’s size or position; error in the calibrated zero-point magnitude; misinterpreting nuclear components or being unable to resolve it; etc. It is nearly impossible to quantify all these errors.
If we assume that we have used an accurate method to measure the sky level and the telescope’s PSF, and trust various telescope pipelines (where we downloaded our images) for their zero-point flux calibration, then our main source of error in magnitude will be the error in the galaxy light decomposition process. Although, Profiler provides the formal random error for each fit parameter of the various components of a galaxy, which is the rms error obtained by least square minimization between data and the fitting function, it is very small. To better quantify the uncertainty in the decomposition, we have followed the (light profile fit-quality) grading scheme described by Savorgnan & Graham (2016a, in their section-4.2.1), except that we have assigned a symmetric error of 0.2 mag, 0.6 mag, and 0.8 mag to the spheroidal component of our grade-1, grade-2, and grade-3 galaxies, respectively.
As we are dealing with the stellar masses in log, we calculate these errors in log (dex). An error of mag in apparent magnitude, a error in distance, and a error in the stellar mass-to-light ratio, added in quadrature, give us the error in the stellar mass (in dex), as
| (9) |
We assign a constant error of dex to the galaxy masses, which is equivalent to the total quadrature error (calculated using Equation 9) assigned to the spheroid masses of our grade-1 galaxies, which are mostly single component galaxies.
| Galaxy | Type | Core | Distance | |||||
|---|---|---|---|---|---|---|---|---|
| (Mpc) | (mag) | (mag) | ||||||
| (1) | (2) | (3) | (4) | (5) | (6) | (7) | (8) | (9) |
| A1836 BCGaa 2MASS -band galaxy images | E1-2 | yes | 158.0011.06 | 9.590.06[5a,G] | -24.560.20 | -24.560.20 | 11.700.12 | 11.700.12 |
| A3565 BCG | E1 | no | 40.70 2.90[4a] | 9.040.09[5a,G] | -23.220.6 | -23.260.20 | 11.47 0.26 | 11.490.12 |
| NGC 0307bb SDSS -band galaxy images | SAB0 | no | 52.803.70 | 8.340.13[5c,S] | -20.310.80 | -21.140.20 | 10.430.33 | 10.760.12 |
| NGC 0404 | S0 | no | 3.060.37 | 4.850.13[5d,S] | -14.430.60 | -17.330.20 | 7.960.27 | 9.120.12 |
| NGC 0524 | SA0(rs) | yes | 23.301.63 | 8.920.10[5e,S] | -20.970.60 | -22.210.20 | 10.570.26 | 11.070.12 |
| NGC 1194 | S0 | no | 53.203.70 | 7.810.04[5f,M] | -21.310.80 | -21.870.20 | 10.710.33 | 10.940.12 |
| NGC 1275 | E | no | 72.95.10[4a] | 8.900.20[5g,G] | -24.140.60 | -24.230.20 | 11.840.26 | 11.880.12 |
| NGC 1374 | S0 | no? | 19.201.34 | 8.760.05[5h,S] | -20.090.60 | -20.830.20 | 10.220.26 | 10.520.12 |
| NGC 1407 | E | yes | 28.053.37 | 9.650.08[5h,S] | -23.190.60 | -23.340.02 | 11.460.27 | 11.520.12 |
| NGC 1550aa 2MASS -band galaxy images | E1 | yes | 51.573.61 | 9.570.06[5h,S] | -23.140.20 | -23.140.20 | 11.130.12 | 11.130.12 |
| NGC 1600 | E3 | yes | 64.004.48 | 10.230.05[5i,S] | -24.090.20 | -24.090.20 | 11.820.12 | 11.820.12 |
| NGC 2787 | SB0(r) | no | 7.300.51 | 7.600.06[5j,G] | -17.350.60 | -19.510.20 | 9.13 0.26 | 9.990.12 |
| NGC 3665 | S0 | no | 34.702.43 | 8.760.10[5k,G] | -22.120.60 | -22.740.20 | 11.030.26 | 11.280.12 |
| NGC 3923 | E4 | yes | 20.882.70 | 9.450.13[5l,S] | -23.020.20 | -23.020.20 | 11.400.15 | 11.400.12 |
| NGC 4026 | SB0 | no | 13.200.92 | 8.260.11[5m,S] | -19.820.80 | -20.440.20 | 10.110.33 | 10.360.12 |
| NGC 4339 | S0 | no | 16.001.33 | 7.630.33[5n,S] | -18.720.60 | -19.960.20 | 9.670.26 | 10.170.12 |
| NGC 4342 | ES/S0 | no | 23.001.00 | 8.650.18[5o,S] | -19.380.60 | -20.200.20 | 9.940.25 | 10.260.12 |
| NGC 4350 | EBS | no | 16.801.18 | 8.860.41[5p,SG] | -20.220.60 | -20.900.20 | 10.280.26 | 10.550.12 |
| NGC 4371 | SB(r)0 | no | 16.901.48 | 6.840.08[5l,S] | -19.270.60 | -21.030.20 | 9.890.26 | 10.600.12 |
| NGC 4429 | SB(r)0 | no | 16.501.60 | 8.180.09[5q,G] | -20.690.60 | -21.790.20 | 10.46 0.26 | 10.900.12 |
| NGC 4434 | S0 | no | 22.401.57 | 7.840.17[5n,S] | -19.320.60 | -20.000.20 | 9.910.26 | 10.180.12 |
| NGC 4486Bbb SDSS -band galaxy images | E1 | no | 15.300.32 | 8.760.24[5r,S] | -17.900.80 | -17.900.20 | 9.46 0.33 | 9.460.12 |
| NGC 4526 | S0 | no | 16.901.69 | 8.670.04[5s,G] | -21.270.60 | -22.140.20 | 10.70 0.26 | 11.040.12 |
| NGC 4552 | E | no | 14.900.95 | 8.670.05[5t,S] | -21.750.60 | -21.920.20 | 10.88 0.25 | 10.950.12 |
| NGC 4578 | S0(r) | no | 16.301.14 | 7.280.35[5n,S] | -18.970.60 | -20.100.20 | 9.77 0.26 | 10.230.12 |
| NGC 4649 | E2 | yes | 16.401.10 | 9.670.10[5u,S] | -23.140.20 | -23.140.20 | 11.44 0.12 | 11.440.12 |
| NGC 4742 | S0 | no | 15.501.15 | 7.150.18[5v,S] | -19.210.60 | -19.920.20 | 9.87 0.26 | 10.150.12 |
| NGC 4751aa 2MASS -band galaxy images | S0 | yes? | 26.921.88 | 9.150.05[5h,S] | -21.530.60 | -22.110.20 | 10.49 0.26 | 10.720.12 |
| NGC 4762 | SB0 | no | 22.603.39 | 7.360.15[5n,S] | -19.450.60 | -22.190.20 | 9.97 0.28 | 11.060.12 |
| NGC 5018 | S0 | no | 40.554.87 | 8.020.09[5l,S] | -21.970.60 | -22.910.20 | 10.98 0.27 | 11.350.12 |
| NGC 5252 | S0 | no | 96.806.78 | 9.000.40[5w,G] | -21.670.60 | -23.000.20 | 10.85 0.26 | 11.380.12 |
| NGC 5328aa 2MASS -band galaxy images | E1 | yes | 64.104.49 | 9.670.15[5h,S] | -24.030.20 | -24.030.20 | 11.49 0.12 | 11.490.12 |
| NGC 5419 | E2-3 | yes | 56.203.93 | 9.860.14[5x,S] | -23.150.20 | -23.150.20 | 11.44 0.12 | 11.440.12 |
| NGC 5516aa 2MASS -band galaxy images | E1-2 | yes? | 58.444.09 | 9.520.06[5h,S] | -23.910.20 | -23.910.20 | 11.44 0.12 | 11.440.12 |
| NGC 5813 | S0 | yes | 31.302.60 | 8.830.06[5y,S] | -21.680.60 | -22.620.20 | 10.86 0.26 | 11.230.12 |
| NGC 5845 | ES | no | 25.201.76 | 8.410.22[5z,S] | -19.830.60 | -20.320.20 | 10.12 0.26 | 10.320.12 |
| NGC 6086bb SDSS -band galaxy images | E | yes | 138.009.66 | 9.570.16[5aa,S] | -23.030.60 | -23.030.20 | 11.52 0.26 | 11.520.12 |
| NGC 6861 | ES | no | 27.304.49 | 9.300.08[5h,S] | -21.880.60 | -22.100.20 | 10.940.29 | 11.020.12 |
| NGC 7052 | E4 | yes | 66.404.65[4a] | 8.570.23[5ab,G] | -23.190.20 | -23.190.20 | 11.460.12 | 11.460.12 |
| NGC 7332 | SB0(pec) | no | 24.892.49 | 7.110.20[5ac,S] | -20.080.80 | -21.630.20 | 10.220.34 | 10.840.12 |
| NGC 7457 | S0 | no | 14.000.98 | 7.000.30[5ad,S] | -18.040.60 | -20.000.20 | 9.400.26 | 10.190.12 |
Note. — Columns: (1) Galaxy name. (2) Morphology, based on our decompositions. (3) Presence of partially depleted core. (4) Distance, primarily from the corresponding paper presenting the measured SMBH mass (). For some galaxies which did not have any error associated with these, we assigned an error of (see Section 3.5). (5) Directly measured super-massive black hole mass, reference, and method used (S: Stellar dynamics, G: Gas dynamics, M: Megamaser). The error in , obtained from the corresponding papers, was added in quadrature with the distance error. (6) Spheroid absolute magnitude at m, unless otherwise noted in Column 1 (AB mag system). (7) Total galaxy absolute magnitude at m, unless otherwise noted in Column 1 (AB mag system). (8) Spheroidal mass measured in this work, see Section 3.3. (9) Galaxy mass measured in this work.
References: 4a=NED (Virgo + GA + Shapley)-corrected Hubble flow distances; 5a=Dalla Bontà et al. (2009); 5b=Walsh et al. (2017); 5c=Erwin et al. (2018); 5d=Nguyen et al. (2017); 5e=Krajnović et al. (2009); 5f =Kuo et al. (2011); 5g=Scharwächter et al. (2013); 5h=Rusli et al. (2013b); 5i=Thomas et al. (2016); 5j=Sarzi et al. (2001); 5k=Onishi et al. (2017); 5l=Saglia et al. (2016); 5m=Gültekin et al. (2009b); 5n=Krajnović et al. (2018); 5o=Cretton & van den Bosch (1999); 5p=Pignatelli et al. (2001); 5q=Davis et al. (2018b); 5r=Kormendy et al. (1996); 5s=Gould (2013); 5t=Hu (2008); 5u=Shen & Gebhardt (2010); 5v=Tremaine et al. (2002); 5w=Capetti et al. (2005); 5x=Mazzalay et al. (2016); 5y=Hu (2008); 5z=Gebhardt et al. (2003); 5aa=McConnell et al. (2011); 5ab=van der Marel & van den Bosch (1998); 5ac=Batcheldor et al. (2013); 5ad=Schulze & Gebhardt (2011).
4 Results and discussion
We performed a Bivariate Correlated Errors and Intrinsic Scatter (BCES) regression (Akritas & Bershady, 1996) between the SMBH masses and both the spheroid masses and the total galaxy masses of our sample. BCES is simply an extension of Ordinary Least Squares (OLS) estimator permitting dependent measurement errors in both the variables. We use the bisector line obtained by the BCES101010To perform the BCES regression, we used the PYTHON script (available at https://github.com/rsnemmen/BCES) written by Nemmen et al. (2012), we modified it to calculate the intrinsic scatter (Equation 1 from Graham & Driver, 2007). regression; this line symmetrically bisects the regression lines obtained using BCES(X|Y)111111Minimizes scatter in the X-direction. and BCES(Y|X)121212Minimizes scatter in the Y-direction.. The bisector regression line offers equal treatment to the measurement errors in both the coordinates, and allows for intrinsic scatter. In addition to the BCES routine, we also used the modified FITEXY routine (Press et al., 1992; Tremaine et al., 2002) to perform a regression on our data for the – and – relations. We found results highly consistent with that of the BCES regression, within the bounds.
In our analysis, we have excluded eight galaxies (MRK 1216, NGC 404, NGC 1277, NGC 1316, NGC 2787, NGC 4342, NGC 4486B, and NGC 5128), which leaves us with a reduced dataset of 76 ETGs. In all our plots hereafter, these galaxies are shown by a black star (except for MRK 1216). We excluded MRK 1216 from our regression analysis because we did not obtain a suitably resolved and deep image to determine the spheroidal component of this galaxy.
NGC 1316 (Fornax-A) and NGC 5128 (Cen A) are galaxy mergers in progress. According to Kormendy & Ho (2013), these two galaxies have much higher bulge masses compared to their central supermassive black hole masses, which can make them stand out in the black hole mass scaling relations.
NGC 404 has the lowest SMBH mass in our sample. Nguyen et al. (2017) provide a measured black hole mass of , using Jeans Anisotropic Modeling (JAM) of stellar orbits, along with a upper limit of in . Although, NGC 404 does not appear to be an outlier in our dataset, as it follows the regression lines at the low-mass end, we still exclude it as it would anchor the low-mass end of the relationship and we do not want our regression lines to be biased by any individual galaxy.
We also exclude NGC 4342 and NGC 4486B because they have been tidally stripped due to the gravitational pull of their nearby massive companion galaxies, NGC 4365 (Blom et al., 2014) and NGC 4486 (Batcheldor et al., 2010), respectively. NGC 4342 and NGC 4486B are left with a significantly reduced galaxy mass and can be seen clearly offset in our – and – diagrams (towards the low-mass side of the and coordinate axes). NGC 221 (M32) is another, similar, well known offset galaxy due to the tidal stripping from the massive companion galaxy M31 (e.g., Graham, 2002). Such compact elliptical galaxies are relatively rare among the general population and are recommended to be excluded from – scaling relations (see Graham & Soria, 2019).
NGC 1277 (peculiar morphology) and NGC 2787 are two disk galaxies which are potential outliers at the high- and low-mass end of our relations, respectively. They have a torquing effect on our regression lines, especially for the sub-category of galaxies with a disk (ES/S0). We have therefore excluded these galaxies from our regressions to avoid biasing the slope of our scaling relations. Furthermore, the stellar mass for NGC 1277 is measured from V-band imaging (Graham et al., 2016b) and a stellar mass-to-light ratio based on an unusual bottom heavy IMF (Martín-Navarro et al., 2015). According to Courteau et al. (2014, their Figure 8), stellar mass-to-light ratios based on a bottom heavy IMF can be a factor 6 higher than stellar mass-to-light ratios based on the Chabrier IMF that we have adopted, which is likely to be the principal reason for NGC 1277 outstanding at the high-mass end of our relations.
The above galaxies remain excluded in all the regressions presented in this paper. In Figures 6-11, we identify an additional five galaxies with a peculiar morphology, to investigate if they might be outliers, but they are included in the regressions.
In our search for the underlying relation between super-massive black hole mass and host galaxy property, we explored various possibilities for the scaling relations by dividing the galaxy sample into different categories. Specifically: Sérsic and core-Sérsic galaxies; galaxies with and without a disk; and galaxies with and without a bar. We will analyze and discuss the scaling relations for these categories in the following sections.
4.1 Sérsic and Core-Sérsic Galaxies
Core-Sérsic galaxies are massive ETGs with a central supermassive black hole that likely formed from the merging of the central black holes of two or more galaxies (Begelman et al., 1980; Graham, 2004; Merritt, 2006). They occupy the high-mass end of the black hole mass scaling relations. The discovery of the bent – () relation for Sérsic and core-Sérsic galaxies was based on a mixed sample of elliptical, lenticular, and spiral galaxies (Graham, 2012; Graham & Scott, 2013; Scott et al., 2013). In our work, we investigated the nature of the above relation based on a larger sample of only early-type galaxies.
We categorized Sérsic and core-Sérsic galaxies based on their central light profiles, as determined from previous studies of high-resolution images (Ferrarese et al., 2006; Richings et al., 2011; Dullo & Graham, 2014). Figure 6 presents two regressions performed on the two categories (Sérsic and core-Sérsic) for the SMBH mass versus both the spheroid stellar mass (left panel) and the total galaxy stellar mass (right panel) relations.
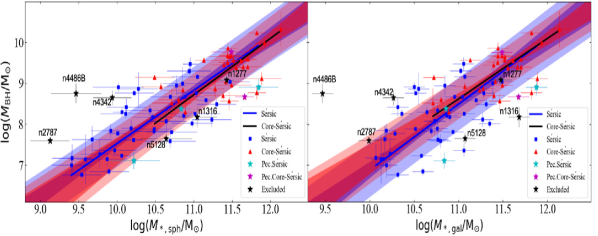
The BCES bisector regression of our 45 Sérsic and 31 core-Sérsic galaxies revealed and , respectively. For the black hole mass versus total galaxy mass diagram we obtained and for Sérsic and core-Sérsic galaxies, respectively. For both the – and – relations, the slopes and intercepts of the regression lines for the Sérsic (blue line) and core-Sérsic (red line) ETGs are consistent within the confidence interval. Slopes and intercepts for the BCES bisector, as well as BCES() and BCES(), regression lines for the Sérsic and core-Sérsic galaxies, for both the – and – relations, can be found in Table 5.
Our findings are unlike the relations and obtained by Scott et al. (2013) for their Sérsic and core-Sérsic galaxies, respectively. It appears that they may have found the break in the – relation due to the inclusion of spiral galaxies, which steepened the – relation for for their Sérsic galaxies (see Section 4.4).
The consistency of the regression lines for the Sérsic and core-Sérsic ETGs suggest that all the early-type galaxies (whether Sérsic or core-Sérsic) may follow single log-linear relations in the – and – diagrams.
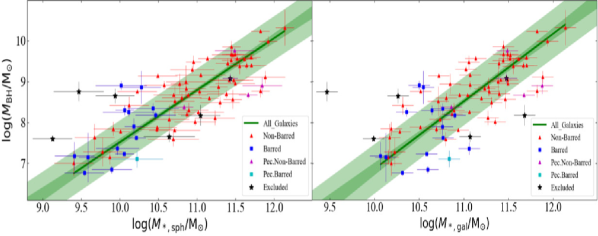
Fitting single BCES bisector regression lines, for the – and – relations over our total (reduced) sample of 76 ETGs (Figure 7), revealed two tight relations, which can be expressed as,
{IEEEeqnarray}rCl
log(M_BH/M_⊙) &= (1.27±0.07)log(M*,sphυ(5×10¹⁰M⊙))
+ (8.41±0.06),
and
{IEEEeqnarray}rCl
log(M_BH/M_⊙) &= (1.65±0.11)log(M*,galυ(5×10¹⁰M⊙))
+ (8.02±0.08),
with total rms scatters, in , of 0.52 dex and 0.58 dex, respectively.

The dark green line in both panels of Figure 7 represents the BCES bisector regression line for our sample of 76 ETGs, which is surrounded by a dark green shade showing the uncertainty in the slope and the intercept of the line. The light green shade represents the rms scatter of the data about the regression line.
The similarity in the scatter about both relations (Equations 6 and 6) suggests that the black hole mass correlates nearly as well with galaxy stellar mass (or luminosity) as it does with spheroid stellar mass (or luminosity) for ETGs. This partly supports the claim of Läsker et al. (2014), albeit qualified by the restriction to ETGs, as was noted by Savorgnan et al. (2016). Hence, with knowledge of the galaxy stellar mass, it would appear (at this stage of the analysis) that one can use the – relation to estimate the black hole mass of an ETG nearly as accurately as if estimated using the – relation. Additionally, it should be remembered that a poor bulge/disk decomposition may introduce an error of noticeably more than 0.1 dex to the bulge stellar mass, and thus the – relation may in many instances be preferable.
For our total galaxy stellar masses, we used a constant uncertainty of 0.12 dex (see Section 3.3) in all the regressions. However, we also derived the – relation using a range of different uncertainties (0.10 dex, 0.12 dex, 0.15 dex, 0.20 dex) on , and found that the slope and intercept of equation 6 remained within the bound.
Our scaling relations are based on the use of a different constant stellar mass-to-light ratio for each passband (see Table 1 and Section 3.3). However, we checked the robustness of our – and – relations, using the color-dependent stellar mass-to-light ratios to calculate galaxy and spheroid stellar masses for our galaxies. As explained in Section 3.4, we calculated color-dependent -band stellar mass-to-light ratios () for all our galaxies, using the equation from Bell & de Jong (2001). Further, we used this in the formulae from Oh et al. (2008), (Equation 3) to obtain color-dependent . For the remaining two131313NGC 4486B, which is excluded from our regressions, is one of the three galaxies for which we used SDSS -band images. SDSS -band images we used , calibrated against 2MASS imaging as described in Section 3.3. The use of color-dependent stellar mass-to-light ratios for the spheroid and galaxy stellar masses of our sample resulted in and . These relations are consistent within the bound of our previous relations (Equations 6 and 6), obtained using the masses based on the constant stellar mass-to-light ratios described in Section 3.3.
4.2 Galaxies With a Disk (ES/S0) and Without a Disk (E)
We divided our ETG sample into those with an intermediate or extended disk (ES- and S0-type) and those without a disk (E-type), and performed separate BCES bisector regressions on each category.
Figure 8 reveals separate relations for galaxies with a disk and galaxies without a disk in the – diagram. The two relations are:
{IEEEeqnarray}rCl
log(M_BH/M_⊙) &= (1.86±0.20)log(M*,sphυ(5×10¹⁰M⊙))
+ (8.90±0.13),
for 36 galaxies with a disk, and
{IEEEeqnarray}rCl
log(M_BH/M_⊙) &= (1.90±0.20)log(M*,sphυ(5×10¹⁰M⊙))
+ (7.78±0.15),
for 40 galaxies without a disk, with an rms scatter of 0.57 dex and 0.50 dex, respectively. While the slopes are consistent, the intercepts, are different by 1.12 dex (more than an order of magnitude). Therefore, to estimate the black hole mass using the spheroid stellar mass of an ETG, it is beneficial to know if the galaxy has a disk (ES/S0) or not (E).
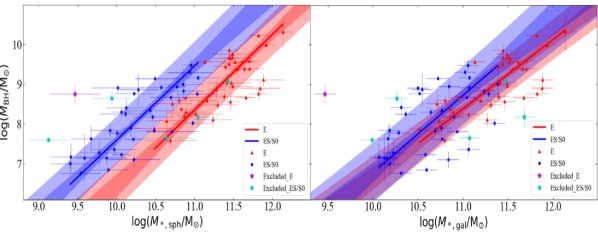
In the – diagram (Figure 8, right panel), the slopes of the regression lines for galaxies with (Equation 8) and without (Equation 8) a disk are again consistent. However, the intercepts of each relation now only differ by a factor of 2, rather than 13 (i.e, 1.12 dex), in black hole mass. While the uncertainty on these two intercepts does not quite overlap, we derive a single – relation for ES/S0 and E-type galaxies. Given that one may not know if their ETG of interest contains a disk, to estimate black hole mass using the total galaxy stellar mass, one may prefer the relation obtained by performing the single regression (Equation 6) on the whole ETGs sample. The bisector regression line for the 36 ETGs with a disk is
{IEEEeqnarray}rCl
log(M_BH/M_⊙) &= (1.94±0.21)log(M*,galυ(5×10¹⁰M⊙))
+ (8.14±0.12),
with an rms scatter of 0.71 dex, and for the 40 galaxies without a disk we obtained
{IEEEeqnarray}rCl
log(M_BH/M_⊙) &= (1.74±0.16)log(M*,galυ(5×10¹⁰M⊙))
+ (7.85±0.12),
with an rms scatter of 0.48 dex.
The above results agree with the fact that most elliptical galaxies primarily consist of an extended spheroid; hence their total galaxy mass is nearly equal to their spheroid mass. Thus, in both the – and – diagrams, elliptical galaxies reside at the same place, usually at the high-mass end. The ellicular (ES) and lenticular (S0) galaxies have their total galaxy stellar mass distributed in their spheroid, disk, and sometimes other components. Therefore, their spheroid stellar mass can be significantly less than the galaxy stellar mass, and in the – diagram they reside at the low-mass (left) side creating an offset from the galaxies without a disk. We also performed BCES() and BCES() regressions for the above cases and the best fit parameters can be found in Table 5.
4.3 Barred and Non-barred Galaxies
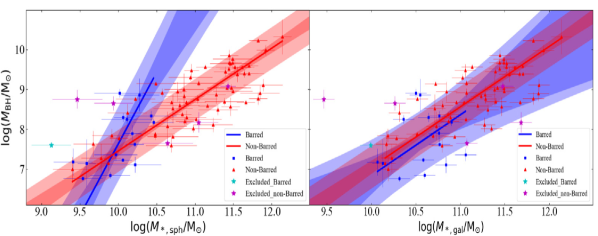
The relation is often reported to be the most fundamental relationship between the super-massive black hole mass and any galaxy property, where is the velocity dispersion of the host galaxy’s spheroid (Ferrarese & Merritt, 2000; Gebhardt et al., 2000). However, previous studies have found that barred galaxies are offset towards higher values in the diagram (Graham, 2007a, 2008; Graham et al., 2011). This offset can be accounted for in one of two ways: either the velocity dispersion of barred galaxies is systematically higher than non-barred galaxies (Hartmann et al., 2014), or their central super-massive black hole mass is under-estimated.
In an attempt to solve this problem, we performed separate regressions for the barred and non-barred galaxies in the – and – diagrams (see Figure 9). Our reduced sample of 76 ETGs consists of 15 barred galaxies (red squares) and 61 non-barred galaxies (blue triangles). The slope of the – relation for barred and non-barred ETGs are consistent with each other. However, with only 15 barred ETGs in our sample, the uncertainty on the slope of the – relation for the barred galaxies is large (see Table 5) and makes it problematic to determine at what mass to compare the intercepts. From a visual inspection of Figure 9, we feel that it would be premature to draw any firm conclusion until more barred ETGs are in the sample.
The parameters of the BCES bisector, along with BCES() and BCES(), regression lines for our dataset of 15 barred and 61 non-barred ETGs can be found in Table 5.
In Figure 10, we have again shown the single ETG regression line for both the – and the – relations (as in Figure 7), but here we identify the barred (blue squares) and non-barred (red triangles) galaxies with different symbols. The barred galaxies are not offset in the – diagram, and there is no clear evidence for an offset to lower black hole masses in the – diagram, implying that the barred galaxies likely have a higher velocity dispersion relative to the non-barred galaxies thereby creating the offset in the diagram.
4.4 Early-type Galaxies and Late-type Galaxies
We have combined our ETG data with the recent work on the largest sample of late-type galaxies (LTGs, i.e. spirals) by Davis et al. (2019). We found that the regression lines followed by these two populations, ETGs and LTGs141414We have taken the BCES bisector regression line from Davis et al. (2018a), in the – and – diagrams are not consistent with each other (see Figure-11).
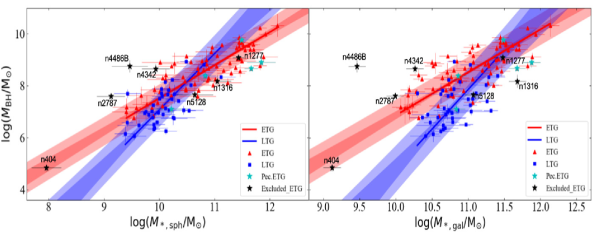
In the black hole mass versus spheroid mass diagram, the regression line for the reduced sample of 40 LTGs from Davis et al. (2019, accepted) can be expressed as,
{IEEEeqnarray}rCl
log(M_BH/M_⊙) &= (2.16±0.32)log(M*,sphυ(5×10¹⁰M⊙))
+ (8.58±0.22),
which has a slope approximately twice as steep as that of the ETGs: (Equation 6).
Similarly, in the black hole mass versus galaxy stellar mass diagram, LTGs define the relation
{IEEEeqnarray}rCl
log(M_BH/M_⊙) &= (3.05±0.70)log(M*,galυ(5×10¹⁰M⊙))
+ (6.93±0.14),
while the ETGs follow the proportionality (Equation 6).
This shallow and steep relation is roughly consistent with the bend observed by Savorgnan et al. (2016), where they found a near-linear relation, , for their reduced151515Savorgnan et al. (2016) excluded 2 ETGs and 2 LTGs from their total sample. sample of 45 ETGs, with an rms scatter of 0.51 dex in the black hole mass, and for their 17 LTGs. They refer to the two correlations as an early-type sequence (or red-type sequence) and a late-type sequence (or blue-type sequence). Parameters for our BCES() and BCES() regression lines for LTGs and ETGs can be found in Table 5.
From our work, we infer that the previous papers found a bent – relation due to Sérsic and core-Sérsic galaxies (e.g. Scott et al., 2013) because most of the Sérsic galaxies in their sample were LTGs and most of the core-Sérsic galaxies were ETGs. The bend in their relation was supposedly due to the different formation processes (dry merging versus gaseous growth), as traced by the difference in the central surface brightness profile of the galaxies. However, we find that the bend is due to the two broad morphological classes of galaxies: ETGs (consisting of ellipticals E, elliculars ES, and lenticulars S0) and LTGs (consisting of spirals Sp), supporting the finding in Savorgnan et al. (2016), which was also later shown by van den Bosch (2016, see his Figure 2).
The situation is, however, a little more complicated than presented above. As explained in Graham & Soria (2019), the color-magnitude relation for ETGs had confounded the situation when working with B-band magnitudes. This results in the fainter Sérsic ETGs following a steep B-band – relation (and a shallow – relation). Additionally, we have established that the bulges of ETGs follow a steep – relation if one has a sample consisting of pure E-type or a sample of ES and S0 type. Section 4.2 reveals a slope of around for both of these populations, which is not overly dissimilar to the slope of for bulges in spiral galaxies.
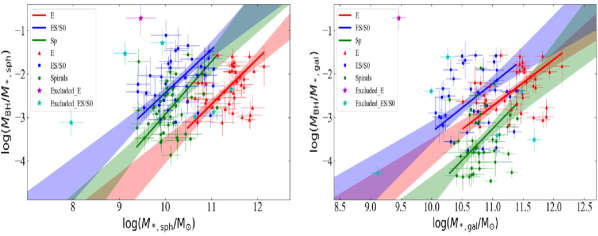
Importantly, we find that the – and – relations (see Figure 12) are qualitatively and quantitatively consistent with our – and – relations for the sub-populations of ETGs (ES/S0 and E) and LTGs (Sp), within bound. Parameters for these regression lines can be found in Table 5. Figure 12 also depicts how the and ratios do not have a constant value as was implied by our – and – relations.
4.5 NGC 5252: A Compact Massive Spheroid
In addition to the above scaling relations, we have discovered a compact massive spheroid in NGC 5252 (), with a stellar mass of and a half light radius () of just 0.672 kpc, adding to the sample of 21 identified by Graham et al. (2015).
| Regression | Minimization | |||||||||
|---|---|---|---|---|---|---|---|---|---|---|
| (dex) | (dex) | (dex) | (dex) | (dex) | ||||||
| (1) | (2) | (3) | (4) | (5) | (6) | (7) | (8) | (9) | (10) | |
| 76 Early-Type Galaxies | ||||||||||
| bces | Symmetric | |||||||||
| bces | ||||||||||
| bces | ||||||||||
| bces | Symmetric | |||||||||
| bces | ||||||||||
| bces | ||||||||||
| Sérsic and Core-Sérsic Galaxies | ||||||||||
| 45 Sérsic Galaxies: | ||||||||||
| bces | Symmetric | |||||||||
| bces | ||||||||||
| bces | ||||||||||
| 31 Core-Sérsic Galaxies: | ||||||||||
| bces | Symmetric | |||||||||
| bces | ||||||||||
| bces | ||||||||||
| 45 Sérsic Galaxies: | ||||||||||
| bces | Symmetric | |||||||||
| bces | ||||||||||
| bces | ||||||||||
| 31 Core-Sérsic Galaxies: | ||||||||||
| bces | Symmetric | |||||||||
| bces | ||||||||||
| bces | ||||||||||
| Galaxies with a Disk (ES/S0) and Galaxies without a Disk (E) | ||||||||||
| 36 Galaxies with a Disk (ES/S0): | ||||||||||
| bces | Symmetric | |||||||||
| bces | ||||||||||
| bces | ||||||||||
| 40 Galaxies without a Disk (E): | ||||||||||
| bces | Symmetric | |||||||||
| bces | ||||||||||
| bces | ||||||||||
| 36 Galaxies with a Disk (ES/S0): | ||||||||||
| bces | Symmetric | |||||||||
| bces | ||||||||||
| bces | ||||||||||
| 40 Galaxies without a Disk (E): | ||||||||||
| bces | Symmetric | |||||||||
| bces | ||||||||||
| bces | ||||||||||
| Galaxies with and without a Bar | ||||||||||
| 15 Galaxies with a Bar: | ||||||||||
| bces | Symmetric | |||||||||
| bces | ||||||||||
| bces | ||||||||||
| 61 Galaxies without a Bar: | ||||||||||
| bces | Symmetric | |||||||||
| bces | ||||||||||
| bces | ||||||||||
| 15 Galaxies with a Bar: | ||||||||||
| bces | Symmetric | |||||||||
| bces | ||||||||||
| bces | ||||||||||
| 61 Galaxies without a Bar: | ||||||||||
| bces | Symmetric | |||||||||
| bces | ||||||||||
| bces | ||||||||||
| 40 Late-Type Galaxies | ||||||||||
| bces | Symmetric | |||||||||
| bces | ||||||||||
| bces | ||||||||||
| bces | Symmetric | |||||||||
| bces | ||||||||||
| bces | ||||||||||
| ETGs with a disk (ES/S0), ETGs without a disk (E) and LTGs (Sp) | ||||||||||
| 36 Galaxies with a Disk (ES/S0): | ||||||||||
| bces | Symmetric | |||||||||
| 40 Galaxies without a Disk (E): | ||||||||||
| bces | Symmetric | |||||||||
| 40 Late-Type Galaxies (Sp): | ||||||||||
| bces | Symmetric | |||||||||
| 36 Galaxies with a Disk (ES/S0): | ||||||||||
| bces | Symmetric | |||||||||
| 40 Galaxies without a Disk (E): | ||||||||||
| bces | Symmetric | |||||||||
| 40 Late-Type Galaxies (Sp): | ||||||||||
| bces | Symmetric | |||||||||
Note. — The data and linear regression for late-type galaxies is taken from Davis et al. (2019). Columns: (1) Regression performed. (2) The coordinate direction in which the offsets from the regression line is minimized. (3) Slope of the regression line. (4) Intercept of the regression line. (5) Intrinsic scatter in the direction (using Equation 1 from Graham & Driver, 2007). (6) Root mean square scatter in the direction. (7) Pearson correlation coefficient. (8) The Pearson correlation probability value. (9) Spearman rank-order correlation coefficient. (10) The Spearman rank-order correlation probability value.
5 Conclusions and Implications
Our work, based on the largest sample of ETGs with directly-measured SMBH masses, establishes a robust relation between the black hole mass and both the spheroid and galaxy stellar mass. While the color-magnitude relation for ETGs results in a steep – relation in the optical bands for mag, i.e., (Graham & Soria, 2019), the slopes at the low- and high-luminosity end of the – relation based on infrared magnitudes are equal to each other. That is, the – relation for ETGs appears to be defined by a single log-linear relation. This helps to clarify debate over the existence of a steeper (at the low-mass end) and “bent” – relation for ETGs.
Using our image reduction, profile extraction, and multi-component decomposition techniques, we carefully measured the spheroid and galaxy stellar luminosities and masses. We applied the BCES bisector regression to our dataset, providing a symmetric treatment to both the and or data (we additionally report the scaling relations obtained from other asymmetric regressions in Table 5).
We checked the consistency of our – and – scaling relations using stellar masses based on color-dependent stellar mass-to-light ratios and found it to be in agreement with our scaling relations based on the constant stellar mass-to-light ratios. This may in part be because our ETGs have fairly constant, red, colors (Figure 5). Our key results can be summarized as follows:
-
•
Having performed separate regressions using 45 Sérsic and 31 core-Sérsic galaxies, we found that, for ETGs, there is no significant bend in either the – or – diagram due to Sérsic and core-Sérsic galaxies (Figure-6).
-
•
ETGs follow a steep relation, with total rms scatter of 0.52 dex in the . The slope of this relation is non-linear at the bound, leading us to the conclusion that a steeper than linear – relation exists for ETGs. This also implies that the ratio is not a constant but varies along the relation.
-
•
The SMBH mass of ETGs follow an even steeper relation with the host galaxy stellar mass: with an rms scatter (in the direction) of 0.58 dex. The slope of this relation is non-linear at the level. The similarity in the rms scatter of this relation with that of – relation suggests that black hole mass correlates almost equally well with galaxy mass (luminosity) as it does with spheroid mass (luminosity) for ETGs (Figure 7). Hence, for the cases where bulge/disk decomposition is difficult, the – relation can be used to estimate the black hole mass of an ETG using the total galaxy stellar mass. However, as noted below, this approach is not preferred if one knows whether or not the ETG under study contains a disk.
-
•
We discovered separate relations for ETGs with an intermediate-scale or extended disk (ES or S0) and ETGs without a disk (E), having slopes and in the – diagram, with an rms scatter in the direction of 0.57 dex and 0.50 dex, respectively. Crucially, galaxies with a disk are offset from galaxies without a disk (Figure 8) by more than an order of magnitude (1.12 dex) in their ratio. This is likely due to the exclusion of the disk light, rather than an issue with the black hole mass. To better estimate the black hole mass of an ETG, one should use the corresponding – relation depending on whether the ETG has a disk or not.
-
•
For the – relation, the intercepts of the two regression lines (for galaxies with and without a disk) differ only by a factor of 2. Hence, the relation obtained by a single regression (Equation 6) may still prove to be preferable for estimating the black hole mass when uncertain about the presence of a disk in an ETG, or for those without a careful multi-component decomposition.
-
•
We found that the regression line for the barred galaxies (which reside at the lower-mass end of our diagrams) are largely consistent with the regression line for the non-barred galaxies in both the – and – diagrams (Figures 9 and 10). However, with only 15 barred galaxies, we restrict our conclusion to noting that the barred galaxies do not appear to have lower SMBH masses than the non-barred galaxies in either the – diagram or the – diagram.
-
•
Combining the 76 ETGs studied here, with the 40 LTGs from Davis et al. (2019), we observe a difference in the slope of the regression lines for ETGs and LTGs (Figure 11) in both the – and – diagrams. The LTGs define steeper relations, such that and . These slopes for the LTGs are almost double that of the ETGs. This agrees with the change noticed by Savorgnan et al. (2016) in the – diagram.
-
•
We also found that the behaviour of three sub-populations of galaxies (E, ES/S0 and, Sp) in the – and – diagrams agree with the corresponding – and – relations (see Figures 8, 11 and 12), supporting the obvious implication of our non-linear vs and scaling relations, specifically that the and ratios are not constant.
The existence of substructure within the – diagram, due to sub-populations of ETGs with and without disks, and spiral galaxy bulges, means that past efforts to calibrate the virial -factor using the – diagram—used for converting virial masses of active galactic nuclei into black hole masses (e.g., Bentz & Manne-Nicholas, 2018)— will benefit from revisiting. Calibration of the offset between the ensemble of virial masses for AGN and the ensemble of directly measured black hole mass should be performed separately using the significantly different, non-linear, – relations for ETGs and LTGs, while taking into account the presence or absence of a disk in the ETGs. A similar situation exists with the – diagram, due to the offset sub-populations of galaxies with and without bars (Graham et al., 2011). In Sahu et al. (2019, in preparation) we will present an analysis of the – relation based on the various sub-samples of the ETG population used in this paper. We will also do this using our combined sample of 120 ETGs and LTGs.
Extending our search for the most fundamental black hole mass scaling relation, we will explore the correlation of black hole mass with the spheroid’s Sérsic index161616The Sérsic index is a measure of the radial concentration of stellar mass. (n) and half light radius (). We already have these two parameters from our homogeneous bulge/disk decomposition of ETGs and LTGs (Davis et al., 2019) . We intend to check for the existence of a fundamental plane rather than a line. However, care needs to be taken given that the – relation is curved (e.g. Graham & Worley, 2008, Graham 2019, submitted).
The black hole mass scaling relations presented in this work, based on a local () sample of ETGs, can be used to estimate the black hole masses in other galaxies which do not have their SMBH’s gravitational sphere-of-influence spatially resolved.
These scaling relations can be further used to derive the black hole mass function from the galaxy luminosity function, for the first time separating the galaxy population according to their morphological type. We plan to calculate the SMBH mass function by applying the black hole mass scaling relations for ETGs and LTGs to the updated spheroid and galaxy luminosity functions from GAMA data (Driver et al., 2009) for which the morphological types are known and bulge/disk decompositions have been performed.
The SMBH mass function, accompanied with knowledge of the galaxy/SMBH merger rate, can be used to constrain the ground-based detection rate of long-wavelength gravitational waves, which are actively being searched for by the Parkes Pulsar Timing Array (PPTA, Shannon et al., 2015; Hobbs & Dai, 2017), the European Pulsar Timing Array (EPTA, Stappers & Kramer, 2011), and the North American Nanohertz Observatory for Gravitational Waves (NANOGrav, Siemens, 2019). Using the forth-coming SMBH mass function, we intend to improve the predictions for the detection of the gravitational waves from PTA and make new predictions for detection from the recently inaugurated MeerKAT telescope (Jonas, 2007). The revised black hole scaling relations can also be used to predict the detection of gravitational waves from future space-based detectors. For example, Mapelli et al. (2012) investigate the detection of gravitational waves produced from the merger of SMBHs with stellar mass BHs and neutron stars in the central nuclear star clusters of galaxies (Hartmann, 2011).
References
- Abbott et al. (2016) Abbott, B. P., Abbott, R., Abbott, T. D., et al. 2016, ApJ, 818, L22, doi: 10.3847/2041-8205/818/2/L22
- Adelman-McCarthy et al. (2008) Adelman-McCarthy, J. K., Agüeros, M. A., Allam, S. S., et al. 2008, The Astrophysical Journal Supplement Series, 175, 297, doi: 10.1086/524984
- Aihara et al. (2011) Aihara, H., Allende Prieto, C., An, D., et al. 2011, The Astrophysical Journal Supplement Series, 193, 29, doi: 10.1088/0067-0049/193/2/29
- Akritas & Bershady (1996) Akritas, M. G., & Bershady, M. A. 1996, ApJ, 470, 706, doi: 10.1086/177901
- Almoznino et al. (1993) Almoznino, E., Loinger, F., & Brosch, N. 1993, MNRAS, 265, 641, doi: 10.1093/mnras/265.3.641
- Anglés-Alcázar et al. (2017) Anglés-Alcázar, D., Faucher-Giguère, C.-A., Quataert, E., et al. 2017, MNRAS, 472, L109, doi: 10.1093/mnrasl/slx161
- Athanassoula (2002) Athanassoula, E. 2002, ApJ, 569, L83, doi: 10.1086/340784
- Athanassoula (2005) —. 2005, MNRAS, 358, 1477, doi: 10.1111/j.1365-2966.2005.08872.x
- Baes et al. (2003) Baes, M., Buyle, P., Hau, G. K. T., & Dejonghe, H. 2003, MNRAS, 341, L44, doi: 10.1046/j.1365-8711.2003.06680.x
- Batcheldor et al. (2013) Batcheldor, D., Axon, D., Valluri, M., Mandalou, J., & Merritt, D. 2013, AJ, 146, 67, doi: 10.1088/0004-6256/146/3/67
- Batcheldor et al. (2010) Batcheldor, D., Robinson, A., Axon, D. J., Perlman, E. S., & Merritt, D. 2010, ApJ, 717, L6, doi: 10.1088/2041-8205/717/1/L6
- Begelman et al. (1980) Begelman, M. C., Blandford, R. D., & Rees, M. J. 1980, Nature, 287, 307, doi: 10.1038/287307a0
- Begelman & Nath (2005) Begelman, M. C., & Nath, B. B. 2005, MNRAS, 361, 1387, doi: 10.1111/j.1365-2966.2005.09249.x
- Belczynski et al. (2010) Belczynski, K., Bulik, T., Fryer, C. L., et al. 2010, ApJ, 714, 1217, doi: 10.1088/0004-637X/714/2/1217
- Bell & de Jong (2001) Bell, E. F., & de Jong, R. S. 2001, ApJ, 550, 212, doi: 10.1086/319728
- Bentz & Manne-Nicholas (2018) Bentz, M. C., & Manne-Nicholas, E. 2018, ApJ, 864, 146, doi: 10.3847/1538-4357/aad808
- Bertin & Arnouts (1996) Bertin, E., & Arnouts, S. 1996, Astronomy and Astrophysics Supplement Series, 117, 393, doi: 10.1051/aas:1996164
- Blanton et al. (2005) Blanton, M. R., Schlegel, D. J., Strauss, M. A., et al. 2005, AJ, 129, 2562, doi: 10.1086/429803
- Blom et al. (2014) Blom, C., Forbes, D. A., Foster, C., Romanowsky, A. J., & Brodie, J. P. 2014, MNRAS, 439, 2420, doi: 10.1093/mnras/stu095
- Bonfini et al. (2018) Bonfini, P., González-Martín, O., Fritz, J., et al. 2018, MNRAS, 478, 1161, doi: 10.1093/mnras/sty1087
- Bonoli et al. (2014) Bonoli, S., Mayer, L., & Callegari, S. 2014, MNRAS, 437, 1576, doi: 10.1093/mnras/stt1990
- Buson et al. (2004) Buson, L. M., Bertola, F., Bressan, A., Burstein, D., & Cappellari, M. 2004, A&A, 423, 965, doi: 10.1051/0004-6361:20040282
- Capak et al. (2013) Capak, P. L., Teplitz, H. I., Brooke, T. Y., Laher, R., & Science Center, S. 2013, in American Astronomical Society Meeting Abstracts, Vol. 221, American Astronomical Society Meeting Abstracts #221, 340.06
- Capetti et al. (2005) Capetti, A., Marconi, A., Macchetto, D., & Axon, D. 2005, A&A, 431, 465, doi: 10.1051/0004-6361:20041701
- Carter et al. (1999) Carter, D., Bridges, T. J., & Hau, G. K. T. 1999, MNRAS, 307, 131, doi: 10.1046/j.1365-8711.1999.02586.x
- Carter & Jenkins (1993) Carter, D., & Jenkins, C. R. 1993, MNRAS, 263, 1049, doi: 10.1093/mnras/263.4.1049
- Chabrier (2003) Chabrier, G. 2003, PASA, 115, 763, doi: 10.1086/376392
- Ciambur (2015a) Ciambur, B. C. 2015a, ApJ, 810, 120, doi: 10.1088/0004-637X/810/2/120
- Ciambur (2015b) —. 2015b, ApJ, 810, 120, doi: 10.1088/0004-637X/810/2/120
- Ciambur (2016) —. 2016, PASA, 33, e062, doi: 10.1017/pasa.2016.60
- Ciotti (1991) Ciotti, L. 1991, A&A, 249, 99
- Cirasuolo et al. (2005) Cirasuolo, M., Shankar, F., Granato, G. L., De Zotti, G., & Danese, L. 2005, ApJ, 629, 816, doi: 10.1086/431575
- Combes & Sanders (1981) Combes, F., & Sanders, R. H. 1981, A&A, 96, 164
- Conroy et al. (2009) Conroy, C., Gunn, J. E., & White, M. 2009, ApJ, 699, 486, doi: 10.1088/0004-637X/699/1/486
- Courteau et al. (2014) Courteau, S., Cappellari, M., de Jong, R. S., et al. 2014, Reviews of Modern Physics, 86, 47, doi: 10.1103/RevModPhys.86.47
- Coziol et al. (2009) Coziol, R., Andernach, H., Caretta, C. A., Alamo- Martínez, K. A., & Tago, E. 2009, AJ, 137, 4795, doi: 10.1088/0004-6256/137/6/4795
- Cretton & van den Bosch (1999) Cretton, N., & van den Bosch, F. C. 1999, ApJ, 514, 704, doi: 10.1086/306971
- Croton et al. (2006) Croton, D. J., Springel, V., White, S. D. M., et al. 2006, MNRAS, 365, 11, doi: 10.1111/j.1365-2966.2005.09675.x
- Dalla Bontà et al. (2009) Dalla Bontà, E., Ferrarese, L., Corsini, E. M., et al. 2009, ApJ, 690, 537, doi: 10.1088/0004-637X/690/1/537
- Davis et al. (2018a) Davis, B. L., Graham, A. W., & Cameron, E. 2018a, ApJ, 869, 113, doi: 10.3847/1538-4357/aae820
- Davis et al. (2019) Davis, B. L., Graham, A. W., & Cameron, E. 2019, ApJ, 873, 85, doi: 10.3847/1538-4357/aaf3b8
- Davis et al. (2018b) Davis, T. A., Bureau, M., Onishi, K., et al. 2018b, MNRAS, 473, 3818, doi: 10.1093/mnras/stx2600
- de Vaucouleurs (1969) de Vaucouleurs, G. 1969, Astrophysical Letters, 4, 17
- de Vaucouleurs et al. (1991) de Vaucouleurs, G., de Vaucouleurs, A., Corwin, Herold G., J., et al. 1991, Third Reference Catalogue of Bright Galaxies
- Di Matteo et al. (2008) Di Matteo, T., Colberg, J., Springel, V., Hernquist, L., & Sijacki, D. 2008, ApJ, 676, 33, doi: 10.1086/524921
- Diamond-Stanic & Rieke (2012) Diamond-Stanic, A. M., & Rieke, G. H. 2012, ApJ, 746, 168, doi: 10.1088/0004-637X/746/2/168
- D’Onofrio et al. (1995) D’Onofrio, M., Zaggia, S. R., Longo, G., Caon, N., & Capaccioli, M. 1995, A&A, 296, 319. https://arxiv.org/abs/astro-ph/9410006
- Dressler (1989) Dressler, A. 1989, in Active Galactic Nuclei, Vol. 134, 217
- Dressler & Richstone (1988) Dressler, A., & Richstone, D. O. 1988, ApJ, 324, 701, doi: 10.1086/165930
- Driver et al. (2009) Driver, S. P., Norberg, P., Baldry, I. K., et al. 2009, Astronomy and Geophysics, 50, 5.12, doi: 10.1111/j.1468-4004.2009.50512.x
- Drouart et al. (2014) Drouart, G., De Breuck, C., Vernet, J., et al. 2014, A&A, 566, A53, doi: 10.1051/0004-6361/201323310
- Dubois et al. (2012) Dubois, Y., Devriendt, J., Slyz, A., & Teyssier, R. 2012, MNRAS, 420, 2662, doi: 10.1111/j.1365-2966.2011.20236.x
- Dullo & Graham (2014) Dullo, B. T., & Graham, A. W. 2014, MNRAS, 444, 2700, doi: 10.1093/mnras/stu1590
- Elbert et al. (2018) Elbert, O. D., Bullock, J. S., & Kaplinghat, M. 2018, MNRAS, 473, 1186, doi: 10.1093/mnras/stx1959
- Erwin et al. (2018) Erwin, P., Thomas, J., Saglia, R. P., et al. 2018, MNRAS, 473, 2251, doi: 10.1093/mnras/stx2499
- Erwin et al. (2015) Erwin, P., Saglia, R. P., Fabricius, M., et al. 2015, MNRAS, 446, 4039, doi: 10.1093/mnras/stu2376
- Escudero et al. (2015) Escudero, C. G., Faifer, F. R., Bassino, L. P., Calderón, J. P., & Caso, J. P. 2015, MNRAS, 449, 612, doi: 10.1093/mnras/stv283
- Fabian (1999) Fabian, A. C. 1999, MNRAS, 308, L39, doi: 10.1046/j.1365-8711.1999.03017.x
- Falcón-Barroso et al. (2004) Falcón-Barroso, J., Peletier, R. F., Emsellem, E., et al. 2004, MNRAS, 350, 35, doi: 10.1111/j.1365-2966.2004.07704.x
- Fedorova et al. (2016) Fedorova , E., Vasylenko, A., Hnatyk, B. I., & Zhdanov, V. I. 2016, Astronomische Nachrichten, 337, 96, doi: 10.1002/asna.201512272
- Ferrarese (2002) Ferrarese, L. 2002, ApJ, 578, 90, doi: 10.1086/342308
- Ferrarese et al. (2006) Ferrarese, L., Cote, P., Blakeslee, J. P., et al. 2006, arXiv e-prints, astro. https://arxiv.org/abs/astro-ph/0612139
- Ferrarese & Ford (2005) Ferrarese, L., & Ford, H. 2005, Space Sci. Rev., 116, 523, doi: 10.1007/s11214-005-3947-6
- Ferrarese & Merritt (2000) Ferrarese, L., & Merritt, D. 2000, ApJ, 539, L9, doi: 10.1086/312838
- Ferrers (1877) Ferrers, N. M. 1877, Quart. J. Pure Appl. Math., 14, 1
- Fontanot et al. (2006) Fontanot, F., Monaco, P., Cristiani, S., & Tozzi, P. 2006, MNRAS, 373, 1173, doi: 10.1111/j.1365-2966.2006.11094.x
- Gadotti & Kauffmann (2009a) Gadotti, D. A., & Kauffmann, G. 2009a, MNRAS, 399, 621, doi: 10.1111/j.1365-2966.2009.15328.x
- Gadotti & Kauffmann (2009b) —. 2009b, MNRAS, 399, 621, doi: 10.1111/j.1365-2966.2009.15328.x
- Gadotti et al. (2015) Gadotti, D. A., Seidel, M. K., Sánchez- Blázquez, P., et al. 2015, A&A, 584, A90, doi: 10.1051/0004-6361/201526677
- Gebhardt et al. (2000) Gebhardt, K., Bender, R., Bower, G., et al. 2000, ApJ, 539, L13, doi: 10.1086/312840
- Gebhardt et al. (2003) Gebhardt, K., Richstone, D., Tremaine, S., et al. 2003, ApJ, 583, 92, doi: 10.1086/345081
- Gould (2013) Gould, A. 2013, ArXiv e-prints, arXiv:1303.0834. https://arxiv.org/abs/1303.0834
- Graham (2007a) Graham, A. 2007a, in American Astronomical Society Meeting Abstracts, Vol. 211, 13.27
- Graham (2002) Graham, A. W. 2002, ApJ, 568, L13, doi: 10.1086/340274
- Graham (2004) —. 2004, ApJ, 613, L33, doi: 10.1086/424928
- Graham (2007b) —. 2007b, MNRAS, 379, 711, doi: 10.1111/j.1365-2966.2007.11950.x
- Graham (2008) —. 2008, PASA, 25, 167, doi: 10.1071/AS08013
- Graham (2012) —. 2012, ApJ, 746, 113, doi: 10.1088/0004-637X/746/1/113
- Graham (2016) Graham, A. W. 2016, in Astrophysics and Space Science Library, Vol. 418, Galactic Bulges, ed. E. Laurikainen, R. Peletier, & D. Gadotti, 263
- Graham et al. (2016a) Graham, A. W., Ciambur, B. C., & Savorgnan, G. A. D. 2016a, ApJ, 831, 132, doi: 10.3847/0004-637X/831/2/132
- Graham & Driver (2005) Graham, A. W., & Driver, S. P. 2005, Publications of the Astronomical Society of Australia, 22, 118, doi: 10.1071/AS05001
- Graham & Driver (2007) —. 2007, ApJ, 655, 77, doi: 10.1086/509758
- Graham et al. (2015) Graham, A. W., Dullo, B. T., & Savorgnan, G. A. D. 2015, ApJ, 804, 32, doi: 10.1088/0004-637X/804/1/32
- Graham et al. (2016b) Graham, A. W., Durré, M., Savorgnan, G. A. D., et al. 2016b, ApJ, 819, 43, doi: 10.3847/0004-637X/819/1/43
- Graham & Scott (2013) Graham, A. W., & Scott, N. 2013, ApJ, 764, 151, doi: 10.1088/0004-637X/764/2/151
- Graham & Scott (2015) —. 2015, ApJ, 798, 54, doi: 10.1088/0004-637X/798/1/54
- Graham & Soria (2019) Graham, A. W., & Soria, R. 2019, MNRAS, 484, 794, doi: 10.1093/mnras/sty3398
- Graham et al. (2019) Graham, A. W., Soria, R., & Davis, B. L. 2019, MNRAS, 484, 814, doi: 10.1093/mnras/sty3068
- Graham & Worley (2008) Graham, A. W., & Worley, C. C. 2008, MNRAS, 388, 1708, doi: 10.1111/j.1365-2966.2008.13506.x
- Graham et al. (2003) Graham, A. W., et al. 2003, AJ, 125, 2951, doi: 10.1086/375320
- Graham et al. (2011) —. 2011, MNRAS, 412, 2211, doi: 10.1111/j.1365-2966.2010.18045.x
- Gültekin et al. (2009a) Gültekin, K., Richstone, D. O., Gebhardt, K., et al. 2009a, ApJ, 698, 198, doi: 10.1088/0004-637X/698/1/198
- Gültekin et al. (2009b) —. 2009b, ApJ, 695, 1577, doi: 10.1088/0004-637X/695/2/1577
- Hailey et al. (2018) Hailey, C. J., et al. 2018, Nature, 556, 70, doi: 10.1038/nature25029
- Halliday (1998) Halliday, C. 1998, PhD thesis, -
- Hartmann (2011) Hartmann, M. 2011, PhD thesis, University of Central Lancashire
- Hartmann et al. (2014) Hartmann, M., Debattista, V. P., Cole, D. R., et al. 2014, MNRAS, 441, 1243, doi: 10.1093/mnras/stu627
- Hirano et al. (2017) Hirano, S., et al. 2017, Science, 357, 1375, doi: 10.1126/science.aai9119
- Ho (1999) Ho, L. 1999, in Astrophysics and Space Science Library, Vol. 234, Observational Evidence for the Black Holes in the Universe, ed. S. K. Chakrabarti, 157
- Hobbs & Dai (2017) Hobbs, G., & Dai, S. 2017, arXiv e-prints, arXiv:1707.01615. https://arxiv.org/abs/1707.01615
- Hopkins et al. (2006) Hopkins, P. F., Hernquist, L., Cox, T. J., et al. 2006, The Astrophysical Journal Supplement Series, 163, 1, doi: 10.1086/499298
- Hu (2008) Hu, J. 2008, MNRAS, 386, 2242, doi: 10.1111/j.1365-2966.2008.13195.x
- Inayoshi & Haiman (2016) Inayoshi, K., & Haiman, Z. 2016, ApJ, 828, 110, doi: 10.3847/0004-637X/828/2/110
- Jarrett et al. (2003) Jarrett, T. H., Chester, T., Cutri, R., Schneider, S. E., & Huchra, J. P. 2003, AJ, 125, 525, doi: 10.1086/345794
- Jedrzejewski (1987a) Jedrzejewski, R. I. 1987a, MNRAS, 226, 747, doi: 10.1093/mnras/226.4.747
- Jedrzejewski (1987b) Jedrzejewski, R. I. 1987b, in Structure and Dynamics of Elliptical Galaxies, ed. P. T. de Zeeuw, Vol. 127, 37–46
- Jiang et al. (2012) Jiang, F., van Dokkum, P., Bezanson, R., & Franx, M. 2012, ApJ, 749, L10, doi: 10.1088/2041-8205/749/1/L10
- Jonas (2007) Jonas, J. 2007, in From Planets to Dark Energy: the Modern Radio Universe, 7
- Kannappan & Gawiser (2007) Kannappan, S. J., & Gawiser, E. 2007, ApJ, 657, L5, doi: 10.1086/512974
- Khandai et al. (2012) Khandai, N., Feng, Y., DeGraf, C., Di Matteo, T., & Croft, R. A. C. 2012, MNRAS, 423, 2397, doi: 10.1111/j.1365-2966.2012.21047.x
- Kormendy (2000) Kormendy, J. 2000, Elliptical Galaxies With Nuclear Disks of Stars: Black Hole Search and Stellar Populations, HST Proposal
- Kormendy & Bender (2012) Kormendy, J., & Bender, R. 2012, The Astrophysical Journal Supplement Series, 198, 2, doi: 10.1088/0067-0049/198/1/2
- Kormendy et al. (2011) Kormendy, J., Bender, R., & Cornell, M. E. 2011, Nature, 469, 374, doi: 10.1038/nature09694
- Kormendy & Ho (2013) Kormendy, J., & Ho, L. C. 2013, Annual Review of Astronomy and Astrophysics, 51, 511, doi: 10.1146/annurev-astro-082708-101811
- Kormendy & Richstone (1995) Kormendy, J., & Richstone, D. 1995, ARA&A, 33, 581, doi: 10.1146/annurev.aa.33.090195.003053
- Kormendy et al. (1996) Kormendy, J., Bender, R., Magorrian, J., et al. 1996, in American Astronomical Society Meeting Abstracts, Vol. 189, 111.01
- Krajnović et al. (2009) Krajnović, D., McDermid, R. M., Cappellari, M., & Davies, R. L. 2009, MNRAS, 399, 1839, doi: 10.1111/j.1365-2966.2009.15415.x
- Krajnović et al. (2018) Krajnović, D., Cappellari, M., McDermid, R. M., et al. 2018, MNRAS, 477, 3030, doi: 10.1093/mnras/sty778
- Kuo et al. (2011) Kuo, C. Y., Braatz, J. A., Condon, J. J., et al. 2011, ApJ, 727, 20, doi: 10.1088/0004-637X/727/1/20
- Laine et al. (2003) Laine, S., van der Marel, R. P., Lauer, T. R., et al. 2003, AJ, 125, 478, doi: 10.1086/345823
- LaMassa et al. (2013) LaMassa, S. M., et al. 2013, ApJ, 765, L33, doi: 10.1088/2041-8205/765/2/L33
- Laor (1998) Laor, A. 1998, ApJ, 505, L83, doi: 10.1086/311619
- Laor (2001) —. 2001, ApJ, 553, 677, doi: 10.1086/320989
- Läsker et al. (2014) Läsker, R., Ferrarese, L., van de Ven, G., & Shankar, F. 2014, ApJ, 780, 70, doi: 10.1088/0004-637X/780/1/70
- Laurikainen et al. (2005) Laurikainen, E., Salo, H., & Buta, R. 2005, MNRAS, 362, 1319, doi: 10.1111/j.1365-2966.2005.09404.x
- Laurikainen et al. (2007) Laurikainen, E., Salo, H., Buta, R., & Knapen, J. H. 2007, MNRAS, 381, 401, doi: 10.1111/j.1365-2966.2007.12299.x
- Laurikainen et al. (2009) —. 2009, ApJ, 692, L34, doi: 10.1088/0004-637X/692/1/L34
- Laurikainen et al. (2011) —. 2011, MNRAS, 418, 1452, doi: 10.1111/j.1365-2966.2011.19283.x
- Levine et al. (2009) Levine, D., Wu, X., Good, J., et al. 2009, in Astronomical Data Analysis Software and Systems XVIII, ed. D. A. Bohlender, D. Durand, & P. Dowler, Vol. 411, 29
- Liller (1966) Liller, M. H. 1966, ApJ, 146, 28, doi: 10.1086/148857
- Longo et al. (1994) Longo, G., Zaggia, S. R., Busarello, G., & Richter, G. 1994, Astronomy and Astrophysics Supplement Series, 105, 433
- Lynden-Bell (1969) Lynden-Bell, D. 1969, Nature, 223, 690, doi: 10.1038/223690a0
- Lynden-Bell & Rees (1971) Lynden-Bell, D., & Rees, M. J. 1971, MNRAS, 152, 461, doi: 10.1093/mnras/152.4.461
- Magorrian et al. (1998) Magorrian, J., Tremaine, S., Richstone, D., et al. 1998, AJ, 115, 2285, doi: 10.1086/300353
- Mapelli (2016) Mapelli, M. 2016, MNRAS, 459, 3432, doi: 10.1093/mnras/stw869
- Mapelli et al. (2012) Mapelli, M., et al. 2012, A&A, 542, A102, doi: 10.1051/0004-6361/201118444
- Marconi et al. (2004) Marconi, A., Risaliti, G., Gilli, R., et al. 2004, MNRAS, 351, 169, doi: 10.1111/j.1365-2966.2004.07765.x
- Martín-Navarro et al. (2015) Martín-Navarro, I., La Barbera, F., Vazdekis, A., et al. 2015, MNRAS, 451, 1081, doi: 10.1093/mnras/stv1022
- Martinez-Valpuesta et al. (2007) Martinez-Valpuesta, I., Knapen, J. H., & Buta, R. 2007, AJ, 134, 1863, doi: 10.1086/522205
- Mayer et al. (2007) Mayer, L., et al. 2007, Science, 316, 1874, doi: 10.1126/science.1141858
- Mazzalay et al. (2016) Mazzalay, X., Thomas, J., Saglia, R. P., et al. 2016, MNRAS, 462, 2847, doi: 10.1093/mnras/stw1802
- McConnell et al. (2011) McConnell, N. J., Ma, C.-P., Graham, J. R., et al. 2011, ApJ, 728, 100, doi: 10.1088/0004-637X/728/2/100
- Meidt et al. (2014) Meidt, S. E., Schinnerer, E., van de Ven, G., et al. 2014, ApJ, 788, 144, doi: 10.1088/0004-637X/788/2/144
- Merritt (2006) Merritt, D. 2006, Memorie della Societa Astronomica Italiana, 77, 750. https://arxiv.org/abs/astro-ph/0602353
- Mezcua (2017) Mezcua, M. 2017, International Journal of Modern Physics D, 26, 1730021, doi: 10.1142/S021827181730021X
- Miller (2003) Miller, M. C. 2003, in American Institute of Physics Conference Series, Vol. 686, The Astrophysics of Gravitational Wave Sources, ed. J. M. Centrella, 125–134
- Mitchell et al. (2013) Mitchell, P. D., Lacey, C. G., Baugh, C. M., & Cole, S. 2013, MNRAS, 435, 87, doi: 10.1093/mnras/stt1280
- Moffat (1969) Moffat, A. F. J. 1969, A&A, 3, 455
- Morganti (2017) Morganti, R. 2017, Ap&SS, 4, 42, doi: 10.3389/fspas.2017.00042
- Muñoz-Mateos et al. (2013) Muñoz-Mateos, J. C., Sheth, K., Gil de Paz, A., et al. 2013, ApJ, 771, 59, doi: 10.1088/0004-637X/771/1/59
- Muñoz-Mateos et al. (2016) —. 2016, ApJ, 818, 101, doi: 10.3847/0004-637X/818/1/101
- Natarajan & Treister (2009) Natarajan, P., & Treister, E. 2009, MNRAS, 393, 838, doi: 10.1111/j.1365-2966.2008.13864.x
- Natarajan & Volonteri (2012) Natarajan, P., & Volonteri, M. 2012, MNRAS, 422, 2051, doi: 10.1111/j.1365-2966.2012.20708.x
- Neistein & Netzer (2014) Neistein, E., & Netzer, H. 2014, MNRAS, 437, 3373, doi: 10.1093/mnras/stt2130
- Nemmen et al. (2012) Nemmen, R. S., Georganopoulos, M., Guiriec, S., et al. 2012, Science, 338, 1445, doi: 10.1126/science.1227416
- Nguyen et al. (2017) Nguyen, D. D., Seth, A. C., den Brok, M., et al. 2017, ApJ, 836, 237, doi: 10.3847/1538-4357/aa5cb4
- Oh et al. (2008) Oh, S.-H., de Blok, W. J. G., Walter, F., Brinks, E., & Kennicutt, Robert C., J. 2008, AJ, 136, 2761, doi: 10.1088/0004-6256/136/6/2761
- Onishi et al. (2017) Onishi, K., Iguchi, S., Davis, T. A., et al. 2017, MNRAS, 468, 4663, doi: 10.1093/mnras/stx631
- Pignatelli et al. (2001) Pignatelli, E., Salucci, P., & Danese, L. 2001, MNRAS, 320, 124, doi: 10.1046/j.1365-8711.2001.03942.x
- Planck Collaboration et al. (2018) Planck Collaboration, Aghanim, N., Akrami, Y., et al. 2018, ArXiv e-prints, arXiv:1807.06209. https://arxiv.org/abs/1807.06209
- Press et al. (1992) Press, W. H., Teukolsky, S. A., Vetterling, W. T., & Flannery, B. P. 1992, Numerical recipes in FORTRAN. The art of scientific computing
- Querejeta et al. (2015) Querejeta, M., Meidt, S. E., Schinnerer, E., et al. 2015, The Astrophysical Journal Supplement Series, 219, 5, doi: 10.1088/0067-0049/219/1/5
- Quillen et al. (2000) Quillen, A. C., Bower, G. A., & Stritzinger, M. 2000, The Astrophysical Journal Supplement Series, 128, 85, doi: 10.1086/313374
- Reines et al. (2011) Reines, A. E., Sivakoff, G. R., Johnson, K. E., & Brogan, C. L. 2011, Nature, 470, 66, doi: 10.1038/nature09724
- Richings et al. (2011) Richings, A. J., Uttley, P., & Körding, E. 2011, MNRAS, 415, 2158, doi: 10.1111/j.1365-2966.2011.18845.x
- Roediger & Courteau (2015) Roediger, J. C., & Courteau, S. 2015, MNRAS, 452, 3209, doi: 10.1093/mnras/stv1499
- Rubin (1995) Rubin, V. 1995, Spectroscopy of the Rapidly Rotating Nuclear Disk in the Virgo s0 NGC4526, HST Proposal
- Rusli et al. (2013a) Rusli, S. P., Erwin, P., Saglia, R. P., et al. 2013a, AJ, 146, 160, doi: 10.1088/0004-6256/146/6/160
- Rusli et al. (2013b) Rusli, S. P., Thomas, J., Saglia, R. P., et al. 2013b, AJ, 146, 45, doi: 10.1088/0004-6256/146/3/45
- Sabra et al. (2015) Sabra, B. M., Saliba, C., Abi Akl, M., & Chahine, G. 2015, ApJ, 803, 5, doi: 10.1088/0004-637X/803/1/5
- Saglia et al. (2016) Saglia, R. P., Opitsch, M., Erwin, P., et al. 2016, ApJ, 818, 47, doi: 10.3847/0004-637X/818/1/47
- Saha et al. (2018) Saha, K., Graham, A. W., & Rodríguez-Herranz, I. 2018, ApJ, 852, 133, doi: 10.3847/1538-4357/aa9ed8
- Salo et al. (2015) Salo, H., Laurikainen, E., Laine, J., et al. 2015, The Astrophysical Journal Supplement Series, 219, 4, doi: 10.1088/0067-0049/219/1/4
- Salucci et al. (2000) Salucci, P., et al. 2000, MNRAS, 317, 488, doi: 10.1046/j.1365-8711.2000.03622.x
- Sandage (1961) Sandage, A. 1961, The Hubble Atlas of Galaxies
- Sani et al. (2011) Sani, E., et al. 2011, MNRAS, 413, 1479, doi: 10.1111/j.1365-2966.2011.18229.x
- Sarzi et al. (2001) Sarzi, M., Rix, H.-W., Shields, J. C., et al. 2001, ApJ, 550, 65, doi: 10.1086/319724
- Satyapal et al. (2014) Satyapal, S., Secrest, N. J., McAlpine, W., et al. 2014, ApJ, 784, 113, doi: 10.1088/0004-637X/784/2/113
- Savorgnan & Graham (2016a) Savorgnan, G. A. D., & Graham, A. W. 2016a, ApJS, 222, 10, doi: 10.3847/0067-0049/222/1/10
- Savorgnan & Graham (2016b) —. 2016b, MNRAS, 457, 320, doi: 10.1093/mnras/stv2713
- Savorgnan et al. (2016) Savorgnan, G. A. D., et al. 2016, ApJ, 817, 21, doi: 10.3847/0004-637X/817/1/21
- Scharwächter et al. (2013) Scharwächter, J., McGregor, P. J., Dopita, M. A., & Beck, T. L. 2013, MNRAS, 429, 2315, doi: 10.1093/mnras/sts502
- Schombert & Smith (2012) Schombert, J., & Smith, A. K. 2012, Publications of the Astronomical Society of Australia, 29, 174, doi: 10.1071/AS11059
- Schramm et al. (2013) Schramm, M., Silverman, J. D., Greene, J. E., et al. 2013, ApJ, 773, 150, doi: 10.1088/0004-637X/773/2/150
- Schulze & Gebhardt (2011) Schulze, A., & Gebhardt, K. 2011, ApJ, 729, 21, doi: 10.1088/0004-637X/729/1/21
- Scott et al. (2013) Scott, N., Graham, A. W., & Schombert, J. 2013, ApJ, 768, 76, doi: 10.1088/0004-637X/768/1/76
- Secrest et al. (2012) Secrest, N. J., Satyapal, S., Gliozzi, M., et al. 2012, ApJ, 753, 38, doi: 10.1088/0004-637X/753/1/38
- Seigar et al. (2007) Seigar, M. S., Graham, A. W., & Jerjen, H. 2007, MNRAS, 378, 1575, doi: 10.1111/j.1365-2966.2007.11899.x
- Sérsic (1963) Sérsic, J. L. 1963, BAAA, 6, 41
- Seymour et al. (2012) Seymour, N., Altieri, B., De Breuck, C., et al. 2012, ApJ, 755, 146, doi: 10.1088/0004-637X/755/2/146
- Shankar et al. (2009) Shankar, F., Weinberg, D. H., & Miralda-Escudé, J. 2009, ApJ, 690, 20, doi: 10.1088/0004-637X/690/1/20
- Shankar et al. (2016) Shankar, F., Bernardi, M., Sheth, R. K., et al. 2016, MNRAS, 460, 3119, doi: 10.1093/mnras/stw678
- Shannon et al. (2015) Shannon, R. M., Ravi, V., Lentati, L. T., et al. 2015, Science, 349, 1522, doi: 10.1126/science.aab1910
- Shen & Gebhardt (2010) Shen, J., & Gebhardt, K. 2010, ApJ, 711, 484, doi: 10.1088/0004-637X/711/1/484
- Sheth et al. (2010) Sheth, K., Regan, M., Hinz, J. L., et al. 2010, Publications of the Astronomical Society of the Pacific, 122, 1397, doi: 10.1086/657638
- Siemens (2019) Siemens, X. 2019, in American Astronomical Society Meeting Abstracts, Vol. 233, American Astronomical Society Meeting Abstracts #233, 149.24
- Simmons et al. (2013) Simmons, B. D., Lintott, C., Schawinski, K., et al. 2013, MNRAS, 429, 2199, doi: 10.1093/mnras/sts491
- Springel et al. (2005) Springel, V., White, S. D. M., Jenkins, A., et al. 2005, Nature, 435, 629, doi: 10.1038/nature03597
- Stappers & Kramer (2011) Stappers, B., & Kramer, M. 2011, in American Astronomical Society Meeting Abstracts, Vol. 217, American Astronomical Society Meeting Abstracts #217, 124.04
- Taylor et al. (2011) Taylor, E. N., Hopkins, A. M., Baldry, I. K., et al. 2011, MNRAS, 418, 1587, doi: 10.1111/j.1365-2966.2011.19536.x
- Thomas et al. (2016) Thomas, J., Ma, C.-P., McConnell, N. J., et al. 2016, Nature, 532, 340, doi: 10.1038/nature17197
- Tolman (1930) Tolman, R. C. 1930, Proceedings of the National Academy of Science, 16, 511, doi: 10.1073/pnas.16.7.511
- Tremaine et al. (2002) Tremaine, S., Gebhardt, K., Bender, R., et al. 2002, ApJ, 574, 740, doi: 10.1086/341002
- Trujillo et al. (2004) Trujillo, I., Erwin, P., Asensio Ramos, A., & Graham, A. W. 2004, AJ, 127, 1917, doi: 10.1086/382712
- van den Bosch (2016) van den Bosch, R. C. E. 2016, ApJ, 831, 134, doi: 10.3847/0004-637X/831/2/134
- van der Marel & van den Bosch (1998) van der Marel, R. P., & van den Bosch, F. C. 1998, AJ, 116, 2220, doi: 10.1086/300593
- Walsh et al. (2013) Walsh, J. L., Barth, A. J., Ho, L. C., & Sarzi, M. 2013, ApJ, 770, 86, doi: 10.1088/0004-637X/770/2/86
- Walsh et al. (2017) Walsh, J. L., van den Bosch, R. C. E., Gebhardt, K., et al. 2017, ApJ, 835, 208, doi: 10.3847/1538-4357/835/2/208
- Wandel (1999) Wandel, A. 1999, ApJ, 519, L39, doi: 10.1086/312106
- Wolfe & Burbidge (1970) Wolfe, A. M., & Burbidge, G. R. 1970, ApJ, 161, 419, doi: 10.1086/150549
- Wu et al. (2010) Wu, X., Roby, T., & Ly, L. 2010, in Astronomical Data Analysis Software and Systems XIX, ed. Y. Mizumoto, K. I. Morita, & M. Ohishi, Vol. 434, 14
- Wyithe & Loeb (2003) Wyithe, J. S. B., & Loeb, A. 2003, ApJ, 595, 614, doi: 10.1086/377475
- Yang et al. (2017) Yang, X., Yang, J., Paragi, Z., et al. 2017, MNRAS, 464, L70, doi: 10.1093/mnrasl/slw160
- Yee (1992) Yee, H. K. C. 1992, in Astronomical Society of the Pacific Conference Series, Vol. 31, Relationships Between Active Galactic Nuclei and Starburst Galaxies, ed. A. V. Filippenko, 417
- Yıldırım et al. (2015) Yıldırım, A., van den Bosch, R. C. E., van de Ven, G., et al. 2015, MNRAS, 452, 1792, doi: 10.1093/mnras/stv1381
- York et al. (2000) York, D. G., Adelman, J., Anderson, John E., J., et al. 2000, AJ, 120, 1579, doi: 10.1086/301513
Appendix A Surface Brightness Profiles for Early-type Galaxies
Here we provide the major-axis and equivalent-axis (i.e. geometric mean axis ) surface brightness profiles (AB magnitude system) for the 41 ETGs that we modeled (apart from NGC 4762, Figure 3) . Magnitudes and stellar masses of these galaxies, and their spheroids are presented in Table 4 in the main paper. The current paper does not directly use the parameters from our decomposition of these light profiles; however, we intend to use them in our upcoming work, where we will tabulate them there.
A.1 Light profiles from Spitzer m images
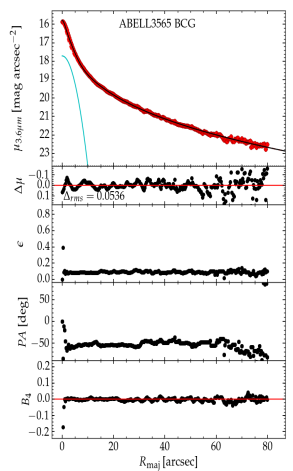
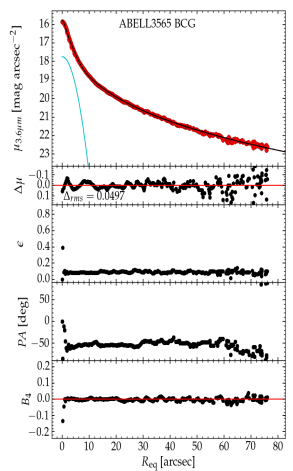
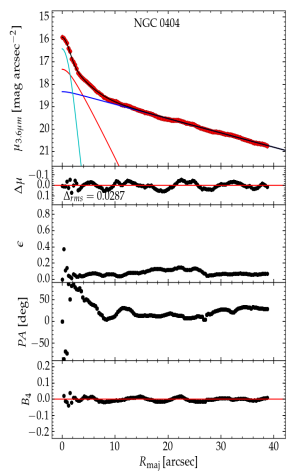
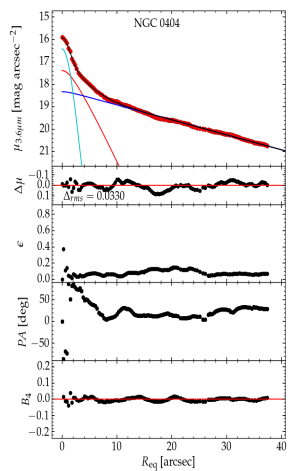

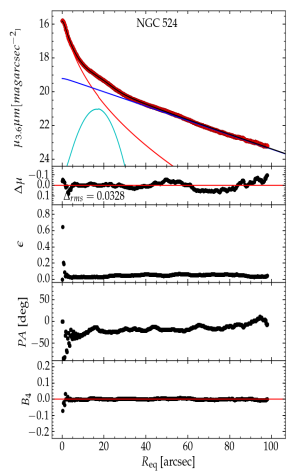
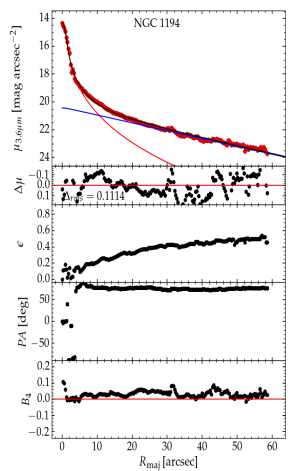
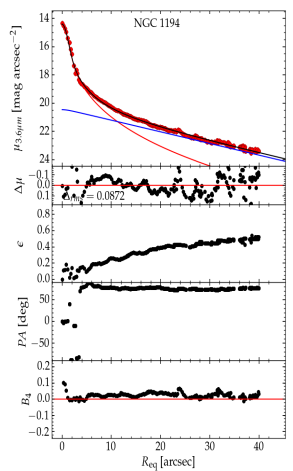
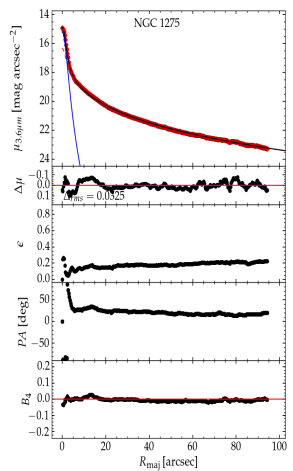

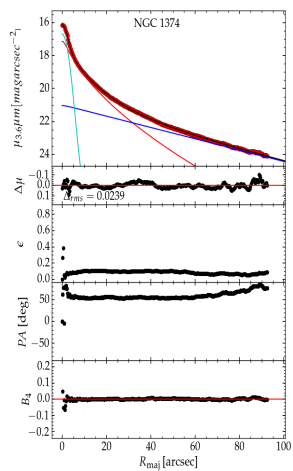
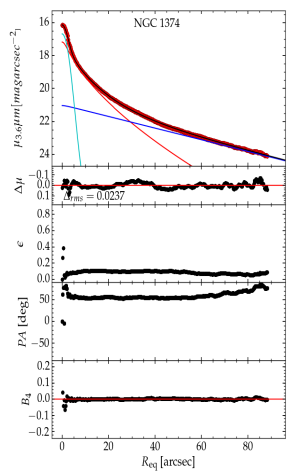
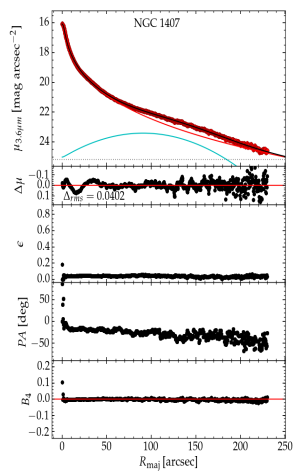
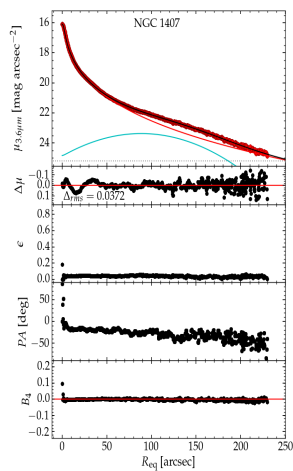

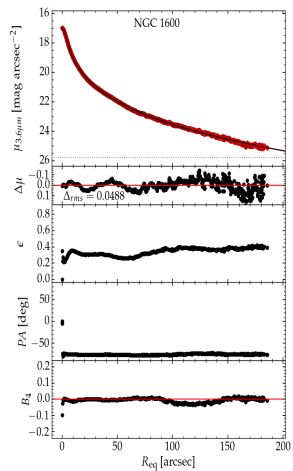
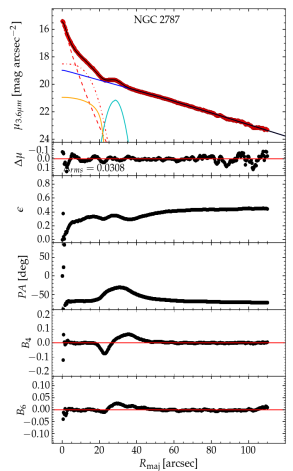

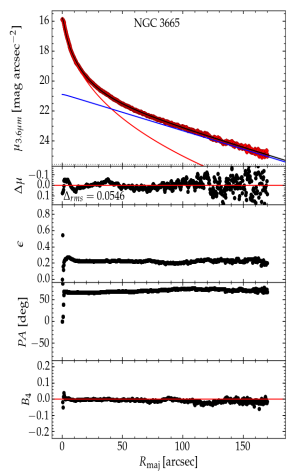
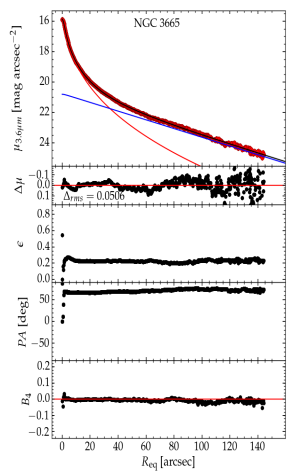

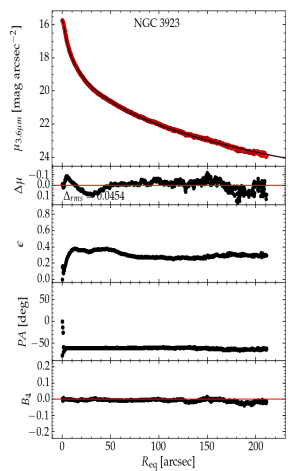
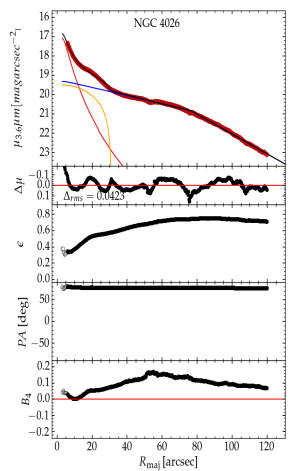
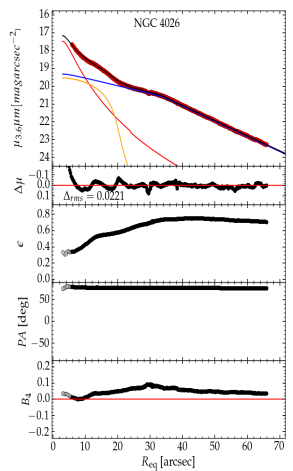
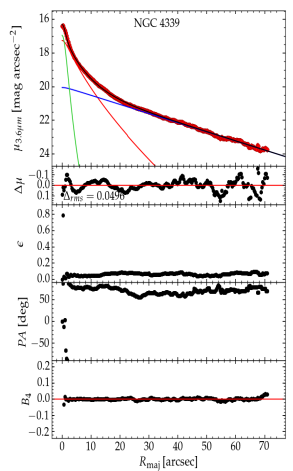
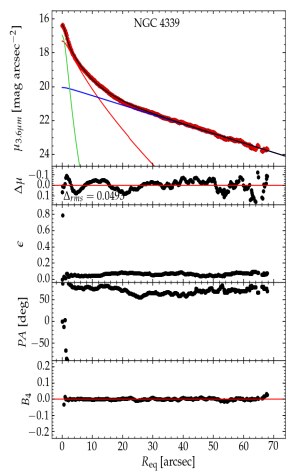
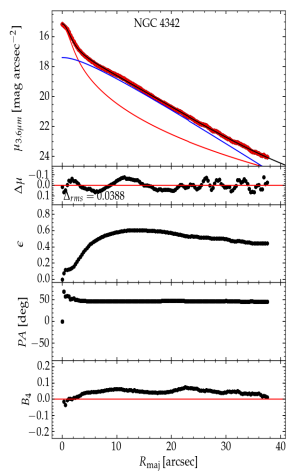
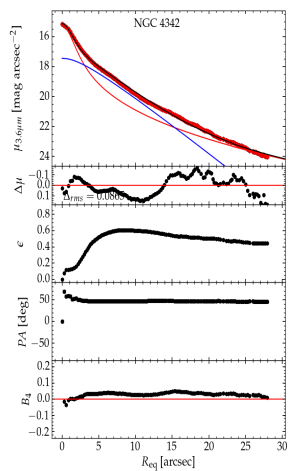
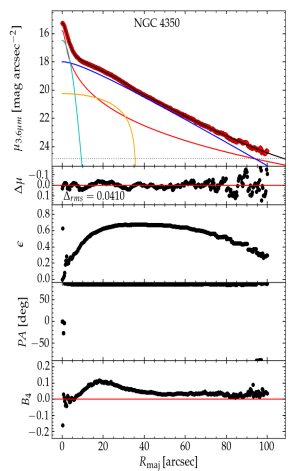
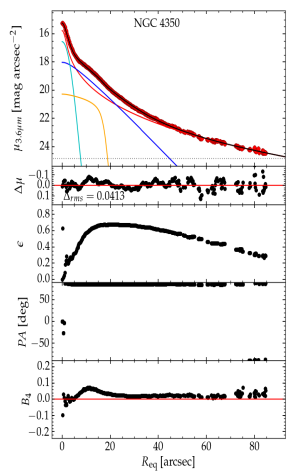
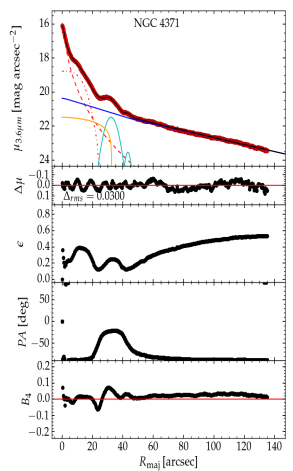
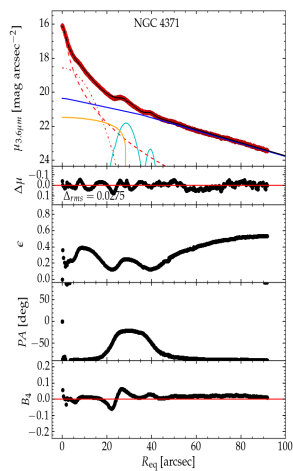
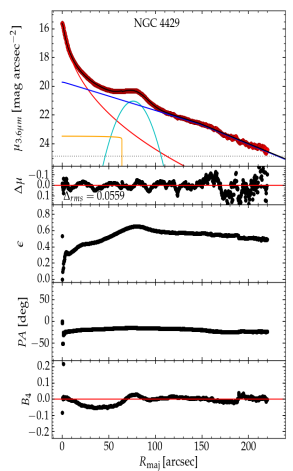
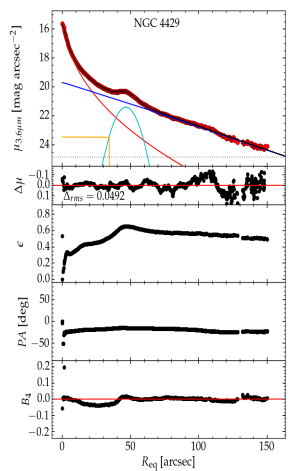
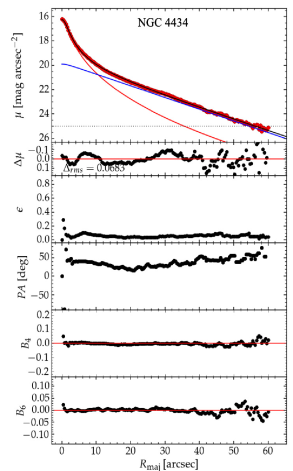

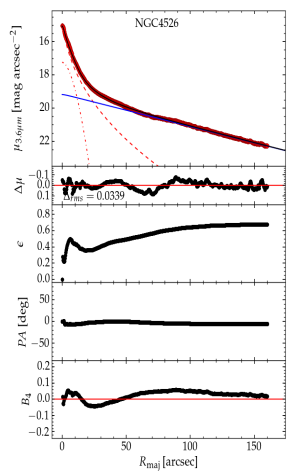
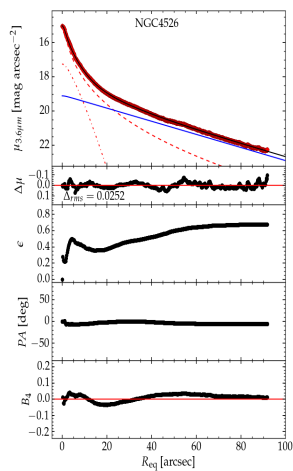
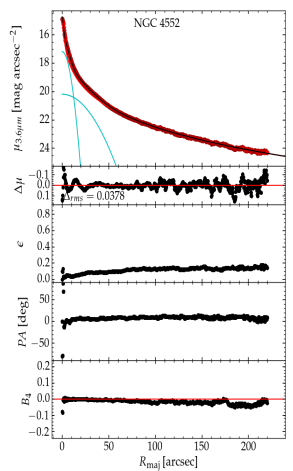
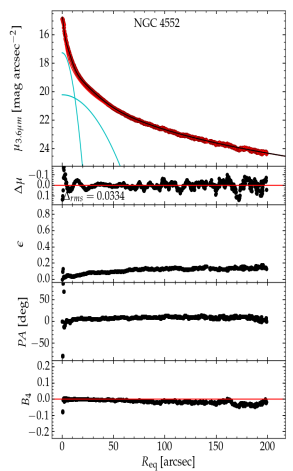

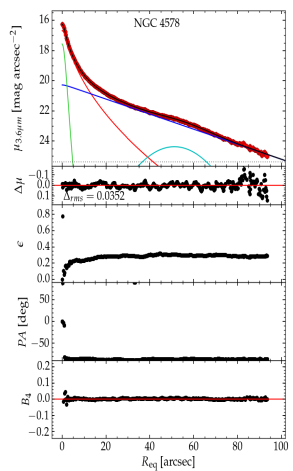
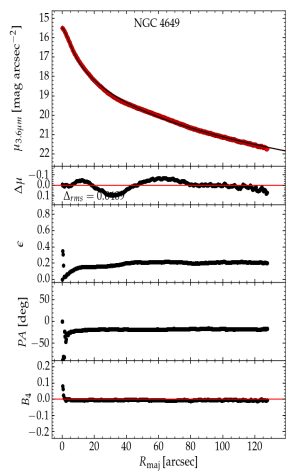

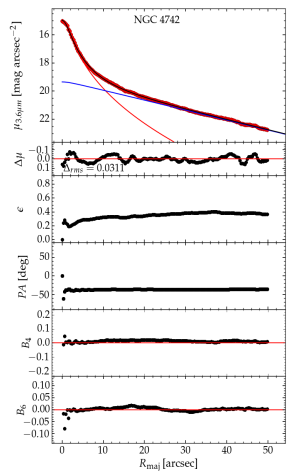
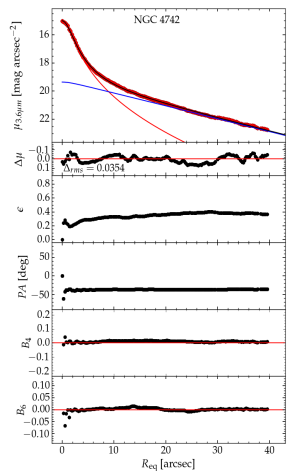
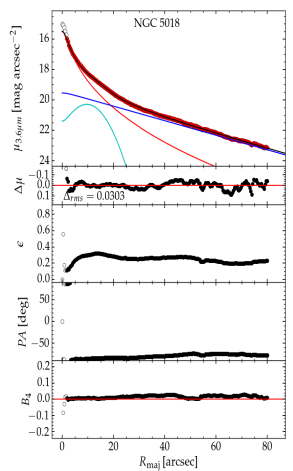
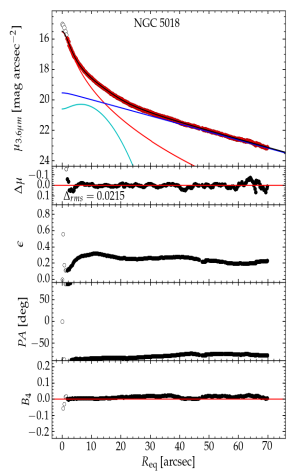

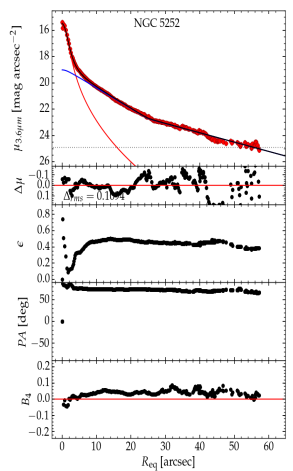
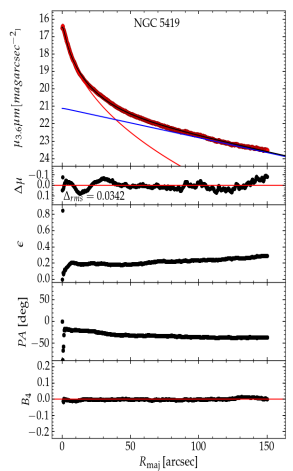

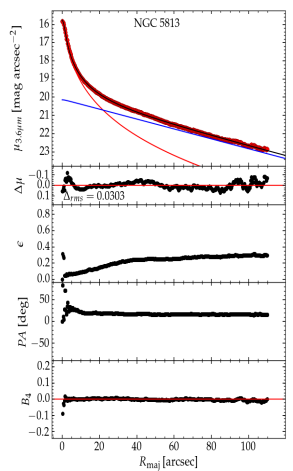

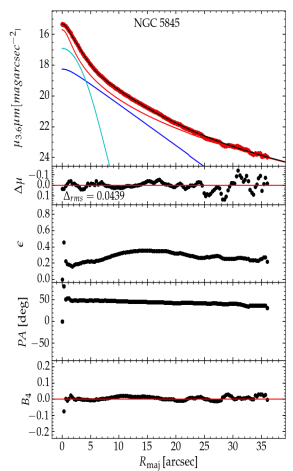
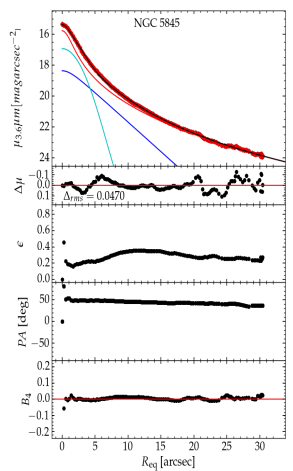
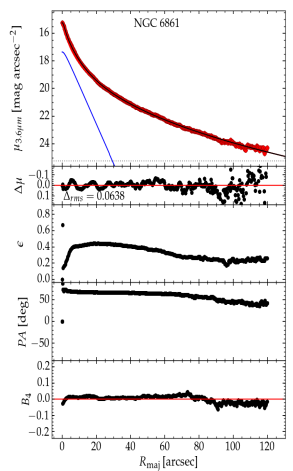
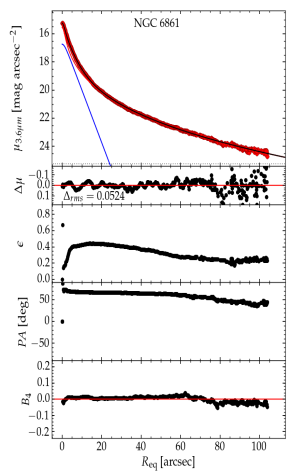
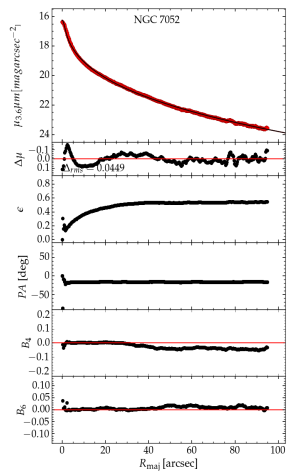

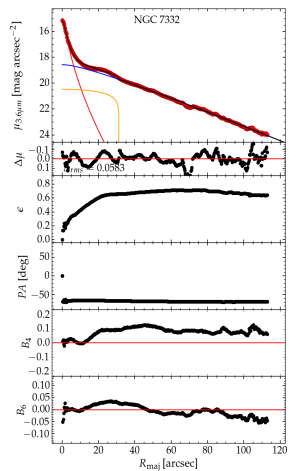
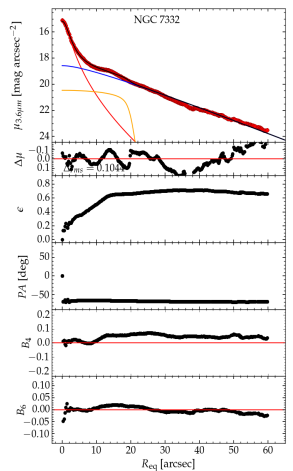
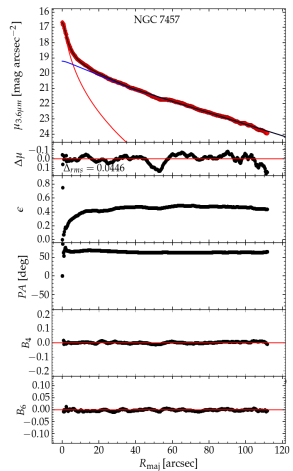
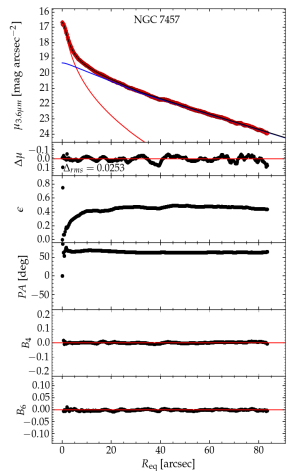
A.2 Light profile from -band images (AB mag)
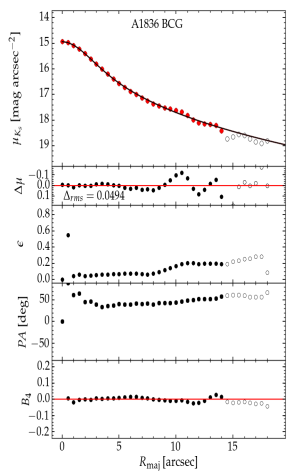


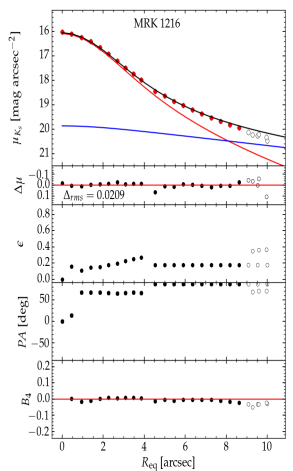
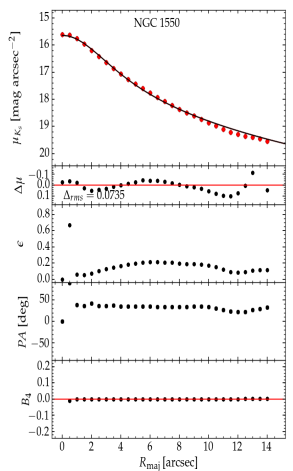

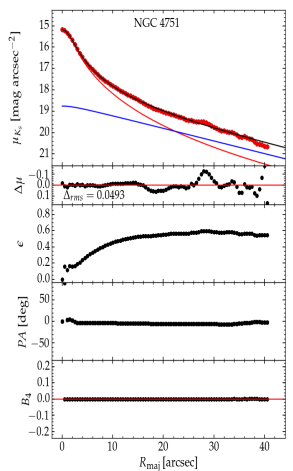

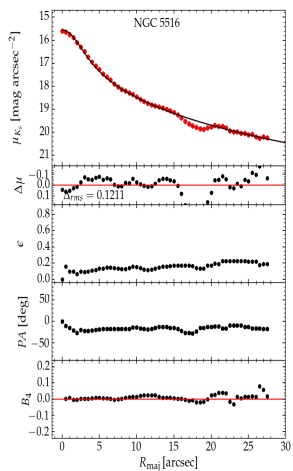
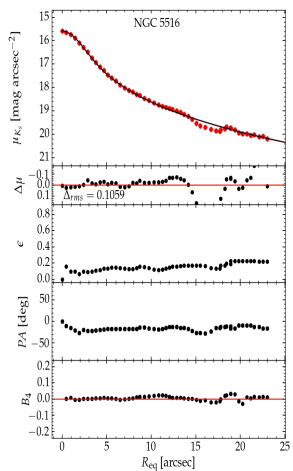
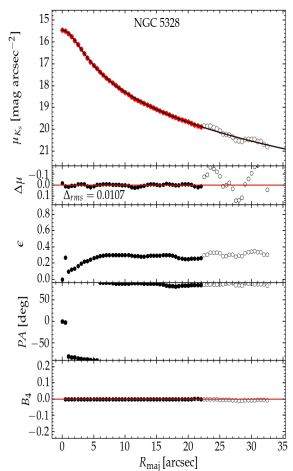
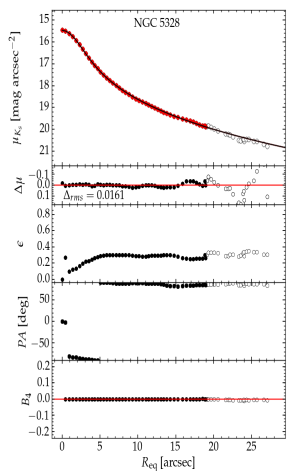
A.3 Light profile from SDSS -band images (AB mag)