Astro2020 Science White Paper
UV Diagnostics of Galaxies from the Peak of Star-Formation to the Epoch of Reionization
Thematic Areas: Planetary Systems Star and Planet Formation Formation and Evolution of Compact Objects ✓ Cosmology and Fundamental Physics Stars and Stellar Evolution Resolved Stellar Populations and their Environments ✓ Galaxy Evolution Multi-Messenger Astronomy and Astrophysics
Principal Author:
Name: Casey Papovich Institution: Texas A&M University, College Station, Texas, 77843-4242 Email: papovich@tamu.edu Phone: 979-862-2704
Co-authors: Dan Stark (University of Arizona), Steve Finkelstein (University of Texas at Austin), Swara Ravindranath (STScI), Danielle Berg (The Ohio State University), Marusa Bradac (UC Davis), Mark Dickinson (NOAO), Ryan Endsley (University of Arizona), Dawn Erb (University of Wisconsin-Milwaukee), Nimish Hathi (STScI), Taylor Hutchison (Texas A&M University), Bethan James (STScI), Intae Jung (University of Texas at Austin), Jeyhan Kartaltepe (Rochester Institute of Technology), Anton Koekemoer (STScI), Ramesh Mainali (University of Arizona), Sally Oey (University of Michigan), Naveen Reddy (UC Riverside), Jane Rigby (NASA Goddard), Alice Shapley (UCLA), Charles Steidel (Caltech), Tommaso Treu (UCLA)
Abstract:
The rest-frame UV emission from massive stars contains a wealth of information about the physical nature and conditions of star formation in galaxies. Using studies of the rest-frame UV, the past decade has witnessed the beginning of knowledge about the existence and properties of galaxies during the first few billion years after the Big Bang. This period of history corresponds to the formation of the first stars, the rapid formation of galaxy stellar populations, the reionization of the IGM, the production and dissemination of heavy elements, and the formation of the first black holes. Massive stars in these galaxies drive all of these events, and their light dominates the spectral energy distributions of galaxies. As we look to the 2020s, fundamental questions remain about the nature of these stellar populations and their evolution, from just before the peak of the cosmic star formation density (), up to the epoch of reionization (). This next decade will provide transformative gains both in our ability to identify star-forming galaxies and accreting supermassive black holes at these early epochs with imaging surveys in the rest-frame UV (e.g., LSST, WFIRST). Ground-based, rest-frame UV spectroscopy on 20 m-class telescopes (e.g., GMT/TMT) offers the ability to investigate the astrophysical conditions in galaxies at the earliest cosmic times. This includes studies of the evolution in galaxy stellar populations, gas ionization (temperature, pressure), metallicity, and interstellar (and circumgalactic) gas kinematics and covering fractions. In this white paper, we describe the scientific prospects and the requirements for research in this area.
1 Rest-frame UV Properties of High-Redshift Galaxies
Measuring the evolution of massive stars and stellar populations is the key to understanding star-formation and ionization in the early Universe. The light from massive stars dominates all facets that we see in star-forming galaxies including the direct rest-frame UV continuum (1500 Å) from their photospheres, the nebular continuum and emission lines from H ii regions they ionize, the rest optical/near-IR (0.4-2 m) emission from their post-main sequence supergiants, and their far-IR reradiated emission from dust (100 m). Massive stars are the leading producer of hard, H-ionizing photons, which drive the reionization of the IGM and produces the last major “phase change” in the Universe. Core-collapse SNe from massive stars are responsible for the production of nearly all heavy elements (C, O, …, Fe), particularly in the first few billion years (prior to the onset of SN Ia or planetary nebula). Radiation from massive stars and energy/momentum from their SNe explosions drive winds, which distributes metals and sets the kinematics and structure of the ISM/CGM. The first massive stars may also produce the first black holes. Therefore, to understand the birth and adolescent phases of galaxies requires that we can describe the astrophysical properties of their massive stars.
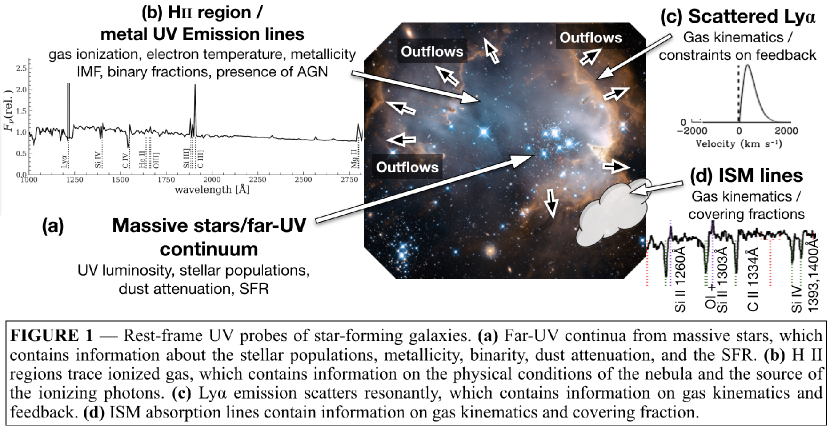
The rest-frame UV spectra of star-forming regions contain a rich variety of information about the massive stars and the physical conditions in galaxies (Figure 1). These will be accessible to ground–based telescopes in the 2020s for galaxies from the peak of the cosmic star-formation rate (SFR) density () out to the epoch of reionization (EoR; ), allowing us to constrain how the evolution of gas, star-formation, and ionization occurs in galaxies.
The UV spectra contain many emission lines from heavy elements (i.e., metals), including nebular emission from C iii] , 1909, Si iii] 1883,1892, O iii] 1661,1666, He ii 1640, and C iv 1548, 1550. These trace the physical conditions and elemental abundances in the gas, and constrain the source of ionization in these galaxies (Feltre et al., 2016; Gutkin et al., 2016; Jaskot & Ravindranath, 2016). Nebular UV metal lines also provide an estimate of the systemic redshift, which when combined with observations of Ly emission and/or absorption features in the UV constrain the properties of stellar winds, and ISM gas kinematics/structure and covering fraction (e.g., Shapley et al., 2003; Jones et al., 2013; Schenker et al., 2013; Erb et al., 2014; Reddy et al., 2016; Sobral et al., 2018). The combination of UV emission lines and UV continuum contain information about the stellar and gas–phase metallicities, gas density, the high-mass end of the IMF, test for the effects of stellar binaries (and binary fractions), and the origin/nature of the ionizing sources (AGN, hot stars, X-ray binaries, see, e.g., the BPASS models of Eldridge et al. 2017; and Sommariva et al. 2012; Steidel et al. 2016; Tang et al. 2018; Hutchison et al. 2019). Modeling the UV continuum and emission lines also constrain the value of (the ratio of the number of ionizing photons (13.6 eV) to non-ionizing radiation) as this depends sensitively on the properties of the population of massive stars (age, metallicity, binary fractions, IMF). Comparing to direct detections of the escaping H-ionizing radiation yields measurements of the UV escape fraction (; e.g., Steidel et al., 2018). Understanding how correlates with galaxy properties such as Ly equivalent width (EW), and properties of the ISM (ionization, covering fraction, and kinematics) is important as it can be compared to predictions from simulations to estimate how galaxies contribute to reionization (e.g., Fletcher et al., 2018; Finkelstein et al., 2019). See also the companion Astro2020 White Paper by S. Finkelstein.
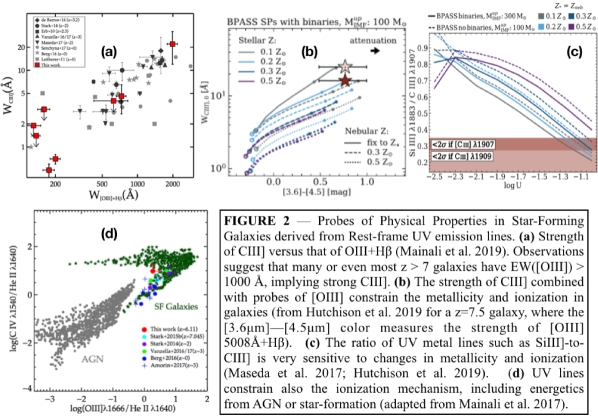
One important question to answer in the 2020s is how do the rest-frame UV properties of galaxies evolve. Rest-frame UV emission lines from metals in star-forming galaxies at –4 show high ionization (e.g., Erb et al., 2010; Stark et al., 2014; Steidel et al., 2016; Berg et al., 2018; McLure et al., 2018), with much higher EW compared to local H ii regions (Stark et al., 2014; Shapley et al., 2015; Steidel et al., 2016; Tang et al., 2018). The increase in the strength of UV emission-lines correlates with the strength of rest-frame optical lines (such as [O iii] 5007, see Stark et al. 2014; Senchyna et al. 2017), which are sensitive probes of ionization (Kewley et al., 2015; Sanders et al., 2016; Steidel et al., 2016). While rest-frame optical lines are not at present observable directly at higher redshift (3.8), in some cases the broad-band colors of galaxies (e.g., from Spitzer/IRAC, see Figure 2) can be used to constrain the emission line strength in the optical (e.g Smit et al., 2015), which imply very high [O iii] EW (e.g., Finkelstein et al., 2013; Roberts-Borsani et al., 2016; Stark et al., 2017; Lam et al., 2019; Hutchison et al., 2019).
Stellar population and photoionization models are now sophisticated enough that the strength of ratios of UV emission lines can be used to constrain the nature of the ionizing source, and physical and chemical properties of the galaxies (Feltre et al., 2016; Gutkin et al., 2016; Jaskot & Ravindranath, 2016; Stanway et al., 2016; Byler et al., 2018; Nakajima et al., 2018). Currently, it is very difficult to compare these predictions with observations. One problem is the UV spectral features at 3 are weak: the average Lyman-Break Galaxy (LBG) shows rest-frame EW 1.7, 1.3, and 0.2 Å for C iii], He ii, and O iii], respectively (Shapley et al. 2003; see below and Figure 2). A more serious problem is that the distant galaxies are very faint (26 AB mag), accessible only at the very limit of 8-10 m telescopes. As a result, observations of UV metal lines exist for only a handful of the brightest high-redshift galaxies (20 galaxies at 5, including only 5 galaxies with 7, where detections are so rare each one typically produces a separate publication, Stark et al. 2015a, b, 2017; Mainali et al. 2018; Hutchison et al. 2019).
Surprisingly, the intensity of the UV metal emission lines in 5 galaxies is an order of magnitude larger than was predicted from observations of galaxies at lower redshifts, suggesting that the nature of reionization-era galaxies may be very different than at 3 (e.g., Stark et al., 2016, 2017; Ding et al., 2017; Maseda et al., 2017; Matthee et al., 2017; Mainali et al., 2018; Hutchison et al., 2019). The ionization in these star-forming regions is extremely high (, where is the ratio of the number density of ionizing photons to Hydrogen atoms). In rare cases C iv and N v emission is seen (Tilvi et al., 2016; Hu et al., 2017; Laporte et al., 2017; Mainali et al., 2017), indicating extreme ionization in interstellar metals, requiring an even more energetic supply of radiation (i.e., very young hot stars or AGN, Figure 2).
2 UV Spectroscopy of High-Redshift Galaxies in the 2020s
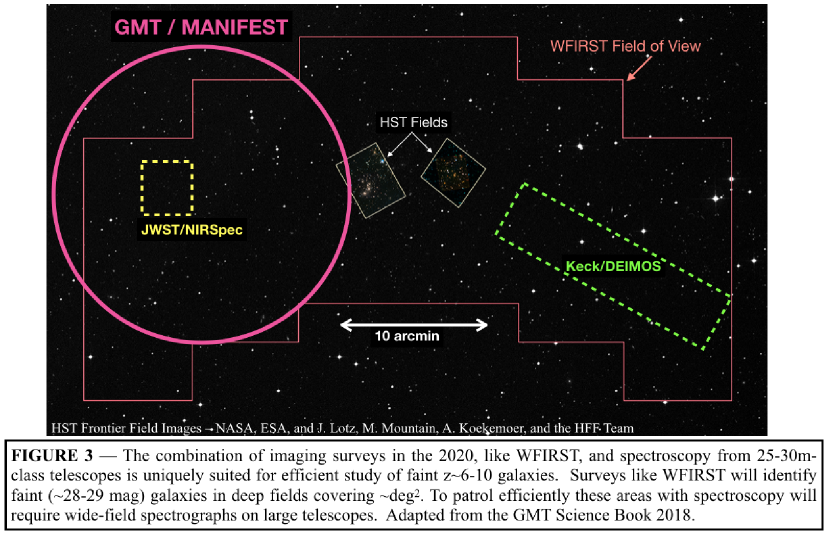
The discovery space for science derived from UV diagnostics is huge, but requires spectroscopy sensitive to galaxies currently beyond the limits of our telescopes. By the mid-2020s, imaging surveys from facilities such as WFIRST and LSST will start to deliver large samples of high-redshift LBGs (310) selected over wide areas and faint magnitudes (including 2,000 deg2 fields to =26.5, and 1 deg2 fields to =28–29). Large telescopes will be required to obtain the rest-frame UV spectroscopy of these galaxies. Starting in 2021, JWST will be very efficient at measuring spectra of early star forming galaxies, but its field of view is small and lifetime short (Figure 3). To capitalize on the depth/area from imaging surveys of the 2020s and beyond, we will require multiplexed, wide-field spectroscopy from 20 m telescopes (e.g., the GMT and TMT; see Figure 3, where the GMT with the MANIFEST fiber positioner system will enable deep spectroscopic surveys of 1 deg2 fields). Spectroscopy from 20 m telescopes will operate contemporaneously with LSST and WFIRST surveys, and will provide greater sensitivity and higher resolution at near-IR wavelengths (1–2 m) compared to JWST. This will be paramount for studying the rest-UV properties of newly discovered galaxies at 59.111See: https://jwst.stsci.edu/science-planning/proposal-planning-toolbox/jwst-sensitivity-and-saturation-limits and https://www.gmto.org/sciencebook2018/
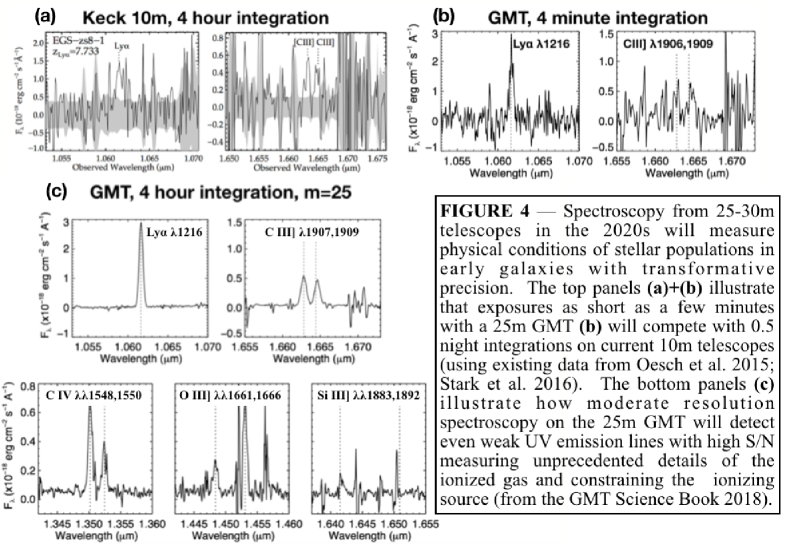
Optical and near-IR spectrographs on 25-30 m telescopes will enable the mainstream study of the rest frame UV emission in high–redshift galaxies. The efficiency gained by spectroscopy with 25-30 m–class telescopes is illustrated in Figure 4, which allows high S/N emission-line studies of 610 galaxies. The majority of these galaxies will be very faint (=27–28) detected from surveys operating in the 2020s (such as LSST and WFIRST). A host of fainter emission lines (e.g., C iv, O iii], Si iii], C iii]) will become apparent in moderate exposures (1–4 hrs), enabling the characterization of their ionizing source (hot stars and/or AGN), metal content, and gas properties (e.g., Mainali et al., 2017; Hutchison et al., 2019). Longer exposures (10–30 hrs) on m telescopes would enable emission line studies to be extended to even fainter (28–29) galaxies, providing insight into how the physical characteristics of ionization and metal fraction depend on galaxy luminosity/mass, and informing us about the properties of the more representative population of low mass galaxies. Spectroscopy with 25–30m telescopes of fainter galaxies (or gravitationally lensed systems) will enable studies to be extended to the very highest redshifts (), probing the earliest phases of galaxy formation.
Wide-field areal coverage combined with high multiplexing and the large apertures of 25-30m telescopes provides enormous efficiency gains in the study of faint (6–10) objects, where current 8–10 m class telescopes are not sensitive enough to detect faint emission lines from =26–29 galaxies. High multiplexing over large fields-of-view is also required as these galaxies have surface densities of only 1 per arcmin2 at =27 (Finkelstein, 2016). The survey speed provided by the 25–30 m-class telescopes is a huge advantage for this science, compared to JWST or smaller ground-based telescopes (see Newman et al., 2015).
3 The Search for “Metal-free” Epochs of Star-Formation
The telescope facilities of the 2020s could discover the first known galaxies with “metal-free” stars. Such galaxies would show strong emission from hydrogen and helium (i.e., He ii 1640) with no UV lines from other heavier elements. This discovery would be transformative in that it would provide the first glimpse of how metal-free stars behave. While galaxy formation is well underway by the end of reionization, the metal enrichment provided by star formation is a local and gradual process. Theoretical investigations predict that Pop III stars can still form in chemically pristine gas in large, under-dense regions at 6, one billion years after the Big Bang (e.g., Scannapieco et al., 2003; Trenti et al., 2009; Xu et al., 2016). If the Pop III IMF is weighted toward very high mass stars (e.g., Bromm & Larson, 2004), the strong UV radiation field will power strong He ii 1640 emission (e.g., Schaerer, 2002).
Wide-field, multiplexed optical and near-IR spectrographs on 25-30 m telescopes will be able to characterize the strength of He ii and metal lines in thousands of galaxies at redshifts 6 over 1 deg2 fields, thereby enabling the discovery of Pop III stars. Because the Pop III phase is expected to be very short (10 Myr), and may exist only in under-dense regions, these objects are very rare. The Ly luminosity from Pop III galaxies is expected to be erg s-1 (Scannapieco et al., 2003), with the He ii 1640 emission being 0.1 and no other metal lines present (Schaerer, 2002). To detect He ii would require only 1-2 hr exposures on 25-30 m class telescopes, allowing the efficient discovery of these rare sources over large fields.
References
- Berg et al. (2018) Berg, D. A., Erb, D. K., Auger, M. W., Pettini, M., & Brammer, G. B. 2018, ApJ, 859, 164
- Bromm & Larson (2004) Bromm, V., & Larson, R. B. 2004, ARA&A, 42, 79
- Byler et al. (2018) Byler, N., Dalcanton, J. J., Conroy, C., et al. 2018, ApJ, 863, 14
- Ding et al. (2017) Ding, J., Cai, Z., Fan, X., et al. 2017, ApJ, 838, L22
- Eldridge et al. (2017) Eldridge, J. J., Stanway, E. R., Xiao, L., et al. 2017, PASA, 34, e058
- Erb et al. (2010) Erb, D. K., Pettini, M., Shapley, A. E., et al. 2010, ApJ, 719, 1168
- Erb et al. (2014) Erb, D. K., Steidel, C. C., Trainor, R. F., et al. 2014, ApJ, 795, 33
- Feltre et al. (2016) Feltre, A., Charlot, S., & Gutkin, J. 2016, MNRAS, 456, 3354
- Finkelstein (2016) Finkelstein, S. L. 2016, PASA, 33, e037
- Finkelstein et al. (2013) Finkelstein, S. L., Papovich, C., Dickinson, M., et al. 2013, Nature, 502, 524
- Finkelstein et al. (2019) Finkelstein, S. L., D’Aloisio, A., Paardekooper, J.-P., et al. 2019, arXiv e-prints, arXiv:1902.02792
- Fletcher et al. (2018) Fletcher, T. J., Robertson, B. E., Nakajima, K., et al. 2018, ArXiv e-prints, arXiv:1806.01741
- Gutkin et al. (2016) Gutkin, J., Charlot, S., & Bruzual, G. 2016, MNRAS, 462, 1757
- Hu et al. (2017) Hu, W., Wang, J., Zheng, Z.-Y., et al. 2017, ApJ, 845, L16
- Hutchison et al. (2019) Hutchison, T. A., Papovich, C., Finkelstein, S. L., et al. 2019, ApJ, submitted
- Jaskot & Ravindranath (2016) Jaskot, A. E., & Ravindranath, S. 2016, ApJ, 833, 136
- Jones et al. (2013) Jones, T. A., Ellis, R. S., Schenker, M. A., & Stark, D. P. 2013, ApJ, 779, 52
- Kewley et al. (2015) Kewley, L. J., Zahid, H. J., Geller, M. J., et al. 2015, ApJ, 812, L20
- Lam et al. (2019) Lam, D., Bouwens, R. J., Labbe, I., et al. 2019, arXiv e-prints, arXiv:1902.02786
- Laporte et al. (2017) Laporte, N., Nakajima, K., Ellis, R. S., et al. 2017, ApJ, 851, 40
- Mainali et al. (2017) Mainali, R., Kollmeier, J. A., Stark, D. P., et al. 2017, ApJ, 836, L14
- Mainali et al. (2018) Mainali, R., Zitrin, A., Stark, D. P., et al. 2018, ArXiv e-prints, arXiv:1804.00041
- Maseda et al. (2017) Maseda, M. V., Brinchmann, J., Franx, M., et al. 2017, A&A, 608, A4
- Matthee et al. (2017) Matthee, J., Sobral, D., Darvish, B., et al. 2017, MNRAS, 472, 772
- McLure et al. (2018) McLure, R. J., Pentericci, L., Cimatti, A., et al. 2018, MNRAS, 479, 25
- Nakajima et al. (2018) Nakajima, K., Schaerer, D., Le Fèvre, O., et al. 2018, A&A, 612, A94
- Newman et al. (2015) Newman, J. A., Abate, A., Abdalla, F. B., et al. 2015, Astroparticle Physics, 63, 81
- Reddy et al. (2016) Reddy, N. A., Steidel, C. C., Pettini, M., Bogosavljević, M., & Shapley, A. E. 2016, ApJ, 828, 108
- Roberts-Borsani et al. (2016) Roberts-Borsani, G. W., Bouwens, R. J., Oesch, P. A., et al. 2016, ApJ, 823, 143
- Sanders et al. (2016) Sanders, R. L., Shapley, A. E., Kriek, M., et al. 2016, ApJ, 816, 23
- Scannapieco et al. (2003) Scannapieco, E., Schneider, R., & Ferrara, A. 2003, ApJ, 589, 35
- Schaerer (2002) Schaerer, D. 2002, A&A, 382, 28
- Schenker et al. (2013) Schenker, M. A., Robertson, B. E., Ellis, R. S., et al. 2013, ApJ, 768, 196
- Senchyna et al. (2017) Senchyna, P., Stark, D. P., Vidal-García, A., et al. 2017, MNRAS, 472, 2608
- Shapley et al. (2003) Shapley, A. E., Steidel, C. C., Pettini, M., & Adelberger, K. L. 2003, ApJ, 588, 65
- Shapley et al. (2015) Shapley, A. E., Reddy, N. A., Kriek, M., et al. 2015, ApJ, 801, 88
- Smit et al. (2015) Smit, R., Bouwens, R. J., Franx, M., et al. 2015, ApJ, 801, 122
- Sobral et al. (2018) Sobral, D., Matthee, J., Darvish, B., et al. 2018, MNRAS, 477, 2817
- Sommariva et al. (2012) Sommariva, V., Mannucci, F., Cresci, G., et al. 2012, A&A, 539, A136
- Stanway et al. (2016) Stanway, E. R., Eldridge, J. J., & Becker, G. D. 2016, MNRAS, 456, 485
- Stark et al. (2014) Stark, D. P., Richard, J., Siana, B., et al. 2014, MNRAS, 445, 3200
- Stark et al. (2015a) Stark, D. P., Richard, J., Charlot, S., et al. 2015a, MNRAS, 450, 1846
- Stark et al. (2015b) Stark, D. P., Walth, G., Charlot, S., et al. 2015b, MNRAS, 454, 1393
- Stark et al. (2016) Stark, D. P., Ellis, R. S., Charlot, S., et al. 2016, MNRAS, arXiv:1606.01304
- Stark et al. (2017) —. 2017, MNRAS, 464, 469
- Steidel et al. (2018) Steidel, C. C., Bogosavljević, M., Shapley, A. E., et al. 2018, ApJ, 869, 123
- Steidel et al. (2016) Steidel, C. C., Strom, A. L., Pettini, M., et al. 2016, ApJ, 826, 159
- Tang et al. (2018) Tang, M., Stark, D., Chevallard, J., & Charlot, S. 2018, MNRAS, submitted, arXiv:1809.09637, arXiv:1809.09637
- Tilvi et al. (2016) Tilvi, V., Pirzkal, N., Malhotra, S., et al. 2016, ApJ, 827, L14
- Trenti et al. (2009) Trenti, M., Stiavelli, M., & Michael Shull, J. 2009, ApJ, 700, 1672
- Xu et al. (2016) Xu, H., Norman, M. L., O’Shea, B. W., & Wise, J. H. 2016, ApJ, 823, 140