Hybrid Photonic-Crystal Fiber
Abstract
This article offers an extensive survey of results obtained using hybrid photonic crystal fibers (PCFs) which constitute one of the most active research fields in contemporary fiber optics. The ability to integrate novel and functional materials in solid- and hollow-core PCFs through various post-processing methods has enabled new directions towards understanding fundamental linear and nonlinear phenomena as well as novel application aspects, within the fields of optoelectronics, material and laser science, remote sensing and spectroscopy. Here the recent progress in the field of hybrid PCFs is reviewed from scientific and technological perspectives, focusing on how different fluids, solids and gases can significantly extend the functionality of PCFs. In the first part of this review we discuss the most important efforts by research groups around the globe to develop tunable linear and nonlinear fiber-optic devices using PCFs infiltrated with various liquids, glasses, semiconductors and metals. The second part is concentrated on the most recent and state-of-the-art advances in the field of gas-filled hollow-core PCFs. Extreme ultrafast gas-based nonlinear optics towards light generation in the extreme wavelength regions of vacuum ultraviolet (VUV), pulse propagation and compression dynamics in both atomic and molecular gases, and novel soliton - plasma interactions are reviewed. A discussion of future prospects and directions is also included.
I Introduction
I.1 Historical Background
Practical data transmission using optical fibers with reduced attenuation was proposed for the first time by Kao and Hockham (1966). This achievement marked an era where optical fibers could be a realistic communication medium. Since the first experimental realization of low loss optical fibers in 1970 Kapron et al. (1970), world-wide communications—among other fields—experienced an extraordinary growth.
In conventional optical fibers, the silica core of the fiber is usually doped with another material in order to increase the refractive index and consequently satisfy Snell’s law of total internal reflection (TIR) Kao and Hockham (1966). A small core diameter of m is also necessary in order to maintain only the zero order (fundamental) propagation mode, in the visible spectral region. However, doping of the core can lead to high attenuation levels, while the small core size leads to nonlinear interactions that are strongly pronounced over length scales of a few kilometers—these are useful for nonlinear optics, but usually a significant disadvantage for communications. New guiding mechanisms were thus essential in order to minimize or even eliminate these effects. One such early attempt was the idea of using an air-glass microstructure for optical fiber guidance; proposed and demonstrated by Standley and Holden (1974) and Kaiser and Astle (1974). Although unsuccessful, this work would be reinvented with great success a few decades later.
In 1987, John (1987) and Yablonovitch (1987) predicted the photonic bandgap effect, an extension of the concept of band structure in semiconductors (a foundation on which modern electronics relies on) to photonics. The electronic band structure is the outcome of the interaction between electrons with the periodic modulation of the potential created by a crystalline lattice. Solving the Schrödinger wave equation for a periodic potential, it can be shown that there are fixed “forbidden energy regions”, which separate the energy bands. Photonic crystals are considered as the extension of the latter in which the forbidden energy states are now replaced by optical bandgaps, i.e. forbidden frequency ranges for any polarization states, formed via the periodic modulation of the material’s effective refractive index. The main aim of a structure with a full 3-D photonic bandgap would be to block the propagation of photons whose frequency (energy) falls within the photonic bandgap frequency range, irrespective of their polarization states. This has attracted a great deal of (scientific) interest, allowing the fabrication of a whole new generation of photonic devices and the emergence of a new research field in optics and photonics Joannopoulos et al. (1997). The first experimental observation of the photonic bandgap effect—in the microwave transmission range—was reported in 1991 by Yablonovitch et al. in a bulk high index material with 1-mm drilled holes Yablonovitch et al. (1991).
I.1.1 Photonic crystal fiber (PCF)
Inspired by Yablonovitch’s work Yablonovitch (1987), in 1991, Philip Russell conceived the idea of a hollow-core waveguide based on a 2-D out-of-plane photonic bandgap, i.e a bandgap for angles of incidence out of the plane of periodicity Russell (2001). This reduces the constraint of using high refractive index contrast materials, required for in-plane photonic bandgaps; a key element that enabled the usage of a simple air-glass interface and made it compatible with fiber optics technology Birks et al. (1995). Russell’s idea particularly targets waveguiding in an air-core fiber in order to overcome the aforementioned limitations of conventional fibers, i.e. material attenuation, dispersion and nonlinear effects Russell (2001). A bandgap is provided through a 2-D glass-airhole pattern running along the fiber length parallel to the core. However, the experimental realization of such structures required infrastructure not available at that time. Russell and his colleagues developed their own fabrication method by stacking silica capillaries of 1 mm diameter in a specific hexagonal pattern. In 1996 they demonstrated the first photonic crystal fiber Birks et al. (1996). This first attempt incorporated a solid-core rather than a hollow-core in its center, which was surrounded by an array of micrometer-scaled holes arranged in a triangular lattice with an overall hexagonal shape. Consequently, the fiber did not guide based on the photonic bandgap effect, but rather a mechanism akin to total internal reflection. But because the main motivation at that time was to fabricate a fiber that confined light through the photonic bandgap effect, the term photonic crystal fiber (PCF) was introduced, and remains in use for the whole class of microstructured fibers, including those without any kind of ‘crystal’ structure. This is the term we also use in this review article. ‘Holey’ or microstructured fibers are other terms for PCF. The guidance principle of solid-core PCF is similar to conventional step-index fibers with an added unique feature. If properly designed, the fiber can support only the zero-order (fundamental) mode for all wavelengths Birks et al. (1997). This endlessly single mode guidance provided a great degree of freedom to engineer the properties of the fiber in ways which do not exist in standard fibers Ranka et al. (2000).
The initial idea of Russell et al. to guide light in air was successfully achieved in 1999, demonstrating for the first time the fabrication of a hollow-core PCF (HC-PCF) capable of confining more than 99% of light in its core over distinct narrow transmission windows Cregan et al. (1999). This breakthrough was a significant step forward towards a new and exciting science in the field of optics and photonics, causing several research groups around the globe to focus their activities on this new class of optical fibers. Indeed, with rapid improvements to the design and the fabrication process, in only five years time losses as low as 1 dB/km were reported Smith et al. (2003); Roberts et al. (2005).
I.1.2 Broadband guiding HC-PCF
In 2002, Benabid et al. (2002) demonstrated the first HC-PCF capable of transmitting light not in a narrow spectral region, but over a broad range of optical frequencies. The cladding structure of this fiber was somewhat different from the conventional triangular or honey comb HC-PCF structures reported previously, consisting of thin (nanometer scale) silica webs arranged in a kagomé lattice. While it was originally anticipated that the guidance might be due to high-order photonic bandgaps Couny et al. (2006), using numerical simulation it was soon realized that the cladding structure does not support any photonic bandgaps, but rather regions of low cladding density of photonic states Pearce et al. (2007). Moreover, in these regions core and cladding modes with a similar frequency and propagation constant co-exist Couny et al. (2007c). The guidance mechanism in these and other broadband-guiding HC-PCF (to be discussed below) has been the subject of significant study and debate, which we review in Section I.2.3.
Several observations have been decisive in the recent progress in the fabrication of low-loss broadband-guiding HC-PCFs. First of all it was realized that the exact geometry of the cladding is not the crucial factor in displaying broadband guidance in HC-PCFs. Fibers with square or even honey comb cladding structures are also capable of broadband guidance Beaudou et al. (2008); Couny et al. (2008). Second, in contrast to strict HC-PBG, the loss in broadband-guiding HC-PCFs is independent of the number of the cladding layers surrounding the core, so in principle even a single cladding layer should also demonstrate similarly broadband guidance Pearce et al. (2007); Argyros and Pla (2007). Third, the geometry of the first layer surrounding the core is crucial in the performance of the fiber Argyros and Pla (2007); Wang et al. (2011). Wang et al. showed that by optimizing the core shape of a kagomé HC-PCF and creating a negative (inward) curvature in the core surround it is possible to considerably enhance the performance of the fiber. Wang et al. (2011) experimentally demonstrated that such a core shape has lower loss than the kagomé HC-PCF with conventional core geometry.
A breakthrough came about when in 2011 Prymamikov et al. presented a truly single cladding layer HC-PCF in which the core was formed by a single row of silica capillaries Pryamikov et al. (2011). This type of fibre has become known as negative-curvature HC-PCF (NC HC-PCF). The fiber described by Pryamikov et al. (2011) transmitted light over a wide range of frequencies in the mid-IR spectral region with a relatively low loss. The low loss regions were intercepted by high-loss bands corresponding to the resonances of the cladding determined by the thickness of the capillary walls. This property is generally true for all the broadband-guiding HC-PCFs. Nowadays, NC HC-PCF has attracted significant attention from the scientific community as an alternative to kagomé HC-PCF with significantly reduced fabrication complexity, and often improved performance.
A note on the terminology is necessary when considering different types of broadband-guiding HC-PCFs mentioned above, such as kagomé, negative curvature HC-PCF, or single-ring HC-PCF. In these fibers there is neither a unique cladding design nor a generally accepted guidance mechanism for the broadband guidance. These fibers may consist of a honey comb or a kagomé-style lattice. Alternatively, in the case of the negative-curvature HC-PCFs the cladding usually consists of a reduced, or even single layer, of annular tubes (see Yu and Knight (2016) and the references therein), although more complex geometries such as nested tubes also exist Belardi and Knight (2014); Poletti (2014); Habib et al. (2015). All these structures are capable of showing a degree of broadband guidance when operating in the so-called large-pitch regime, where a characteristic length scale in the cladding of the fibre (e.g. pitch, or the diameter of the annular tubes in negative-curvature HC-PCFs) is larger than the optical wavelength. In this paper, we use the generic term broadband-guiding HC-PCF for all of these types of HC-PCF, with the exception of hollow-core photonic bandgap fibers (HC-PBG). This is irrespective of the possible guidance mechanism and even though the cladding may not consist of a truly crystalline, i.e. periodic, structure. It has been common in the literature to also refer to some of these fibers as inhibited-coupling, or anti-resonant guiding, HC-PCF, based on the perceived guidance mechanism. We avoid that in this review due to the still somewhat open nature of the guidance mechanism debate (see Section I.2.3).
Losses as low as 7.7 dB/km have been reported in broadband-guiding HC-PCF in the near-infrared (NIR) region Debord et al. (2016, 2017). Perhaps more surprising, is that such broadband-guiding HC-PCF made with silica glass can even guide with low attenuation in regions where silica itself has very high material loss, such as the mid-infrared (MIR) Pryamikov et al. (2011); Yu et al. (2012); Yu and Knight (2013, 2016), and even vacuum ultraviolet (VUV) Belli et al. (2015); Ermolov et al. (2015).
Recently it has also been found that various types of negative-curvature and single-ring HC-PCF offer increased higher-order mode suppression Yu et al. (2016); Uebel et al. (2016); Newkirk et al. (2016); Hayes et al. (2017). This is achieved by optimizing the phase-matching between the higher-order core modes and the modes of the cladding structure so as to achieve a higher differential modal loss. Yu et al. (2016) obtained a low attenuation of 0.025 dB/m at 1064 nm for the fundamental mode, but a 200 times higher attenuation for the next lowest loss higher-order mode. Such a differential was obtained across the visible and near-infrared region while maintaining record attenuation levels at each wavelength, proving that single-mode performance can be achieved while maintaining low loss. Twisting the fiber during fabrication can also be used to improve single-mode performance Edavalath et al. (2017). The optimization of bending loss in simplified broadband-guiding HC-PCFs has also been recently studied Gao et al. (2016, 2017).
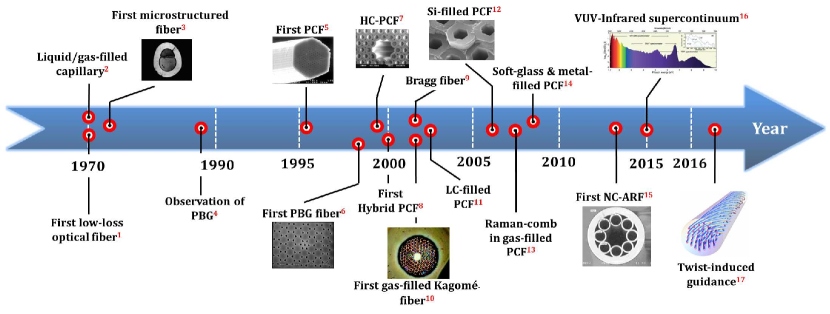
Figure 2 summarizes in a timescale illustration the major breakthroughs in the PCF field starting from the first report on low-loss optical fiber (Kao and Hockham (1966)) until the recent demonstration of VUV-Infrared supercontinuum generation based on a gas-filled HC-PCF Belli et al. (2015) and twist-induced guidance in a coreless PCF Beravat et al. (2016).
I.1.3 Hybrid PCF
The unique ability to tailor and control light based on the geometrical characteristics of PCF, opened the door to the exploitation of new fundamental optical phenomena and applications Ranka et al. (2000). However, one of the most important features of these fibers is perhaps their ability to act as a substrate capable of hosting novel functional optical materials inside their air-holes. Therefore, many researchers used both solid and HC-PCFs as low-loss platforms with high aspect-ratio and long interaction lengths. By merging the fields of materials science and optics, a new branch of fiber optics research known as hybrid PCFs is created.
The first hybrid PCF was reported by Westbrook et al. (2000). They demonstrated the ability to post-process and tune the cladding-mode resonances by simply varying the external temperature in a solid-core fiber with polymer-infused holes. The first hybrid gas-filled hollow-core PCF was reported by Benabid et al. in 2002 demonstrating, for the first time, enhanced stimulated Raman scattering generated by ultra-low pulse energies Benabid et al. (2002). The latter attracted significant attention from the scientific community moving nonlinear optics in gases to remarkable and previously inaccessible parameter regimes of high intensity and extended interaction length Russell et al. (2014). In a similar manner, atomic vapors were also used as active materials for the investigation of quantum phenomena inside HC-PCFs Ghosh et al. (2006); Venkataraman et al. (2011); Epple et al. (2014); Sprague et al. (2014); Kaczmarek et al. (2015). Finally, the term multi-material has been also used mainly to describe fiber structures with more than two integrated materials Abouraddy et al. (2007).
In this review article we consider only silica PCFs as the host platform, with additional materials (solid, liquid or gas) incorporated to form the hybrid PCFs.
I.2 Guiding mechanisms in PCFs
I.2.1 Solid-core PCF - Modified total internal reflection
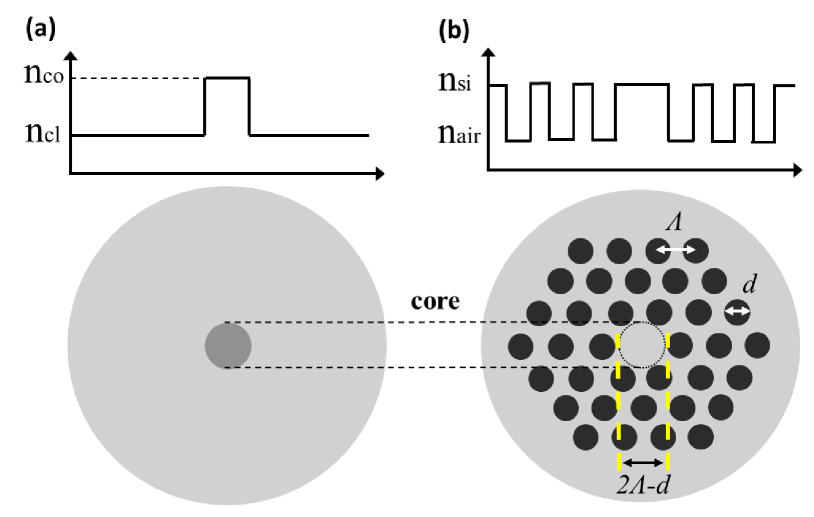
In standard optical fiber, light propagation purely relies on total internal reflection at the core-cladding interface. The maximum cladding mode index is limited by the cladding refractive index, which must be lower than the core index. To shape the refractive index profile in standard optical fibers various dopants such as GeO2 or Al2O3 are used in the preform fabrication stage. In solid-core PCFs, however, this is done by stacking capillaries around a solid rod in the preform fabrication process. The resulting air holes in the fiber’s cladding, which run along its entire length, reduce the average refractive index of the cladding to be less than that of the fiber’s core. Figure 2(a) shows the refractive index profile of a standard optical fiber with indicating the refractive index of the silica (low-index material) and the refractive index of the doped core (high-index material). Figure 2 (b) shows the corresponding refractive index profile of a solid-core PCF. The photonic crystal cladding is an ideal triangular lattice with a lattice constant, or pitch, , i.e. the inter-hole spacing, and an inner hole diameter which is related to the air-filling fraction . The guidance properties of the PCF are purely determined by , and .
An efficient way to represent the guidance mechanism in optical fibers is in the form of propagation diagram whose axes are the dimensionless quantities , where is the axial wave-vector, i.e. the component of the wave-vector along the propagation axis of the fiber, and , where is the angular frequency and is the speed of light in vacuum Russell (2003). This diagram indicates the ranges of frequencies and axial wave vectors , where light is evanescent, i.e. unable to propagate. At a fixed optical frequency (wavelength), the maximum possible value of is set by where is the refractive index of the material under consideration Russell (2003). Solid lines show these values for each material. For instance the solid green line in Fig. 3 (a) is the light line (line separation between white and grey region) given by . For an axial wave vector in the , light is able to propagate in a medium of refractive index while for it is evanescent. In standard optical fibers, guided modes appear at points like R lying in the dark red region (bold line) in Fig. 3 (a), i.e. where light is free to propagate in the high index core but evanescent in the cladding.
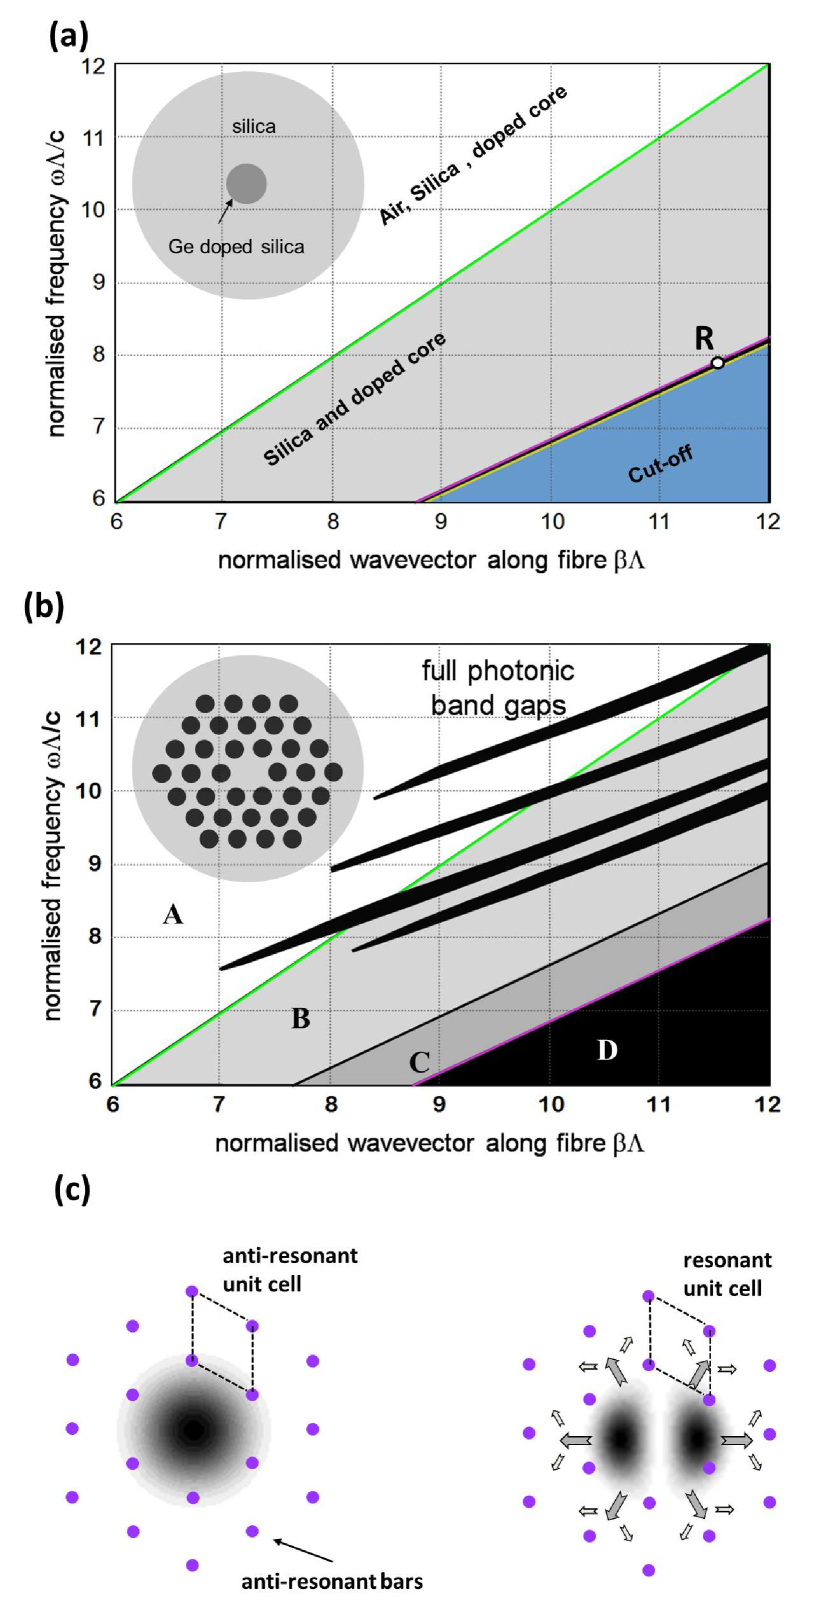
In the case of PCF, the propagation diagram or “finger plot” is slightly different, given the fact that the cladding is now formed by a triangular photonic crystal lattice. Figure 3 (b) shows the band diagram for a PCF with air-filling fraction 45% Russell (2003). The black area D in the bottom right corner of Fig. 2 (b) is the region where the light is evanescent. In area A, the light is free to propagate in every region of the fiber while in area B, light can propagate only in the photonic crystal and the silica glass. Propagation modes occur in area C where the light is confined in the silica material but is evanescent in the photonic crystal cladding due to the reduced average refractive index of the cladding. We note that the cladding’s triangular lattice may also support 2-D photonic bandgaps. The slant, finger-shaped black regions show these bandgaps, that is, where for a given pitch and frequency no propagating mode with an axial wave-vector lying in the black region can be excited in the lattice. It should be emphasized that the photonic bandgaps extend into the region where , supporting the evidence that air guidance is possible without light propagating to the photonic crystal cladding Russell (2003). If the core of the fiber, whether hollow or not, supports a mode with a falling in a cladding bandgap, the mode will be confined in the core and does not leak out into the cladding as it cannot find any corresponding photonic state to couple to.
One of the most important properties of solid-core PCFs is their ability to be single mode for all if properly designed Birks et al. (1997); Knight et al. (1998a). This property can be understood by considering the cladding air holes as “anti-resonant bars” of the fundamental mode Russell (2003). The Gaussian-like single-lobe intensity distribution of the fundamental mode is “trapped” in the hexagonal array of the air holes of a fiber with a core diameter 2. The intensity distribution of the higher order modes constitute smaller lobes which due to their intensity distribution are able to “escape” through the silica gaps between the air-holes Russell (2003). A schematic representation of the intensity distribution of the zero-order (fundamental) and the first order mode is shown in Fig.3 (c). It should be noted that if the relative hole size then the core-cladding index contrast increases. In that case the higher-order modes are able to remain confined in the core and thus the fiber will support more than one mode.333A detailed theoretical study on the conditions for endlessly single mode operation can be found in Bjarklev et al. (2003); Russell (2006); Poli et al. (2007).
I.2.2 HC-PCF - the photonic bandgap mechanism
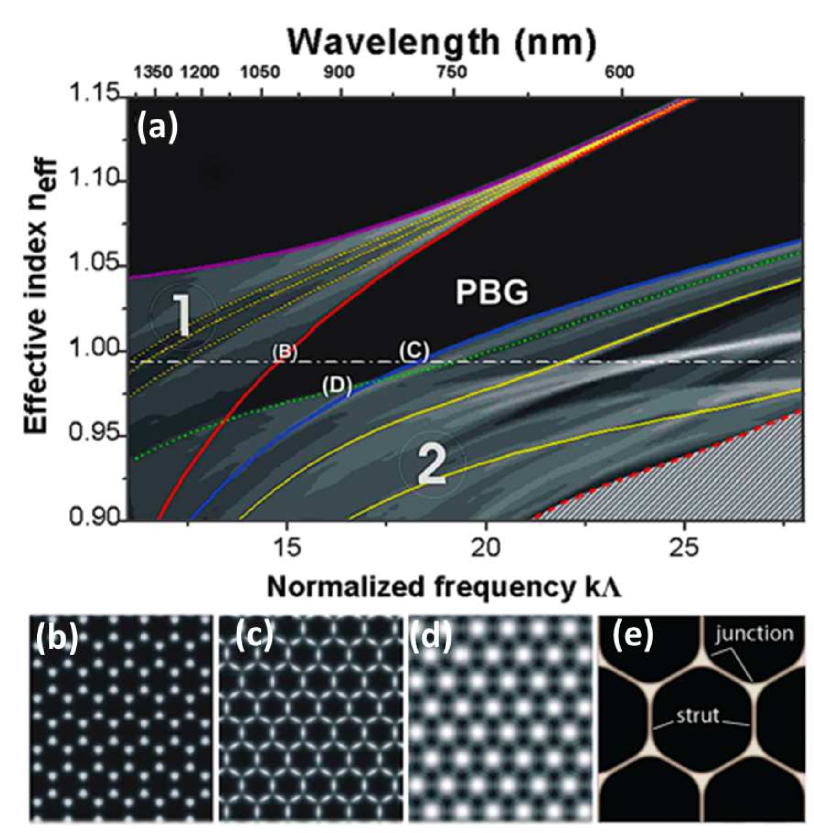
When the hollow-core of an HC-PCF is either evacuated or filled with air or other gas, its core index is lower than the effective cladding index, and therefore guidance via modified TIR, as in solid-core PCFs, is not possible 444Note that for photonic bandgap guidance the core does not necessarily need to be hollow. A solid-core PCF with cladding holes infiltrated with high-index material may also show guidance based on a photonic bandgap.. Confinement of light in the core of a HC-PCF can instead be mediated by a photonic bandgap (black regions in Fig. 3 (b)), created by the surrounding two-dimensional photonic crystal cladding Cregan et al. (1999); Russell (2001); Knight (2003); Russell (2003). The guidance mechanism in such a hollow-core photonic bandgap fiber (HC-PBG) can be better understood by considering the unit cell of the photonic crystal cladding and the air-core as fixed localized resonators Birks et al. (1995). The unit cell is defined as the smallest section of the entire cladding structure possessing the overall symmetry of the 2-D crystal geometry from which the entire crystal can be generated by its translation through all the primitive vectors in the 2-D Bravais lattice, see Fig. 4 (e) for the unit cell of a honey comb lattice. For certain wavelengths, light is coupled to the unit cell resonators and the guided light is leaked out to the entire structure. Light remains confined in the core if the guided modes do not overlap or have common resonances with the crystal cladding. One way to determine the cladding resonances and consequently define the operating wavelengths at which light is confined in the air-core, is by calculating the Density of States (DOS) of the unit cell. The wall thickness of the glass and pitch of the unit cell exclusively govern the locations and widths of the photonic bandgaps Pottage et al. (2003). Figure 4 (a) shows as an example the calculated DOS for the honey comb lattice shown in Fig. 4 (e) Couny et al. (2007b). The black region below the light line (the dotted line at in Fig. 4 (a)), for effective refractive indices smaller than , is where the core guided modes can exist. Outside the photonic bandgap, in regions 1 and 2 in Fig. 4 (a) the cladding can support propagating modes. The slanted coloured lines in these regions show the dispersion of some of the cladding modes. From this plot, one can see that the upper and lower edges of the out-of-plane photonic bandgap are formed by three cladding modes or resonances indicated by the solid lines in red (b) and blue (d), and the green dotted line (c). Figures 4 (b-d) show the near-field pattern of these cladding modes calculated at a representative normalized vacuum wavenumber . The plot indicates that a few unit cell resonator modes define the edges of the bandgap. The upper edge of the bandgap for small is determined by the resonances of the interstitial apex modes (Fig. 4 (b)), while the lower edge for larger is determined by the resonance of the struts (Fig.4(c)) and the resonances of the hexagonal array of air-holes (Fig. 4(d)). Detailed descriptions have been reported in Birks et al. (1995); Bjarklev et al. (2003); Benabid (2006); Couny et al. (2007b); Poli et al. (2007); Benabid and Roberts (2011).
In the category of bandgap fibers we should also include the Bragg fiber. It was first reported by Yeh et al. (1978) while later it was further investigated theoretically by Fink et al. (1999) and experimentally demonstrated by Temelkuran et al. (2002). The mechanism is different than the conventional honey comb cladding fibers. The hollow core in this case is surrounded by multiple alternating sub-micrometre-thick layers of high-refractive-index contrast materials such as high-index glass and low-index polymer. These layers act as “perfect reflectors” confining the mode in the core of the fiber. The fundamental and high-order transmission windows are determined by the layer dimensions and can be scaled from visible to infrared wavelengths Temelkuran et al. (2002).
I.2.3 Broadband-guiding HC-PCFs - Inhibited coupling and anti-resonance
As noted in the historical introduction (see Section I.1), the guidance mechanism of broadband-guiding HC-PCF is not settled. Currently there are two main proposed mechanisms: inhibited coupling (IC) and antiresonant guiding. Although a recent review by Yu and Knight describes in detail several other models that can be also used to describe the guidance in NC HC-PCFs Yu and Knight (2016).
Inhibited coupling (IC).
In a HC-PBG with a honeycomb lattice cladding, with suitable parameters, e.g. pitch and air-filling fraction, light introduced into the core is unable to escape from it thanks to the bandgap that prohibits the propagation of light in the cladding region. The different cladding design introduced by Benabid et al. (2002), called the kagomé-lattice, consists of thin (nanometer scale) silica webs arranged as shown in Figs. 5 (a-b). If properly designed, a kagomé HC-PCF is capable of guiding light over a significantly broader frequency window than HC-PBG. It is known that the cladding of kagomé HC-PCF does not have a full photonic bandgap, but rather a low DOS Benabid (2006); Couny et al. (2007c); Argyros et al. (2008); Argyros and Pla (2007), and that the core and the cladding resonances do not spatially overlap for most frequencies. This is despite the co-existence of the core and the cladding modes with a similar frequency and propagation constant Couny et al. (2007c). These characteristics fully differentiate a kagomé HC-PCF from a HC-PBG. A wide number of different theoretical approaches to explain the underlying guidance mechanism of kagomé HC-PCF have been reported Benabid (2006); Couny et al. (2006, 2007c); Pearce et al. (2007); Février et al. (2010); Benabid and Roberts (2011); Debord et al. (2017). Couny et al. (2007c) first proposed that the high degree of transverse field mismatch between the core and the cladding modes practically inhibits the coupling between them and this is known as inhibited coupling (IC). In the IC picture the guided core modes only weakly interact with the cladding modes due to the rapid phase modulation of the latter. Analogy has been drawn to solid-state physics by considering IC as the photonics analogue of Von Neumann-Wigner bound states (i.e. core modes) of the Schrödinger equation within a continuum (i.e. cladding modes) von Neumann and Wigner (1993); Couny et al. (2007c).
Antiresonance guiding.
The broadband guidance windows in a kagomé HC-PCF, and also the more general class of broadband-guiding HC-PCFs (such as negative curvature, single-ring HC-PCF) are intercepted by narrower high-loss frequency bands. It has been shown that the position of these loss windows correspond to the resonances of the thin cladding glass struts and can be found using the following equation:
| (1) |
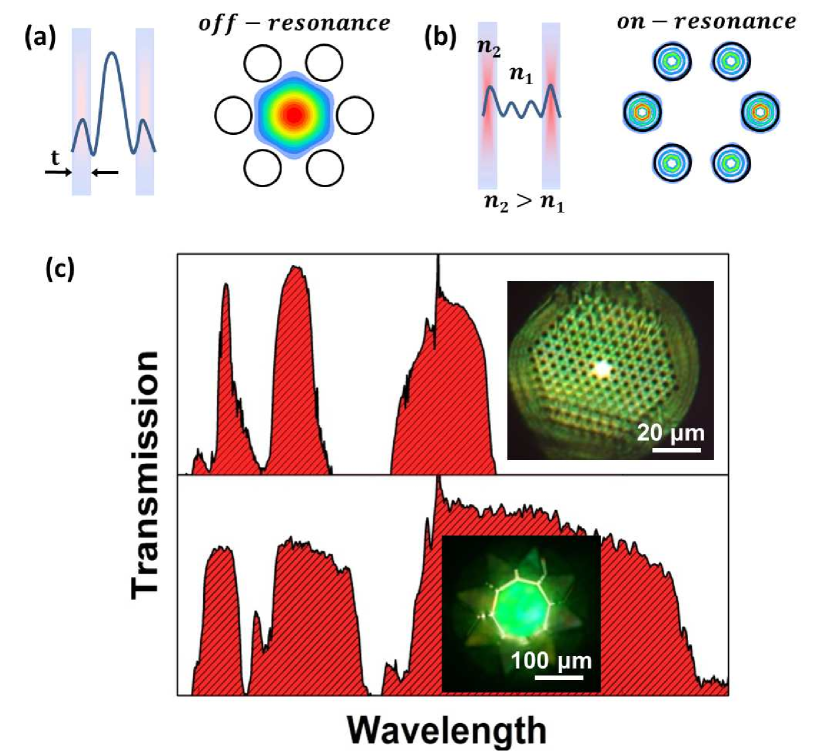
where is the refractive index of the glass, the thickness of the surrounding struts, and is an integer which corresponds to the number of the resonance Litchinitser et al. (2002); Pearce et al. (2007). Eq. 1 refers also to the antiresonant reflection optical waveguide (ARROW) model Duguay et al. (1986). This has led researchers to consider the ARROW model as the the underlying guidance mechanism in broadband-guiding HC-PCFs, and this is perhaps the most widely accepted model. The ARROW model was first reported back in 1986 describing how the light is confined in a planar silicon waveguide having as cladding a number of low and high index layers Duguay et al. (1986). In 2002, Litchister et al. explained that the same principle can be used to describe the light transmission not only in planar multi-layer structures but also in solid-core PCF with high index inclusions as well as photonic bandgap fibers. It approximates the cladding of the fiber as an array of high and low refractive index regions Litchinitser et al. (2002). Each higher refractive index layer can be considered as a Fabry–Pérot resonator as shown in Fig. 6 (a) and (b). In the on-resonance state, the F-P cavity is transparent, allowing the light to escape from the structure, while the reflectivity can be very high in the off-resonance state thereby strongly confining the light in the core of the fiber. Figure 6 (c) shows the ARROW transmission spectrum in a solid-core PCF infiltrated with high index material as well as the transmission spectrum of an HC-PCF fiber. In both cases there are discrete resonances for which the ARROW model could be used to predict the exact location of the band edge. It should be mentioned that ARROW-based guidance in solid-core PCFs with high-index inclusions was extensively investigated prior the appearance of HC-PCFs Litchinitser et al. (2002, 2004); Kuhlmey et al. (2009b).
We can describe the guidance in many hybrid PCFs by incorporating the refractive index of the host and inclusion material into Eq. 1,
| (2) |
where is the refractive index of the low-index host material of the solid-core PCF, the refractive index of the high-index inclusions. However, this model is not valid for long wavelengths satisfying Litchinitser et al. (2004).
Dispersion.
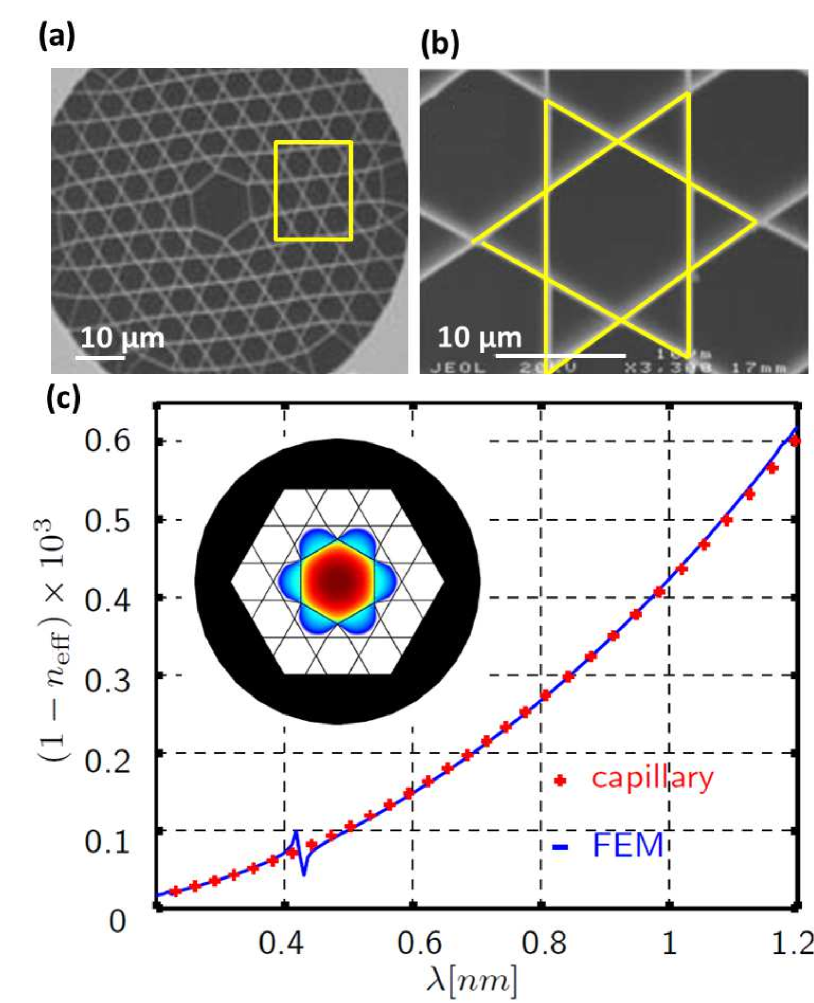
Practically, the wide transmission windows in broadband-guiding HC-PCFs when compared to HC-PBGs, along with propagation losses approaching that of HC-PBG—currently at 7.7 dB/km Roberts et al. (2005); Wang et al. (2011); Debord et al. (2017)—and low chromatic dispersion, have made them ideal vessels for high-field ultrafast nonlinear optics Travers et al. (2011a); Russell et al. (2014). The dispersion in these fibers can be approximated to a good degree by Marcatili and Schmeltzer’s model Marcatili and Schmeltzer (1964b). Figure 5 (c) shows the calculated effective indices (solid blue line) for the simplified kagomé HC-PCF shown as inset. The red plus signs show the dispersion of a hollow dielectric capillary with the same geometrical characteristics as the kagomé fiber calculated using Marcatili and Schmeltzer’s model. See Section III.4.2 for further details.
I.2.4 Twist-induced guidance
.
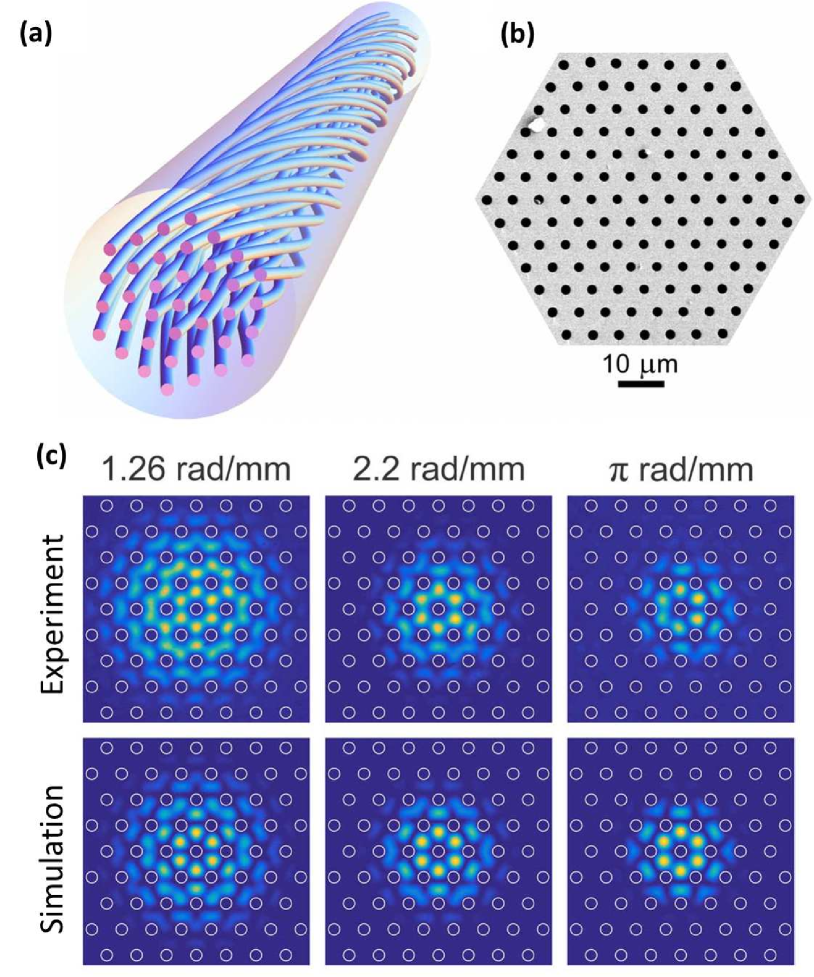
Beravat et al. (2016) recently reported a new guidance mechanism revealed in a coreless PCF that has been twisted around its z-axis. Interestingly, the authors demonstrated for the first time that the twisted PCF creates a “helical channel” in which the light can be robustly trapped in the center of the microstructure without the need of any discernible core structure. The authors explain the guiding properties of the twisted coreless PCF using Hamiltonian optics analysis and they show that the light follows closed oscillatory paths within its spiral structure. Beravat et al. (2016) showed that the confinement of these unusual guided modes can be controlled by changing the twist rate enabling thus the use of such guiding mechanism in sensing, high-power delivery and nonlinear optics. Figure 7 (a) and (b) show the schematic representation of the twisted coreless PCF and the SEM image of the fabricated microstructured fiber, respectively. Figure 7 (c) demonstrates the measured and calculated Poynting vector distributions at different twist rates at a fixed wavelength ( nm).
I.3 Summary
In this section, we have provided a brief overview of the different existing guiding mechanisms in conventional solid-core, hollow-core and coreless PCFs. Summarizing, the light confinement can be categorized into five main mechanisms: i) modified total internal reflection in which light guidance is similar to the conventional step-index fibers, ii) photonic bandgap, iii) inhibited coupling/anti-resonance guidance , and the most recent iv) twist-induced guidance which briefly introduced in this article. From a physics point of view, the first three guidance mechanisms can also adequately describe the guidance in hybrid PCFs that we will review later in this article.
II Hybrid solid-core PCF
In this section, we focus and highlight the main scientific achievements with solid-core PCFs infiltrated with liquid crystals (LCs), metals and other high-index materials. It should be emphasized that we focus on post-processed silica PCFs and we present how the use of different high-index functional materials inside the PCF allows a step towards tunable and sensing devices, plasmonics as well as enhanced nonlinear interactions 555For a recent partial review on hybrid fibers based on solid materials see Alexander Schmidt et al. (2016).. In this review, reports based on silicate or oxide glass-filled PCFs have not been considered.
II.1 Tunable linear devices
The possibility to functionalize silica PCFs with active fluids has paved the way for the development of unique all-fiber devices. The work from Westbrook et al. Westbrook et al. (2000) was followed up by Bise et al. (2002) a couple of years later demonstrating for the first time the possibility of transforming a high-index core PCF into a solid-core photonic bandgap fiber (PBG) by infiltrating a high-index liquid into the air-holes Bise et al. (2002). By varying the external temperature, the refractive index of the infused polymer was changing giving the possibility to control the location of the bandgaps. This report constituted the kick-off for many other research groups around the world to investigate various different fluids with enhanced thermo-electrical properties as a route to the development of sensors, switches, Gaussian and tunable bandpass filters, fiber probes for biological applications, etc.666See e.g.Kuhlmey et al. (2009b); Mach et al. (2002); Kerbage et al. (2002); Domachuk et al. (2004); Markos et al. (2010, 2012a, 2013, 2011); Konidakis and Pissadakis (2014); Vaiano et al. (2016) and early reviews Kerbage and Eggleton (2004); Eggleton et al. (2005). In this section we review and focus on the main materials that have been used by the scientific community to develop the aforementioned silica fiber devices.
II.1.1 Liquid crystals-filled PCFs
Liquid crystals have properties between those of conventional liquids and those of solid crystals. For instance, a LC shows fluidity like a liquid, but it also demonstrates optical anisotropy like a crystal. Research on LCs has been carried out for many years as they find applications in computer screens, mobile phones as well as tunable focusing elements, beam steerers, polarization control materials, etc. Andrienko (2006) The molecules of LCs are directionally oriented and disordered in position. The structure of a LC involves rigid -electron systems bearing flexible long alkyl chains. Many LC molecules are calamitic shaped with a group for polarization, but planar molecules are also known. Different external perturbations such as temperature, voltage, strain can directly affect the LC phase by modifying the length of alkyl chain. A practical liquid crystal has a mesophase at room temperature. In addition to an application for a liquid crystal display, LC materials are expected to be organic semiconductors Iino et al. (2015). A semiconductor having a LC phase, the so-called LC semiconductor, spontaneously undergoes a molecular orientation and self-assembly. There are mainly nematic, smectic, cholesteric, and discotic (disc-like) phases Andrienko (2006). The shape of LC is rod-like while its size is a few nanometers of a LC molecule is in the order of a few nanometers. In 2003, Larsen et al. (2003), demonstrated for the first time how the combination of LCs with solid-core PCFs could lead to unique optical devices. This work was followed by several other different groups who thoroughly investigated similar effects taking advantage of the unique thermo-electro-optical properties of LCs Du et al. (2004); Zografopoulos et al. (2006b); Brzdąkiewicz et al. (2006); Zografopoulos et al. (2006a).
Thermal tunability
Temperature has a crucial effect on the LCs as it directly affects the ordinary () and the extraordinary () refractive index of the material. This effect can be used to control the optical properties of the hybrid LC-filled PCF and can be exploited for the development of thermally controlled tunable devices. The birefringence (or refractive index contrast) of the LCs is defined as the difference between the and and is represented by the average refractive index which is defined as Yang and Wu (2014):
| (3) |
Redefining the and we have:
| (4) |
| (5) |
For temperatures which are not too close to the critical or clearing point (defined as the temperature at which LCs become fully isotropic), the Haller Haller (1975) approximation can be used to describe the temperature dependence as:
| (6) |
is defined as the birefringence of the LC in the crystalline state ( K), is the temperature at the clearing point, and is the material constant (varying based on the LC). The final temperature dependence is linear and with respect to wavelength () and can be described as Li et al. (2004a):
| (7) |
Combining Eqs. 6 and 7 with the Eqs. 4 and 5, we can derive a four-parameters model that describes to a good approximation, the temperature dependence of () and () Li et al. (2004a):
| (8) |
| (9) |
The parameters A and B can be extracted via a 2nd order fitting of the measured refractive index of the LC. Equations 8 and 9 predict the temperature dependence of the , which are important parameters for the performance of the LC-filled PCF and they are directly related to the molecular properties of the LC used Li et al. (2004a).
Infiltration of LCs in a solid-core PCFs is a relatively simple procedure as only a few centimeters-long infiltrated length is required to thermally control the output light from the fiber. The simplest way of filling the PCF with LC is by immersing the end-facet in a reservoir filled with the desired LC while the other end of the fiber is open to atmospheric pressure. Due to the surface affinity of the LC with the fiber’s material, a few minutes is required for the infiltration of a few centimeters of the fiber. However, it should be mentioned that the infiltration highly depends on the diameter of the PCF’s cladding holes as well as the viscosity of the LC Nielsen et al. (2005). To expedite the filling procedure a pressure system can be used to further assist the LC infiltration or the temperature can be increased which decreases eventually the viscosity of the LC. Several reports in the literature have extensively investigated the filling times and conditions for fluid-infiltration of silica PCFs with varying cladding hole sizes Nielsen et al. (2005); Kuhlmey et al. (2009b).
The most crucial factor which defines the effective tunability of the photonic bands in such hybrid structure is the thermo-optic coefficient of the infused LCs () Wei et al. (2009b). For silica as host material, the thermo-optic coefficient is very low ( K-1) Malitson (1965) when compared to other materials. If the material of the host PCF is sensitive to thermal variations, such as polymer PCFs, then a more complex methodology is required to discriminate the effects arising from the infused and the host material. LCs exhibit one of the highest thermo-optic coefficients up to K-1 Li et al. (2004b), due to their high birefringence () among other liquidsLi et al. (2004b). Figure 8 (a) shows an example of the revealed high extinction-ratio bandgaps in a commercially available PCF (LMA-13 by NKT Photonics) filled with LCs (MDA-00-3969).
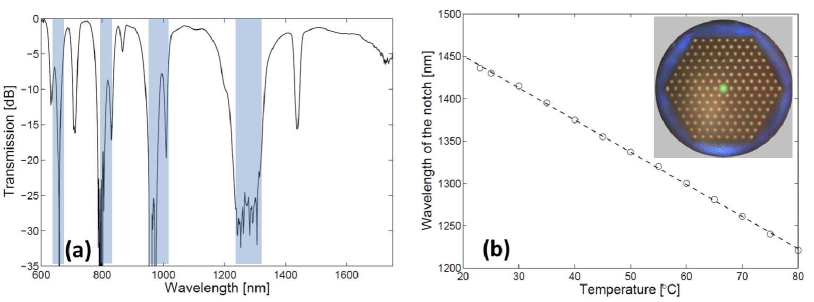
The presence of the high extinction bandgaps as shown in Fig. 8(a) suggests that the fiber can be used as an all-fiber spectral filter having narrow and wide bandwidth windows. Figure 8 (b) shows the linear response of the long edge of the bandgap shifting towards shorter wavelengths as the temperature increases. The sensitivity of the fiber was found to be -3.6 nm/ ∘C in the infrared. The linearity of the tunability response is attributed to the fact that the refractive index of the LC decreases linearly with respect to the temperature.
In 2006, Alkeskjold et al. (2006) reported the development of a hybrid LC-filled PCF with significantly enhanced thermal tunability. This was achieved by using a solid-core PCF with large core diameter of 25 and effective modal area of 440 filled with a specially designed and synthesized nematic LC which has high birefringence and low clearing temperature Alkeskjold et al. (2006); Li et al. (2004b). The thermal sensitivity of the spectral position of the bandgap was measured to 27 nm/∘C, which is 4.6 times higher than what the commercially available LCs offer and to the best of our knowledge it holds the record temperature sensitivity in LC-filled PCFs until today Alkeskjold et al. (2006). Several different configurations are demonstrated over the past 10 years employing LCs for thermally-tuned PCFs. For example, Saitoh et al. (2008) proposed a hybrid waveguide structure using a multi-core PCF filled with nematic LCs. The design involves two identical cores separated by a third one which acts as a LC resonator. Based on the design parameters associated with the LC core, phase matching at a single wavelength can be achieved, enabling thermo-tunable narrow-band resonant directional coupling between the input and the output cores Saitoh et al. (2008).
Electric tunability
The most important property of LCs is perhaps the possibility of changing the orientation of the LC molecules electrically. This provides a much wider dynamic tunability range of the refractive index than using optical or thermal means of tuning Alkeskjold et al. (2007). The response of the LC molecules to an externally applied field is due to the different values of dielectric constants along the long molecular axis () and any axis perpendicular to it (). The dielectric anisotropy , defined as is related to the dipole moment and distribution defined as the angle between the molecular axis and the director with respect to the long molecular axis as well as the applied temperature and frequency Scolari (2009). The most common LCs are the nematic with positive which are mainly used in Liquid Crystal Display (LCD) Demus et al. (1995). Similarly, LCs with negative dielectric anisotropy () are used in glass cells with a vertical alignment configuration. In order to exhibit a negative , molecules must have their dipole perpendicular to the principal molecular axis Scolari (2009). A combination or mixture of two different LCs with opposite dielectric anisotropy leads to a new class of LCs known as dual-frequency LCs. The dual-frequency LCs exhibit a positive at low frequencies and negative at high frequencies as they are made of both positive and negative compounds. A major advantage in using these LCs is that, despite their high rotational viscosity, they exhibit a fast response time to an applied electric field. The threshold voltage, at which the LC starts to respond to the external applied voltage is directly related to the dielectric anisotropy and can be described as Spring (2011):
| (10) |
where is the splay elastic constant (describing the LC molecules as pure splay deformation). Therefore, as the dielectric anisotropy, increases, the LC responds to lower applied voltages. It should be emphasized that other factors such as the rise and decay times, elastic constants, Frederick’s transition of the LCs also play a role in the final performance of the LC-based devices Spring (2011); Onuki (2004).
A PCF with a cladding with six-fold symmetry is not polarization maintaining. By applying an external electric field with a preferential direction in space on a LC-filled solid-core PCF, it is possible to break the six-fold symmetry of the fiber, introducing polarization dependence of the transmission. The ability to control the polarization state in a hexagonal PCF is not possible using thermal and optical methods. In 2004, Du et al. reported for the first time the development of tunable light switch using a photonic crystal fiber filled with nematic LC Du et al. (2004). The electrical tunability switching in the hybrid PCF was over attenuation at operating at nm Du et al. (2004).
A year later, Haakestad et al. (2005) investigated how the electrically controlled polarization-dependent loss of nematic LC-filled PCF is related to the response time of LC. They found that the responsivity of their tunable fiber device was lying in the millisecond range above a certain . Scolari et al. (2005) reported for the first time that dual-frequency LC-filled PCF allows continuous tunable spectral positioning of the photonic bandgaps towards both blue- and red-edge depending on the frequency of the applied voltage. The proposed fiber device was a significant step forward in the development of a stable fiber-based birefringence controller or a low-speed electro-optical modulator. Figure 9 shows as an example, the tunability of the transmission window in a dual-frequency LC-filled PCF at around nm.
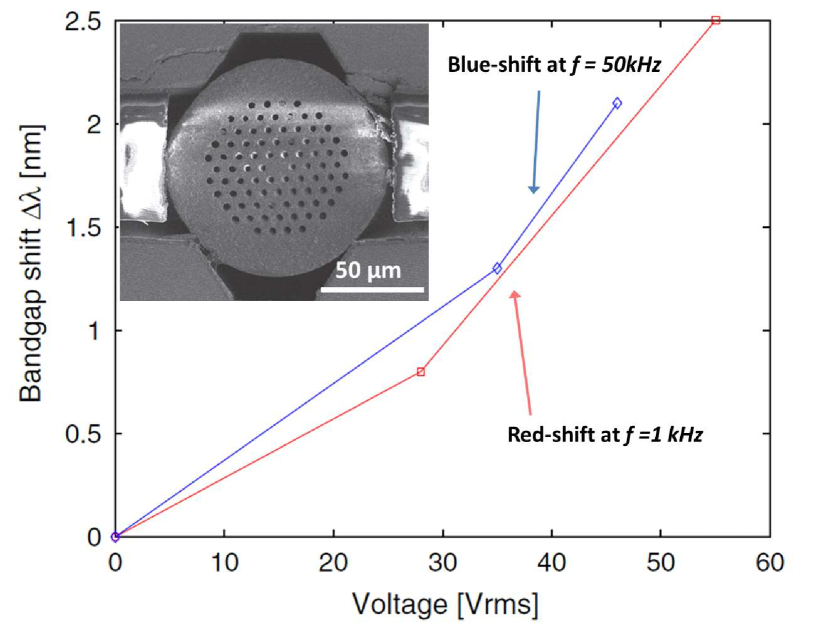
In 2009, Wei et al. (2009a) moved a step forward and reported a fully compact electrically controlled broadband LC-filled PCF polarizer. By controlling the electrodes attached to the LC-filled PCF independently, the direction of the electrical field is rotatable and effectively rotates the optical axis of the polarizer in steps of . The fiber device was tested under different driving voltages, , in the C-band ( wavelength range) and the polarization extinction ratio was found to be as high as Wei et al. (2009a). The main drawback of the proposed fiber device was the high insertion loss (up to ) limiting its use in real all-fiber communication systems where low-loss fiber components are required. However, the same research group interestingly demonstrated for the first time, that the proposed fiber could be effectively used as optically fed microwave true-time delay Wei et al. (2009d). They showed that a modulated microwave signal which was coupled into the hybrid LC-filled PCF and converted back to electrical microwave signal could be significantly phase-shifted with a corresponding power change.
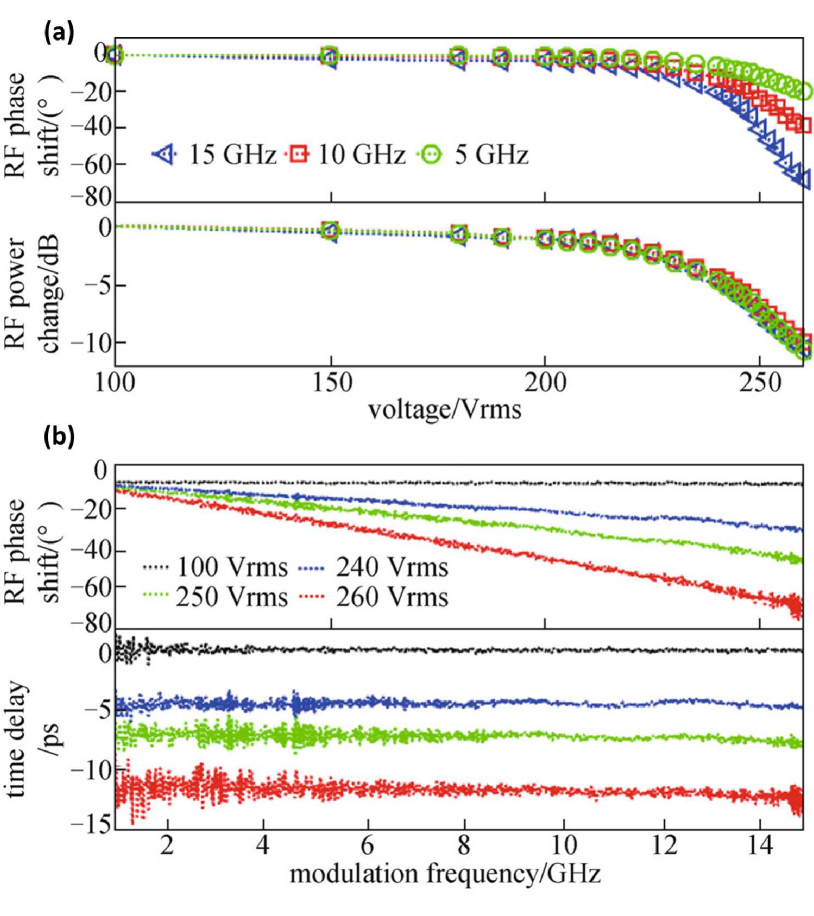
Figure 10 (a) shows how the RF signal and the change in power can be dramatically affected with respect to the driving voltage for different modulation frequencies. The results demonstrate a continuously tunable RF phase shifter by simply changing the driving voltage with a maximum RF phase shift of around C at a modulation frequency of . Similarly, Fig. 10 (b) shows how the phase shift and the corresponding time delay change with respect to the modulation frequency for different driving voltages. At 260 , an averaged time delay over the whole measurement bandwidth is achieved, which indicates a broadband microwave true-time delay. The reported results from Wei et al. show that although the compact LC-filled PCF might not be suitable for long communication systems but it can be easily integrated into microwave photonic systems and act as tunable true-time delay at different microwave or millimeter-wave frequency bands Wei et al. (2009d).
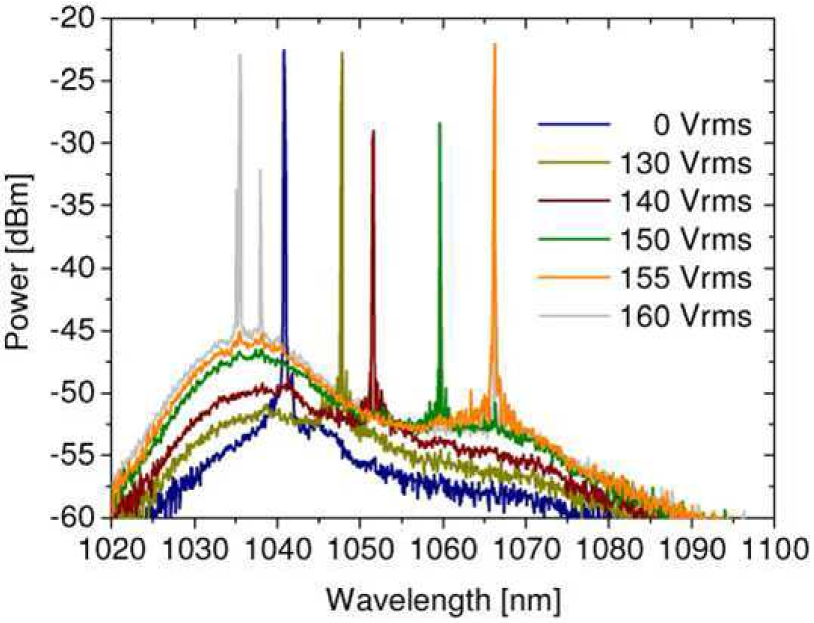
In 2010 A. Shirakawa et al. reported that combining the wavelength filtering effect due to PBG confinement with an ytterbium-doped core can be used for the development of solid-core PBG fiber lasers and amplifiers Shirakawa et al. (2009). The bandgap efficiently suppresses the amplified spontaneous emission (ASE) at the conventional ytterbium gain wavelengths around and enables both short and long wavelength operation. Olausson et al. (2010) reported that merging the PBG fiber laser concept with the tunability offered by LCs could be an efficient way to tune the laser line. They measured a dynamic tuning range of ( to ) by direct modulation of the driving voltage in a LC-filled PCF as shown in Fig. 11. The proposed approach could be further improved by reducing the cavity losses or by reducing the number of components and interfaces in the cavity between LC-PCF and Yb-doped PCF Olausson et al. (2010). However, this is the first report showing the potential of LCs to be used as active tunable media for low-cost, compact and easy-to-use tunable seed sources for fiber amplifiers.
Various and more advanced fiber components were also demonstrated based on LC-PCFs. For example, devices based on mechanically induced long period gratings (LPGs) in which the resonant dip can be tuned either by pressure or applied electric field has been demonstrated by Noordegraaf et al. (2007). They showed that the resonance wavelength could be widely tuned up to nm/∘C in the temperature interval from 55∘C to 59∘C. Later in 2009, Scolari et al. (2009) found that the functionality of LCs could be further expanded by introducing barium titanate (BaTiO3) nanoparticles inside the original LC matrix.
In conclusion, the use of LCs with solid-core PCFs opened a new way of developing active and passive fiber-based components. Many interesting tunable devices have been demonstrated over the past years such as variable waveplates and switchable polarizers Scolari et al. (2005); Wei et al. (2009b); Lee et al. (2010); Li et al. (2016), filters Noordegraaf et al. (2008); Du et al. (2008); Lee et al. (2010, 2013); Liu et al. (2014); Sun et al. (2015); Li et al. (2016), sensors Alkeskjold et al. (2007); Woliński et al. (2009); Mathews et al. (2011); Wolinski (2012), tunable grating filters Noordegraaf et al. (2007); Wei et al. (2009c), polarization devices Tartarini et al. (2007); Lesiak et al. (2007); Wei et al. (2010); Liou et al. (2011), and tunable lasers Olausson et al. (2010). Further optimization of the optical losses would be an essential step in order for the proposed devices to find their way to the market. Novel LC synthesis or combinations with different electro-optic characteristics could be also an alternative route to further enhance the performance of the LC-filled PCF devices.
II.1.2 Other high-index liquids
We discussed the most important advances in the topic of LC-filled PCFs for the development of tunable devices. Here we focus our attention on other liquid and solid high-index materials (i.e. those with refractive indices higher than silica) that have been infiltrated inside the air-holes of solid-core PCFs enabling the realization of similar devices and sensors. Due to the extensive existing literature, we decided to refer only to a number of selected works that we believe have had a dominant impact on the field.
Liquids
In 2005, Steinvurzel et al. reported a highly tunable bandpass filter by applying a variable thermal gradient in a liquid-filled PCF Steinvurzel et al. (2005). The active thermo-refractive infused material used was a commercially available high-index fluid with refractive index and . The authors experimentally measured continuous tuning of the width of each band from to effectively zero and achieved a high out-of-band suppression. Similar high-index fluid with refractive index was also used in a different configuration by Wu et al. (2009) for the development of a refractive index sensor. In that work the authors reported a novel sensor architecture integrating only one single high-index inclusion - in the form of a microfluidic analyte channel - within the solid-core PCF (see Fig. 12 (a) and (b)). The selectively filled PCF formed a directional coupler, with the analyte channel being a waveguide itself. The transmission of the PCF presents dips when the fundamental mode couples to a mode of the analyte channel, with the coupling wavelength depending on the refractive index of the analyte. The main novelty of the proposed sensing device is that the microstructure allows the core mode to couple to higher-order modes of the analyte channel just above the cutoff, leading to extremely high sensitivities. Typically, a refractive index sensor will have a resonance feature (e.g., a resonance peak in the spectrum) whose resonant wavelength depends on the refractive index to be measured. Therefore, the sensitivity which is one of the most important factor determining the performance of a sensor is defined as White and Fan (2008):
| (11) |
When higher-order modes of the high-index fluid waveguide in the work of Wu et al. become leaky modes, their mode field expand, and rapidly they become higher order modes of the microstructured high index core. These modes have effective refractive index, below that of the host material’s fundamental mode. There is thus a wavelength close to the cutoff wavelength of the high-index fluid cylinder at which both the fundamental silica core mode and the higher order mode of the high index channel are phase-matched and couple Wu et al. (2009). This coupling introduces a strong resonance in the transmission as shown in Fig. 12 (c) and (d).
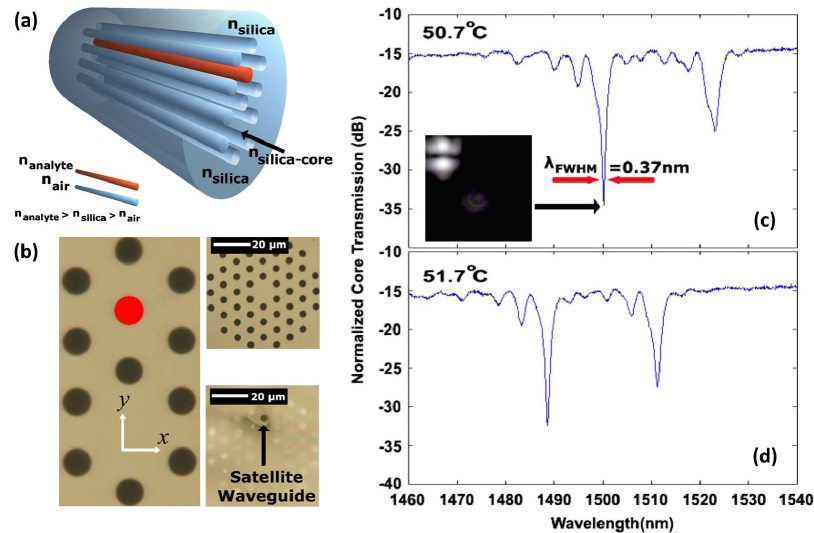
The resonant peak is dramatically blue-shifted with a small increase of the temperature (see Fig. 12 (c) and (d)). The sensitivity was found to be as high as nm/Refractive Index Unit (RIU). It should be noted however that the proposed directional coupler geometry described above can be applied only for analytes with refractive index higher than the host material Wu et al. (2009). This is certainly a problem for several bio-applications such as the detection of biomolecules typically found in aqueous, low-index solutions. The authors reported that one possible solution to this problem could be to coat the holes Kuhlmey et al. (2009a) or directly draw a fiber using a low-index material (CYTOP) which has a refractive index of only 1.34 Wu et al. (2009). Nevertheless, the aforementioned directional coupler holds the record refractive index sensitivity in fibers until today.
Magnetic liquids such as ferrofluids belong also to the family of functional high-index materials as they have been used for the development of all-fiber magnetically tunable devices Blue et al. (2016). In 2011, Thakur et al. (2011) infiltrated the Fe3O4 nano-fluid inside a polarization-maintaining solid-core PCF for the first time and they demonstrated a magnetic field sensor. The sensing mechanism was relying upon tracking the wavelength shift of the interference fringes introduced by the two orthogonally polarization modes. The measured sensitivity was measured as high as 242 pm/mT Thakur et al. (2011). Zu et al. (2012) reported that by raising the refractive index of the magnetic liquid (using toluene) and modifying the guidance from index-guiding to ARROW the magnetic sensitivity can be significantly enhanced. The authors introduced the high-index fluid into the holes of a 20 mm section of a PCF. The revealed resonances were shifting by modulating the external magnetic field. The sensitivity was found to be as high as 15600 pm/mT over a range of 3 mT magnetic field strength Zu et al. (2012) and the proposed device holds the record sensitivity in PCF grating-free magnetic field sensors. However, it should be mentioned that the fiber device had an insertion loss of 6 dB Zu et al. (2012). In 2013, Gao et al. infiltrated a water-based magnetic fluid into the air holes of a 10.4 cm long solid-core PCF demonstrating for the first time an intensity-based magnetic sensor Gao et al. (2013). As the magnetic field was increasing, the refractive index of the fluid was increasing introducing thus high confinement loss making the transmission drops. The reported sensor exhibited a linear response from 20 up to 60 mT with sensitivity 0.011 W/mT Gao et al. (2013). In 2015, Mahmood et al. demonstrated for the first time a novel magnetic field sensing configuration based on whispering gallery modes (WGM) Mahmood et al. (2015). The authors showed that infiltration of a magnetic fluid doped with nanoparticles inside a 1.3 cm long PCF can form a micro-resonator. They demonstrated the shft if the WGM resonances toward higher wavelengths upon applying a magnetic field. The sensitivity of the proposed sensor was found to be as high as 110 pm/mT in the magnetic field range from 0 to 38.7mT Mahmood et al. (2015).
II.1.3 Chalcogenide glasses
Chalcogenide glasses, containing the chalcogen elements sulfur (S), selenium (Se) and tellurium (Te), have existed for more than 60 years, yet they have only recently been proven as emerging materials offering new possibilities in photonics Seddon (1995); Eggleton (2010); Eggleton et al. (2011). Their most important optical properties are perhaps their extremely high nonlinear coefficients which can be even 1000 times higher than silica (depending on the glass composition), high refractive indices , photo-tunability properties when illuminated with light at wavelength near their band-gap edge and most importantly their ability to be transparent in the infrared region. Both linear and nonlinear optical properties of chalcogenide glasses have been extensively investigated over the past years by the glass and ceramic research community Eggleton et al. (2011). Schmidt et al. (2009) reported for the first time the development of a post-processed all-solid PBG fiber by pumping molten tellurite glass into a silica-air photonic crystal fiber at high pressures. The hybrid tellurite/silica PCF revealed strong resonances in its transmission due to the coupling of the core mode to the high index infused glass. However, the micrometer-diameter tellurite strands are found to contain micro-heterogeneities arising most probably from devitrification, resulting in an elevated fiber attenuation Schmidt et al. (2009). The proposed technique from Schmidt et al. offered for the first time an alternative for the development of hybrid geometries with glasses unsuitable for direct fiber drawing that could be potentially used for fiber-based amplifiers, filters and nonlinear devices Schmidt et al. (2009). The later pressure-assisted infiltration method was further investigated a year later by Da et al. where they developed a full model on what are the rheological properties and flow of highly-viscous molten of two chalcogenide glasses (As2S3 and 75TeO2-10ZnO-15Na2O) in highly constrained m-scale geometries under high mechanical load Da et al. (2010).
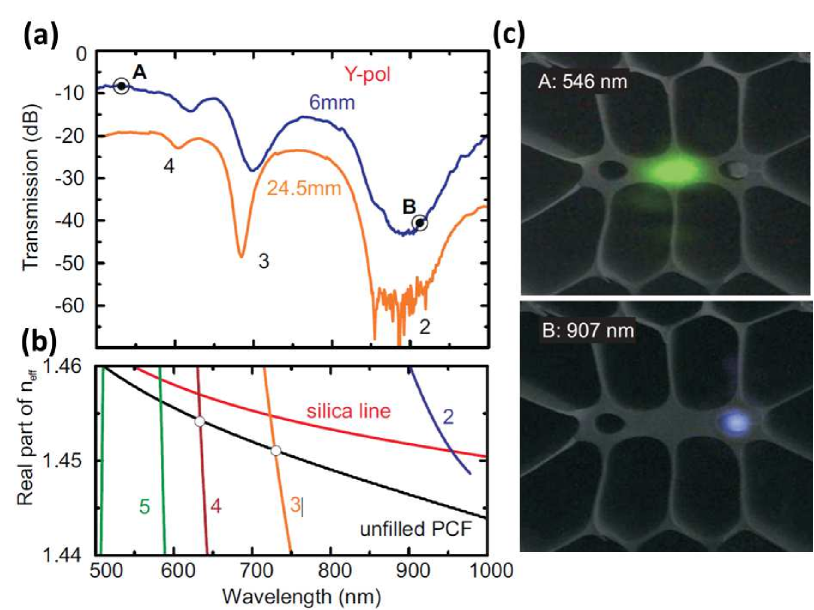
In 2011 Granzow et al. reported the fabrication of a hybrid chalcogenide/silica PCF using a similar pressure-assisted melt filling method and an arsenic-free chalcogenide glass (Ga4Ge21Sb10S65) Granzow et al. (2011). Figures 13 (a) and (b) show the schematic of the hybrid chalcogenide/silica PCF and the scanning electron micrograph (SEM) of the fabricated device, respectively.
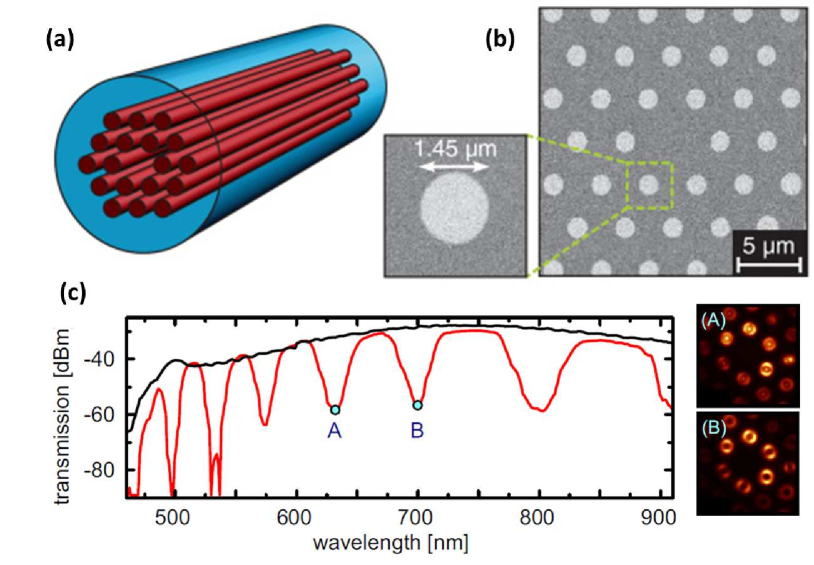
By launching light into the hybrid PCF from a supercontinuum source, distinct resonances appeared from nm up to 900 nm as shown in Fig. 13 (c) due to the coupling of light from the core to the high index strands. The near field output profiles of the cladding strands are also shown in Fig. 13 (c) (points A and B) verifying the core mode coupling to the high index strands which eventually introduces the observed strong transmission resonances Granzow et al. (2011).
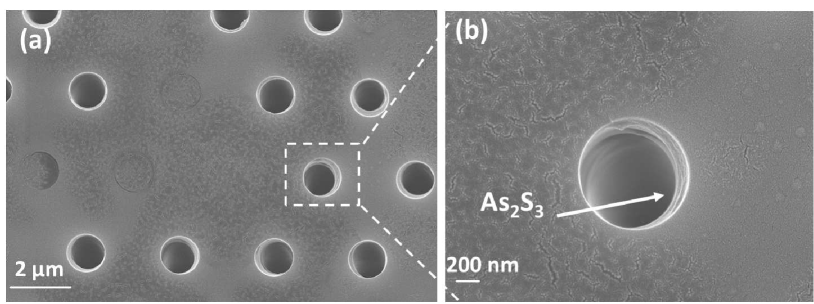
The pressure-assisted approach to melt filling of the chalcogenide glass presented previously is certainly an efficient and straight forward way for the development of hybrid soft-glass/silica PCFs. It is pertinent to note however that the infiltration of the molten chalcogenide glass is achieved under inert atmosphere (Ar) at high pressure (50 bars) and high temperature (665∘C) where custom-made and specialized equipment is required. In 2012, it was reported for the first time by Markos et al. (2012b) a new facile and cost-effective method of depositing As2S3 chalcogenide glass films inside PCF by using a solution-derived approach simply requiring ambient conditions and no sophisticated equipment. This method involves the dissolution of the initial bulk material into liquid. After the infiltration of the PCF with the liquid glass, a soft-anneal post-processing is required for the formation of solid chalcogenide glass layers inside the holes of the PCF. One of the most important advantages of this approach was the possibility to modify the guidance mechanism of the fiber from index-guiding to ARROW with only a few nanometers thick high-index glass films with the air-holes of the fiber still available for further functionalization or post-processing Markos et al. (2012b, 2014); Markos (2016); Markos et al. (2015). Figure 14 (a) and (b) show the SEMs of the As2S3 coated PCF based on the glass-solution approach. The main advantage of this method is that it can be adopted for any chalcogenide glass composition and can be extended to any solution-dissolved material Konidakis et al. (2014a, 2015) or even for stacked multi-material layer deposition. However, uniform film deposition over long fiber lengths still remains a challenging task.
II.1.4 Semiconductors
Semiconductor-based photonics started back in late 1950s, during which the optical properties of many materials were investigated. Today, silicon (Si) is still perhaps the most widely used material in integrated photonic circuits owing to its high transparency in the C-band Jalali and Fathpour (2006), while germanium (Ge) is attracting a lot of interest in the mid-IR “molecular fingerprint” region Soref (2010). Fabrication of crystalline or amorphous semiconductor fibers for optoelectronic applications is a difficult task due to their thermal, chemical and mechanical mismatch with the conventional silica glass fibers. However, it has been already reported by Ballato et al. (2008) the successful fabrication of step-index fibers with a silicon core using either direct fiber drawing Ballato et al. (2008); Suhailin et al. (2016) or by using the recent laser-assisted recrystallization method Coucheron et al. (2016). Similarly, many efforts have been focused on the combination of semiconducting materials using silica PCFs as template Peacock and Healy (2016); Tyagi et al. (2008); Peacock et al. (2014)777Direct drawing of novel optoelectronic fibers of thermo-mechanically compatible materials have been thoroughly investigated by the group of Prof. Fink at Massachusetts Institute of Technology (MIT). See review Abouraddy et al. (2007)..
Germanium is considered an indirect semiconductor which means that the maximum energy of the valence band occurs at a different value of momentum to the minimum in the conduction band energy. It is one of the most widely used semiconductors for optical devices due to its low loss transparency window from 2 m up to 16 m Soref (2010). Using the pressure-assisted melting method it has been demonstrated that Ge can be successfully integrated inside the holes of the PCF for in-fiber devices and sensors Tyagi et al. (2008). The main reason for choosing Ge over other semiconductors is its lower melting point in comparison to silicon and silica (400∘C lower than fused silica). This large thermal difference ensures stability during the filling of molten germanium into the empty holes of PCFs. In contrast for example integration of Si inside PCF can be challenging as the melting points of the two are quite close and therefore the risk of destroying the PCF microstructured air-hole pattern during infiltration is high. Using a selective-filling method, Tyagi et al. (2008) developed a hybrid PCF with only one hole in the vicinity of the glass-core is filled with Ge. Figure 15 (a) and (b) show the SEM image of the integrated single Ge wire inside PCF.
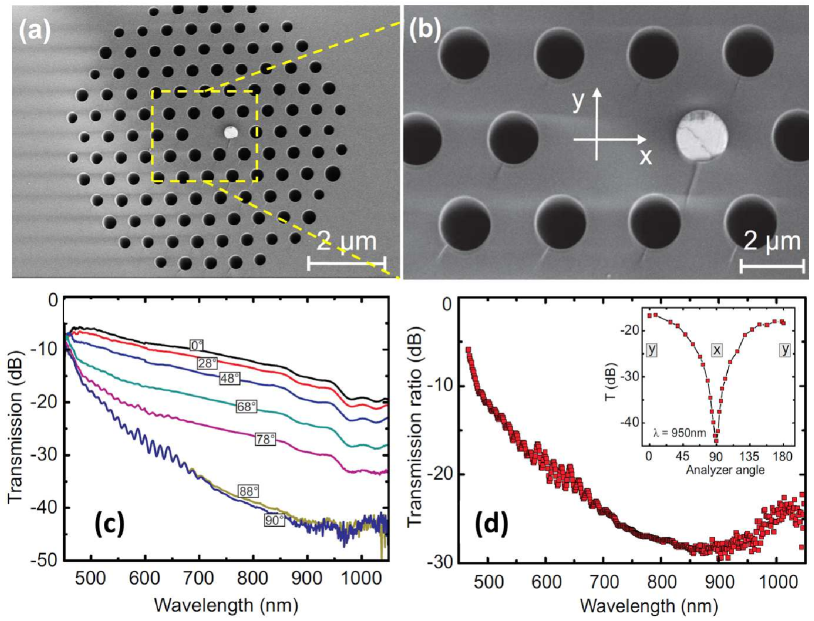
As it is expected, the high index Ge strand adjacent to the core breaks the degeneracy of the fundamental mode creating thus two strong polarization states. By coupling broadband light, the transmission spectrum decreases as the polarization axis of the output changes from y- to x- polarization as shown in Fig. 15 (c) Tyagi (2011). Figure 15 (d) shows the spectral distribution of the ratio between the two polarization states over the visible and near-IR region. No strong oscillations up to nm wavelength were observed and with a polarization discrimination as high as 30 dB in the visible confirming thus the ability of the current fiber device to act as polarizer Tyagi et al. (2008). Moreover, it was shown that such a hybrid structure could act as an in-fiber thermometer by tracking the shift of the loss peaks of the transmission. The sensing mechanism is relying upon the fact that with the increasing temperature the indirect electronic band gap of Ge decreases shifting thus the absorption band to longer wavelengths. The dielectric function increases due to Kramers Kroenig’s relation and thus a shift of the loss peaks is observed. The thermal sensitivity was found to be nm/∘C which is comparable or even higher than other temperature fiber sensors such as Bragg ( 0.01 nm/∘C) or long period () gratings sensors Tyagi et al. (2008).
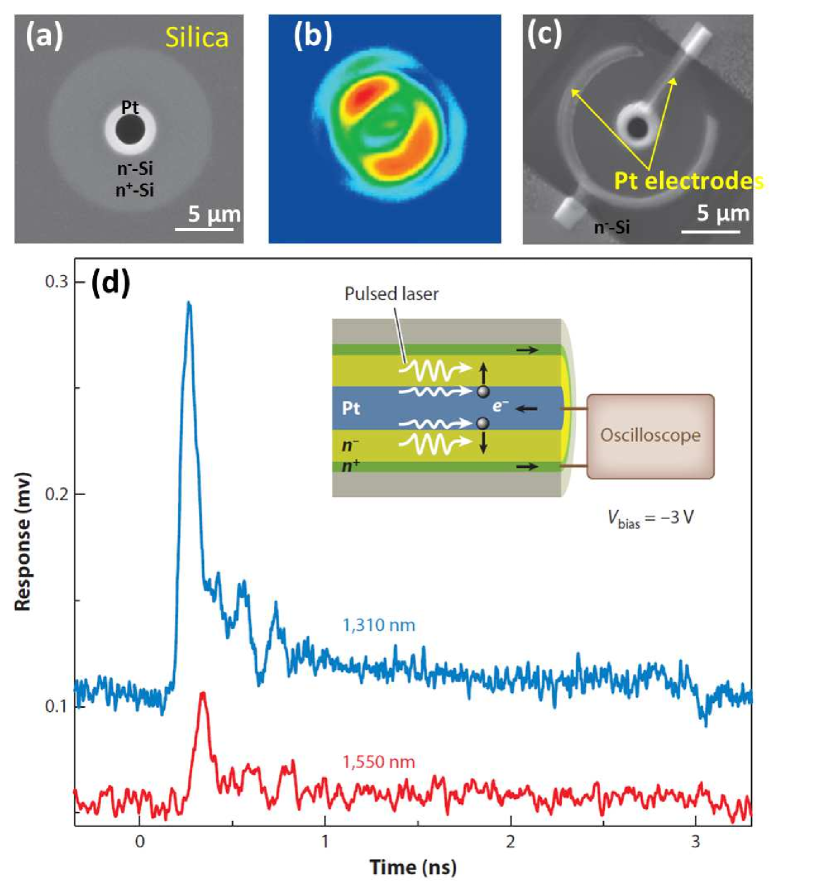
Even though the pressure-assisted filling approach for filling PCF with low-melting-temperature semiconductors constitutes a straight forward method for the development of hybrid structures Lee et al. (2008); Schmidt et al. (2008), it also has some limitations. For example, this technique is limited to materials with melting temperatures below the glass-transition temperature (Tg) of silica (1300∘C) Peacock et al. (2014). Furthermore, integration of precisely structured films by means of this technique as well as multi-material integration appears to be difficult and rather challenging tasks. One way to tackle these limitations is by employing the well-known high-pressure chemical vapor deposition (HPCVD) technique. Appropriately chosen chemical precursors along with a carrier gas (e.g. helium) are pumped at high pressures into a reservoir. Once the PCF is placed inside the reservoir, the precursors are running along the length of the fiber through the air-holes due to the high pressure environment. Thermal treatment of the fiber gives rise then to chemical reaction of the precursors which eventually lead to the formation of the desired layer or wire inside PCF. Sazio (2006) first reported this method towards development of polycrystalline elemental or compound semiconductors within silica PCF in a flexible and controllable way. Interestingly, Badding’s group further investigated this approach for the development of optoelectronic fibers Sparks et al. (2013). In 2012, it was shown that fast and efficient detection of light in the C-band is possible by using directly functional optoelectronic fibers avoiding the use of lossy planar junctions. Figure 16 (a) shows the multilayer deposition of doped crystalline semiconductors inside silica capillaries and selected voids of PCFs He et al. (2012). The Pt/n-Si junction structures confines and guides the light in the n- layer because the n+ layer has a lower refractive index and there is metallic reflection at the n-/Pt interface as it can be seen from Fig. 16 (b). The fundamental mode at nm is HE11. Using focused ion beam (FIB), these junctions could be contacted as shown in Fig. 16 (c). Optical experiments were performed at both nm and nm using 10-ps laser pulses. Figure 16 (d) shows the photoresponse of the junction inside the fiber having a 60-ps rise time and a 100-ps fall time, at nm under bias voltage of − 3 V He et al. (2012). Similar response time but with bigger photoresponse observed at nm wavelength. The authors suggested how the photo-response of the built-in device can be further enhanced by considering different metal electrodes with lower work function, smaller-bandgap semiconductors and optimization of the layer geometry Sparks et al. (2013).
II.2 Hybrid metal-filled plasmonic PCF
One of the challenges faced by modern optics nowadays is breaking the diffraction limit and achieving sub-wavelength scale optical waveguides. Perhaps the most promising platform for achieving this is surface plasmon polaritons (SPPs) where electromagnetic waves (EM) can be guided in a metal-dielectric nanostructure below the diffraction limit having still high bandwidth Maier (2007). The most prominent materials which exhibit collective oscillations of electron densities with EM are metals888Silver plasmon resonance has been recently reported using a silver metaphosphate glass-filled PCF by Konidakis et al. (2014b).. One of the first SPPs observation was by Sommerfeld and Zenneck in 1899 and 1907, respectively Sommerfeld (1899); Zenneck (1907). These studies were mainly focused on long wavelengths while Kretschmann and Ritchie reported the excitation of SPPs at visible range in 1968 using a prism coupling Kretschmann and Raether (1968) and metal grating Ritchie et al. (1968), respectively. More recently, Ebbesen et al. (1998) reported that the field is strongly enhanced in arrays of sub-wavelength holes in metal substrates reporting the first strong light-SPPs coupling in nanostructured metal surfaces. Since then excitation of SPP via surface structuring has became more popular. For a detailed and more comprehensive overview on plasmonics and nanophotonics the books by Novotny and Hecht Novotny and Hecht (2006), Maier Maier (2007), Bozhevolnyi and Raether Raether (1988) are recommended. Here, we overview the most important reports on generated SPPs using a hybrid metal-filled PCFs as a route towards plasmonic structures for on-chip applications or in-fiber polarization devices Lee et al. (2008); Lee (2012).
II.2.1 Linear properties of metals
It is well known that metals are electron-rich materials with concentrations N of the order . The optical response of metals is mainly originate from the conduction electrons. With the free electron theory of metals Maier (2007), the dielectric function and the absorption of light due to the electron transition to higher energy states with respect to the conduction band can be closely approximated. The electron transport in metals is often described by the Drude model Drude (1900) which for the design of plasmonic structures is perhaps the most important parameter. The plasma frequency is usually in the range of Hz. To derive the expressions for and (dielectric permittivity) of a metal we start by calculating the oscillation amplitude of a free electron under the action of an external electric field Sempere (2010). The differential equation governing this is given by:
| (12) |
where is the frequency of light, the electron mass and its amplitude. The factor is damping constant of the material which is related to the scattering rate of the electrons. is the relaxation time of the electron gas Ordal et al. (1983). The left hand side of Eq. 12 describes the acceleration and the frictional damping of the electron while the right hand side describes the force exerted by the light. Assuming a solution of the form into Eq. 12 we get:
| (13) |
The induced polarization is given by , where is the number density of free electrons. Also, and by replacing we end up with:
| (14) |
Therefore:
| (15) |
where the plasmonic frequency is:
| (16) |
The Drude model equation which represents the permittivity of metals is described by Eq. 15 and can be divided into its real () and imaginary part () as following:
| (17) |
| (18) |
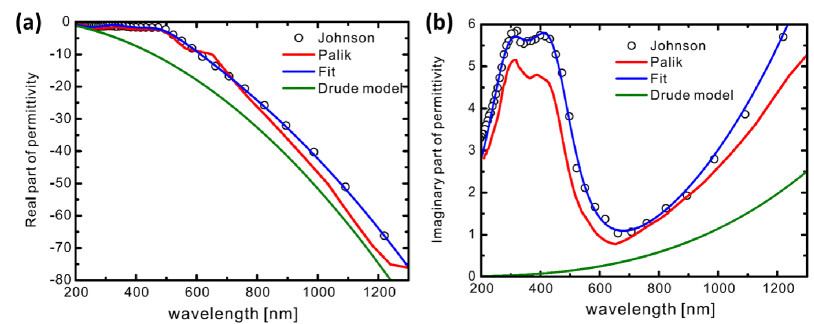
It should be noted that for most metals, inter-band transitions (valence – conduction band) also contribute to the absorption and thus for frequencies close to the inter-band transition (usually in the short visible range), the Drude model is not valid anymore. In this review article, we focus only on gold (Au) as it is perhaps the best plasmonic material for the fabrication of hybrid PCFs due to relatively low imaginary part of dielectric function (which is linked to optical absorption of Au) in comparison to other metals. Figure 17 (a) shows the real part of the dielectric permittivity of Au taken from the experimental data of Johnson and Christy (black circle) Johnson and Christy (1972) and Palik’s Handbook of Optical Constants of Solids (red line) Palik (1997). The analytic fit of the experimental data (blue line) Etchegoin et al. (2006) and the calculated values based on the Drude model (green line) using Eqs. 17 and 18 are also shown. Similarly, Fig. 17 (b) shows the imaginary part of the permittivity for Au. It is evident that the Drude model (green line) fails to describe the response of Au in the range of nm. This is because the Drude model does not include the absorption arising from the inter-band transitions as we mentioned before Lee (2012).
II.2.2 Fabrication of plasmonic PCF
Although the integration of glass wires and films inside PCF has been reported using various techniques Schmidt et al. (2008); Markos et al. (2012b), the most convenient way of filling molten metal (or semiconductors) inside PCF is perhaps the pressure-assisted method Tyagi et al. (2008); Schmidt et al. (2009); Lee et al. (2011). The main challenge of pushing molten metals inside PCF’s holes is to overcome the anti-capillary force introduced from the very high surface tension of the metal which acts negatively and pushes the molten metal out of the holes. The smaller the diameter of the holes, the bigger the threshold pressure required Lee et al. (2011).
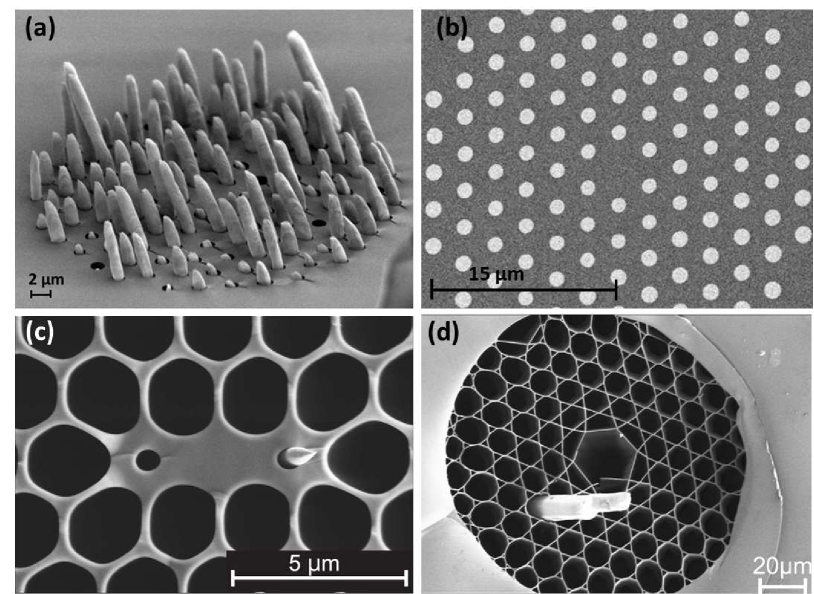
In 2008, Schmidt et al. (2008) reported the successful fabrication of both gold and silver metal wire arrays inside a PCF with diameters down to nm using a high temperature pressure cell. This method was further improved over time and at the moment the integration of metal wires inside PCF can be achieved with a fiber splicer and a pressure cell Lee et al. (2011), a furnace to liquefy the metals and a pressure system providing pressurized argon up to a few hundreds bar. The main advantage of this technique is that all or only selected air channels (using selective filling masking methods) of a PCF can be filled. Figure 18 (a) shows how the integrated metal wires into a solid-core PCF are sticking out before polishing the fiber. One method of polishing the end facet of the fiber is using the focused Ga ion beam to ablate small amounts of material and mill the metal Sempere (2010). However, this method is expensive and time consuming. Figure 18 (b) shows the clean polished end-facet of the fiber. Figure 18 (c) and (d) show the selective integration of Au wires in a polarization-maintaining solid-core PCF and a kagomé hollow-core PCF, respectively. The pressure assisted technique is a versatile method for the development of hybrid PCFs but it also has some drawbacks as mentioned in Section II.A.2. For instance the infused molten material length is restricted to the hot zone of the furnace which is typically around 10s of cm. However, for plasmonic applications, a few centimeters long metal-filled PCF is normally more than enough for efficient excitation of SPPs.
II.2.3 Plasmon resonance-induced polarization effects
The core guiding mode in a plasmonic metal-filled PCF can be coupled with SPPs when the phase matching conditions are satisfied Maier (2007). These hybrid fibers have wavelength dependent transmissions because the core guided light couples to leaky SPPs at particular frequencies. Selective filling of individual air holes with metal brings inherently enhanced polarization-dependent transmission which could be eventually used for the development of in-fiber absorbing polarizer or notch filters.
In 2008, Lee et al. demonstrated for the first time how the polarization properties of a highly birefringent PCF can be further improved by incorporating a 6 and 24.5 mm long gold wire in the x-axis of a PM-PCF Lee et al. (2008). The transmission spectrum of the fiber device shows distinct dips at wavelengths where the core and SPPs phase match and couple as shown in Fig. 19 (a). The real part of the plasmonic modes (indicated as m=2, 3, 4 and 5) can be calculated analytically by considering an isolated Au nanowire integrated in a silica host. Comparing the experimental with the simulated data (Fig. 19 (b)), it can be clearly seen that the dips in the transmission spectra correspond to anti-crossings between core mode and plasmonic modes on the wire. Slight blue-shift of the experimental dips are due to narrow air-gaps between the metal wires and the silica glass wall. Figure 19 (c) shows the near-field profile of the PM-PCF with the integrated metal wire. For the on-resonance state (i.e. the dip in the transmission at nm), the light is concentrated in the high index metal wire while for the off-resonance state ( nm), the light is confined in the silica core Lee (2012). In this work, the authors reported a maximum on-off-resonance ratio of 45 dB measured in a 24.5 mm long sample with a nm diameter Au wire and maximum resonance loss of .
In 2011, Uebel et al. investigated the polarization properties of the spiral SPPs of metal wires and experimentally demonstrated a novel approach for the generation of azimuthal beams Uebel et al. (2011). The proposed structure consisted of a gold nanowire running axially through the center of the solid glass PCF core (Fig. 20 (a) and (b)). This hybrid structure has the property of transmitting only the azimuthally polarized mode, with all other guided modes being strongly absorbed Uebel et al. (2011). It is worth noting that the output azimuthal polarization was completely independent from the input polarization state as shown Fig. 20 (a). The polarization extinction ratio was more than 1:10000 over the spectral range from nm up to nm Uebel et al. (2011). Therefore, it could be used as effective broadband transmission filter for a single, doughnut-shaped mode being azimuthally polarized. The azimuthal polarization properties of the proposed metal-filled PCF are mainly introduced due to the different amount of magnetic field of the three supported modes inside the metal wire. The fundamental and radially polarized modes have about one order of magnitude more field in the gold (and consequently higher loss), only the azimuthal mode thus remains after a certain propagation distance, leading to efficient azimuthal polarization excitation as shown in Fig.20 (c). Furthermore the polarization state can be converted from azimuthal to radial by simply using two waveplates Uebel et al. (2011).
Nagasaki et al. (2011) showed numerically that the location of the metal wires in the silica PCF cladding has a crucial effect on the polarization properties of the hybrid structure. They also showed that a large polarization extinction ratio in the PCFs filled with several gold wires aligned parralel to each other can be achieved and they predicted the importance of arranging the metal wires close to each other for high polarization-dependence. Effects arising due to combining more than one metal wire along with the impact of their relative locations with respect to the silica core was then experimentally investigated by Lee et al. (2012). They found that a pair of metal wires being in the close proximity of each other could act as a plasmonic “molecule” where hybridized modes are excited at specific wavelengths by launching light into the glass core. These hybridized modes introduce strong spectral splitting when light couples from the silica core to the nanowire pair mainly due to the hybridization of the plasmonic “orbitals” and the formation of bonding and anti-bonding states Lee et al. (2012).
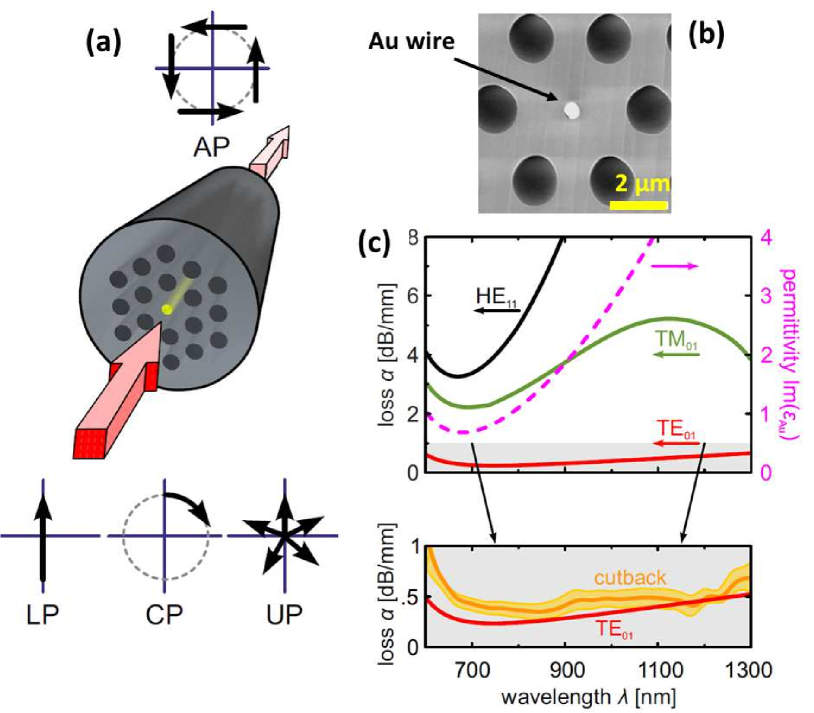
In conclusion, integration of metal elements inside silica PCFs opened the door to exploitation of novel fundamental effects such as plasmonics. Furthermore, the use of more than a single metal wire inside PCF could be useful for further investigations such as gap-plasmons, subwavelength interaction of metal nanowire arrays, etc. Lee et al. (2012).999It should be mentioned that interesting investigations have been also recently reported based on step-index fibers with embedded side metal wires or nanotips Uebel et al. (2013); Tuniz et al. (2016).
II.3 Nonlinear effects in hybrid solid-core PCF
In the previous sections we were focused on how the linear properties of fluids and solids could be efficiently used for the development of sensing and tunable devices. Here, we discuss the nonlinear properties of different liquids that have been combined with silica PCFs for generation of fundamental nonlinear effects such as tunable diffraction and self-defocusing, generation of spatial solitons, nonlinear coupling in an optofluidic fiber and supercontinuum generation.
II.3.1 Nonlinearities in liquids
Shimizu (1967) reported for the first time spectral broadening in liquids due to self-phase modulation. The main reason of using liquids for the investigation of nonlinear effects was that the Kerr nonlinearity can be several times higher than silica (see Table 1). Until a few years ago, the experiments with liquids were mainly performed in liquid cells or capillaries of a few centimeters long Bridges et al. (1982); He and Prasad (1990). New horizons appeared with the advent of PCFs, have made the interaction of intense light pulses of high peak powers with matter over interaction lengths of hundreds of meters a reality.
The retarded response of any nonlinear material can be described by a function in the generalized nonlinear Schrödinger equation (NLGSE). A number of different physical effects contribute to the response function and therefore it can be rewritten as Hellwarth et al. (1971); Etchepare et al. (1985):
| (19) |
The first contribution is due to the electron motion arising from the incoming light. The tightly bound electrons lead to a response time of a few femtoseconds. For a laser pulse with a duration of several hundred femtoseconds, the electron motion is considered instantaneous and thus the temporal dependence can be written as function. The second contribution is coming from the Raman effects. The function describes the temporal response Pricking and Giessen (2011). A general form of has been thoroughly described by Pricking and Giessen (2011) in which they show that the fission length of a launched higher-order soliton dramatically increases if the characteristic time of the retarded response is close to the input pulse duration. They also investigate the effect of the retarded response on the soliton self-frequency shift. The final contribution is arising by the molecular re-orientation Y.R.Shen; (1984); Sutherland (1997); Vieweg (2012). This effect occurs only in gases and liquids. The molecules are aligned by the incoming light and then provide a significant polarizability through a sequence of delayed full and partial alignment revivals Y.R.Shen; (1984); Sutherland (1997). Depending on the liquid, the delay time can be from femtosecond regime up to a few picoseconds Levine et al. (1975); Kajzar and Messier (1985); Mcmorrow et al. (1988). This dramatic influence of molecular re-orientation can lead to high nonlinearity of some liquids compared to solids where the main effects are coming only from the electronic part. The influence of the retarded response of liquids in fluid-filled fibers to the soliton dynamics has been also thoroughly investigated in Conti et al. (2010); Pricking and Giessen (2011).
For the observation of nonlinear effects in liquids, one of the most crucial parameters is their nonlinear refractive index. Furthermore, the absorption of the liquid must be relatively low in order for the nonlinearity to take place after pumping the liquid. For example a material with one of the highest nonlinear refractive indices, is Salol () (see Table 1). However, it has several O-H groups and therefore it has strong absorption peaks in the near-infrared (NIR), which makes this liquid not suitable for optical experiments, at least for NIR. and on the other hand their nonlinearity is not that high as Salol but they have relatively high transparency in the visible and NIR region. Some of the most popular liquids that have been used for nonlinear experiments are summarized in Table 1.101010The data extracted fromStolen and Lin (1978); Ho and Alfano (1979); Couris et al. (2003); Itoh et al. (2004); Vieweg (2012).
| Name | () |
|---|---|
| Water () | 1.3 |
| Ethanol () | 7.6 |
| Toluene () | 170 |
| Carbon disulfid () | 514 |
| Salol () | 1540 |
| Chloroform () | 31 |
| Carbon tetrachloride () | 15 |
| Fused silica () | 2.6 |
II.3.2 Nonlinear fiber devices
Rosberg et al. (2007) experimentally demonstrated that infiltration of a high index fluid (castor oil) inside the holes of the PCFs can act as thermally tunable waveguides themselves. By increasing the temperature, they showed that the thermal nonlinearity introduce dramatic enhancement of the discrete diffraction or self-defocusing in the 2-D microstructure of the fiber cladding having thus a dominant effect in the output power Rosberg et al. (2007). The spatial control of light was enabled by the combined effects of discreteness, strong material tunability and nonlinearity, and was independent on any architectural light guiding core defects as in the case of conventional PCF structures Rosberg et al. (2007). The latter can be used to build a tunable all-optical power limiter Rosberg et al. (2007). Discreteness of waveguide lattices or “discrete optics” was first introduced by Christodoulides et al. dealing with all devices with more than two coupled waveguides Christodoulides and Joseph (1988), which were mostly linearly arranged Christodoulides et al. (2003); Vieweg (2012).
In a similar liquid-filled PCF configuration, Rasmussen et al. (2009) studied the nonlocal nonlinear interaction between the hexagonal lattice sites and demonstrated for the first time the formation of nonlocal gap solitons in a hybrid PCF. The nonlinearity in their system was defocusing and had thermal origin due to the negative thermo-optic coefficient of the infused liquid, while the nonlocality introduced by the diffusive nature of heat transfer. The authors experimentally verified their predictions by using a commercially available PCF filled with a high index fluid. At a constant temperature of 76∘C, the authors observed a linear diffraction at low input power 3 mW (Fig. 21 (a)) corresponding to propagation of approximately three diffraction lengths. Interestingly, at high laser power of 100 mW a clearly nonlinear self-localization observed to almost a single lattice site as shown in Fig.21 (b) Rasmussen et al. (2009).
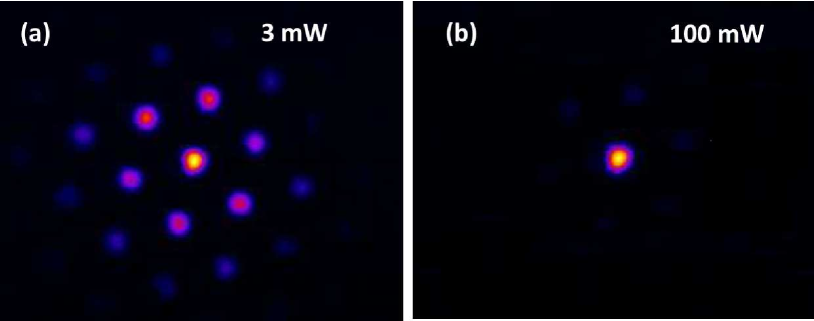
In 2012, Vieweg et al. reported the formation and power dependent of spatial solitons in an optofluidic PCF in which a waveguide array of 5 strands were selectively filled with the nonlinear Vieweg et al. (2012a). The authors observed power dependent spatial soliton formation in this selectively liquid-filled PCF with enhanced nonlinear optical properties Vieweg et al. (2012a). Moreover, they also demonstrated how the spatial solitons can be influenced and hence controlled by the thermo-optical effect provided by the infused liquid.
Even though the thermal nonlinearity of liquid-filled PCFs offered the possibility for some interesting investigations within the discrete optics field, the most crucial factor for enhanced nonlinear effects is still the nonlinear or Kerr coefficient of a material. An all-optical switch using the material Kerr nonlinearity to control the switching behavior was first proposed by Jensen (1982). In the linear regime, it is well-known that the control of the output power ratio for a fixed length cannot be controlled optically but only by applying an external perturbation. The case is different if the two waveguides being in close proximity exhibit strong Kerr nonlinearity. In conventional fused silica couplers or dual-core fibers Friberg et al. (1987, 1988), the nonlinear switching is significantly limited due to the low . However, the use of highly nonlinear liquids overcomes this limitation offering higher levels of nonlinearity while the host material can be still the well-grounded and mature silica.
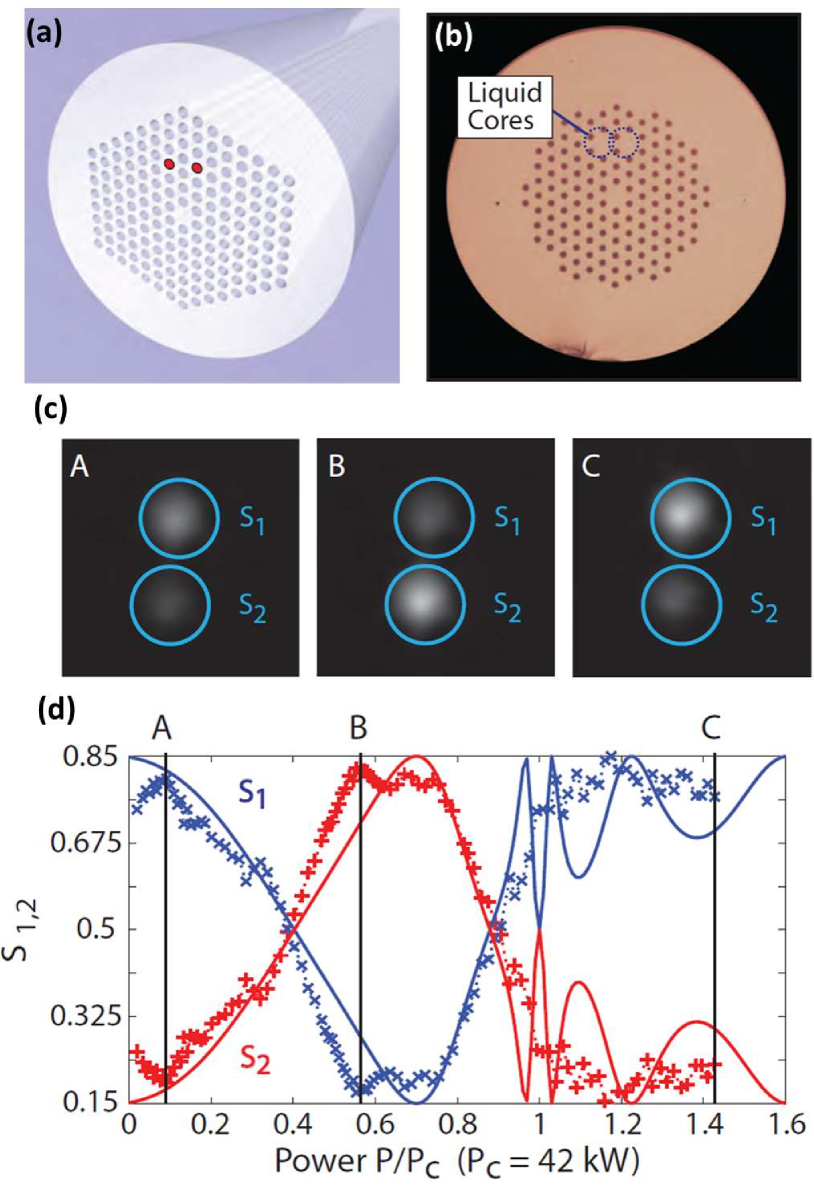
In 2012, Vieweg et al. demonstrated a novel optofluidic nonlinear coupler fabricated by selective filling of two strands of a silica PCF with the liquid as shown in Fig. 22 (a) and (b) Vieweg et al. (2012b). As it can be seen from Table 1, has a relatively much higher nonlinear refractive index compared to silica () Stolen and Lin (1978) and consequently a large ultra-fast Kerr nonlinearity. By pumping one of the strands with laser pulses ( nm at 20 MHz repetition rate, 180 fs pulse duration), the authors demonstrated a clear power dependent coupling between two channels (indicated as S1 and S2). The recorded near-field intensity patterns of the two liquid filled holes at different input powers as well as the normalized power distribution of the coupler, is shown in Fig. 22 (c) and (d), respectively Vieweg et al. (2012b); Vieweg (2012).
II.3.3 Nonlinear propagation and supercontinuum generation
Group velocity dispersion (GVD) has a crucial role in waveguides for the efficient generation of nonlinear effects as it will be also discussed in Section III.D Ranka et al. (2000); Dudley et al. (2006). For hybrid PCFs, the GVD is a combination of the infiltrated, host material and the waveguide dispersion. Fuerbach et al. (2005b) characterized for the first time the nonlinear propagation of ultra-short pulses ( 70 fs) from a Ti:Sapphire laser through a high-index fluid-filled PCF. The infused PCF had a zero dispersion wavelength (ZDW) at nm and therefore soliton propagation at around nm was observed well below the material’s ZDW. The authors demonstrated, by tuning the laser line around the location of the ZDW, soliton propagation and red shifting, as well as the formation of dispersive waves in the normal dispersion regime Fuerbach et al. (2005a). With increasing power however, self-phase modulation (SPM) compensated the dispersive broadening and therefore a soliton appears. The length of the hybrid PCF was fixed at 180 mm. Figure 23 (a) and (b) shows the simulated and measured spectral evolution with respect the input power pumped close to the ZDW, respectively. A red-shifted soliton appears when the fiber was pumped into the anomalous dispersion regime. The soliton shifts towards longer wavelength with increasing powers, due to the Raman soliton self-frequency shift. On the other side of the ZDW, dispersive waves were also generated Fuerbach et al. (2005a). It should be emphasized that the location of the ZDW wavelength can be controlled based on the infiltrated liquids. Furthermore, the ability to control the refractive index of the infused material using thermal, electrical or optical ways enables new highways for adiabatic soliton compression or optimized supercontinuum generation Travers et al. (2005); Kudlinski et al. (2006).
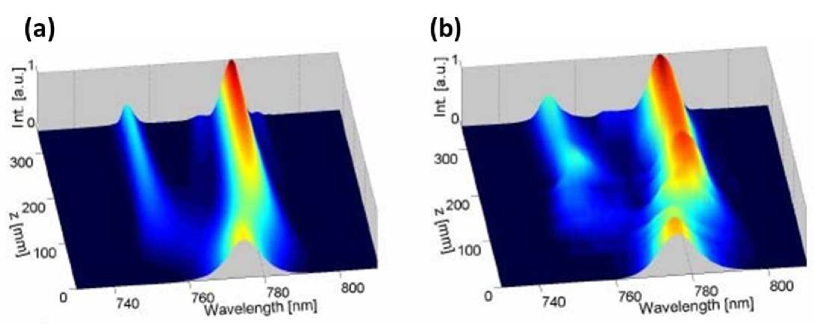
The idea of obtaining supercontinuum generation in a PCF whose core is filled with highly nonlinear liquids ( and nitrobenzene) was first theoretically proposed by Zhang et al. (2006). They predicted that efficient continuum from nm to more than nm can be generated by pumping the hybrid liquid-filled PCF in the anomalous dispersion regime with sub-picosecond pulses at nm. Interestingly, Bozolan et al. (2008) reported first that supercontinuum generation can be even achieved in distilled water. By selectively filling the central hole of a HC-PBG, the guiding mechanism was converted from bandgap to index-guiding Bozolan et al. (2008). The authors reported spectral broadening from 600 to 1140 nm in the water-filled PCF pumped close to the ZDW of the fiber with pulses having 1.45 MW peak power Bozolan et al. (2008).
Two years later in 2012, Bethge et al. (2010) further investigated the possibility of using water as nonlinear medium and reported two-octave spectral coverage from to nm. The main advantage of the proposed water filled PCF was that compared to continua spectra generated in glass core PCFs, the liquid core supercontinua show a much higher degree of coherence. Moreover, the larger mode field area and the higher damage threshold of the water core enabled significantly higher pulse energies, ranging up to 0.39 J Bethge et al. (2010). Similarly, Phan Huy et al. (2010) investigated both numerically and experimentally the self-phase modulation in liquid-filled PCFs.
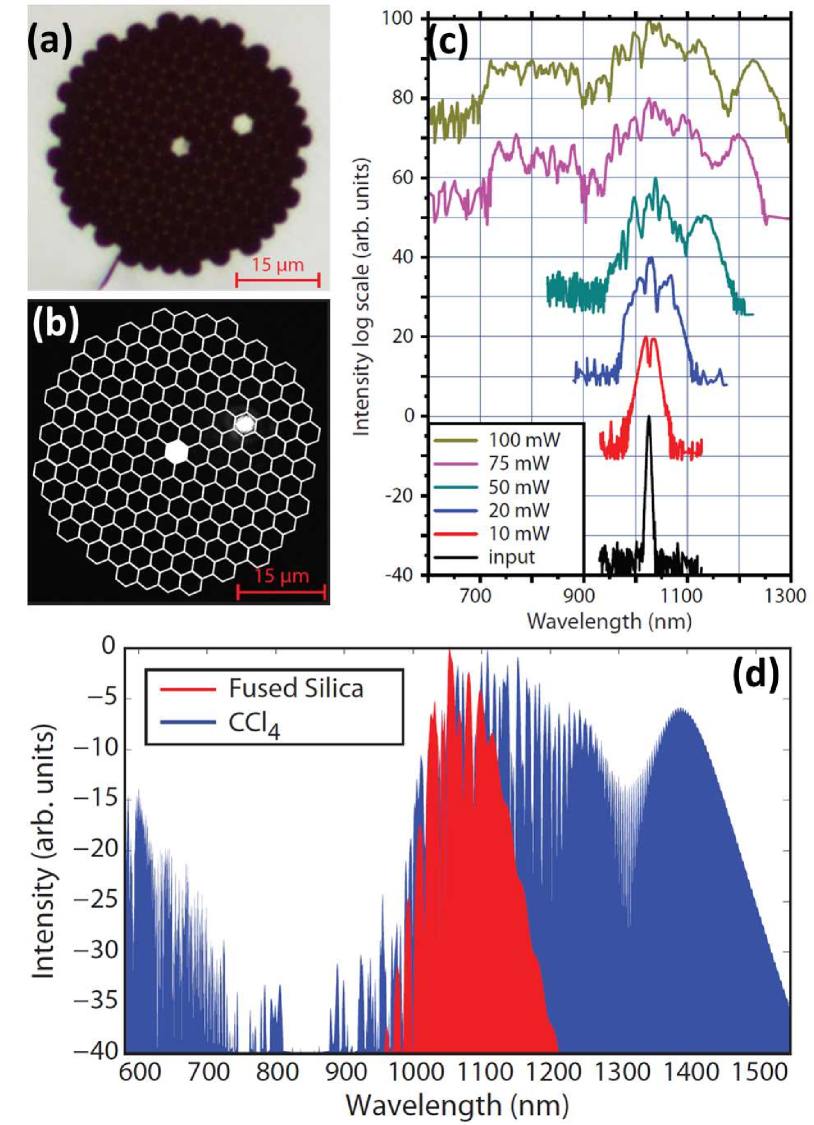
Vieweg et al. (2010) used instead of water as the active nonlinear medium for supercontinuum generation. By selectively filling a single strand of a commercial PCF (Fig. 24 (a) and (b)), the authors used an Yb:KGW oscillator with a repetition rate of 44 MHz ( 210 fs long pulses at nm) to pump the formed liquid waveguide. Figure 24 (c) shows the spectral evolution in a 26 cm long filled single strand with respect the incoming power. For low input powers, SPM takes places while as the power increases then there is soliton formation and the Raman-shift of solitons become clearly observable Vieweg et al. (2010). At full power of 100 mW, the authors obtained a spectral broadening of nm, covering the spectral region from nm to nm. The spectrum revealed the red-shifting soliton as well as dispersive waves in the blue-edge region Vieweg et al. (2010). This spectral broadening could not be achieved simply by using a silica PCF with the same diameter due to lack of high nonlinearity Vieweg (2012). Using numerical simulations, the authors showed the tremendous influence of the nonlinear refractive index on the generated spectrum. Figure 24 (d) provides a direct comparison of how the supercontinuum spectrum is significantly reduced if the nonlinear refractive index of silica (red) was used instead of (blue) keeping all the other parameters the same Vieweg (2012).
The most important common advantage of all the aforementioned reports is that the ZDW can be tuned accordingly by appropriately choosing the core diameter of the host fiber as well as the active liquid material. This provides a great degree of flexibility to move the ZDW in wavelengths where high power and low-cost laser sources exist. In general, liquid-filled PCFs (including the selectively filled fibers) offer the basis of a plethora of new reconfigurable and versatile nonlinear optical fiber devices with unprecedented performance. There is still plenty of room for improvements as well as future investigations of utilizing for example novel functional nanomaterials or even solution-processed highly nonlinear materials for enhanced nonlinear applications Kuhlmey et al. (2009b); Alexander Schmidt et al. (2016).
III Gas-filled Hollow-core PCF
III.1 Introduction
The study of the interaction of laser light and gases and plasmas is of major importance to science. Section II was focused on the most important advances on hybrid PCFs combined with solid and liquid materials. This section of the article on the other hand summarizes achievements using gas-filled hollow-core photonic crystal fibers (gas-filled HC-PCFs). Gases and partial plasmas offer the greatest transparency range of any nonlinear active media and hence enable the largest spectral extent for nonlinear experiments. They also offer access to the nonlinear response of atoms and molecules in their most pure form, often without significant influence from neighboring molecules, a fact highlighted by New and Ward (1967) in the first report on third harmonic generation in gases. This enables direct tests of quantum mechanical calculations of nonlinear coefficients, simplifies understanding of complex dynamics, and provides a means for nonlinear spectroscopy of basic molecular processes. Gases and plasmas also have much higher damage thresholds than other nonlinear media and are, in a sense, self-healing (i.e. if we ionize the gas it eventually recombines again, unlike solids which become permanently damaged); this allows energy and intensity scaling of nonlinear devices to their most extreme limits. Finally, many molecules of spectroscopic interest, either in the atmosphere or of importance to biology, can be sensed in gaseous form.
A waveguide geometry offers a number of clear advantages. Firstly, there is the usual argument for fiber optics, that we can significantly increase the light-matter interaction, characterized by the intensity-length product , compared to any focusing geometry. This enables much lower thresholds and higher efficiencies for what can often be weak nonlinear processes. Secondly, in the correct fibers, the waveguide dispersion can be used to qualitatively alter laser pulse propagation dynamics by introducing anomalous dispersion. Gas media are almost exclusively normally dispersive at optical frequencies. An additional “control knob” on the dispersion enables a whole new range of dynamics–most remarkably soliton interactions with gases and plasmas; something not possible in a bulk geometry.
For these reasons, hollow capillary fibers (HCF), made from a single hollow core inside a solid glass cladding have proved extremely successful as hosts for gases and liquids in optical experiments. Ippen (1970) already used them for nonlinear optics, and they currently form the basis of intense few-cycle laser pulse compressors in ultrafast science (see Section III.6.2). By introducing a microstructure to the cladding further control over the propagation losses and dispersion properties of the waveguide can be achieved as described in Section I.2. The general class of gas-filled HC-PCFs has dramatically improved our ability to tailor the context of light-gas interaction. The primary difference to hybrid PCF filled with solids or liquids is that gases are compressible, and hence the gas number density is directly related to, and controlled by, the applied gas pressure. Consequentially the nonlinearity and dispersion of the waveguide system can be tuned almost real-time during an experiment, and perhaps more significantly, without additional fabrication steps.
The potential for interesting devices and effects to be observed in gas-filled HC-PCFs, was noted in the first report of such fibers by Cregan et al. (1999). Since then a very large number of results have been obtained. Here we attempt to provide a holistic review, with most of our focus on nonlinear optics. The reader is additionally directed to existing partial reviews of the topic111111Benabid (2006); Bhagwat and Gaeta (2008); Dudley and Taylor (2009); Benabid and Roberts (2011); Travers et al. (2011a); Russell et al. (2014); Saleh and Biancalana (2016)..
III.2 Types of gas-filled HC-PCF
There are two primary types of hollow-core PCFs used for gas-based optical devices and experiments, as outlined in Section I.2: those based on the photonic band-gap effect, which we label as HC-PBG, and those based on anti-resonance or inhibited coupling guidance, such as kagomé or single-ring negative-curvature HC-PCF, which we refer to in what follows as broadband-guiding HC-PCF. This latter class includes a wide range of structures. The most prominent among them for gas-based optics has been the kagomé HC-PCF, perhaps with negative curvature in the core (also referred to as hypocycloid core-contour design Wang et al. (2011)). But it must be stressed that in terms of guidance properties, especially dispersion and nonlinear properties, all of the broadband-guiding HC-PCFs are extremely similar, and results observed in one kind of fiber will almost certainly be observed in another for similar parameters.
III.3 Canonical experimental setup
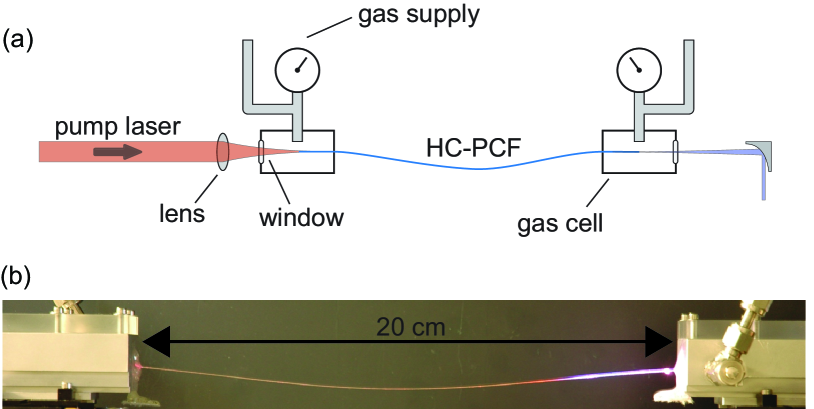
Fig. 25 shows the canonical arrangement for investigating optics in gas-filled HC-PCF. The fiber is held between two gas cells which form a gas and vacuum tight seal between the core and microstructure of the fiber and the ambient atmosphere. Through these gas cells the fiber can be both evacuated and filled with different gases or gas mixtures121212The dynamics of the gas filling have been considered in a number of works, such as Henningsen and Hald (2008); Dicaire et al. (2010); Ermolov et al. (2013); Wynne and Barabadi (2015).. Pressures over 50 bar can be routinely administered. Additionally, as the only path between the two gas cells is through the fiber itself, a pressure (and hence gas density) gradient can be formed between them, either increasing or decreasing. This allows the optical properties of the fiber as a whole, i.e. the nonlinearity or dispersion, to be modified axially through the fiber, in a similar way to a tapered solid-core fiber. The resulting pressure distribution inside the fiber can be obtained from the standard equations for pressure-volume flow and the conductance of a circular bore to be
| (20) |
where is the axial fiber coordinate, is the fiber length, is the pressure at the input and is the pressure at the output. If a pressure gradient is not required, the fiber can be placed inside a tube that connects the gas cells. In this way it was shown by Azhar et al. (2013b) that extremely high pressures can be reached, exceeding 150 bar. Lynch-Klarup et al. (2013); Azhar et al. (2013a) both demonstrated that HC-PCF can even be filled with Xenon (Xe) in the supercritical state, at where its density increases dramatically (see Fig. 26(a) below). Taking the drive for increased density to a further extreme, Azhar et al. (2012) demonstrated nonlinear optical interaction inside a HC-PCF filled with liquid Argon (Ar). Although in that initial result, throughput was limited due to the formation of menisci at the gas-liquid transitions, one can imagine ways to circumvent that issue.
In the usual system, shown in Fig. 25, light is coupled in and out from the gas cell through windows, carefully selected and positioned to avoid nonlinear effects of the focusing beam and absorption for the spectral range under interest. Typically, few-mm silica windows are sufficient, but for example, thinner MgF2 windows can be used for VUV applications.
Generalizations of the setup in Fig. 25 include delivering the output directly to a differentially pumped vacuum chamber for VUV or XUV experiments Ermolov et al. (2013); Fan et al. (2014); Tani et al. (2017), connection to a VUV spectrometer Belli et al. (2015); Ermolov et al. (2015) or avoidance of gas-cells altogether by splicing the HC-PCF directly to solid-core fibers, as shown by Benabid et al. (2005).
III.4 Properties of gas-filled HC-PCF
III.4.1 Attenuation
The key advantage that HC-PCF has over conventional HCF is low intrinsic attenuation and bend loss even for very small core sizes (e.g. core radius m). The record low loss of an HC-PBG is around 1.7 dB/km (Mangan et al. 2004), and for broadband-guiding HC-PCF it is usually closer to 0.1 dB/m with recent reports demonstrating losses as low as 7.7 dB/km Debord et al. (2017). While this latter value is still high compared to conventional fibers, it is sufficient for nonlinear experiments that use a few meters or even just a few centimetres; still providing a very large advantage over free-space focusing. While the low loss allows experiments and devices to use small core sizes, the low bend loss also enables flexible fiber delivery of laser light and probing of difficult to access locations, such as vacuum, hazardous locations (nuclear reactors) or the human body. In contrast HCF has very high bend loss and an attenuation constant that scales approximately (for the HEnm mode) as , where is the wavenumber and is the zero of the Bessel function Marcatili and Schmeltzer (1964a). For a 30 m core diameter, as commonly used with broadband-guiding HC-PCF with dB/m, a HCF will have a loss value of 44 dB/m. Therefore, while HCF is used very successfully for guiding intense (mJ-scale) laser pulses over lengths of a few meters in large cores ( m), considerable new nonlinear optical physics and applications can be opened up by using smaller-core HC-PCF.
III.4.2 Mode propagation constant
The propagation constant and dispersion of narrowband guiding HC-PCF such as those based on a photonic band-gap (HC-PBG) or other narrow-guidance HC-PCF, does not have a simple analytical expression. In general one must solve finite element (FEM) simulations or similar to obtain the mode field patterns and dispersion curves.
Broadband-guiding HC-PCFs in contrast, such as kagomé HC-PCF or single-ring negative-curvature HC-PCF, have a modal dispersion that is very well approximated by that of HCF (away from resonances). Following Stratton, Julius Adams (1941), a simple analytical expression for the axial mode propagation constant of the HEnm mode of HCF was found by Marcatili and Schmeltzer (1964a),
| (21) |
where is the effective mode index, is the vacuum wavenumber and is the gas density dependent refractive index of the filling gas. Eq. 21 is derived under several approximations, including that the core size , where is the wavelength under consideration.
The accuracy of Eq. 21 for modelling broadband-guiding HC-PCF has been verified by multiple FEM analyses Im et al. (2009); Travers et al. (2011a) and by a number of direct experiments in the near-infrared (IR), visible and ultraviolet (UV) Nold et al. (2010); Finger et al. (2014). As HC-PCFs rarely have circular cores there is some ambiguity about the value to assign to in Eq. 21. Travers et al. (2011a) found that for the hexagonal core shapes of conventional kagomé HC-PCF the so called area-preserving core radius (defined so that the resulting circle has the same area as the actual fiber core) gives better agreement for the propagation constant.
At longer wavelengths, m, with usual core diameters (i.e. m) Eq. 21 becomes less appropriate as the condition that is violated. In that case, Finger et al. (2014) noted that the dispersion estimated using Eq. 21 significantly diverges from both measurement and FEM analysis. They introduced a frequency dependent definition of the core size to partially correct for the error. In practice this works well, but its advantage compared to full FEM simulations is somewhat reduced by the fact that, to be trustworthy, it requires some empirical factors that themselves usually require a number of data points from FEM calculations for the specific fiber structure. In addition, it is more usual to use larger core broadband-guiding HC-PCF at longer wavelengths Yu and Knight (2016), which mitigates the deviation from Eq. 21.
III.4.3 Pressure tunable dispersion
Even for a fixed waveguide structure, Eq. 21 allows for easy tuning of the frequency dependent propagation constant, and hence dispersive properties of the fiber, simply by changing the gas pressure. The total refractive index of a filling gas made from multiple species is
| (22) |
where is the number density of species and is its frequency dependent linear polarizability, which can be obtained from published Sellmeier equations131313See e.g. Börzsönyi et al. (2008); Peck and Huang (1977); Shelton and Mizrahi (1986). Note that there is an error in the coefficient for Xe in Börzsönyi et al. (2008), it should be rather than .. For ideal gases one can replace in Eq. 22 with the relative pressure multiplied by a reference density, where and are the partial pressure and temperature of species , and , and are for the given standard conditions. However, care must be taken when working with gases that are not ideal. In particular, Xe and Kr at room temperature and above 10 bar behave far from ideal, as shown in Fig. 26(a).
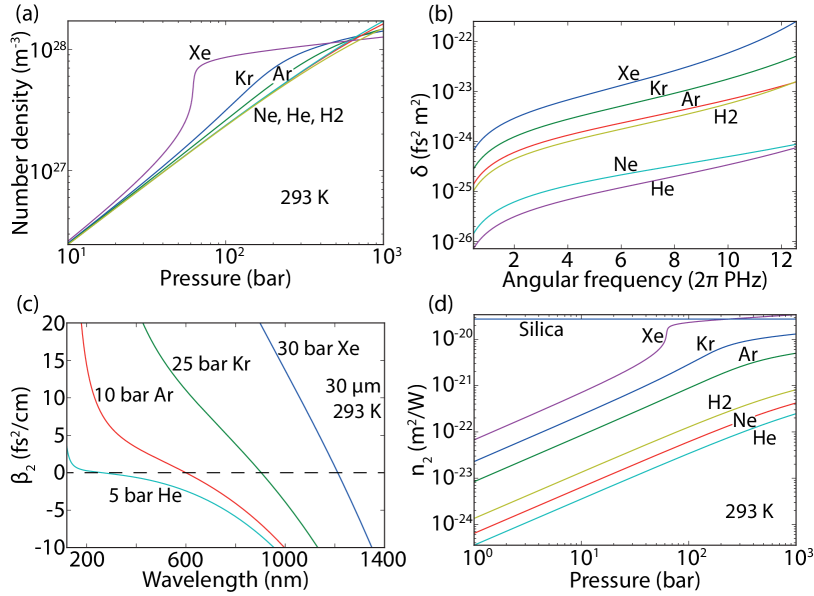
The modal GVD is given by , using Eq. 21 we find that
| (23) |
where is the angular frequency, is the vacuum speed of light, and
| (24) |
is a quantity that depends on the gas species (through the molecular polarizability and its frequency dependence) only, and not the gas pressure. It is plotted in Fig. 26(b) for a number of common gases.
The second term of Eq. 23 shows that the total GVD of a gas-filled HC-PCF has an anomalous (negative) component that increases strongly for small core sizes and low frequencies. From Fig. 26(b) we see that is always normal (positive) for optical frequencies. Therefore, by balancing the core size and gas pressure (through ) one can tune the zero dispersion point, given by , of the overall mode dispersion. As an example, Fig. 26(c) shows dispersion curves for some common fiber parameters. The zero dispersion point is easily tunable from nm to nm, and the dispersion values are of the order 10 fs2/cm over a wide range. These parameters are ideal for ultrafast nonlinear dynamics, and this facility for tuning the dispersion landscape is of key importance in tuning and controlling the nonlinear dynamics that occur inside the fiber, as we shall see in subsequent sections.
III.4.4 Third order nonlinearity of the filling gas
The instantaneous third order nonlinear susceptibility of a gas , directly scales with its number density Butcher and Cotter (1991), thus the total of a gas mixture is simply the weighted sum of its constituents
| (25) |
where and are known for each gas for some standard conditions141414See e.g. Lehmeier et al. (1985); Shelton (1990); Wahlstrand et al. (2012).. We can define an associated nonlinear refractive index, as usual through .
The number densities shown in Fig. 26(a) scale , so for Xe the increase in nonlinearity is significantly super-linear with gas pressure. Fig. 26(d) shows for common gases as a function of pressure. Note that supercritical Xe can have a nonlinear Kerr coefficient exceeding that of fused silica, but without the Raman contribution. This can be useful for quantum optics applications which require high nonlinearity for e.g. parametric generation, but for which Raman is a source of noise photons (see Section III.11).
III.4.5 The effective mode area
The effective mode area of a mixed material PCF needs to take care of the differing light-field intensities in different fiber regions, and the associated differences in . One approach is to use a material specific effective area
| (26) |
with the lower area integral over regions of different materials labelled by . In Eq. 26 are the transverse electric fields of the mode , and describes the transverse coordinate.
For HC-PCFs or other broadband-guiding HC-PCFs where the light is almost exclusively guided in the filling-gas151515Typically, the peak intensity in the glass is more than three orders of magnitude lower, and the total area of the light-glass overlap is five orders of magnitude smaller Travers et al. (2011a)., the integrals are effectively over the core-region with the filling gas alone, and a very good approximation for effective area of the HE11 mode can be found from the analytic mode functions of HCF Marcatili and Schmeltzer (1964a), to be . For a typical broadband-guiding HC-PCF core radius of 15 m, the effective area is m2. This should be compared to solid-core PCF which can have effective areas smaller than 1 m2.
For HC-PBG fibers the integrated intensity over the glass region of the fiber can become quite large, and the glass nonlinearity can become non-negligible. Luan et al. (2004) first noticed this and found that the nonlinear contributions from the two regions can be almost equal. Therefore there are usually two contributions for HC-PBG fiber, one from the filling gas, as in broadband-guiding HC-PCF, and the other from the glass material making up the fiber structure. The approach of Eq. 26 was first used to assess the total nonlinearity on HC-PBG fiber by Luan et al. (2004) and has also been used in numerical studies by Fedotov et al. (2007) and Lægsgaard and Roberts (2008). Hensley et al. (2007) experimentally showed that the contribution of glass to the nonlinearity of a HC-PBG can vary by nearly an order of magnitude depending on the structure, between an order of magnitude or just a factor of two smaller than the air in the core.
III.4.6 Nonlinear coefficient
The nonlinear coefficient conveniently describes the nonlinear phase acquired as a function of modal power through161616The sign of this phase-modulation is ambiguous and depends on the definitions used when driving the propagation equations. Here we follow the common definition in the fiber optics community.
| (27) |
where is the instantaneous pulse power and is the effective medium length (with the physical length) accounting for linear attenuation .
Using the above definition for the effective area, the total nonlinear coefficient is given by
| (28) |
Compared to conventional fiber and solid-core PCF, is much larger171717There are exceptions, such as very large mode area solid-core PCF. and is usually lower181818Except for example, supercritical Xe., and so the nonlinear coefficient is usually substantially smaller. The consequence is that HC-PCF can be used either for high-power linear pulse delivery, or for extremely high power nonlinear optics. Whereas nonlinear optics in solid-core fiber usually operates around the 10 kW level (or indeed much lower), in HC-PCF 100 MW is more usual, with some experiments exceeding 1 GW.
III.5 Pulse delivery and power handling in HC-PCF
One of the first uses of the low nonlinearity of HC-PCF was for laser pulse delivery. Konorov et al. (2003a) delivered trains of 20-40 ps pulses (separated by 8 ns) with a total energy up to 1 mJ through a HC-PBG with 14 m core diameter, albeit with low transmission. Subsequently Shephard et al. (2004, 2005) delivered 0.5 mJ, 65 ns pulses through HC-PBG for laser micro machining applications.
Recently it has become clear, somewhat surprisingly, that broadband-guiding HC-PCF can be made with extremely low loss in the infrared spectral region, far beyond the silica transmission window Yu and Knight (2013, 2016). Capitalising on this Urich et al. (2012) delivered 14 mJ pulses at the Er:YAG wavelength of 2.94 m, well beyond the normal transmission band of bulk silica.
Humbert et al. (2004) noted that larger core (19-cell) HC-PBG, while handling larger optical powers, have narrower transmission bandwidths than 7-cell designs, and hence are less suitable for guiding ultrashort pulses. In fact, the broad bandwidths supported by broadband-guiding HC-PCF are naturally more suited for ultrafast beam delivery, and recently continuous ps pulse delivery in the green spectral region was demonstrated by Debord et al. (2014a). They delivered 300 nJ, 27 ps pulses at 515 nm over 2 m. Jaworski et al. (2015) further improved on this, delivering 0.57 mJ ns pulses and 30 J, 6 ps pulses in the green spectral region. Further work on average power scaling of ps pulse delivery is ongoing Michieletto et al. (2016).
At even shorter wavelengths, continuous-wave delivery has been demonstrated at 280 nm in the deep-UV Gebert et al. (2014), a region that is more difficult for solid-core fibers due to photo-induced material damage. In addition a large number of experiments generating ultrashort pulses in the deep and even vacuum UV (down to 113 nm) have been reported (see Section III.7.5), indicating that delivery beyond the bulk material transmission window is possible at both spectral extremes.
High energy femtosecond pulse delivery was recently reported by Debord et al. (2014b), who transmitted 600 J of energy (1 mJ input) in 600 fs pulses over 10 m of broadband-guiding HC-PCF filled with 3 bar He. Even larger core fibers have been predicted to handle even larger pulse energies Debord et al. (2015).
It should also be noted that all of the nonlinear experiments reviewed below also constitute a form of laser pulse delivery, with pulse durations fs and peak powers even exceeding 2 GW demonstrated.
In terms of average power handling, there have been many reports of operating broadband-guiding HC-PCF at the level of multiple 10’s of Watts, and recently, Hädrich et al. (2016) established that broadband-guiding HC-PCF could handle killowatt average power levels.
III.6 Self-phase modulation and pulse compression
Instead of high power pulse delivery, the relatively low (compared to solid-core fiber) nonlinearity of HC-PCF can be used for even higher power nonlinear optics as described in the many following sections. Of these, high energy ultrafast pulse compression is perhaps the most successful application of HC-PCF so far.
First demonstrated by Fisher et al. (1969), the compression of laser pulses using self-phase modulation (SPM) to broaden the spectrum with an approximately linear chirp, followed by chirp compensation using a delay line, such as a grating pair Treacy (1968), has become a central tool in ultrafast laser systems. The inherent advantages of using an optical waveguide geometry, which enables one to increase the intense nonlinear interaction length while staying below the intensities for spatial effects such as self-focusing, where recognized by Ippen et al. (1974) and first utilized for compression by Nakatsuka et al. (1981) and Shank et al. (1982).
The maximum of the phase shift acquired by an optical pulse in a fiber is determined from Eq. 27 to be where is the peak power and the second equality defines to be the length after which rad. Pinault and Potasek (1985) estimated191919Following a number of earlier results, such as Fisher et al. (1969) and Stolen and Lin (1978). that as the phase follows the pump intensity, the spectral broadening factor is . Following Fisher et al. (1969), this implies, assuming complete phase compensation, a temporal pulse compression factor of
| (29) |
where we have assumed .
At high pulse energies the use of glass-core optical fibers for ultrafast SPM based pulse compression becomes impossible, as the associated peak powers exceed those for optical damage, or the critical power required for self-focusing and spatial degradation of the beam, Fibich and Gaeta (2000). For silica this limit is MW at 800 nm. This limit depends on power, not intensity, so simply increasing the core size does not overcome it.
III.6.1 Compression using hollow capillary fibers for SPM
A major advance in ultrafast laser science occurred when Nisoli et al. (1996) demonstrated that using gas-filled hollow capillary fibers (HCF), with bore sizes m diameter, for SPM, enables pulse compression of mJ scale pulses to fs. In a further refinement Nisoli et al. (1997) demonstrated compression to fs. Subsequently many results followed, and such short pulses have been achieved at over 5 mJ (Bohman et al. 2010). These pulses are the primary drivers of intense ultrafast laser experiments, including most attosecond experiments202020Brabec and Krausz (2000); Krausz and Ivanov (2009)..
However, for compressing at lower peak powers, just above what is possible with solid-core fibers, HCF suffers from a major limitation, in that its propagation loss scales very unfavorably for the smaller cores required to obtain sufficient nonlinear phase shift. The record low power experimentally demonstrated to date is 100 MW Mansour et al. (2006).
III.6.2 Compression using HC-PCF for SPM
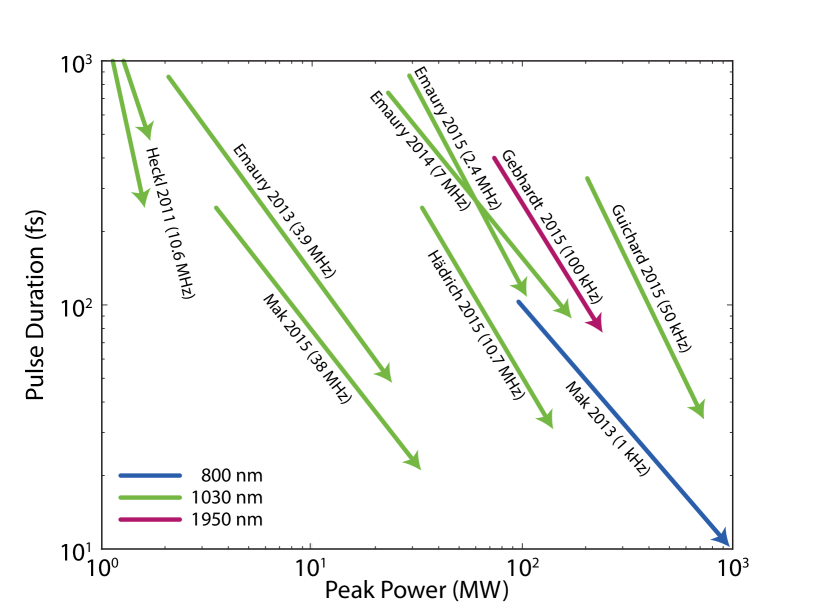
In contrast, the smaller propagation losses of HC-PCF for small core sizes allow for the use of much lower pressures and shorter fiber lengths, in addition HC-PCF has the significant advantage of considerably lower bend loss. They have therefore been widely used for pulse compression in the intermediate regime between solid-core fiber or HCF, with input peak powers between 1 MW to several 100 MW, as summarized in Fig. 27. This power range is of growing importance due to the increasing availability of high repetition rate, fiber or thin-disk based, laser sources in this region. These sources tend to provide pulses in the range of several 100 fs, and hence must be compressed for many ultrafast applications that require few-cycle pulses.
SPM of sub-J pulses was first observed in a PBG by Konorov et al. (2004b), broadening 100 fs pulses with an 8 nm bandwidth to more than 35 nm. However, the output was not compressed. Broadband-guiding HC-PCF, such as kagomé or single-ring negative-curvature HC-PCF, is much more suited to pulse compression as it supports the bandwidths necessary for short pulse compression.
The first demonstration using broadband-guiding HC-PCF was by Heckl et al. (2011), who compressed 1 ps pulses with MW at 10 MHz, down to 250 fs in a 36 m diameter fiber filled with 8 bar Xe. The same group subsequently published several papers with similar pulse durations, but increasing peak power, and over 100 W average power Emaury et al. (2013, 2014). Mak et al. (2013b) demonstrated compression, at 800 nm, from fs to 10 fs at J–the shortest pulses and highest peak power ( GW) so far achieved using SPM-mirror compression. Mak et al. (2015) further demonstrated two stage compression, with the result of an SPM-mirror compressor (21 fs, 33 MW peak power, 28 W average power) as input to a soliton-effect compressor (to be described in Section III.7.4). Guichard et al. (2015) used simply an air-filled kagomé HC-PCF for convenient spectral broadening, and compression to 0.7 GW, 34 fs pulses.
Köttig et al. (2017b) compressed 20.5 J, 329 fs pulses from a fiber laser system operating at 1030 nm, to 24 fs with 17.4 J. At the 1.92 MHz repetition rate, this corresponded to 33.5 W. In that work the pump pulses were converted to circular polarization before the broadband-guiding HC-PCF to reduce the effects of ionization and also the strength of the Kerr nonlinearity. This reduction was used so that a higher gas pressure could be used for the same spectral broadening. In this way the total group velocity dispersion at the pump wavelength can be reduced, improving the quality of the compressed pulses after conversion back to linear polarization and phase compensation.
III.6.3 Using HC-PBG as the linear dispersive element
While the dominant role of HC-PCF in pulse compression at present is as the spectral broadening component, its first use for pulse compression was in fact as the linear delay line to compensate the phase of pulses broadened through SPM in solid core fibers. de Matos et al. (2003, 2004); Limpert et al. (2003), demonstrated that the strong anomalous dispersion of HC-PBG fibers, and low nonlinearity compared to solid-core fibers, meant that they could be used instead of gratings or chirped mirrors, allowing an all-fiber setup for compressing fiber laser systems and all-fiber chirped pulse amplifiers.
III.7 Soliton propagation in HC-PCF
The waveguide contribution to the dispersion of HC-PCF modes enables the GVD to be anomalous, even though most of the light is propagating in gas or vacuum. This has profound consequences for the resulting nonlinear propagation dynamics, as it allows for optical soliton propagation, as first discovered by Zakharov and Shabat (1972). Soliton propagation in solid-core fibers, predicted by Hasegawa and Tappert (1973) and demonstrated by Mollenauer et al. (1980), have been very widely explored Taylor (2005), leading, amongst many other processes to the formation of bright white-light supercontinua Dudley et al. (2006). Until 2003, no temporal optical solitons had been observed in gases, as they are mostly normally dispersive at common optical laser frequencies. Filling HC-PCF with gases removes this limitation, and has enabled a host of new nonlinear soliton dynamics in gases, combining many of the dynamics previously explored in solid-core fibers, such as soliton-effect self-compression and dispersive-wave emission, with the qualitatively different material responses of gases; in particular the molecular response and the fact that photoionization and plasma-effects can be explored without permanent material or waveguide damage.
Soliton dynamics can occur in the anomalous dispersion regime212121When considering bright optical solitons in a medium with positive Kerr nonlinearity–which is most gases at visible-NIR optical frequencies. when the soliton order . is given by222222This is precise only for input pulses with a pulse shape, but is a reasonable approximation in other cases.
| (30) |
where is the duration of the input pulse, and is the length over which linear dispersive effects alter the phase by 1 rad.
Tuning the gas pressure changes and , whereas tuning the core size changes and . Thus significant control over the dispersion, soliton order and the power required for soliton dynamics can be obtained simply by tuning the core size and gas pressure.
III.7.1 Solitons in HC-PBG
The much smaller in HC-PCF, compared to solid-core fibers, means that soliton dynamics occur at much higher peak powers. In HC-PBG fiber the dispersion is also very large (i.e. -30 ps2/m) and anomalous over most of its transmission band, further enhancing this scaling. This was exploited by Ouzounov et al. (2003), who first demonstrated soliton propagation in gas-filled HC-PBG fiber using either air or Xe as the filling gas, and pumping around 1425 nm. The key result was the observation that the output pulses in Xe are almost unchanged from the 75 fs pulses at the input, despite propagating though 1.7 m of fiber with a peak power of 5.5 MW.
In air, a red-shift of the solitons was observed, indicating a soliton self-frequency red-shift (SSFS) reminiscent of that observed in solid-core fibers Dianov et al. (1985); Mitschke and Mollenauer (1986); Gordon (1986). The effect occurs for fundamental optical solitons that have a sufficient coherent bandwidth for impulsive Raman scattering which in turn leads to a red-shift of the pulse, as explained in Section III.9.2. The stability of the soliton effect maintains the integrity of the pulse shape as it downshifts in frequency.
These early results were confirmed over a longer, 5 m, length by Luan et al. (2004), who also noted the soliton shift. Subsequently Ivanov et al. (2006) used frequency shifted MW solitons around 620 nm as the Stokes pulse in two-color CARS experiments (see Section III.9.1).
A dramatic example of the soliton self-frequency shift in air-filled HC-PBG fiber was the work by Gérôme et al. (2008), who demonstrated a Raman-soliton self-frequency shift from 1070 to 1100 nm in an 8 m HC-PBG fiber.
III.7.2 Soliton self-compression in HC-PBG
After observations of soliton propagation and self-frequency shifting, the next key result was the observation of soliton self-compression. Konorov et al. (2005c) observed a slight self-compression of 100 MW, 270 fs pulses in a 9 cm, 50 m core diameter HC-PBG fiber filled with air. Ouzounov et al. (2005) observed compression of 100 fs pulses at 1450 nm to 50 fs at 225 nJ energy after propagating through 24 cm of an HC-PBG fiber filled with 4.5 bar Xe. A number of numerical papers followed (Bessonov et al. (2005); Bessonov and Zheltikov (2006), illustrating some of the dynamics that are possible.
Soliton self-compression occurs when the soliton order . From Eq. 30 we see that this means that initially , and thus nonlinear broadening through SPM is initially dominant. As the spectrum expands, the role of dispersion increases and, being anomalous, compensates the nonlinear SPM phase, leading to temporal pulse compression inside the fiber. This in turn further enhances the SPM driven broadening, and the process continues. Soliton self-compression was first experimentally confirmed in conventional fibers by Mollenauer et al. (1980, 1983). In the ideal case the maximum compression factor has been numerically determined to be232323See e.g. Dianov et al. (1986); Chen and Kelley (2002); Voronin and Zheltikov (2008).
| (31) |
Voronin and Zheltikov (2008) numerically demonstrated that this is of course limited by higher-order effects, including high-order dispersion, self-steepening and Raman; all of which can cause soliton fission, as discussed in much earlier works242424Golovchenko et al. (1985); Beaud et al. (1987); Kodama and Hasegawa (1987).. Ouzounov et al. (2005) noted that the large dispersion slopes characteristic of HC-PBG fibers limit the high-ratio pulse compression to the picosecond regime. Further refinements include the works by Mosley et al. (2010), who used a short pulse source in the green to demonstrate soliton-effect compression from fs to fs in a 1 m PBG at 532 nm; and Peng et al. (2011), who reported the delivery and compression of 1 ps, 5 J pulses at 1550 nm at 100 kHz (0.5 W).
Overcoming the limitations of HC-PBG in terms of bandwidth handling (and hence the shortest pulses achievable) requires the use of broadband-guiding HC-PCF, and this has led to many exciting results on soliton dynamics, as we describe in Section III.7.4.
III.7.3 Adiabatic soliton compression in HC-PBG
Instead of tuning the parameters such that , adiabatic compression252525For original results in conventional fiber see Kuehl (1988); Chernikov and Mamyshev (1991). is based around keeping , but changing the fiber and pulse parameters such that the pulse duration decreases smoothly, through
| (32) |
where is the soliton energy. Clearly loss reduces and hence temporally broadens the soliton, whereas gain, decreasing dispersion or effective area, or increasing nonlinear refractive index (through say a gas pressure gradient) compresses the soliton.
Gérôme et al. (2007), demonstrated adiabatic soliton compression in an 8 m tapered HC-PBG fiber, generating 90 fs, 70 nJ solitons. The taper only reduced the core diameter from 7.2 m to 6.8 m but the GVD at 800 nm from close to 80 to nearly 0 ps/nm/km. Lægsgaard and Roberts (2009) numerically studied adiabatic compression by means of a pressure gradient, but this has not been experimentally verified. Welch et al. (2009) further demonstrated adiabatic and soliton effect compression, using dispersion variation in a 35 m tapered HC-PBG fiber, with larger compression ratios, of 2.5 ps to 215 fs and 1.2 ps to 175 fs at an output energy of 5 nJ and 9.4 nJ respectively.
III.7.4 Solitons in broadband-guiding HC-PCF
In a series of pioneering papers Im et al. (2009, 2010a, 2010b) studied the properties of gas-filled broadband-guiding HC-PCF and its perfect suitability for soliton dynamics. Travers et al. (2011a) also performed detailed and systematic numerical simulations of a wide range of ultrafast nonlinear optics in broadband-guiding HC-PCF. Together these works predicted high power soliton propagation, self-compression to few-cycle pulses, supercontinuum formation and dispersive-wave generation to the vacuum UV–all results that would be confirmed experimentally and form the basis of a new sub-field of nonlinear fiber optics, as described in the following sections. In addition to the relatively low value of , common to almost all HC-PCF, broadband-guiding HC-PCF also exhibits very wide transmission windows and regions with weak, flat and pressure tunable anomalous dispersion (see Fig. 26(c)). These are the key features that make broadband-guiding HC-PCF so suited to ultrafast nonlinear optics and soliton dynamics in particular.
Joly et al. (2011b) provided the first experimental evidence of soliton propagation and self-compression in broadband-guiding HC-PCF, by compressing 30 fs pulses to 9 fs at the output of the fiber. Numerical simulations suggested that 4 fs pulses must have occurred inside the fiber, and also highlighted the importance of self-steepening and shock-formation DeMartini et al. (1967) on the formation of such short pulses. In the case of self-compression, Travers et al. (2011a) predicted sub-cycle, 0.5 fs pulse generation at 800 nm. Subsequently, sub 2 fs pulses were reliably inferred by Hölzer et al. (2011) and Ermolov et al. (2015), with corresponding peak powers close to 2 GW. The inference was made through comparison to rigorous numerical simulations and the requirement for such short pulse durations to occur in order to drive the physical mechanism of the formation spectral features identifiable in the experiments (see the dispersive-wave and plasma sections below). True confirmation of these results is awaiting sufficiently sophisticated pulse characterization measurements. Mak et al. (2013b) measured soliton self-compression to 6.8 fs from 24 fs pump pulses at 800 nm. The corresponding peak power was estimated to be 0.9 GW inside of the fiber core. Subsequently, Balciunas et al. (2015) compressed 35 J pulses to 4.5 fs at 1.8 m, which is sub-cycle. The corresponding peak power of the output pulses was 2 GW. These pulses were fully characterized and were also proved to be CEP stable and of sub-cycle duration through stereo-ATI measurements. This source is useful for attosecond pulse generation and initial high-harmonic generation experiments have been reported Fan et al. (2014), (see also Section III.13.4).
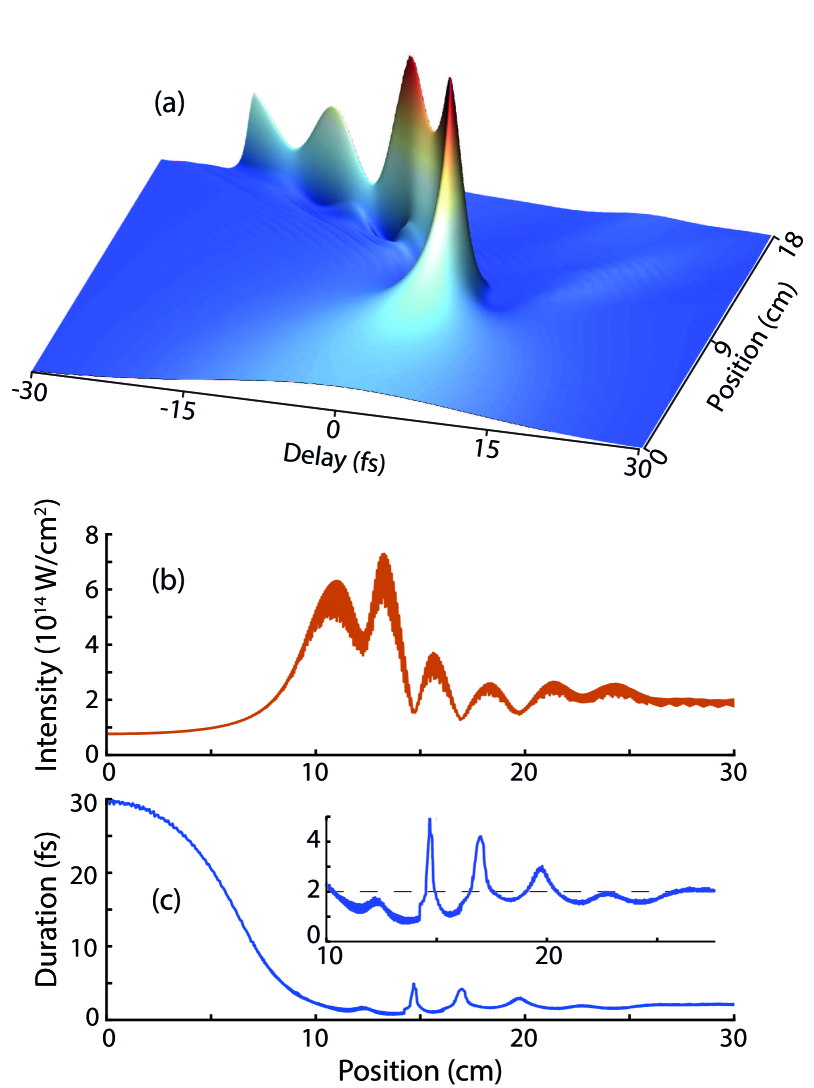
As an example of the pulse-compression dynamics, the results of numerical simulation262626Note that the dynamics in this figure are extreme in terms of pulse duration ( fs) and a high peak intensity, which leads to strong ionization of the gas. The model used, described by Tani et al. (2014), rigorously accounts for the high order effects resulting from such propagation, including self-focusing, plasma formation and shock formation. of a 30 fs pulse at 800 nm propagating through a 26 m core diameter broadband-guiding HC-PCF filled with 28 bar He ( nm), are shown in Fig. 28. The soliton order was set at , which required 3.54 J pulse energy. Fig. 28(a) illustrates the dramatic pulse compression and enhancement of the peak intensity as the pulse propagates through the fiber. From Fig. 28(b) we note that the intensity increases 7-fold from to W/cm2. The corresponding pulse durations are shown in Fig. 28(c), decreasing from 30 fs to fs in the first 10 cm. Most extraordinarily, the pulse duration stays constant at around 2 fs throughout the rest of the fiber propagation, over 20 cm, despite the fact that the dispersion length is mm. Both the compression and the stable pulse duration are evidence of the existence of soliton dynamics. Inspection of the numerical results indicates that the self-compression process is assisted by self-steepening, leading to shock formation on the trailing edge, and ionization and plasma formation, leading to a shock on the leading edge (the full plasma dynamics are reviewed in detail in Section III.8).
III.7.5 Resonant dispersive-wave emission in broadband-guiding HC-PCF
Soliton propagation in the presence of higher order dispersion can lead to the emission of radiation at frequencies shifted from the center of the soliton spectrum through a process known as resonant dispersive-wave emission (RDW)272727Sometimes also referred to as resonant radiation, dispersive-wave generation or fiber Cherenkov radiation.282828It has actually been shown that solitons are not required Roger et al. (2013); Webb et al. (2013), but we keep the focus here on soliton emitted RDW as that is the regime for all of the HC-PCF experiments to date., first discussed in detail by Wai et al. (1986), and subsequently widely explored in solid-core optical fibers. This process has been harnessed in broadband-guiding gas-filled HC-PCF for the efficient generation of tunable ultrafast pulses between 113 nm and 550 nm, conveniently spanning a spectral region with a wide range of applications, especially in spectroscopy.
The frequency of emission is determined by a phase-matching condition which can be derived from the generalized nonlinear Schrödinger equation under the approximation that the dispersive-waves do not themselves interact nonlinearly with the field292929In some circumstances, under which cross-phase modulation ought to be important, it is somewhat surprising that this approximation works. The usual explanation is that the group velocity walk-off between the soliton and the dispersive-wave is large, and hence they have limited time to interact. But this does not always adequately explain why the phase-matching is not altered.. The resulting condition is simply303030See e.g. Skryabin and Yulin (2005) for a derivation.
| (33) |
where is the propagation constant at frequency including any terms causing a nonlinear phase-shift, and is the usual linear propagation constant. Karpman (1993) explained RDW emission as tunneling from inside the self-trapped potential of the soliton to free-propagating radiation, and this interpretation is clear from Eq. 33–the emission occurs when the nonlinearly propagating waves are phase-matched to the free-propagating linear waves. Akhmediev and Karlsson (1995) explained the process as an analogue of Cherenkov radiation emitted by the solitons. Erkintalo et al. (2012) provided a further refinement to our understanding with a frequency domain perspective, explaining RDW emission through cascaded four-wave mixing (FWM). In particular, this picture predicts the spectral recoil of solitons in the opposite direction from the emitted frequency, observed during RDW emission, as the accumulation of Stokes or anti-Stokes in the FWM process. It also describes RDW emission when the pump pulses are not solitons Roger et al. (2013); Webb et al. (2013).
In the case that the input pulse consists of a single fundamental soliton, then can be written explicitly, so that the phase-matching condition becomes
| (34) |
where is the central frequency of the soliton. The shock term, , in front of the nonlinear phase was introduced by Roger et al. (2013).
Eq. 34 generalizes to the case of pumping with high-order solitons undergoing self-compression by replacing with the total power of the self-compressed pulse. This simply reflects the fact that the nonlinear propagation constant is related to the total field intensity interacting with the RDW, not any specific soliton component. is difficult to estimate analytically, but some numerical rules were established by Dianov et al. (1986) and Chen and Kelley (2002), giving . A more accurate way of establishing the phase-matched frequencies was introduced by Austin et al. (2006), in which the full field envelope is used for the nonlinear phase-shift. The downside to this approach is that it requires numerical propagation simulations, at which point one can just numerically measure the emission frequency. Nevertheless, this analysis does help identify the gain dynamics, especially with respect to self-steepening Travers et al. (2011b).
The use of broadband-guiding HC-PCF for RDW emission was first proposed by Im et al. (2010a). Broadband-guiding HC-PCF offers a number of advantages for the generation of high frequency RDW:
-
1.
It is possible to tune the zero dispersion frequency (wavelength) very high (low), which can be shown (from Eq. 34) to consequently shift the phase-matched RDW frequency higher, extending to the vacuum-UV.
-
2.
The low dispersion and broadband guidance enable the extreme pulse compression and shock dynamics discussed previously, which enhances the conversion efficiency to highly shifted phase-matched frequencies.
-
3.
The ability to photo-ionize the gas without damaging the waveguide can further shorten the pump pulse, frequency shift it, and also alter the dispersion landscape (these effects are discussed in Section III.8).
Fig. 29 illustrates the opportunities for phase-matching dispersive-waves in broadband-guiding HC-PCF pumped at 800 nm. The phase-matched RDW points range from nm with He, up to beyond 600 nm with Ar, Kr and Xe. Of course, shifting to longer pump wavelengths also enables the emission of infrared RDW.
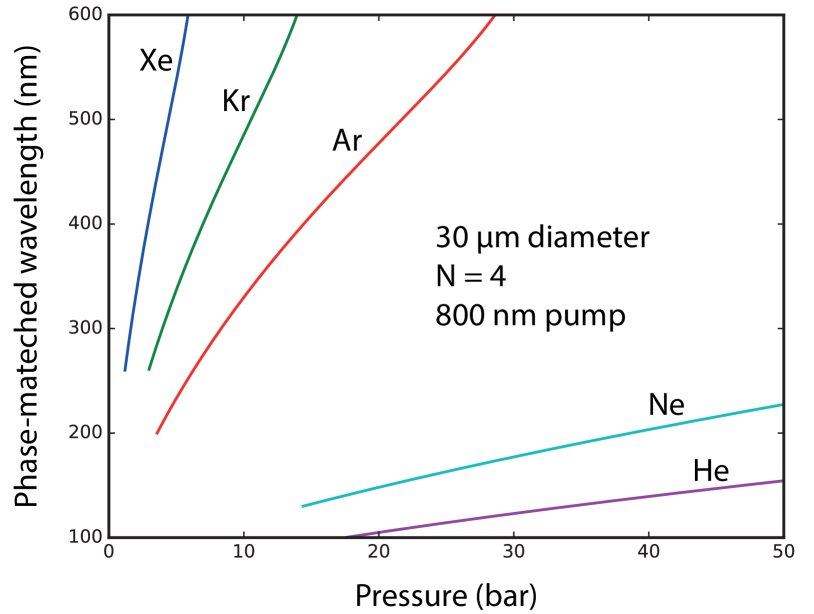
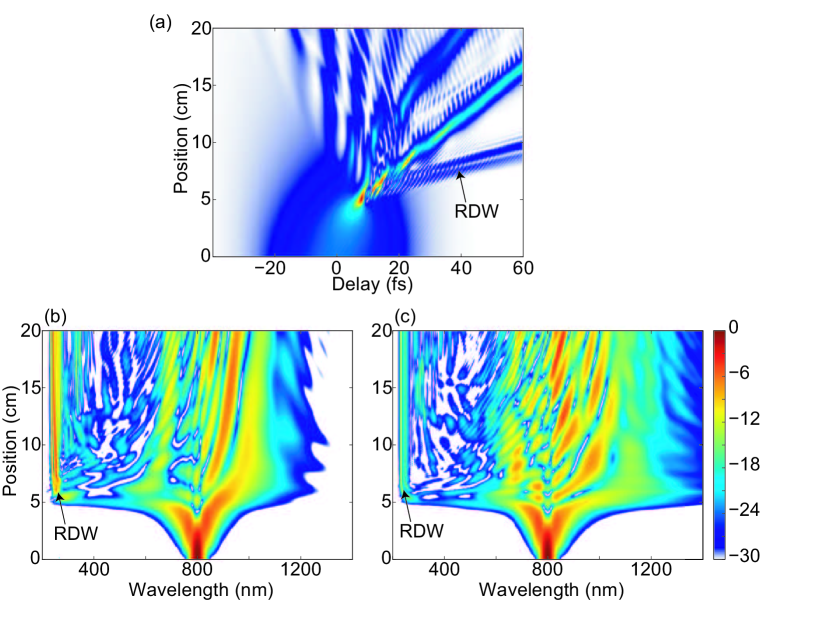
Experiments.
RDW emission in broadband-guiding HC-PCF was first demonstrated experimentally by Joly et al. (2011b). In that experiment, a m core diameter broadband-guiding HC-PCF was filled with 0 to 10 bar Ar and pumped with 30 fs, J pulses. Wavelength tunable dispersive-wave emission between 200 nm and 320 nm was achieved and numerical simulations clearly identified that the self-steepening term, leading to shock formation, increased the conversion efficiency by roughly an order of magnitude, to 8%. Biancalana et al. (2004) had shown that the amplitude of the RDW is directly related to that of the driving wave at the emission frequency, and noted that this tends to decay exponentially with increasing frequency shift. Therefore, when pumping with high order solitons, the resulting self-compression and shock-formation significantly enhances the RDW emission, by increasing the spectral overlap between the nonlinear driving field and the phase-matched RDW point. Fig. 30 illustrates the pulse propagation for parameters similar to Joly et al. (2011b). In the first 5 cm the pulse undergoes extreme soliton self-compression. At the compression point, the spectrum has a large spectral asymmetry towards the blue side due to shock formation, which disappears upon further propagation. A large amount of energy is, however, deposited at an extreme wavelength, and this is seen as a week scattered wave in the time-domain picture. This is the RDW. In Fig. 30(c) the spectrum evolution is shown without shock. At the compression point, the spectrum is more symmetric and there is less energy seeding the RDW emission, which is consequently weaker.

By tuning the dispersion landscape through both the gas species and gas pressure, it was confirmed by Mak et al. (2013a) that RDW between 180 nm and 550 nm can be achieved, as shown in Fig. 31. Furthermore, it was found that there are optimal conditions of fiber length and pulse energy in order to achieve the cleanest emission in terms of spectral shape and bandwidth; fractional bandwidths were observed. Numerical simulations were used to confirm that the whole spectrum was coherent, when the soliton order was sufficiently low. At higher soliton orders, plasma effects degraded the coherence.
Following the first demonstration of VUV generation and guidance in broadband-guiding HC-PCF by Belli et al. (2015) (to be discussed later in Section III.9.4), Ermolov et al. (2015) extended the RDW tuning down to 113 nm in Ne and He gas, limited by the absorption of the MgF2 windows used on the gas cells, as also shown in Fig. 31. In that result it was also noted that ionization can further enhance the efficiency of dispersive-wave emission due to the soliton self-frequency blue-shift (this is discussed further in Section III.8.5).
Power-scaling and deep-UV pulse duration.
Köttig et al. (2017b) significantly scaled the repetition rate of RDW emission by pumping with a ytterbium fiber laser. The 329 fs pulses were first compressed using an SPM-mirror system, based on Ar-filled broadband-guiding HC-PCF, to 24 fs with J. These were then coupled into the same fiber, but with an HF-etched core wall, and filled with Ne or He, to generate deep-UV RDW emission. At a 100 kHz repetition rate, RDW emission at 205 nm was achieved with over 1 J of deep-UV pulse energy. At 1.92 MHz repetition rate over 0.5 J was achieved at 275 nm, corresponding to a deep-UV average power of over 1 W. In a closely related work Köttig et al. (2015) characterized the pulse duration of the high power RDW emission, determining that the deep-UV pulses were fs at the fiber exit, although significantly broadened due to the air dispersion and gas-cell windows on route to the two photon autocorrelator used for pulse duration measurements. More recently Ermolov et al. (2016) used a transient-grating cross-correlation frequency-resolved optical gating (FROG) system to verify that the RDW emission at 270 nm (at 1 kHz, pumped by a 800 nm Ti:Sapphire laser) was just 5 fs in duration.
Pressure gradients and higher order modes.
Mak et al. (2013a) also demonstrated RDW emission in fibers with both positive and negative pressure gradients. The use of a pressure gradient alters the generation dynamics by changing the phase-matching condition continuously along the fiber. Therefore, by tuning the pump energy, and hence the location of the compression point, different emission wavelengths and bandwidths are generated. Tani et al. (2014) demonstrated dispersive-wave emission to higher order modes. In that case, due to the stronger dispersion of the higher order modes, the dispersive waves are emitted at larger and larger frequency shifts. This plays a role in the VUV supercontinuum described in Section III.8.5, and Tani et al. described how the transfer of energy to higher order modes through RDW emission can constitute a new form of self-focusing. Finally, photoionization and plasma formation can alter both the emission dynamics of dispersive-waves, and lead to phase-matching and emission and new frequencies. These are described in Section III.8.5.
Infrared pumping for RDW emission.
Several works have shown RDW emission from longer pump wavelengths, generated with an optical parametric amplifier (OPA). Cassataro et al. (2017) tuned the pump wavelength between 1.6 m and 1.8 m, showing both supercontinuum formation in the infrared from 270 nm to 3.1 m and RDW emission around 300 nm. This was the first result in gas-filled broadband-guiding HC-PCF to show tuning of the RDW emission with pump wavelength. Previous work tuned the gas pressure and pump energy. Meng et al. (2017) also recently showed RDW emission from an OPA tuned between 1.3 m and 1.5 m in an Ar-filled broadband-guiding HC-PCF. As the pump wavelength in this case was much closer to the zero dispersion wavelength, the RDW emission was shifted to around 1000 nm. The closeness of the pump to the phase-matched emission wavelength increased the conversion efficiency to around 16%, the highest yet reported.
Applications.
An ultrafast pulse source ( fs) with 10 nJ to nJ, tunable between 113 nm and 550 nm, can be expected to be of interest for a range of applications, particularly in ultrafast spectroscopy of molecular systems which have many excitation pathways in the deep and vacuum UV region. So far there have only been two works on applications of RDW emission. Joly et al. (2011a) made some numerical estimates about seeding free electron lasers to improve their coherence properties, but no experimental demonstration has followed.
Bromberger et al. (2015) successfully used RDW emission for angle-resolved photoemission spectroscopy (ARPES) at 9 eV. The wide tunability throughout the VUV (the most important photon energy range for ARPES) and the short pulse duration of the RDW emission make this source highly interesting for time-resolved ARPES measurements. The ability to scale the repetition-rate of the emission to the MHz range will also improve the rate of data collection and the statistical analysis of the relatively low photo-electron yields from such experiments.
III.8 Plasma effects in broadband-guiding HC-PCF
At sufficiently high intensities the filling-gas in an HC-PCF can be ionized by the light field. This can have a strong effect on the optical pulse propagation, even if % of the gas is ionized. Combined with the ability of HC-PCF to guide optical solitons in gas, this has opened a new subfield of nonlinear fiber optics: soliton-plasma interactions.
The linear and nonlinear optical properties of the ions produced by photoionization can be expected to follow the general trend of atoms with higher ionization potentials, and exhibit weaker dispersion and nonlinearity than the neutral atoms. Taking the extreme limit, that they become completely negligible, the reduction in linear and nonlinear susceptibility of the filling gas will be at most the same as the ionization fraction, i.e. %. The same is not true of the electrons that result from photoionization. The nonlinear response from free electrons can be neglected as it requires relativistic intensities, beyond the range so far considered in HC-PCF (around W/cm2). So the only contribution from the electrons is their linear response. Two factors make this very significant: (i) the polarizability of free electrons is very large (see next section); (ii) the free electrons are themselves produced through a highly nonlinear process, causing them to accumulate exceedingly rapidly in the optical pulse at the peaks of the electric field cycles. So while the plasma optical response is linear, the combined photoionization and plasma response is highly nonlinear.
III.8.1 Free electron polarizability, plasma refractive index and dispersion
The polarizability of a free electron is , where and are the electron charge and mass. Comparing this to the polarizability of neutral atoms shows that the polarizability of free electrons is much larger and of opposite sign. For example at a wavelength of 800 nm, F m2, and the polarizability of Ar is Fm2. Thus the dispersive effect of the plasma would equal that of the gas at an ionization fraction of just 3.6%. Even for much smaller fractions, the perturbation to the refractive index can be much stronger than that due to the Kerr effect.
The refractive index of the plasma can be defined from the polarizability in the usual way
| (35) |
where the plasma frequency is the frequency of the electron oscillations and the critical density is the density at which . From this we can determine the GVD induced by the plasma
| (36) |
Thus the plasma GVD is anomalous and becomes very large in the infrared. Fig. 32 shows the GVD of a 30 m core diameter broadband-guiding HC-PCF filled with 10 bar Ar at various degrees of ionization. The zero dispersion wavelength can be dramatically altered for 1% ionization, and the anomalous GVD at longer wavelengths becomes significantly stronger.
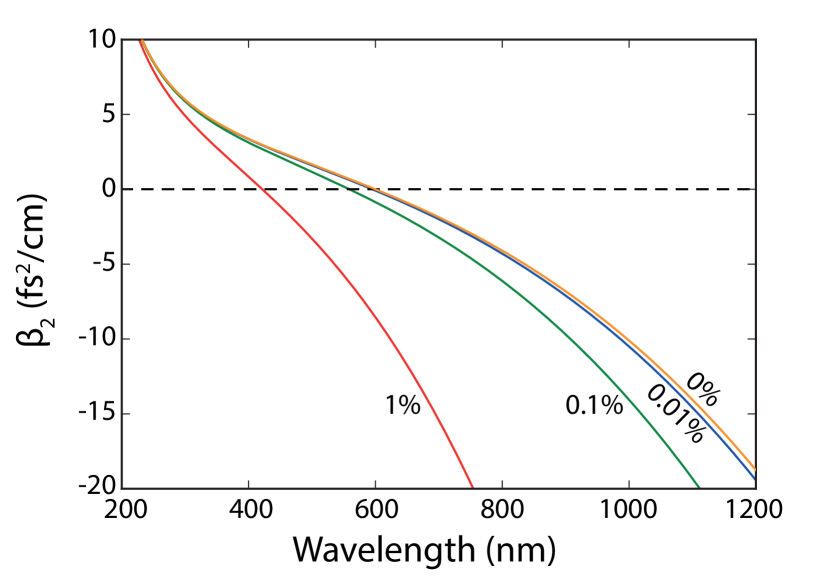
III.8.2 Ionization rates
The liberation of an electron from an atom can be considered through a multitude of phenomenological processes. The two dominant ones for the intensities so far achieved in HC-PCF (up to W/cm2) are multiphoton ionization, where an electron absorbs sufficient photons from the driving laser to gain enough energy to escape the atomic potential; and tunnel ionization, where the electric field of the driving laser distorts the atomic potential so that the electron is more likely to tunnel through the barrier. The typical way to distinguish these regimes is to consider the Keldysh parameter Keldysh (1965)
| (37) |
where is the ionization potential energy, and is the ponderomotive energy313131The cycle-averaged kinetic energy of an electron in a laser field. for field strength . In a semi-classical picture is the time taken for an electron to tunnel through the Coulomb barrier of the atom in units of the electric-field cycle period. It is usually stressed, though somewhat controversially, that for tunnel ionization occurs, and for multiphoton ionization occurs. The parameters used in broadband-guiding HC-PCF usually correspond to , preventing such a clean distinction. The so-called Perelomov, Popov and Terent’ev (PPT) rate Perelomov et al. (1966), accurately reproduces both regimes, and interpolates between them, so we use it for the following analysis323232The widely used ADK rate Ammosov et al. (1986) is the tunnel limit of PPT with generalized coefficients to handle more complex initial electron states; the ADK coefficients should be integrated into the PPT model. The PPT rate can also be extended to include the non-adiabatic field following of the ionization rate, i.e. when the field strength changes within the tunneling time Yudin and Ivanov (2001). The power law ionization rates specialized for just multiphoton ionization are inappropriate for , and are easily derived from PPT in the limit ..
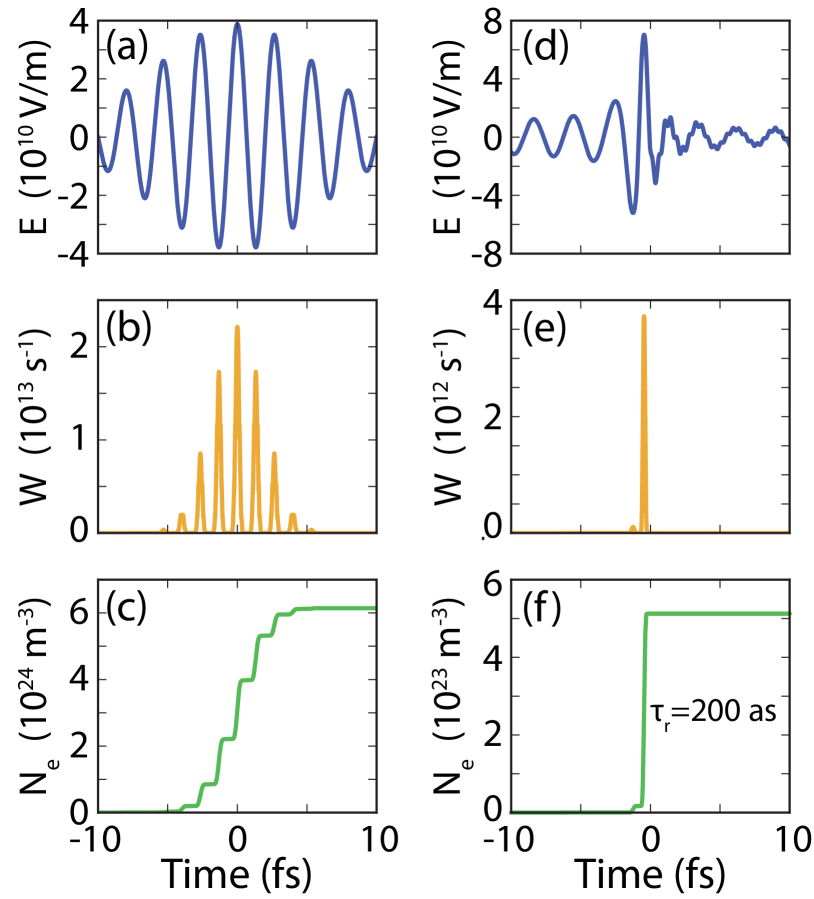
For a single ionization level the free electron density is simply calculated through333333Here we neglect avalanche ionization, which is usually, although not always, negligible for the gas pressures and free electron densities obtained in HC-PCF.
| (38) |
where is the original neutral atom density and is the electric field dependent ionization rate. Fig. 33(b) shows the calculated ionization rate for a 10 fs Gaussian pulse with W/cm2 peak intensity (Fig. 33(a)), propagating in 10 bar Ar. Note that the rate is strongly peaked at the peaks of the electric field. Fig. 33(c) shows the corresponding free electron density accumulating step-wise with time, up to an ionization fraction of %.
Fig. 33(d-f) shows the same plots, but for the self-compressed pulse from Fig. 28, which has 1.2 fs duration, and an intensity of W/cm2. In this case the rate shows a single strong peak and the free electron density increases in a step of just 200 attoseconds343434It was recently established by Serebryannikov and Zheltikov (2014) that the PPT model is still valid in this extreme sub-cycle regime.. The step change in Fig. 33(f) corresponds to a refractive index modulation %, comparable to the core-cladding step in a step-index solid-core fiber. This fast refractive index modulation drives the soltion-plasma effects considered in Section III.8.4.
The refractive index step moves with the pulse, i.e. at the speed of light, causing phase modulation and acting as a scattering center, and also possibly useful as an event horizon in analogue gravity experiments, as proposed (using a different nonlinearity) by Philbin et al. (2008).
III.8.3 Nonlinear contribution of plasma creation
The nonlinearity arising due to ionization arises from the fast accumulation of free electrons shown in Fig. 33(c). The large difference in dispersion of the free electrons means that this fast accumulation of plasma imparts a strong phase-modulation back on the laser pulse353535The sign of this phase-modulation is ambiguous and depends on the definitions used when driving the propagation equations. However, more important is the frequency shift, which has a non-ambiguous opposite sense to the refractive index shift.. The corresponding frequency shift is
| (39) |
where we have assumed low ionization, such that .
The recombination of free electrons is a very slow process compared to ultrafast laser pulses, and so the phase and frequency shifts noted above are one-sided, leading to a frequency upshift of the light field. This effect was first explored in free space by Bloembergen (1973); Yablonovitch (1974); Corkum (1985); and then refined in a large series of papers363636See e.g. the papers by Wood et al. (1991); Rae and Burnett (1992); Le Blanc et al. (1993).. Tempea and Brabec (1998) proposed plasma blue-shifting in HCF as a spectral broadening mechanism for pulse compression, and a clear demonstration of plasma blue shifting in HCF was performed by Babin et al. (2002).
Although useful for estimating the plasma density, Eq. 39 is insufficient for modelling the full plasma dynamics in HC-PCF, as it neglects the interaction with the Kerr effect and anomalous dispersion which enable soliton-plasma solutions. A more complete model can be obtained by including the ionization and plasma phase modulation and absorption dynamics in the propagation equations by co-solving the coupled equations describing the plasma current373737See Geissler et al. (1999) for a self-consistent derivation and Rae and Burnett (1992) for an early approach.. The model introduced by Tani et al. (2014) and used throughout this part of this review is one example.
III.8.4 Soliton-plasma effects in HC-PCF
Fedotov et al. (2007) showed both theoretically and experimentally that ionization in an air-filled HC-PBG fiber can cause a blue-shift of the input pulse. The pump at 807 nm with 60 fs, 2.3 J pulses ( W/cm2) was shifted over 10 THz towards the blue, and this agreed fully with numerical simulations. The shift was described as being a soliton self-frequency blue-shift, although no experimental or theoretical evidence was presented to confirm this. Fedotov et al. (2007), also noted that the blue-shifting effect had to overcome the opposite frequency-shift due to the Raman effect in air (see Section III.7.1).
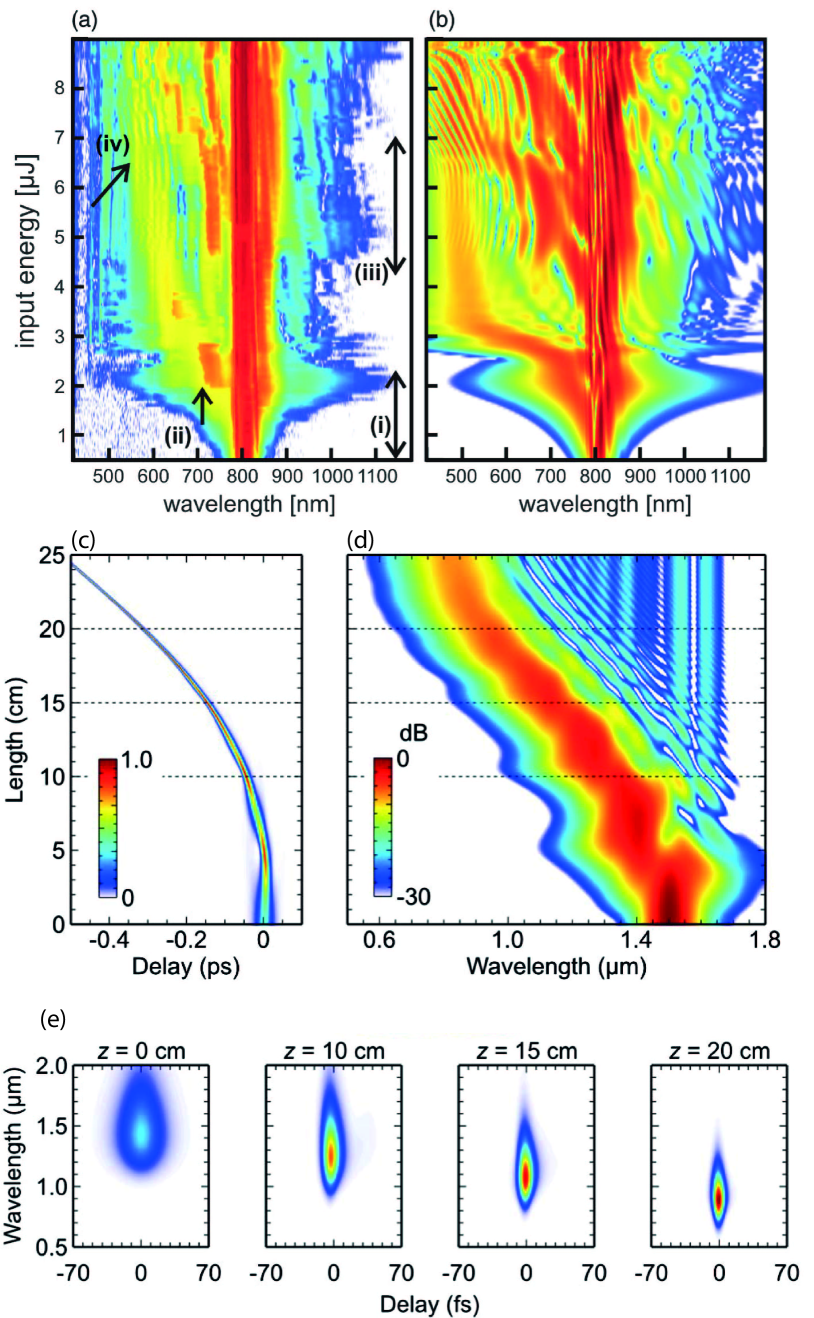
Hölzer et al. (2011) demonstrated much larger pulse shifts in broadband-guiding HC-PCF. Pumping a 26 m core diameter Ar-filled broadband-guiding HC-PCF with 800 nm, 65 fs, 1 J to 9 J led to the observation of a series of blue-shifting pulses emitted from the pump after a characteristic soliton self-compression stage. The frequency shift was in excess of 125 THz, as shown in Fig. 34(a,b). Numerical simulations and analysis clearly evidenced that the blue-shifting mechanism was an ionization effect and that the blue-shifting pulses were solitons. A simultaneously published paper by Saleh et al. (2011) detailed an analytic model for the soliton effects in the ionization regime, and through perturbation theory, explained the soliton blue-shift in a way directly analogous to the Raman self-frequency shift. They also found further interesting effects such as non-local soliton clustering (both temporal and spectral) mediated by the plasma383838See also Saleh and Biancalana (2011).. In addition they studied the interaction between plasma creation and Raman scattering.
The work of Hölzer et al. (2011) and Saleh et al. (2011) primarily considered an effective soliton fission at a single soliton self-compression point due to plasma induced phase-modulation. In this case the initial pump pulse is insufficiently intense to ionize the gas significantly, but due to self-compression its intensity upon propagation is increased such that strong plasma generation does occur. After this point the pump pulse breaks up into a series of blue-shifting fundamental solitons. Recently Köttig et al. (2017c) have shown that at higher pump energies the plasma phase-modulation becomes strong before the soliton self-compression point is reached. Instead, the pulse experiences asymmetric spectral broadening Saleh et al. (2012), caused by the combined effects of the optical Kerr nonlinearity and plasma-induced phasemodulation. Combined with the anomalous group-velocity dispersion, this eventually leads to a coherent pulse splitting. The resulting sub-pulses then undergo further self-compression and and fission. Recent numerical simulations have also shown that under the correct parameter regimes the pump pulse can undergo multiple stages of pulse compression and soliton fission Habib et al. (2017a, b). Something hinted at in earlier work, but not fully elucidated.
For high energy long pump pulses, Saleh et al. (2012) showed theoretically and numerically, that a new kind of modulational instability can arise due to the additional plasma nonlinearity in gas-filled broadband-guiding HC-PCF.
At the other extreme Chang et al. (2013) predicted that fundamental solitons can also continuously blue shift—something unexpected, as the photoionization process removes energy from the soliton, so one would expect it to broaden and loose sufficient intensity for further blue-shifting. A fortuitous combination of physical parameters enable this through adiabatic soliton compression, as indicated in Fig. 34(c-e). The input soliton has sufficient intensity to ionize the gas and hence blue-shift. In the process it loses some energy, and so would be expected to broaden and have reduced intensity. However, the blue-shift moved the soliton to a frequency with both a higher nonlinear coefficient (through the frequency dependence of the nonlinear phase shift) and to a region with a lower magnitude of GVD. Hence, by Eq. 32 it compresses, and regains sufficient intensity to shift further. This process repeats, and Chang et al. (2013) numerically demonstrated a shift from 1500 nm to 800 nm while simultaneously compressing the pulse from 30 fs to 4 fs, with a 30% conversion efficiency. The use of pressure gradients was shown to give good control of the frequency shift.
Recently Kim et al. (2015) proposed that by mixing gases one could independently control the Kerr and ionization based nonlinearities, using a mixture of two gases with significantly different ionization potentials. In this way one gas maintain the Kerr driven soliton dynamics, while the other gives rise to a separately controllable blue-shift.
III.8.5 Interaction between ionization and RDW emission
The interaction between photo-ionization and RDW emission was studied numerically by Chang et al. (2011). The main conclusion was that soliton dynamics initially dominate at higher gas pressures, where the Kerr nonlinearity and GVD are significant. In that case the soliton self-compression and RDW emission dynamics occur as described in Section III.7.5. As the pressure is lowered, the Kerr effect and gas GVD become less signifiant in comparison to the phase-modulation due to the creation of free electrons. The leads to an accelerating self-compressed pulse as opposed to the delayed one that is usual due to the recoil effect in RDW emission, and an altering of the dispersion landscape such that the RDW emission point is shifted.
VUV supercontinuum generation
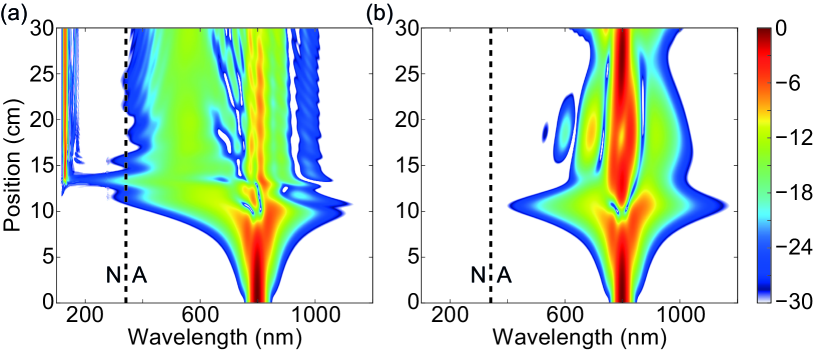
The first demonstration of vacuum-ultraviolet supercontinuum generation was by Belli et al. (2015), who used the Raman response in a hydrogen-filled broadband-guiding HC-PCF to broaden RDW radiation down to 124 nm. This is discussed further in Section III.9.4.
Subsequently, Ermolov et al. (2015) found that blue-shifting solitons strongly enhance VUV dispersive-wave emission in noble gases, as predicted by Saleh and Biancalana (2011). This occurs through two mechanisms. Firstly, the blue-shift pushes the soliton closer to the zero dispersion wavelength, increasing the spectral overlap between the soliton tail and the RDW frequency. Secondly, the pulse compression associated with blue-shifting solitons further enhances this spectral overlap. Both of these exponentially increase the generated dispersive-wave signal. This feature is illustrated in Fig. 35, where the spectra corresponding to Fig. 28 are shown with and without the influence of ionization. With ionization a clear blue-shifting soliton appears around 8 cm. It shifts towards the zero dispersion wavelength and emits a strong dispersive-wave around 130 nm before recoiling. Without ionization, the soliton compression around 800 nm is not sufficient to excite a RDW at the phase-matched point in the VUV, because of a lack of spectral overlap.
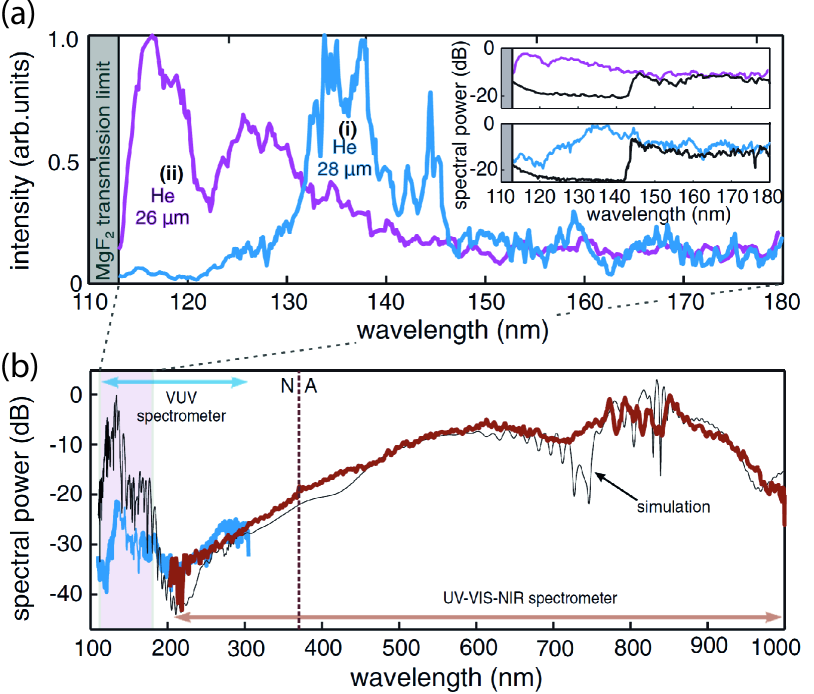
This mechanism forms the basis of a different VUV supercontinuum generation mechanism in broadband-guiding HC-PCF, where Ermolov et al. (2015) demonstrated that the combination of VUV RDW emission, plasma soliton blue-shift and four-wave mixing can lead to the formation of a supercontinuum spanning from 113 nm to beyond 1100 nm, shown in Fig. 36.
In addition to the core mechanism of enhanced RDW emission due to blue-shifting solitons, four additional ingredients added to the supercontinuum. (i) After emitting a RDW the soliton spectrally recoils to lower frequencies, where it recompresses and begins to blue-shift once again, emitting a secondary RDW at a slightly lower frequency than the first. This process can repeat several times, such that multiple waves are emitted. (ii) As first discussed by Tani et al. (2014), RDWs can be emitted in higher order modes at higher frequencies. (iii) The RDWs in different modes interact by four-wave mixing (FWM) further filling in gaps in the continuum. (iv) By tuning the parameters such that a soliton compression event occurs at the output of the fiber, other gaps in the spectrum can be filled in. Combined these processes enable the emission of a bright, spatially coherent, continuous spectrum from the VUV to 1100 nm. Ermolov et al. (2015) measured down to 113 nm, which was the transmission limit of the MgF2 window used. Numerical results suggest that this continuum is also fully temporally coherent, raising the possibility of compression to sub-femtosecond durations in the optical region.
Generation of Mid-IR RDW
An additional interaction between ionization and RDW emission was discovered by Novoa et al. (2015). The refractive index modulation induced by the fast creation of plasma can lead to additional phase-matched frequencies in the mid-infrared. An additional term was introduced into the nonlinear propagation constant to account for the plasma dispersion, i.e. Eq. 34 becomes
| (40) |
The last term is the additional shift in propagation constant due to plasma. It is opposite in sign to the other terms, and so can give rise to new phase-matching solutions. Without it, RDW emission in gas-filled broadband-guiding HC-PCF can only occur in the normal dispersion region at up-shifted frequencies. The plasma term in Eq. 40 provides two additional solutions, one of which lies in the MIR spectral region and shifts to longer wavelengths with increasing free-electron density. In addition, the shallow dispersion curves of the broadband-guiding HC-PCF system ensure extended coherence lengths over a broadband spectral region. The frequency correction factor for the plasma term is also of the opposite sense compared to the Kerr factor—it provides enhancement at lower frequencies with respect to the pump.
Using this scheme, Novoa et al. (2015) numerically predicted emission of a RDW at 4.2 m from a 1.4 m pump wavelength. Köttig et al. (2017a) experimentally verified this prediction, observing plasma-induced RDW between 3.2 m and 3.8 m, pumped at 1030 nm. This radiation then forms part of a 4.7 octave supercontinuum that spans from 180 nm to 4.7 m, with up to 1.7 W of average power, at 151 kHz repetition rate.
III.8.6 Microwave induced plasma in broadband-guiding HC-PCF
In the previous discussion the plasma inside the fiber was caused by photo-ionization of the filling-gas by the laser pulse itself. An alternative means of exciting a plasma inside an HC-PCF was introduced by Debord et al. (2013). They used an external continuous-wave surfatron microwave coupler as an excitation source to obtain a 6 cm long plasma in 1 mbar of Ar inside a 60 m core diameter HC-PCF. In a further refinement Vial et al. (2016) miniaturized the setup by using a microstrip split-ring resonator for the microwave excitation. They obtained a very high microwave coupling efficiency and only 10 W of microwave power was required to generate a plasma in the broadband-guiding HC-PCF core. These schemes are useful for creating emission sources or perhaps even broadband-guiding HC-PCF-based gas laser devices, however, the relatively low gas pressures and electron densities ( cm-3) compared to the laser pulse induced ionization ( cm-3) restricts their use for nonlinear optics applications.
III.9 Raman effect
The advent of low-loss step-index fibers and subsequent birth of the field nonlinear fiber optics triggered a revolution in our view of the Raman effect Stolen (1972, 2008); Clesca et al. (2015). The advent of HC-PCFs has led to a similarly radical transformation. The first report by Benabid et al. (2002) marked the beginning of gas-phase nonlinear optics in HC-PCFs. Using a hydrogen-filled broadband-guiding HC-PCF Benabid et al. (2002) reported a two orders of magnitude reduction (compared to single-pass Raman gas cells) in the threshold required for the generation of two frequency down- and up-shifted Stokes and anti-Stokes Raman sidebands of a 532 nm pump laser. This changed the view of stimulated Raman scattering (SRS) from a nonlinear process demanding high-energy (1 mJ) laser systems, often accompanied by competing nonlinear effects, e.g. self-focusing and/or SPM, to a process with a high-level of controllability, easily achievable using compact laser sources with moderate micro-Joule energies. Driven by the possibility of a meters-long interaction length in a low-loss, gas-filled HC-PBG fiber, the pioneering work by Benabid et al. (2002) was followed by a series of studies which resulted in further reduction in the required threshold for SRS and the realization of sub-Watt, continuous-wave-pumped gas-Raman laser Benabid et al. (2004, 2005); Couny et al. (2007a).
III.9.1 Spontaneous Raman Scattering
Raman scattering Raman and Krishnan (1928); Long (2002) is a two-photon inelastic scattering process with an intrinsically quantum mechanical origin Berestetskii et al. (1982); Sakurai (1967); Baym (1969); Long (2002). In the so-called energy transfer model, a photon of frequency incident on a molecule in an initial state is inelastically scattered off the electron cloud resulting in a photon of frequency , while leaving the molecule in a final state . The energy of the scattered photon is given by where is the quantum defect. If the final state is an excited state, i.e. , then is positive and the scattered photon is a red-shifted Stokes photon. If the initial state is an excited state, i.e. then the scattered photon is a blue-shifted anti-Stokes photon. The coupling between the electromagnetic field and the molecule is mediated by the change in the molecular polarizability tensor, as the molecule oscillates, i.e. rotates or vibrates. Considering an incident power of over a sample volume with an area , a length , and a number density of the scattering centers, , then the average power of light at Stokes frequency scattered into a unit solid angle in angular direction from an incident beam of power is given by . Here is the Raman scattering cross-section per molecule Yariv (1989).
Spontaneous Raman scattering is an incoherent process Wang (1969). This incoherent nature allows for the accumulation of the spontaneous Raman signal from different scattering centers with an increase in the interaction length, , i.e. . Long interaction lengths are offered by low-loss waveguides such as HC-PCFs, which makes them very attractive for Raman spectroscopy and sensing applications. It should be noted, however, that for the purpose of performance studies one must carefully take into account the waveguide loss which limits the effective interaction length, and the collection efficiency of the scattered radiation by the waveguide Holtz et al. (1999); Eftekhari et al. (2011); Buric et al. (2008).
Spontaneous Raman scattering: gas phase
The differential Raman cross-section is small, typically in the range of m2molecule-1sr-1. Consequently spontaneous Raman scattering is weak, which is particularly problematic in the case of Raman spectroscopy and detection of minute sample volumes and trace gases. Given low propagation losses, increasing the interaction length and the spatial overlap between the incident laser radiation and the specimen loaded in the micron-size core of a HC-PCF, significantly enhances the Raman signal. In general these characteristics make a HC-PCF an ideal platform for a multitude of optical sensing applications. In a spectacular demonstration Millot et al. (2015) combined advanced concepts in telecommunication and supercontinuum photonics with a long-interaction length of 50 m in a HC-PBG, to demonstrate highly-sensitive absorption spectroscopy without using any mode-locked lasers or high-finesse multi-pass gas cells.
Although ideas regarding the use of hollow waveguides and photonic crystal fibers as fiber sensors have a long history Sudo et al. (1990); Saito and Kikuchi (1997); Monro et al. (1999, 2001), there has been a strong interest in using HC-PCFs for (Raman) sensing application, partly because of their low-propagation losses in the visible and near infrared spectral region for small core diameters (10-50 m). Ritari et al. (2004) validated the feasibility of using HC-PBGs for sensing applications, demonstrating the potential of these fibers for the detection of minute sample volumes as well as their compatibility with standard fiber-optics components. A major step in this direction was made by Benabid et al. (2005) who successfully realized an all-fiber gas cell consisting of a HC-PBG filled with gas and spliced hermetically at both ends to standard single-mode optical fibers.
Fiber optics probes are instrumental in modern Raman spectrometers for in vitro measurements of analytes in aqueous environments Santos et al. (2005); Motz et al. (2004). A major problem in using solid-core fiber probes is the strong Raman background from the fused silica. This mainly comes from the fiber’s core and hinders the detection of the weak Raman signal from the sample under study. May and Li (1996); Konorov et al. (2006) neatly solved this problem by using a 19-cell HC-PBG fiber as a Raman probe for transmitting an intense excitation pulse at 532 nm to the sample. The HC-PBG fiber was bundled with three larger fused-silica solid core fibers (core diameter of 400 m) for collecting and transferring the scattered Raman signal from the sample back to the spectrometer. In spite of this they showed an order of magnitude reduction in the Raman background signal, with the remaining background noise coming mainly from the collection fibers.
The relatively large size of the collection optics in the work of Konorov et al. (2006) may pose a limitation for some applications requiring fine probes. Brustlein et al. (2011) used a double-clad HC-PBG fiber as a compact, alternative collection strategy. By incorporating a second cladding as a high numerical aperture multimode waveguide channel (see Myaing et al. (2003); Fu et al. (2005)) they could greatly enhance the detection sensitivity. Using this fiber they demonstrated fiber-based, label-free imaging using coherent anti-Stokes Raman scattering (CARS) microscopy (see Section III.9.1). An order of magnitude reduction in the background noise over the results of Konorov et al. (2006) was reported by Ghenuche et al. (2012) using a large-core broadband-guiding HC-PCF. In their all-HC-PCF excitation-detection scheme, Ghenuche et al. (2012) demonstrated that due to the wide transmission window of the broadband-guiding HC-PCF, as compared to HC-PBG fiber, both the excitation pulse and the Raman signal could be respectively delivered and collected in the large core of the fiber. Interesting enough, the background noise, mainly originating from the tiny silica bridges between the hollow channels, appeared in a different spatial pattern distribution than the core mode which carried the main Raman signal. This allowed them to reject the background noise simply by spatial filtering of the output of the fiber using a 20 m pinhole conjugated to the fiber’s output tip.
In an attempt for a real-time measurement of (trace) gas concentration with generally low Raman cross-section, Buric et al. (2008) demonstrated the gas-phase Raman spectroscopy in a 1.5 m long HC-PBG (core diameter 4.9 m) with a signal improvement factor of 500 over the conventional free space configuration. They conclude that, compared to an optimum collection geometry in free space, this enhancement is mainly due to the long interaction length offered by a HC-PCF. Moreover, HC-PBG showed also a better improvement when compared to hollow waveguides (1 m long) which showed enhancement factors of 30 and 50 over free space for normal and resonance Raman scattering, respectively Schwab and McCreery (1987). This point was attributed to the possibility of collecting the spontaneous Raman signal in low-loss higher order modes, in addition to the fundamental mode. This is a unique opportunity not possible with hollow capillaries due to the very high loss of higher-order modes Marcatili and Schmeltzer (1964a). Further research on improving the detection sensitivity in HC-PCF for minute volumes of various samples is being carried on Buric et al. (2009); Yang et al. (2012, 2013); Hanf et al. (2014).
Spontaneous Raman scattering: liquid phase
A liquid-core hollow waveguide may offer low-loss propagation if, by careful choice of the filling liquid and the waveguide material, the conditions for total internal reflection is satisfied. Ippen (1970) demonstrated the use of a liquid-core hollow capillary for SRS. For Raman spectroscopy, enhancement in the sensitivity by factors 100–1000 compared to free space are also reported in long (20 m) index-guiding, liquid-filled hollow capillaries (fused silica, core diameter 75 m). However, this method is limited to liquid samples with refractive indices higher than fused silica at the excitation and Raman signal wavelengths Walrafen and Stone (1972). The use of the Teflon fibers (refractive index 1.35) for enhancing the spontaneous Raman signal in aqueous samples (refractive index 1.3445 at 400 nm) and organic liquids, were also demonstrated although with much higher propagation losses Walrafen (1974); Tian et al. (2007); Dallas and Dasgupta (2004).
Fini (2004) suggested a novel design for a broadband-guiding liquid-core PCF in which guidance relied on the total internal reflection at the interface between the low-index liquid core and the hybrid air-silica cladding with a high air-filling fraction. In this design the presence of air enclosures in the cladding lowers its effective refractive index compared to the refractive index of the liquid. Nielsen et al. (2005) realized this experimentally. A different approach for optical sensing in liquids based on complete filling (core + cladding) of a HC-PCF was demonstrated by Cox et al. (2006), using a broadband-guiding polymer HC-PCF. Further increase in the sensitivity was obtained by the development of new strategies for using HC-PCFs as surface-enhanced Raman scattering (SERS) probes Yan et al. (2006); Zhang et al. (2007b); Cox et al. (2007), see also Yang et al. (2011) and references therein.
CARS in HC-PCFs
Several studies have dealt with realizing nonlinear spectroscopic methods such as coherent anti-Stokes Raman scattering (CARS) in HC-PCF for an enhanced sensitivity Fedotov et al. (2004); Konorov et al. (2005b); Fedotov et al. (2006); Zheltikova and Zheltikov (2006). HC-PCFs are ideally suited for gas-phase CARS spectroscopy because they offer a long interaction length, a high laser-matter spatial overlap, a low nonlinearity due to the negligible overlap with glass, and a tunable dispersion, e.g. by changing the gas pressure Travers et al. (2011a). In CARS, specific molecular transitions are excited through interaction between a pump (P) and a broadband or tunable Stokes signal (S). The resulting coherence wave (see Section III.9.2) of the molecular oscillation is probed by pump photons, resulting in the generation of a blue-shifted anti-Stokes (AS) signal. CARS is efficient if phase-matching is fulfilled, i.e., for each Raman transition. This is not a trivial task in the collinear fiber geometry due to the large Raman shifts which are typical of gases (up to 125 THz or 4166 cm-1 for hydrogen). Ziemienczuk et al. (2012) studied this problem and showed the possibility of phase-matching and intermodal Raman scattering using the slightly multi-mode nature of a HC-PBG. The body of work following this demonstration has clearly shown the importance of higher-order waveguide modes for phase-matching and efficient generation of higher-order Stokes and anti-Stokes components Trabold et al. (2013a, b); Bauerschmidt et al. (2014) as well as the dynamics of SRS in HC-PCFs. In a neat demonstration Bauerschmidt et al. (2015b) revisited parametric gain suppression is SRS Duncan et al. (1986) using an H2-filled broadband-guiding HC-PCF, showing clear first Stokes generation in a higher-order mode while operating at the exact phase-matching point for the pump, Stokes and anti-Stokes in the fundamental mode.
Although it is possible to arrange phase-matching for a specific Raman transition in a single gas species, for example, by using higher order modes Trabold et al. (2013a), this is not suitable for CARS in multi-component analytes. Using pressure-tunable zero dispersion wavelength of a H2-filled broadband-guiding HC-PCF Bauerschmidt et al. (2015a) demonstrated all-fundamental mode (LP01) collinear phase-matched frequency shifting of a broadband supercontinuum. This paved the way for achieving phase-matching over a broad wavelength range for multi-species CARS spectroscopy in broadband-guiding HC-PCFs as recently demonstrated by Hupfer et al. (2016).
III.9.2 Coherent Raman effect
Despite the incoherent nature of the spontaneous Raman scattering, it is possible to use the Raman effect in the stimulated regime in order to place the molecules in a coherent superposition of the molecular levels involved in the scattering process. This coherent Raman effect (CRE) is of paramount importance in nonlinear optics since the coherently prepared molecules oscillate in-phase at the molecular vibrational/rotational frequency, , macroscopically manifesting their synchronous motion as a fast varying refractive index, or coherence wave. Mathematically this is represented by the rapidly oscillating, off-diagonal elements of the density matrix where . The time-dependent refractive index, or molecular modulator, modulates an incident field at the incredibly high molecular oscillation frequencies, approaching 100’s of terahertz in the case of diatomic gases, causing a cascaded generation of new frequencies. This enables generation and modulation of ultrashort pulses Zhavoronkov and Korn (2002); Noack et al. (2005); Chan et al. (2011).
Due to the large energy spacing between their vibrational/rotational states, when interacting with an external field, simple diatomic gases behave to a good approximation as two-level systems. Assuming that the electric field, is linearly polarized and parallel to the z axis, the interaction of an ultrashort pulse described by with a two-level medium beyond the slowly varying envelope approximation is given by a set of Bloch equations Belli et al. (2015),
| (41) | ||||
| (42) |
where represents the population difference between the initial and final states. Here , where subscript zz represents the zz–component of the polarizability tensor, are the elements of the transition polarizability matrix with diagonal, and , and nondiagonal elements , responsible for the Stark shift and the Raman scattering, respectively (see Long (2002)). Note that based on our definition of , the polarizability has the SI units of [F.m2] Butcher and Cotter (1991). Its value may be converted to cgs unit () by dividing the SI value by , and to atomic unit by dividing the SI value by . T2 is the dephasing time of the Raman-induced nonlinear polarization and is inversely proportional to the Raman-gain bandwidth (FWHM) . T1 is the relaxation time of the population.
For the case that the change in the population of the initial state in the course of the interaction could be neglected, i.e. , Eq. 41 may be solved to obtain ,
| (43) |
where . The change in the refractive index is then given by where is the refractive index.
Methods of excitation of the coherent Raman effect
Studies of CRE are mainly use two techniques for the excitation of the Raman coherence: i) impulsive stimulated Raman scattering (ISRS) De Silvestri et al. (1985); Yan et al. (1985); Nazarkin et al. (1999), and ii) two-color pumping (TCP) of a molecular ensemble Imasaka et al. (1989); Yoshikawa and Imasaka (1993); Harris and Sokolov (1997, 1998). The reason can be seen from the Eq. 43. In the TCP scheme the frequency difference between the two driving pulsed lasers, typically several nanoseconds in duration which is much longer than one cycle of the molecular oscillation, typically lying in the femtosecond range, is brought to the close proximity of . This increases the denominator of the integrand in Eq. 43 thus increasing the coherence. In TCP the two driving lasers could be independent or mutually coherent, i.e. coherent pumping Chan et al. (2011); Katsuragawa et al. (2010). It is well known that the TCP establishes a strong molecular modulator that can very efficiently phase modulate the incident electric field in order to collinearly generate Raman sidebands that are separated in frequency by the modulation frequency, . In ISRS, however, a pulse with a duration, shorter than , i.e. , creates non-stationary rotational/vibrational wave packets in the molecular ensemble by exerting an impulse on the molecules. Because then in the frequency domain the bandwidth of the pulse is broad enough to already include pairs of frequencies that their difference is in resonance with the Raman frequency shift, . In contrast to the TCP, in the impulsive regime the driving pulse experiences a continuous increase in its bandwidth accompanied by a frequency downshift of its frequency centroid Korn et al. (1998).
III.9.3 Early developments of coherent Raman effects in HC-PCF
Although both techniques of ISRS and TCP are well developed, studies of CRE in gas-filled HC-PCFs have so far progressed with a slow pace with pump-probe experiments in the impulsive Raman regime emerging only recently Abdolvand et al. (2015); Belli et al. (2015, 2017). This can be perhaps attributed to the high values of the Raman gain offered by HC-PCFs which allow straightforward and easy generation of octave-spanning Raman combs, even when the process starts from quantum fluctuations Couny and Benabid (2009); Wang et al. (2010b); Tani et al. (2015); Benoît et al. (2015). As a result, the focus of the early research on CRE in HC-PCFs, with a very few exceptions Konorov et al. (2005b); Ivanov et al. (2006), has been mainly on pumping a gas-filled HC-PCF with quasi-continuous pump sources (nanosecond pulses to continuous wave). In a beautiful demonstration Couny et al. (2007c) used a hydrogen-filled broadband-guiding HC-PCF for the generation and photonic guidance of multi-octave optical-frequency combs of (rotational-) vibrational Raman sidebands covering the spectral range from 325 nm to 2300 nm, using 12 ns pulses of 40 kW peak power, Fig. 37(a). Remarkably the generation of this wide Raman comb from quantum fluctuations and its subsequent amplification was performed in a single pass along the fiber, combining the generation and amplification stages of the SRS. For spectroscopic applications, however, it is desirable to have a closer line spacing. This can be achieved by using a mixture of several Raman-active gases. Recently Hosseini et al. (2016) have successfully demonstrated this using a mixture of H2, D2, and Xe, Fig. 37(b). Mixing of Xe as a non-Raman-active gas allows for controlling the dispersion without changing the ratio of the overall Raman gain offered by H2 and D2.
Using the classical description of SRS, Nazarkin et al. (2009) highlighted the role of the parametric coupling and phase-locking between Stokes and anti-Stokes components in the efficient frequency up-conversion of the pump in HC-PCFs. This explained some of the peculiarities of the 2002 demonstration of SRS in broadband-guiding HC-PCF by Benabid et al. (2002), namely the remarkably high conversion efficiency of 3% to the first anti-Stokes in the presence of a large phase mismatch. By developing the quantum theory of Raman comb generation in gas-filled HC-PCF, the existence of a self- and mutual coherence between the Raman sidebands was predicted theoretically Couny et al. (2007c); Wu et al. (2010). The presence of these phase correlations is despite the inherent phase fluctuations of the individual sidebands from pulse to pulse. The existence of these phase correlations was subsequently verified experimentally Wang et al. (2010a); Abdolvand et al. (2012).
Although HC-PBGs were quite successful in reducing the threshold requirement for SRS, it was realized since the early stages that their limited transmission windows, in the range of 50 THz bandwidth, are restricting for increasing the spectral extend of multi-component Raman combs Beaudou et al. (2010). The development of broadband-guiding HC-PCFs with exceedingly large transmission windows, covering the vacuum ultraviolet to infrared range, has offered an excellent solution to this issue (see below). However, the spectral filtering effect in HC-PBGs has itself been exploited to demonstrate unique capabilities of these fibers in enabling ultra-low power gas-phase nonlinear optics and studies of the long-distance dynamics of SRS. Benabid et al. (2004) used this to demonstrate pure rotational SRS using 1 ns pulses of only 1 nJ energy in a 35 m long H2-filled HC-PBG. The spectral filtering of HC-PBG prevented energy transfer to the normally dominant vibrational Stokes band of H2 as well as higher-order rotational Raman sidebands, all of which were lying outside the transmission window of the fiber. In yet another demonstration Couny et al. (2007a) showed sub-watt threshold Raman laser action in a 30 m long HC-PBG filled with H2 at 10 bar.
Abdolvand et al. (2009) used the spectral filtering effect in a HC-PBG to demonstrate the long-distance dynamics of the Stokes pulse in the backward transient stimulated Raman scattering (TSRS) in hydrogen. By TSRS we mean that the duration of either the pump or the Stokes is shorter than T2 Raymer et al. (1985). They demonstrated late-stage coherent amplification and shortening of the backward Stokes pulse well below T2. They showed that before the pulse reaches its asymptotic solitary shape Maier et al. (1969), the amplification saturated due to the formation of a reshaped, stable pulse envelope, with the peak of the pulse envelop rolling with superluminal velocity over its (compact) support Icsevgi and Lamb Jr (1969). Nazarkin et al. (2010) used a similar H2-filled HC-PBG in order to study the long-distance dynamics of the Stokes pulse in the forward TSRS. In their 2010 paper Nazarkin et al. reported the first experimental observation of self-similar solutions of forward TSRS, also known as accordions (see Levi et al. (1994) and the references therein), in a “clean” system of two frequencies, “pump + Stokes” coupled through the Raman nonlinearity. Accordions are the non-solitonic solutions of the sine-Gordon equation associated to TSRS. In the presence of memory they dominate the long-distance evolution of the system instead of solitons Menyuk (1993); Menyuk and Hilfer (1989); Menyuk et al. (1992). Two difficulties had severely hampered the previous attempts for observing accordions in free-space interaction geometry, namely designing an experiment of sufficient length to observe the phenomenon, while avoiding the parasitic interference from the higher-order Raman sidebands Duncan et al. (1988). By offering both a long interaction length and eliminating the higher order Stokes and anti-Stokes bands, HC-PBGs provided an elegant solution to these problems.
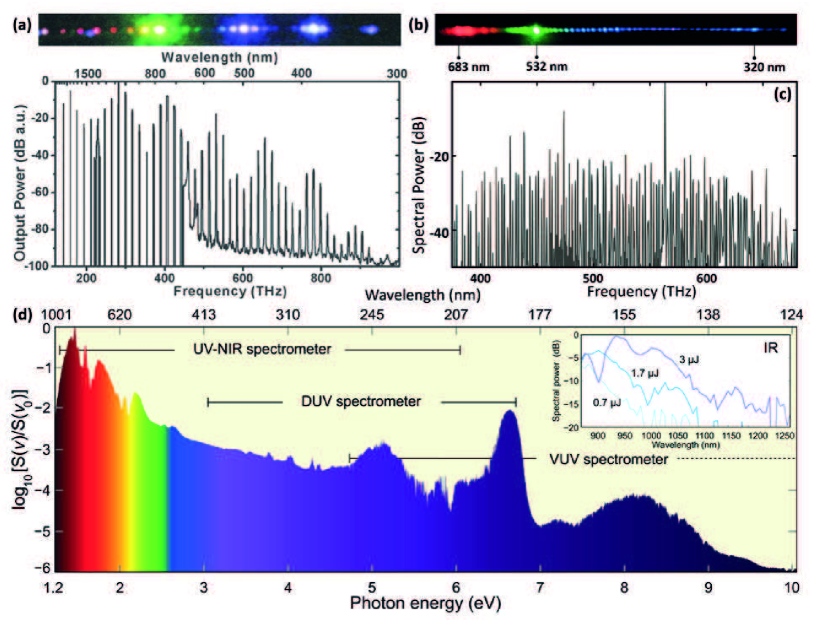
III.9.4 Recent developments of coherent Raman effects in HC-PCF
Coherent Raman scattering holds promise for the generation of ultrashort pulses in the visible and ultraviolet spectral region Baker et al. (2011). Generation of a broad Raman comb via TCP of an ensemble of molecular hydrogen in a room-temperature gas cell at atmospheric pressure has enabled researchers to generate a train of ultrashort pulses of 1 fs duration with full control over their carrier envelope phase Chan et al. (2011). By driving the vibrational Raman transition in H2 with a pair of 3 ns pulses at 2.4 m and its second harmonic (1.2 m)—commensurate with the fundamental vibrational frequency in H2 at —researchers insured a well-defined phase relation between the driving fields, i.e. pump at 1.2 m and Stokes at 2.4 m. In contrast, the Raman comb in the work of Couny et al. (2007c) originated from quantum zero-point fluctuations, bearing a large phase and energy fluctuations from pulse to pulse. However, propagation in the high-gain transient regime offered by the HC-PCF established a robust, mutual phase correlation between the comb lines. This opens up the possibility of attosecond pulse train generation with non-classical correlations between the amplitudes and phases of their individual spectral constituents.
In contrast to the steady state, Raman gain in the transient regime is rather insensitive to the increase in the Raman gain bandwidth Raymer and Walmsley (1993). By exploiting this property and using a broadband-guiding HC-PCF filled with a mixture of H2-D2-Xe Hosseini et al. (2016) have been able to generate a spectral cluster of more than 135 ro-vibrational Raman sidebands covering the visible spectral region with an average spacing of only 2 THz, Fig. 37(c).
Although in recent years Raman comb generation via molecular modulation has been the subject of intense studies, by virtue of the Fourier transform theorem this method is incapable of constructing single isolated ultrashort pulses. On the other hand, impulsive excitation of the coherent molecular oscillations with femtosecond pulses has proven successful for the generation of isolated femtosecond pulses in the visible and ultraviolet spectral region Zhavoronkov and Korn (2002). In this regard, fast molecular oscillations such as vibrations of light diatomic molecules, e.g. H2 or D2, are more favorable as they offer a larger modulation bandwidth ( 100 THz, fs) for the generation of shortest achievable pulses using this method. However, since impulsive excitation of a molecular oscillation generally requires a pump pulse with a duration, shorter or comparable to , i.e. , pulse durations required for efficient impulsive excitation of these fast vibrations are expected to be very short, 10 fs. As an example for ortho-H2, the time scales of the molecular rotational and vibrational motions are fs, and fs, respectively. While pulse duration below 57 fs may directly be obtained from normal Ti-Sapphire amplifiers, generation and faithful control and delivery of high-energy pulses of less than 8 fs to a gas target is still challenging. This has significantly hampered studies of ISRS in light diatomic gases
HC-PCFs offer a neat solution to this problem. As shown in Section III.7.4, the soliton propagation dynamics of ultrashort pulses in the anomalous dispersion regime of a gas-filled HC-PCF is accompanied by temporal self-compression. This offers a novel way to access fast molecular oscillations without a need for originally ultrashort pulses below . In an elegant demonstration, starting from 50 fs ultrashort pulses, Belli et al. (2015) showed how using the soliton self-compression effect one can efficiently excite fast fundamental vibrational mode of hydrogen. Direct impulsive excitation of the fundamental vibrational mode in hydrogen would have required 8 fs pump pulses. By using self-compression, which is enhanced by the Raman contribution to the nonlinear refractive index, the 50 fs pump pulses used by Belli et al. (2015) compressed to below 2 fs, thus generating a broad supercontinuum expanding from vacuum ultraviolet (VUV; 124 nm) to beyond 1200 nm in the infrared, Fig. 37(d). This was the both the first demonstration of VUV guidance, and also the first VUV supercontinuum generated, in broadband-guiding HC-PCF. The mechanism proceeds as follows. First the pump pulse emits a RDW in the VUV (180 nm). Subsequently, the strong Raman coherence created via impulsive Raman scattering of the pump pulse modulates and broadens the RDW further into the VUV, down to 124 nm. The mechanism behind the VUV extension of the supercontinuum in the work of Belli et al. (2015) is a unique demonstration of the interplay between VUV RDW generation and a pre-existing Raman coherence. More recently, Belli et al. (2017) used the creation of a Raman coherence by a leading pulse to exert precise control on a probe pulse in a broadband-guiding HC-PCF, even when the probe pulse contains similar energy to the pump. By timing the relative delay of the probe, either enhanced temporal probe compression, probe broadening, or steepening of the leading or trailing edge of the probe pulse was achieved. In addition, the frequency of deep-UV RDW emission was also modulated using the Raman coherence. Such coherent control of deep-UV pulses can be useful, for example, to advanced ultrafast spectroscopy in the UV.
With regard to soliton dynamics, the work of Belli et al. (2015) is one manifestation of the interaction between the Raman response of gases and soliton dynamics in HC-PCF. In fact some of the earliest reports on the propagation of solitons in HC-PBG demonstrated the presence of a Raman-soliton self-frequency shift as described in Section III.7.1. In the context of broadband-guiding HC-PCF, which can be expected to support much wider shifts, this was further explored by Saleh and Biancalana (2015), who numerically predicted a tuning range of 1.3 m to 1.7 m in a hydrogen filled fiber. Further numerical results indicate that gas-filled broadband-guiding HC-PCF offers a very rich environment for nonlinear soliton-Raman interactions, such as temporal analogues of condensed matter physics Saleh et al. (2015a, b), which have yet to be experimentally explored.
III.10 Near and mid infrared supercontinuum generation
Many of the self-compression, RDW emission, plasma and Raman driven effects described above gave rise to extreme spectral broadening that can be classed as supercontinuum generation. These were predominantly concentrated in the visible, UV and the short-edge of the near-infrared spectral regions.
The extraordinary low-loss guidance fibers achieved in the MIR by Yu and Knight (2013, 2016), even with silica glass, has stimulated investigation of the possibilities of near and mid-infrarred (MIR) nonlinear dynamics and supercontinuum in gas-filled, silica-glass broadband-guiding HC-PCF.
Numerical simulations based on broadband-guiding HC-PCF filled with supercritical Xe and pumped at 3.7 m predicted supercontinuum generation spanning 1.85 to 5.20 m Hasan et al. (2016). Alternatively, numerical simulations of plasma dynamics in broadband-guiding HC-PCF filled with 1.2 bar Xe and pumped at 3 m predicted supercontinuum generation spanning 1 to 4 m Habib et al. (2017a).
Experimentally, using simply an air-filled broadband-guiding HC-PCF, Mousavi et al. (2017) demonstrated a variety of nonlinear effects, including supercontinuum formation between 850 to 1600 nm, when pumping at 1030 nm. A more exotic supercontinuum mechanism, based on the dispersion caused by the resonances in a broadband-guiding HC-PCF has also recently been reported Sollapur et al. (2017), leading to broadening extending from 200 nm to 1.7 m.
Experimental results extending into the MIR have been obtained by Cassataro et al. (2017) who achieved supercontinuum extending from 270 nm to 3.1 m in an Kr-filled broadband-guiding HC-PCF pumped at 1.7 m, and Köttig et al. (2017a) who achieved a 4.7-octave supercontinuum spanning from 180 nm to 4.7 m in a Ar-filled broadband-guiding HC-PCF pumped with 27 fs pulses at 1030 nm.
Further nonlinear mechanisms and experiments in this important spectral region are to be expected.
III.11 Modulational instability
The use of modulational instability393939For a description of this process in conventional optical fibers see the literature following the first proposal Hasegawa and Brinkman (1980), demonstration Tai et al. (1986), or early history in general Zakharov and Ostrovsky (2009). (MI) to obtain a broad and smooth continuum in HC-PCF, albeit without temporal coherence, was first proposed by Travers et al. (2011a). The essential idea was to extend the MI techniques used in solid-core fibers404040 See Dudley et al. (2006) for a general review, and Travers (2010) for a specific review of extending MI supercontinua towards the blue in solid-core PCF. to the UV region using the weaker dispersion and UV transmission of gas-filled HC-PCF. This Kerr-driven MI is distinct from the plasma-driven MI predicted by Saleh et al. (2012) and described previously.
Tani et al. (2013) used an 18 m core diameter, 10 bar Xe filled broadband-guiding HC-PCF, pumped with 500 fs, 5 J pulses at 800 nm to obtain a supercontinuum extending from 320 nm to 1300 nm. The corresponding input soliton order was N = 210. Clear MI sidebands were observed in agreement with numerical simulations, which predicted that temporal soliton-like structures would emerge with a sub-cycle duration of 1 fs and peak power 20 MW. The extended blue-side of the continuum was formed by dispersive-wave emission from these structures, and the red-side by the resulting spectral recoil of the solitons.
Azhar et al. (2013b) used an 18 m core diameter broadband-guiding HC-PCF filled with very high pressure Ar, up to 150 bar, to study the role and evolution of MI and dispersive-wave emission by tuning the zero dispersion wavelength and soliton order with pressure, while keeping the pump parameters fixed at 140 fs pulses at 800 nm with energies up to 450 nJ.
III.11.1 Quantum Optics Applications.
Finger et al. (2015) used the high-pressure filled broadband-guiding HC-PCF system for twin-beam generation—a quantum optical light source of two beams, which may have a very uncertain number of photons, but where the number of photons in each beam is always exactly the same. Twin beams have applications in quantum metrology, imaging, and key distribution among others. Twin beam sources based on MI or FWM had been previously demonstrated in solid-core fibers, but always in the presence of Raman scattering, which in this case acts as a source of noise. Raman is absent in the high pressure Ar system, and in addition, the sideband locations can be tuned either by the pump energy or, more easily and widely, by the gas pressure. The source demonstrated by Finger et al. was the brightest twin-beam source yet demonstrated, and also contained the fewest spatiotemporal modes, a requirement of precise quantum optical metrology. Further work showed how the time-frequency mode structure of the twin-beams could be tuned using the gas pressure, pump pulse chirp and fiber length Finger et al. (2017).
III.12 Spatial nonlinear effects and filamentation
Almost all HC-PCFs designed or manufactured to date are multimode. Certainly the broadband-guiding HC-PCF widely used for ultrafast nonlinear optics supports a plethora of modes. This means that spatial effects can occur through nonlinear interactions coupling the modes. Multimode effects have been included in numerical models of ultrafast pulse propagation in broadband-guiding HC-PCF Tani et al. (2014). At the extreme limit, nonlinear coupling between modes manifests as self-focusing414141Analysis of the critical power for self-focusing in HCF, which is directly applicable to HC-PCF can be found by the papers of Fibich and Gaeta (2000); Milosevic et al. (2000); Zheltikov (2013)..
In HC-PCF, Konorov et al. (2004c) observed spatial effects when using 4 J, 30 fs pulses to pump a 14 m core diameter HC-PBG fiber filled with air or Ar. These effects occurred when the peak powers reached between 0.5 to 0.9 time the critical power for self-focusing. The output spatial profile was observed to become smooth and symmetric and this was attributed to the formation of a nonlinear waveguide within the HC-PCF.
Azhar et al. (2013a) pumped broadband-guiding HC-PCF filled with Xe at supercritical pressures, and hence with very high densities. As the energy was increased a threshold like change in transmission occurred at a certain input energy. The effect was ascribed to self-focusing in the input gas-cell, but the mechanism could not be fully explained for their parameters.
Tani et al. (2014) modelled and experimentally demonstrated the emission of RDWs in higher order modes and modelled previous experimental results on intermodal THG and FWM. They also noted a form of filamentation-like balance occurring in the core of the broadband-guiding HC-PCF, for parameters corresponding to their previous result on MI Tani et al. (2013). When modelling the propagation without ionization, the beam was predicted to self-focus inside the fiber through efficient emission of energy into higher order modes through RDW emission; whereas including ionization terms prohibited this, and the beam was guided very close to the shape expected for linear propagation.
In their soliton self-compression experiments, Balciunas et al. (2015) noted that the output beam shrunk due to a small self-focusing effect at higher energies.
III.13 Nonlinear wave mixing and harmonic generation
III.13.1 Third harmonic generation
Third harmonic generation was the first ultrafast nonlinear experiment to be performed in broadband-guiding HC-PCF. Nold et al. (2010) used 2 J, 30 fs pulses at 800 nm, to generate pulses around 275 nm. To obtain phase-matching, the UV light needed to be emitted in a higher order mode. They targeted the HE13 mode with 5 bar Ar and demonstrated pressure tuning of the phase-matched THG emission. Overall the conversion efficiency was very low, at 10-5, and does not compete with RDW emission discussed in Section III.7.5. Tani et al. (2014) used this experiment as a test for their multimode propagation model.
III.13.2 Second harmonic generation
Ménard and St.J. Russell (2015) demonstrated second harmonic generation in Xe filled broadband-guiding HC-PCF. While Xe is macroscopically inversion symmetric and hence does not offer an intrinsic (2) response, an effective (2) can be obtained using the widely explored technique of applying a quasi-static electric field , such that . Similar to the THG work by Nold et al. (2010), Ménard and St.J. Russell (2015) used intermodal phase-matching to increase the efficiency of the process. They obtained an efficiency of 10-7 when converting 30 J, 2 ns pump pulses at 1064 nm to 532 nm in the HE12 mode. In a follow-up paper Ménard et al. (2016) improved the conversion efficiency, by three orders of magnitude, by using femtosecond pump pulses with higher peak power and improving the electrode design to increase inside the fiber core. Additionally, they demonstrated the use of quasi-phase matching, with patterned electrodes, to obtain conversion to the fundamental fiber mode.
While even the improved version still has very low conversion efficiency of 0.02%, there are a number of interesting prospects for this technique. Firstly, it can be used to obtain signals at more exotic wavelengths, such as the VUV or MIR or THz range. Secondly, as the position of the SHG generation can be controlled by an external electric field, it is possible to vary the generation point along the fiber and hence noninvasively measure the modal attenuation at shifted wavelengths without cutting the fiber.
III.13.3 Four wave mixing
Four wave mixing (FWM) in HC-PBG was demonstrated and optimized in a series of papers by Konorov et al. (2003b, 2004a, 2005a). Due to the narrow guidance bands in HC-PBG this required very special fiber designs. Konorov et al. (2003b) designed a fiber designed to transmit 1060 nm, its second harmonic at 530 nm, and its third harmonic at 353 nm. A 9 cm fiber was pumped with 30-50 J, 30 ps pulses both at nm and its second harmonic, and the UV signal generated using four-wave mixing in the configuration 3 = 2 + 2 – . In a comparison to tight-focusing in free-space, the authors claimed an 800 times enhancement. A second fiber design enabled the same experiment to be performed starting from a fundamental wavelength of 1250 nm from a Cr:forsterite laser. In this case the fiber was optmized for phase-matching. Finally, by scaling to a larger core size Konorov et al. scaled the pulse energy to the mJ range with ns pulse durations Konorov et al. (2005a).
Broadband guiding HC-PCF, which can have guidance bands spanning the UV, visible, near-IR spectrum should be even better hosts for such FWM interactions. The first result in HC-PCF, was by Azhar et al. (2013a). During their experiments on filling HC-PCF with supercritical Xe they observed intermodal FWM before the onset of self-focusing effects.
Ultrafast FWM for the efficient generation of deep-ultraviolet pulses, as developed in conventional HCF Misoguti et al. (2001), was recently demonstrated by Belli et al. (2016). They used a 26 m diameter Ar-filled broadband-guiding HC-PCF to obtain a ¿30% conversion efficiency from 400 nm to and an energy of 490 nJ at 266 nm, when seeding at the idler wavelength of 800 nm. The authors noted a number of advantages compared to RDW emission, in particular that the UV pulse chirp could be controlled and that the bandwidth of the emitted band could be tuned independently of the central frequency. This is hard to achieve with RDW emission as the dynamics of high frequency emission are so tightly coupled with extreme pulse compression. The advantage compared to HCF is the ability to use much lower pump energies, in the J region, and hence the possibility of scaling the repetition rate and average power of the deep-UV emission by making use of ultrafast fiber and thin-disk laser systems.
In principle this scheme could be extended to the VUV region. In a theoretical study, Im (2015) considered chirped FWM to the VUV region. Predicting the generation of sub-10 fs VUV pulses with an energy of up to hundreds of J by broad-band chirped idler pulses at 830 nm and MW pump pulses with narrow-band at 277 nm. Such a source would strongly compete with RDW emission.
III.13.4 High harmonic generation
Given that HC-PCF is capable of guiding intense ultrafast light pulses, such that they can partially ionize the filling gas, and in addition that the dispersion of the gas and waveguide system can be tuned, it is no surprise that it has been considered for the generation of high harmonics (HHG) in the extreme UV and soft-Xray spectral region.
Phase-matching
Serebryannikov et al. (2004) performed a detailed study on the possibilities of phase-matching HHG generation in HC-PBG fiber. Noting that the waveguide contribution to the dispersion is much stronger than in conventional HCF, various schemes, such as emitting the harmonics in high order modes, or using specific dispersion variation at the edges of a band-gap were proposed. In a further study, Serebryannikov et al. (2008), discussed using the nonlinear phase modulation resulting from soliton propagation and ionization in the fiber core, similar to the phase matching of RDW discussed in Sections III.7.5 and III.8.5. In this way it was predicted that a broad band of harmonics, from the 19th to 129th, could be simultaneously phase-matched from the center of the band-gap, hence providing low-loss guidance of the pump field. Alternatively, Ren et al. (2008) discussed using quasi-phase-matching with a counter-propagating laser, similar to that demonstrated in conventional HCF Zhang et al. (2007a) could be used. So far neither of these techniques has been experimentally demonstrated.
Very recently the idea of achieving quasi-phase-matching by using interference between fiber modes was proposed and preliminary demonstrated Anderson et al. (2017), as discussed below.
Experiment
The first report on HHG inside a HC-PCF is by Heckl et al. (2009), who obtained the 13th harmonic of 800 nm (at 60 nm) using 4.2 J and the 7th harmonic with as little as 200 nJ pump pulses. They used 1.5 cm of 15 m core diameter broadband-guiding HC-PCF filled with up to 30 mbar Xe. As noted above, recently Anderson et al. (2017) demonstrated the 60-fold enhanced emission of high-harmonics at 30 eV. The authors claim that this enhancement was achieved by a form of quasi-phase-matching in which the interference between different fiber modes in a control pulse, and a delayed driving pulse, causes amplitude fluctuations with a period such that the harmonic emission is coherently enhanced.
An alternative combination of HC-PCF and HHG is to use a broadband-guiding HC-PCF for soliton effect pulse compression or other soliton dynamics and use the output for direct HHG in a gas jet. This was the approach of Fan et al. (2014) who used the self-compressed source described in Section III.7.4 with 30 J in a single-cycle at 1.7 m to generate an EUV continuum extending to beyond 48 eV. Recently Tani et al. (2017) showed that plasma blue-shifting solitons in a broadband-guiding HC-PCF with an He pressure gradient (described in Section III.8.4) can produce continuously blue-shifting HHG when the HC-PCF output is placed directly in front of a Xe gas jet. The harmonic wavelengths could be continuously tuned over the range 25 to 60 nm.
Soliton self-compression can lead to HHG driving pulses of just 1 fs duration. Such a short driving field has not been widely explored as it has peviously been difficult to achieve. Prelimiary numerical simulations show that novel time-frequency phenomena can be expected in the EUV and XUV under such conditions Chu et al. (2016).
III.14 Gas based stimulated emission, amplification and lasing
As fiber lasers based on doped solid-glass cores have been so successful, a number of groups have asked if it is possible to build a gas laser inside an HC-PCF. While apparently no discharge based gas-laser has yet been demonstrated (although see Section III.8.6 for discharge emission), there have been a number of successful attempts at building optically pumped gas lasers. The first evidence of stimulated emission was provided by Jones et al. (2011), using an HC-PCF filled with acetylene. Single pass conversion from 5 ns pulses at 1521.05 nm to two emission lines at 3123.2 nm and 3162.4 nm was achieved, with about 10-6 conversion efficiency from 1 J pump pulses. This approach has recently been energy-scaled to achieve 1.4 J at 3 m for an absorbed pump energy of 8.2 J Dadashzadeh et al. (2017). Wang et al. (2014) reported 3.1-3.2 m mid-infrared emission from an acetylene-filled HC-PCF pumped with a diode laser. Nampoothiri et al. (2015) demonstrated continuous-wave lasing 1280–1340 nm region in a cavity surrounding an iodine filled HC-PCF, pumped at 532 nm. Most recently, Abu Hassan et al. (2016) reported both continuous-wave and synchronously pumped operation of a ring-cavity mid-IR fiber laser based on acetylene filled HC-PCF and pumped with telecom diodes operating at 1.5 m. Up to 9% slope efficiency is achieved in the 3 m region. Further enhancement has scaled the output power to 0.47 W and the sing-pass slope efficiency above 18% Xu et al. (2017).
IV Conclusions and Perspectives
In this article, we reviewed recent progress in silica-based hybrid PCFs fabricated through various post-processing methods, which allow the integration of novel and functional materials inside conventional solid- and HC-PCFs. Use of liquids, glasses, metals, semiconductors and gases have opened the door to a plethora of new applications in critical areas such as communications, sensing, bio-photonics, ultrafast science and quantum optics.
Sections II.A. and B. overviewed the most important reports on hybrid PCFs for the development of tunable linear devices suitable for sensing, tunable filters, switching elements and other active and passive fiber components. We also presented a number of selected experimental studies focused on anti-resonant devices and plasmonics using highly nonlinear chalcogenide glasses and metals. Section II.C. highlighted the main nonlinear effects achieved in hybrid PCFs infiltrated with nonlinear liquids. Self-defocusing, spatial soliton formation, nonlocality, supercontinuum generation and nonlinear directional couplers are some of the main nonlinear PCF devices that have been developed over the past few years.
However, the main question is perhaps “what is next?” The answer to this question is directly linked to and dependent on two main aspects. The first one involves the development of novel functional nanomaterials that can be used to further enhance existing or reveal new optical properties when interacting with light. The second involves the development of new fabrication strategies that will enable of successfull post-integration of novel materials inside solid-core PCF as well as HC-PCF, which due to thermo-mechanical incompatibility are not suitable for direct fiber drawing. For example, the solution-processed approach of soft-glass deposition presented in Section II.A.2 could be combined with the pressure assisted-method for the integration of multi-materials with novel functionalities into a single cladding hole of the PCF. Such an approach would significantly extend the design and material flexibility of hybrid PCFs. As stated in the introduction, the results we presented in this review article were exclusively targeting silica glass. Considering different host materials, such as chalcogenide glasses, hybrid PCFs could find their way to mid-infrared (MIR) wavelength range (known also as “molecular fingerprint” region), a very attractive but not yet fully explored area. The MIR region has been proved to be quite important due to the presence of a multitude of strong characteristic absorption lines of many important molecules, making this region crucial for applications in materials processing, chemical and biomolecular sensing as well as spectroscopy for non-destructive MIR optical coherence tomography (OCT) and pollution monitoring. With the rapid development of MIR sources such as MIR supercontinuum, tunable optical parametric amplifiers (TOPAs) and quantum cascade lasers (QCLs), it is expected that MIR monolithic fiber devices such as sensors, filters, fiber couplers, etc. will also play an important role in this area in the near future. Indeed by using appropriate MIR-compatible materials, the hybrid fiber devices presented in this article could straightforwardly be adopted in the MIR region.
Section III highlights the most recent advances in the field of gas-filled HC-PCF for gas-based nonlinear optics. The main advantage of using gases inside HC-PCF is that both the dispersion and the nonlinearity can be tuned by simply changing the gas pressure while guiding high peak intensities without damaging the host glass material of the fiber. The strong confinement of light in the core of a HC-PCF and the strong light-gas interaction length has enabled investigation of previously inaccessible interaction regimes. Exciting new applications and results have emerged over the past few years, such as light generation in the extreme wavelength regions of vacuum ultraviolet, sub-cylce pulse compression, soliton-plasma interactions, high-harmonic generation to name a few. While there are many further directions to explore, here we outline three that are clear. (i) As for the solid and liquid-filled hybrid PCFs, the MIR region is relatively unexplored for gas-filled HC-PCF. With some of the extraordinary low-loss guidance fibers achieved in the MIR by Yu and Knight (2013, 2016), even with silica glass, there are certainly many possibilities. The recently demonstated MIR resonant dispersive-wave emission (Section III.8.5) hinted at this and there have been some initial work as discussed in Section III.10. It appears reasonable that many of the ultrafast dynamics explored to date in gas-filled HC-PCF can be shifted to the MIR, but also that new phenomena will occur, similarly to the new regimes currently being explored in MIR filamentation Panagiotopoulos et al. (2015). (ii) Another, relatively unexplored direction, is scaling the pulse repetition rate. This can usually straightforwardly increase the average power of the system without significant alteration of the nonlinear dynamics if thermal management if effective, and a number of pulse compression experiments at high repetition rate (MHz range) have been explored Köttig et al. (2015, 2017b). However, given the long recombination times, plasma effects can significantly alter the dynamics as the time period between subsequent pulses is reduced. In this case it is reasonable to imagine building up plasma densities inside a HC-PCF using avalanche ionization and heating of the plasma over multiple shots. This could change the dispersion landscape of the system (i.e. a plasma filled fiber could break the fairly uniform scaling of linear dispersion and nonlinearity found in the noble gases), or be used for more exotic nonlinear experiments such as Raman-like interactions in plasmas. This area is quite unexplored and ripe for further investigation given the now ready availability of high repetition rate femtosecond laser sources with multi-J pulse energies. (iii) Almost all of the nonlinear experiments reported in HC-PCF have been based on linearly polarized pump lasers and interactions. Utilizing the vector nature of the light fields in gas-filled HC-PCF to either enhance or alter the balance between nonlinear effects, or to create light sources with specific tailored characteristics is an area of research yet to receive much attention. In particular, tuning the ellipticity of the DUV RDW emission would be an important additional tool for spectroscopy (to e.g. spin-resolve photo-emitted electrons).
In section III.I. we overviewed the use of HC-PCFs filled with Raman-active gases and liquids as Raman probes and generators. Efficient collection of the Raman signal, accumulation of the signal over the length of the fiber and operation in the short wavelength spectral regions of visible and UV without suffering from silica Raman background signal or photo-damage make a HC-PCF an excellent choice as a Raman probe. Extending the Raman spectroscopy in HC-PCFs to the nonlinear interaction regime, e.g. coherent anti-Stokes Raman scattering, is certainly of considerable interest. Extremely high Raman gains offered by HC-PCFs also allow straightforward generation of an octave-spanning Raman comb of narrowband spectral lines. Combination of different gases inside a single HC-PCF pumped with high energies may offer a new route to the generation of dense spectral clusters across the ultraviolet-visible wavelength range and could constitute another direction for novel nonlinear effects. Efficient molecular modulation with ultrashort pulses in HC-PCFs have shown for the first time the impulsive excitation of extremely fast molecular vibrations of light diatomic gases such as H2 and D2 and generation of extremely broad supercontinua. Developments in this direction are of interest for the generation and manipulation, via coherent Raman of ultrashort pulses in the visible and ultraviolet spectral regions.
In conclusion, novel photonic materials combined with PCFs as a versatile platform have empowered a wide arc of unique fiber-based linear and nonlinear devices and architectures. Hybrid PCFs will inevitably remain the “lion’s share” of the research on PCFs and their applications in the new optical frontiers of UV and MIR over the next few years and thus a bright future is anticipated. We hope that this article serves as introductory point to the vast literature that has already accumulated in this field.
Acknowledgements.
C.M. would like to thank Ayman F. Abouraddy, Kristian Nielsen and Søren Michael Mørk Friis for fruitful discussions. J.C.T and A.A. thank Federico Belli for useful discussions. C.M. and O.B. acknowledge financial support from the Danish Research Council (FTP) (4184-00359B), Innovation Fund Denmark ShapeOCT (4107-00011A) and Carlsberg Foundation (CF14-0825). J.C.T. has received funding from the European Research Council (ERC) under the European Union’s Horizon 2020 research and innovation programme (grant agreement HISOL 679649). B.J.E. acknowledges the support of the Australian Research Council (ARC) through the Laureate Fellowship (FL120100029) and Center of Excellence CUDOS, (CE110001018).References
- Abdolvand et al. (2015) Abdolvand, A., F. Belli, J. C. Travers, and P. S. J. Russell (2015), in European Quantum Electronics Conference (Optical Society of America) p. EE_1_2.
- Abdolvand et al. (2009) Abdolvand, A., A. Nazarkin, A. Chugreev, C. Kaminski, and P. S. J. Russell (2009), Physical Review Letters 103 (18), 183902.
- Abdolvand et al. (2012) Abdolvand, A., A. Walser, M. Ziemienczuk, T. Nguyen, and P. S. J. Russell (2012), Optics Letters 37 (21), 4362.
- Abouraddy et al. (2007) Abouraddy, a. F., M. Bayindir, G. Benoit, S. D. Hart, K. Kuriki, N. Orf, O. Shapira, F. Sorin, B. Temelkuran, and Y. Fink (2007), Nature Materials 6 (5), 336.
- Abu Hassan et al. (2016) Abu Hassan, M. R., F. Yu, W. J. Wadsworth, and J. C. Knight (2016), Optica 3 (3), 218.
- Akhmediev and Karlsson (1995) Akhmediev, N., and M. Karlsson (1995), Physical Review A 51 (3), 2602.
- Alexander Schmidt et al. (2016) Alexander Schmidt, M., A. Argyros, and F. Sorin (2016), Advanced Optical Materials 4 (1), 13.
- Alkeskjold et al. (2006) Alkeskjold, T. T., J. Laegsgaard, A. Bjarklev, D. S. Hermann, J. Broeng, J. Li, S. Gauza, and S.-T. Wu (2006), Applied Optics 45 (10), 2261.
- Alkeskjold et al. (2007) Alkeskjold, T. T., L. Scolari, D. Noordegraaf, J. Læ gsgaard, J. Weirich, L. Wei, G. Tartarini, P. Bassi, S. Gauza, S. T. Wu, and A. Bjarklev (2007), Optical and Quantum Electronics 39 (12-13), 1009.
- Ammosov et al. (1986) Ammosov, M., N. Delone, and V. Krainov (1986), Soviet Physics Journal of Experimental and Theoretical Physics 64 (6), 1191.
- Anderson et al. (2017) Anderson, P., F. Wiegandt, F. Yu, D. Treacher, D. Lloyd, P. Mosley, S. Hooker, and I. A. Walmsley (2017), in Conference on Lasers and Electro-Optics (Optical Society of America) p. ATh4C.4.
- Andrienko (2006) Andrienko, D. (2006), International Max Planck Research School, Modelling of Soft Matter (September), 1, arXiv:arXiv:1011.1669v3 .
- Argyros et al. (2008) Argyros, A., S. G. Leon-Saval, J. Pla, and A. Docherty (2008), Optics Express 16 (8), 5642.
- Argyros and Pla (2007) Argyros, A., and J. Pla (2007), Optics Express 15 (12), 7713.
- Austin et al. (2006) Austin, D. R., C. M. de Sterke, B. J. Eggleton, and T. G. Brown (2006), Optics Express 14 (25), 11997.
- Azhar et al. (2013a) Azhar, M., N. Y. Joly, J. C. Travers, and P. S. J. Russell (2013a), Applied Physics B 112 (4), 457.
- Azhar et al. (2012) Azhar, M., G. Wong, W. Chang, N. Joly, and P. S. Russell (2012) (OSA) p. CTh4B.4.
- Azhar et al. (2013b) Azhar, M., G. K. L. Wong, W. Chang, N. Y. Joly, and P. S. Russell (2013b), Optics Express 21 (4), 4405.
- Babin et al. (2002) Babin, A. A., D. V. Kartashov, A. M. Kiselev, V. V. Lozhkarev, A. N. Stepanov, and A. M. Sergeev (2002), Applied Physics B 75 (4-5), 509.
- Baker et al. (2011) Baker, S., I. A. Walmsley, J. W. G. Tisch, and J. P. Marangos (2011), Nature Photonics 5 (11), 664.
- Balciunas et al. (2015) Balciunas, T., C. Fourcade-Dutin, G. Fan, T. Witting, A. A. Voronin, A. M. Zheltikov, F. Gerome, G. G. Paulus, A. Baltuska, and F. Benabid (2015), Nature Communications 6, 10.1038/ncomms7117.
- Ballato et al. (2008) Ballato, J., T. Hawkins, P. Foy, R. Stolen, B. Kokuoz, M. Ellison, C. McMillen, J. Reppert, A. Rao, M. Daw, et al. (2008), Optics Express 16 (23), 18675.
- Bauerschmidt et al. (2015a) Bauerschmidt, S., D. Novoa, A. Abdolvand, and P. S. J. Russell (2015a), Optica 2 (6), 536.
- Bauerschmidt et al. (2014) Bauerschmidt, S., D. Novoa, B. Trabold, A. Abdolvand, and P. S. J. Russell (2014), Optics Express 22 (17), 20566.
- Bauerschmidt et al. (2015b) Bauerschmidt, S. T., D. Novoa, and P. S. J. Russell (2015b), Physical Review Letters 115 (24), 243901.
- Baym (1969) Baym, G. (1969), Lectures on quantum mechanics, Vol. 10 (Westview Press).
- Beaud et al. (1987) Beaud, P., W. Hodel, B. Zysset, and H. Weber (1987), IEEE Journal of Quantum Electronics 23 (11), 1938.
- Beaudou et al. (2008) Beaudou, B., F. Couny, F. Benabid, and P. J. Roberts (2008), in Conference on Lasers and Electro-Optics/Quantum Electronics and Laser Science Conference and Photonic Applications Systems Technologies (Optical Society of America) p. JFC6.
- Beaudou et al. (2010) Beaudou, B., F. Couny, Y. Wang, P. S. Light, N. V. Wheeler, F. Gérôme, and F. Benabid (2010), Optics Express 18 (12), 12381.
- Belardi and Knight (2014) Belardi, W., and J. C. Knight (2014), Optics Letters 39 (7), 1853.
- Belli et al. (2015) Belli, F., A. Abdolvand, W. Chang, J. C. Travers, and P. S. Russell (2015), Optica 2 (4), 292.
- Belli et al. (2016) Belli, F., A. Abdolvand, J. Travers, and P. S. J. Russell (2016), in Europhoton, pp. SS–1.5.
- Belli et al. (2017) Belli, F., A. Abdolvand, J. C. Travers, and P. S. J. Russell (2017), arXiv preprint arXiv:1703.04543 .
- Benabid (2006) Benabid, F. (2006), Philosophical Transactions of the Royal Society A: Mathematical, Physical and Engineering Sciences 364 (1849), 3439 .
- Benabid et al. (2004) Benabid, F., G. Bouwmans, J. C. Knight, P. S. J. Russell, and F. Couny (2004), Physical Review Letters 93 (12), 123903.
- Benabid et al. (2005) Benabid, F., F. Couny, J. C. Knight, T. A. Birks, and P. S. J. Russell (2005), Nature 434 (7032), 488.
- Benabid et al. (2002) Benabid, F., J. C. Knight, G. Antonopoulos, and P. S. J. Russell (2002), Science 298 (5592), 399 .
- Benabid and Roberts (2011) Benabid, F., and P. Roberts (2011), Journal of Modern Optics 58 (2), 87.
- Benabid et al. (2009) Benabid, F., P. Roberts, F. Couny, and P. S. Light (2009), Journal of the European Optical Society-Rapid Publications 4.
- Benoît et al. (2015) Benoît, A., B. Beaudou, M. Alharbi, B. Debord, F. Gérôme, F. Salin, and F. Benabid (2015), Optics Express 23 (11), 14002.
- Beravat et al. (2016) Beravat, R., G. K. Wong, M. H. Frosz, X. M. Xi, and P. S. J. Russell (2016), Science Advances 2 (11), e1601421.
- Berestetskii et al. (1982) Berestetskii, V. B., E. M. Lifshitz, and L. P. Pitaevskii (1982), Quantum Electrodynamics, Vol. 4 (Butterworth-Heinemann).
- Bessonov et al. (2005) Bessonov, A. D., E. E. Serebryannikov, and A. M. Zheltikov (2005), Journal of Experimental and Theoretical Physics 101 (1), 1.
- Bessonov and Zheltikov (2006) Bessonov, A. D., and A. M. Zheltikov (2006), Physical Review E 73 (6), 066618.
- Bethge et al. (2010) Bethge, J., A. Husakou, F. Mitschke, F. Noack, U. Griebner, G. Steinmeyer, and J. Herrmann (2010), Optics Express 18 (6), 6230.
- Bhagwat and Gaeta (2008) Bhagwat, A. R., and A. L. Gaeta (2008), Optics Express 16 (7), 5035.
- Biancalana et al. (2004) Biancalana, F., D. V. Skryabin, and A. V. Yulin (2004), Physical Review E 70 (1), 016615.
- Birks et al. (1995) Birks, T., P. Roberts, P. Russell, D. Atkin, and T. Shepherd (1995), Electronics Letters 31 (22), 1941.
- Birks et al. (1996) Birks, T. a., J. C. Knight, P. S. Russell, and D. M. Atkin (1996), Optics Letters 21 (19), 1547.
- Birks et al. (1997) Birks, T. a., J. C. Knight, and P. S. J. Russell (1997), Optics Letters 22 (13), 961.
- Bise et al. (2002) Bise, R., R. Windeler, K. Kranz, C. Kerbage, B. Eggleton, and D. Trevor (2002), Optical Fiber Communication Conference and Exhibit (908), 10.
- Bjarklev et al. (2003) Bjarklev, A., J. Broeng, and A. S. Bjarklev (2003), Photonic Crystal Fibres (Springer US, Boston, MA).
- Bloembergen (1973) Bloembergen, N. (1973), Optics Communications 8 (4), 285.
- Blue et al. (2016) Blue, R., A. Dudus, and D. Uttamchandani (2016), IEEE Journal of Selected Topics in Quantum Electronics 22 (2), 380.
- Börzsönyi et al. (2008) Börzsönyi, A., Z. Heiner, M. P. Kalashnikov, A. P. Kovács, and K. Osvay (2008), Applied Optics 47 (27), 4856.
- Bozolan et al. (2008) Bozolan, A., C. J. de Matos, C. M. Cordeiro, E. M. Dos Santos, and J. Travers (2008), Optics Express 16 (13), 9671.
- Brabec and Krausz (2000) Brabec, T., and F. Krausz (2000), Reviews of Modern Physics 72 (2), 545.
- Bridges et al. (1982) Bridges, T. J., a. R. Chraplyvy, J. G. Bergman, and R. M. Hart (1982), Optics Letters 7 (11), 566.
- Bromberger et al. (2015) Bromberger, H., A. Ermolov, F. Belli, H. Liu, F. Calegari, M. Chávez-Cervantes, M. T. Li, C. T. Lin, A. Abdolvand, P. S. J. Russell, A. Cavalleri, J. C. Travers, and I. Gierz (2015), Applied Physics Letters 107 (9), 091101.
- Brustlein et al. (2011) Brustlein, S., P. Berto, R. Hostein, P. Ferrand, C. Billaudeau, D. Marguet, A. Muir, J. Knight, and H. Rigneault (2011), Optics Express 19 (13), 12562.
- Brzdąkiewicz et al. (2006) Brzdąkiewicz, K., U. Laudyn, M. Karpierz, T. Woliński, and J. Wójcik (2006), OptoElectronics Review 14 (4), 287.
- Buric et al. (2008) Buric, M. P., K. P. Chen, J. Falk, and S. D. Woodruff (2008), Applied Optics 47 (23), 4255.
- Buric et al. (2009) Buric, M. P., K. P. Chen, J. Falk, and S. D. Woodruff (2009), Applied Optics 48 (22), 4424.
- Butcher and Cotter (1991) Butcher, P. N., and D. Cotter (1991), The Elements of Nonlinear Optics (Cambridge University Press, Cambridge; New York).
- Cassataro et al. (2017) Cassataro, M., D. Novoa, M. C. Günendi, N. N. Edavalath, M. H. Frosz, J. C. Travers, and P. S. Russell (2017), Optics Express 25 (7), 7637.
- Chan et al. (2011) Chan, H.-S., Z.-M. Hsieh, W.-H. Liang, A. Kung, C.-K. Lee, C.-J. Lai, R.-P. Pan, and L.-H. Peng (2011), Science 331 (6021), 1165.
- Chang et al. (2013) Chang, W., P. Hölzer, J. C. Travers, and P. S. J. Russell (2013), Optics Letters 38 (16), 2984.
- Chang et al. (2011) Chang, W., A. Nazarkin, J. C. Travers, J. Nold, P. Hölzer, N. Y. Joly, and P. S. Russell (2011), Optics Express 19 (21), 21018.
- Chen and Kelley (2002) Chen, C.-M., and P. L. Kelley (2002), Journal of the Optical Society of America B 19 (9), 1961.
- Chernikov and Mamyshev (1991) Chernikov, S. V., and P. V. Mamyshev (1991), Journal of the Optical Society of America B 8 (8), 1633.
- Christodoulides and Joseph (1988) Christodoulides, D. N., and R. I. Joseph (1988), Optics Letters 13 (9), 794.
- Christodoulides et al. (2003) Christodoulides, D. N., F. Lederer, and Y. Silberberg (2003), Nature 424 (6950), 817.
- Chu et al. (2016) Chu, W.-C., J. C. Travers, and P. S. J. Russell (2016), New Journal of Physics 18 (2), 023018.
- Clesca et al. (2015) Clesca, B., H. Fevrier, and W. Pelouch (2015), Optics and Photonics News 26 (9), 32.
- Conti et al. (2010) Conti, C., M. A. Schmidt, P. S. J. Russell, and F. Biancalana (2010), Physical Review Letters 105 (26), 263902.
- Corkum (1985) Corkum, P. (1985), IEEE Journal of Quantum Electronics 21 (3), 216.
- Coucheron et al. (2016) Coucheron, D. A., M. Fokine, N. Patil, D. W. Breiby, O. T. Buset, N. Healy, A. C. Peacock, T. Hawkins, M. Jones, J. Ballato, et al. (2016), Nature Communications 7.
- Couny and Benabid (2009) Couny, F., and F. Benabid (2009), Journal of Optics A: Pure and Applied Optics 11 (10), 103002.
- Couny et al. (2006) Couny, F., F. Benabid, and P. S. Light (2006), Optics Letters 31 (24), 3574.
- Couny et al. (2007a) Couny, F., F. Benabid, and P. S. Light (2007a), Physical Review Letters 99 (14), 143903.
- Couny et al. (2007b) Couny, F., F. Benabid, P. J. Roberts, M. T. Burnett, and S. Maier (2007b), Optics Express 15 (2), 325.
- Couny et al. (2007c) Couny, F., F. Benabid, P. J. Roberts, P. S. Light, and M. G. Raymer (2007c), Science 318 (5853), 1118 .
- Couny et al. (2008) Couny, F., P. J. Roberts, T. A. Birks, and F. Benabid (2008), Optics Express 16 (25), 20626.
- Couris et al. (2003) Couris, S., M. Renard, O. Faucher, B. Lavorel, R. Chaux, E. Koudoumas, and X. Michaut (2003), Chemical Physics Letters 369 (3), 318.
- Cox et al. (2006) Cox, F., A. Argyros, and M. Large (2006), Optics Express 14 (9), 4135.
- Cox et al. (2007) Cox, F. M., A. Argyros, M. C. Large, and S. Kalluri (2007), Optics Express 15 (21), 13675.
- Cregan et al. (1999) Cregan, R. F., B. J. Mangan, J. C. Knight, T. A. Birks, P. S. J. Russell, P. J. Roberts, and D. C. Allan (1999), Science 285 (5433), 1537 .
- Da et al. (2010) Da, N., L. Wondraczek, M. A. Schmidt, N. Granzow, and P. S. J. Russell (2010), Journal of Non-Crystalline Solids 356 (35-36), 1829.
- Dadashzadeh et al. (2017) Dadashzadeh, N., M. P. Thirugnanasambandam, H. W. K. Weerasinghe, B. Debord, M. Chafer, F. Gerome, F. Benabid, B. R. Washburn, and K. L. Corwin (2017), Optics Express 25 (12), 13351.
- Dallas and Dasgupta (2004) Dallas, T., and P. K. Dasgupta (2004), TrAC Trends in Analytical Chemistry 23 (5), 385.
- De Silvestri et al. (1985) De Silvestri, S., J. Fujimoto, E. Ippen, E. B. Gamble, L. R. Williams, and K. A. Nelson (1985), Chemical Physics Letters 116 (2-3), 146.
- Debord et al. (2014a) Debord, B., M. Alharbi, A. Benoît, D. Ghosh, M. Dontabactouny, L. Vincetti, J.-M. Blondy, F. Gérôme, and F. Benabid (2014a), Optics Letters 39 (21), 6245.
- Debord et al. (2014b) Debord, B., M. Alharbi, L. Vincetti, A. Husakou, C. Fourcade-Dutin, C. Hoenninger, E. Mottay, F. Gérôme, and F. Benabid (2014b), Optics Express 22 (9), 10735.
- Debord et al. (2015) Debord, B., A. Amsanpally, M. Alharbi, L. Vincetti, J.-M. Blondy, F. Gérôme, and F. Benabid (2015), Journal of Lightwave Technology 33 (17), 3630.
- Debord et al. (2017) Debord, B., A. Amsanpally, M. Chafer, A. Baz, M. Maurel, J. M. Blondy, E. Hugonnot, F. Scol, L. Vincetti, F. Gérôme, and F. Benabid (2017), Optica 4 (2), 209.
- Debord et al. (2016) Debord, B., A. Amsanpally, M. Chafer, A. Baz, L. Vincetti, J.-M. Blondy, F. Gerome, and F. Benabid (2016), in Conference on Lasers and Electro-Optics (Optical Society of America) p. JTh4C.8.
- Debord et al. (2013) Debord, B., R. Jamier, F. Gérôme, O. Leroy, C. Boisse-Laporte, P. Leprince, L. L. Alves, and F. Benabid (2013), Optics Express 21 (21), 25509.
- DeMartini et al. (1967) DeMartini, F., C. H. Townes, T. K. Gustafson, and P. L. Kelley (1967), Physical Review 164 (2), 312.
- Demus et al. (1995) Demus, D., Y. Goto, S. Sawada, E. Nakagawa, H. Saito, and R. Tarao (1995), Molecular Crystals and Liquid Crystals Science and Technology. Section A. Molecular Crystals and Liquid Crystals 260 (1), 1.
- Dianov et al. (1985) Dianov, E. M., A. Y. Karasik, P. V. Mamyshev, A. M. Prokhorov, V. N. Serkin, M. F. Stel’Makh, and A. A. Fomichev (1985), JETP Letters 41 (6), 242.
- Dianov et al. (1986) Dianov, E. M., Z. S. Nikonova, A. M. Prokhorov, and V. N. Serkin (1986), Pisma v Zhurnal Tekhnischeskoi Fiziki 12, 756.
- Dicaire et al. (2010) Dicaire, I., J.-C. Beugnot, and L. Thévenaz (2010), Applied Optics 49 (24), 4604.
- Domachuk et al. (2004) Domachuk, P., H. C. Nguyen, and B. J. Eggleton (2004), IEEE Photonics Technology Letters 16 (8), 1900.
- Drude (1900) Drude, P. (1900), Annalen der Physik 308 (11), 369.
- Du et al. (2004) Du, F., Y.-Q. Lu, and S.-T. Wu (2004), Applied Physics Letters 85 (12), 2181.
- Du et al. (2008) Du, J. B., Y. G. Liu, Z. Wang, B. Zou, B. Liu, and X. Y. Dong (2008), Optics Letters 33 (19), 2215.
- Dudley et al. (2006) Dudley, J. M., G. Genty, and S. Coen (2006), Reviews of Modern Physics 78 (4), 1135.
- Dudley and Taylor (2009) Dudley, J. M., and J. R. Taylor (2009), Nature Photonics 3 (2), 85.
- Duguay et al. (1986) Duguay, M. A., Y. Kokubun, T. L. Koch, and L. Pfeiffer (1986), Applied Physics Letters 49 (1), 13.
- Duncan et al. (1986) Duncan, M. D., R. Mahon, J. Reintjes, and L. L. Tankersley (1986), Optics Letters 11 (12), 803.
- Duncan et al. (1988) Duncan, M. D., R. Mahon, L. Tankersley, and J. Reintjes (1988), Journal of the Optical Society of America B 5 (1), 37.
- Ebbesen et al. (1998) Ebbesen, T., H. J. Lezec, H. F. Ghaemi, T. Thio, P. A.Wolff, T. Thio, and P. A.Wolff (1998), Nature 86 (6), 1114, arXiv:0008204 [cond-mat] .
- Edavalath et al. (2017) Edavalath, N. N., M. C. Günendi, R. Beravat, G. K. L. Wong, M. H. Frosz, J.-M. Ménard, and P. S. Russell (2017), Optics Letters 42 (11), 2074.
- Eftekhari et al. (2011) Eftekhari, F., J. Irizar, L. Hulbert, and A. S. Helmy (2011), Journal of Applied Physics 109 (11), 113104.
- Eggleton et al. (2005) Eggleton, B., P. Domachuk, C. Grillet, E. Mägi, H. Nguyen, P. Steinvurzel, and M. Steel (2005), Progress in optics 48, 1.
- Eggleton (2010) Eggleton, B. J. (2010), Optics Express 18 (25), 26632.
- Eggleton et al. (2011) Eggleton, B. J., B. Luther-Davies, and K. Richardson (2011), Nature Photonics 5 (3), 141.
- Emaury et al. (2015) Emaury, F., A. Diebold, C. J. Saraceno, and U. Keller (2015), Optica 2 (11), 980.
- Emaury et al. (2013) Emaury, F., C. F. Dutin, C. J. Saraceno, M. Trant, O. H. Heckl, Y. Y. Wang, C. Schriber, F. Gerome, T. Südmeyer, F. Benabid, et al. (2013), Optics express 21 (4), 4986.
- Emaury et al. (2014) Emaury, F., C. J. Saraceno, B. Debord, D. Ghosh, A. Diebold, F. Gèrôme, T. Südmeyer, F. Benabid, and U. Keller (2014), Optics Letters 39 (24), 6843.
- Epple et al. (2014) Epple, G., K. S. Kleinbach, T. G. Euser, N. Y. Joly, T. Pfau, P. S. J. Russell, and R. Löw (2014), Nature Communications 5 (May), 4132, arXiv:1402.2195 .
- Erkintalo et al. (2012) Erkintalo, M., Y. Q. Xu, S. G. Murdoch, J. M. Dudley, and G. Genty (2012), Physical Review Letters 109 (22), 223904.
- Ermolov et al. (2015) Ermolov, A., K. F. Mak, M. H. Frosz, J. C. Travers, and P. S. J. Russell (2015), Physical Review A 92 (3), 033821.
- Ermolov et al. (2013) Ermolov, A., K. F. Mak, F. Tani, P. Hölzer, J. C. Travers, and P. S. J. Russell (2013), Applied Physics Letters 103 (26), 261115.
- Ermolov et al. (2016) Ermolov, A., H. Valtna-Lukner, J. Travers, and P. S. Russell (2016), Optics Letters 41 (23), 5535.
- Etchegoin et al. (2006) Etchegoin, P. G., E. C. Le Ru, and M. Meyer (2006), The Journal of Chemical Physics 125 (16), 164705.
- Etchepare et al. (1985) Etchepare, J., G. Grillon, I. Thomazeau, A. Migus, and A. Antonetti (1985), Journal of the Optical Society of America B 2 (4), 649.
- Fan et al. (2014) Fan, G., T. Balciunas, S. Haessler, C. Fourcade-Dutin, T. Witting, A. Voronin, A. Zheltikov, F. Gerome, G. Paulus, A. Baltuska, and F. Benabid (2014) (OSA) p. AF4A.7.
- Fedotov et al. (2004) Fedotov, A., S. Konorov, V. Mitrokhin, E. Serebryannikov, and A. Zheltikov (2004), Physical Review A 70 (4), 045802.
- Fedotov et al. (2007) Fedotov, A. B., E. E. Serebryannikov, and A. M. Zheltikov (2007), Physical Review A 76 (5), 053811.
- Fedotov et al. (2006) Fedotov, I. V., A. B. Fedotov, and A. M. Zheltikov (2006), Optics Letters 31 (17), 2604.
- Février et al. (2010) Février, S., B. Beaudou, and P. Viale (2010), Optics Express 18 (5), 5142.
- Fibich and Gaeta (2000) Fibich, G., and A. L. Gaeta (2000), Optics Letters 25 (5), 335.
- Finger et al. (2015) Finger, M. A., T. S. Iskhakov, N. Y. Joly, M. V. Chekhova, and P. S. J. Russell (2015), Physical Review Letters 115 (14), 143602.
- Finger et al. (2017) Finger, M. A., N. Y. Joly, P. S. J. Russell, and M. V. Chekhova (2017), Physical Review A 95, 053814.
- Finger et al. (2014) Finger, M. A., N. Y. Joly, T. Weiss, and P. S. Russell (2014), Optics Letters 39 (4), 821.
- Fini (2004) Fini, J. M. (2004), Measurement Science and Technology 15 (6), 1120.
- Fink et al. (1999) Fink, Y., D. J. Ripin, S. Fan, C. Chen, J. D. Joannopoulos, and E. L. Thomas (1999), Journal of Lightwave Technology 17 (11), 2039.
- Fisher et al. (1969) Fisher, R. A., P. L. Kelley, and T. K. Gustafson (1969), Applied Physics Letters 14 (4), 140.
- Friberg et al. (1987) Friberg, S. R., Y. Silberberg, M. K. Oliver, M. J. Andrejco, M. A. Saifi, and P. W. Smith (1987), Applied Physics Letters 51 (15), 1135.
- Friberg et al. (1988) Friberg, S. R., A. M. Weiner, Y. Silberberg, B. G. Sfez, and P. S. Smith (1988), Optics Letters 13 (10), 904.
- Fu et al. (2005) Fu, L., X. Gan, and M. Gu (2005), Optics Express 13 (14), 5528.
- Fuerbach et al. (2005a) Fuerbach, A., P. Steinvurzel, J. A. Bolger, and B. J. Eggleton (2005a), Optics Express 13 (8), 2977.
- Fuerbach et al. (2005b) Fuerbach, A., P. Steinvurzel, J. A. Bolger, A. Nulsen, and B. J. Eggleton (2005b), Optics Letters 30 (8), 830.
- Gao et al. (2013) Gao, R., Y. Jiang, and S. Abdelaziz (2013), Optics Letters 38 (9), 1539.
- Gao et al. (2017) Gao, S.-F., Y. ying Wang, X. lu Liu, C. Hong, S. Gu, and P. Wang (2017), Optics Letters 42 (1), 61.
- Gao et al. (2016) Gao, S.-F., Y.-Y. Wang, X.-L. Liu, W. Ding, and P. Wang (2016), Optics Express 24 (13), 14801.
- Gebert et al. (2014) Gebert, F., M. H. Frosz, T. Weiss, Y. Wan, A. Ermolov, N. Y. Joly, P. O. Schmidt, and P. S. J. Russell (2014), Optics Express 22 (13), 15388.
- Gebhardt et al. (2015) Gebhardt, M., C. Gaida, S. Hädrich, F. Stutzki, C. Jauregui, J. Limpert, and A. Tünnermann (2015), Optics Letters 40 (12), 2770.
- Geissler et al. (1999) Geissler, M., G. Tempea, A. Scrinzi, M. Schnürer, F. Krausz, and T. Brabec (1999), Physical Review Letters 83 (15), 2930.
- Gérôme et al. (2007) Gérôme, F., K. Cook, A. K. George, W. J. Wadsworth, and J. C. Knight (2007), Optics Express 15 (12), 7126.
- Gérôme et al. (2008) Gérôme, F., P. Dupriez, J. Clowes, J. C. Knight, and W. J. Wadsworth (2008), Optics Express 16 (4), 2381.
- Ghenuche et al. (2012) Ghenuche, P., S. Rammler, N. Y. Joly, M. Scharrer, M. Frosz, J. Wenger, P. S. J. Russell, and H. Rigneault (2012), Optics Letters 37 (21), 4371.
- Ghosh et al. (2006) Ghosh, S., A. R. Bhagwat, C. K. Renshaw, S. Goh, A. L. Gaeta, and B. J. Kirby (2006), Physical Review Letters 97 (2), 023603.
- Golovchenko et al. (1985) Golovchenko, E. A., E. M. Dianov, A. M. Prokhorov, and V. N. Serkin (1985), Soviet Journal of Experimental and Theoretical Physics Letters 42, 87.
- Gordon (1986) Gordon, J. P. (1986), Optics Letters 11 (10), 662.
- Granzow et al. (2011) Granzow, N., P. Uebel, M. A. Schmidt, A. S. Tverjanovich, L. Wondraczek, and P. S. J. Russell (2011), Optics Letters 36 (13), 2432.
- Guichard et al. (2015) Guichard, F., A. Giree, Y. Zaouter, M. Hanna, G. Machinet, B. Debord, F. Gérôme, P. Dupriez, F. Druon, C. Hönninger, E. Mottay, F. Benabid, and P. Georges (2015), Optics Express 23 (6), 7416.
- Haakestad et al. (2005) Haakestad, M. W., T. T. Alkeskjold, M. D. Nielsen, L. Scolari, J. Riishede, H. E. Engan, and A. Bjarklev (2005), IEEE Photonics Technology Letters 17 (4), 819.
- Habib et al. (2017a) Habib, M., C. Markos, O. Bang, M. Bache, et al. (2017a), arXiv preprint arXiv:1702.00267 .
- Habib et al. (2015) Habib, M. S., O. Bang, and M. Bache (2015), Optics Express 23 (13), 17394.
- Habib et al. (2017b) Habib, M. S., C. Markos, O. Bang, and M. Bache (2017b), Optics Letters 42 (11), 2232.
- Hädrich et al. (2015) Hädrich, S., M. Krebs, A. Hoffmann, A. Klenke, J. Rothhardt, J. Limpert, and A. Tünnermann (2015), Light: Science & Applications 4 (8), e320.
- Hädrich et al. (2016) Hädrich, S., J. Rothhardt, S. Demmler, M. Tschernajew, A. Hoffmann, M. Krebs, A. Liem, O. de Vries, M. Plötner, S. Fabian, T. Schreiber, J. Limpert, and A. Tünnermann (2016), Applied Optics 55 (7), 1636.
- Haller (1975) Haller, I. (1975), Progress in Solid State Chemistry 10, 103.
- Hanf et al. (2014) Hanf, S., T. Bögözi, R. Keiner, T. Frosch, and J. Popp (2014), Analytical Chemistry 87 (2), 982.
- Harris and Sokolov (1997) Harris, S., and A. Sokolov (1997), Physical Review A 55 (6), R4019.
- Harris and Sokolov (1998) Harris, S., and A. Sokolov (1998), Physical Review Letters 81 (14), 2894.
- Hasan et al. (2016) Hasan, M. I., N. Akhmediev, and W. Chang (2016), Optics Letters 41 (21), 5122.
- Hasegawa and Brinkman (1980) Hasegawa, A., and W. Brinkman (1980), IEEE Journal of Quantum Electronics 16 (7), 694.
- Hasegawa and Tappert (1973) Hasegawa, A., and F. Tappert (1973), Applied Physics Letters 23 (3), 142.
- Hayes et al. (2017) Hayes, J. R., S. R. Sandoghchi, T. D. Bradley, Z. Liu, R. Slavík, M. A. Gouveia, N. V. Wheeler, G. Jasion, Y. Chen, E. N. Fokoua, M. N. Petrovich, D. J. Richardson, and F. Poletti (2017), Journal Lightwave Technology 35 (3), 437.
- He and Prasad (1990) He, G. S., and P. N. Prasad (1990), Physical Review A 41 (5), 2687.
- He et al. (2012) He, R., P. J. a. Sazio, A. C. Peacock, N. Healy, J. R. Sparks, M. Krishnamurthi, V. Gopalan, and J. V. Badding (2012), Nature Photonics 6 (3), 174.
- Heckl et al. (2009) Heckl, O. H., C. R. E. Baer, C. Kränkel, S. V. Marchese, F. Schapper, M. Holler, T. Südmeyer, J. S. Robinson, J. W. G. Tisch, F. Couny, P. Light, F. Benabid, and U. Keller (2009), Applied Physics B 97 (2), 369.
- Heckl et al. (2011) Heckl, O. H., C. J. Saraceno, C. R. E. Baer, T. Südmeyer, Y. Y. Wang, Y. Cheng, F. Benabid, and U. Keller (2011), Optics Express 19 (20), 19142.
- Hellwarth et al. (1971) Hellwarth, R. W., A. Owyoung, and N. George (1971), Physical Review A , 5.
- Henningsen and Hald (2008) Henningsen, J., and J. Hald (2008), Applied Optics 47 (15), 2790.
- Hensley et al. (2007) Hensley, C. J., D. G. Ouzounov, A. L. Gaeta, N. Venkataraman, M. T. Gallagher, and K. W. Koch (2007), Optics Express 15 (6), 3507.
- Ho and Alfano (1979) Ho, P. P., and R. R. Alfano (1979), Physical Review A 20 (5), 2170.
- Holtz et al. (1999) Holtz, M., P. K. Dasgupta, and G. Zhang (1999), Analytical Chemistry 71 (14), 2934.
- Hölzer et al. (2011) Hölzer, P., W. Chang, J. C. Travers, A. Nazarkin, J. Nold, N. Y. Joly, M. F. Saleh, F. Biancalana, and P. S. J. Russell (2011), Physical Review Letters 107 (20), 203901.
- Hosseini et al. (2016) Hosseini, P., A. Abdolvand, and P. S. Russell (2016), Optics Letters 41 (23), 5543.
- Humbert et al. (2004) Humbert, G., J. C. Knight, G. Bouwmans, P. S. J. Russell, D. P. Williams, P. J. Roberts, and B. J. Mangan (2004), Optics Express 12 (8), 1477.
- Hupfer et al. (2016) Hupfer, R., B. Trabold, A. Abdolvand, and P. S. J. Russell (2016), Frontiers in Optics , JW2A.135.
- Icsevgi and Lamb Jr (1969) Icsevgi, A., and W. Lamb Jr (1969), Physical Review 185 (2), 517.
- Iino et al. (2015) Iino, H., T. Usui, and J.-I. Hanna (2015), Nature Communications 6, 6828.
- Im (2015) Im, S.-J. (2015), Laser Physics 25 (3), 035404.
- Im et al. (2009) Im, S.-J., A. Husakou, and J. Herrmann (2009), Optics Express 17 (15), 13050.
- Im et al. (2010a) Im, S.-J., A. Husakou, and J. Herrmann (2010a), Optics Express 18 (6), 5367.
- Im et al. (2010b) Im, S.-J., A. Husakou, and J. Herrmann (2010b), Physical Review A 82 (2), 025801.
- Imasaka et al. (1989) Imasaka, T., S. Kawasaki, and N. Ishibashi (1989), Applied Physics B 49 (4), 389.
- Ippen (1970) Ippen, E. P. (1970), Applied Physics Letters 16, 303.
- Ippen et al. (1974) Ippen, E. P., C. V. Shank, and T. K. Gustafson (1974), Applied Physics Letters 24 (4), 190.
- Itoh et al. (2004) Itoh, K., Y. Toda, R. Morita, and M. Yamashita (2004), Japanese Journal of Applied Physics 43 (No. 9A), 6448.
- Ivanov et al. (2006) Ivanov, A. A., A. A. Podshivalov, and A. M. Zheltikov (2006), Optics Letters 31 (22), 3318.
- Jalali and Fathpour (2006) Jalali, B., and S. Fathpour (2006), Journal of lightwave technology 24 (12), 4600.
- Jaworski et al. (2015) Jaworski, P., F. Yu, R. M. Carter, J. C. Knight, J. D. Shephard, and D. P. Hand (2015), Optics Express 23 (7), 8498.
- Jensen (1982) Jensen, S. M. (1982), IEEE Transactions on Microwave Theory and Techniques 30 (10), 1568.
- Joannopoulos et al. (1997) Joannopoulos, J. D., P. R. Villeneuve, and S. Fan (1997), Nature 386 (6621), 143.
- John (1987) John, S. (1987), Physical Review Letters 58 (23), 2486.
- Johnson and Christy (1972) Johnson, P. B., and R. W. Christy (1972), Physical Review B 6 (12), 4370, arXiv:arXiv:1011.1669v3 .
- Joly et al. (2011a) Joly, N. Y., P. Hölzer, J. Nold, W. Chang, J. C. Travers, M. Labat, M.-E. Couprie, and P. S. J. Russell (2011a), in Proceedings of the 33rd FEL Conference (Shanghai).
- Joly et al. (2011b) Joly, N. Y., J. Nold, W. Chang, P. Hölzer, A. Nazarkin, G. K. L. Wong, F. Biancalana, and P. S. J. Russell (2011b), Physical Review Letters 106 (20), 203901.
- Jones et al. (2011) Jones, A. M., A. V. V. Nampoothiri, A. Ratanavis, T. Fiedler, N. V. Wheeler, F. Couny, R. Kadel, F. Benabid, B. R. Washburn, K. L. Corwin, and W. Rudolph (2011), Optics Express 19 (3), 2309.
- Kaczmarek et al. (2015) Kaczmarek, K. T., D. J. Saunders, M. R. Sprague, W. S. Kolthammer, A. Feizpour, P. M. Ledingham, B. Brecht, E. Poem, I. A. Walmsley, and J. Nunn (2015), Optics Letters 40 (23), 5582, arXiv:1509.04972 .
- Kaiser and Astle (1974) Kaiser, P., and H. W. Astle (1974), Bell System Technical Journal 53 (6), 1021.
- Kajzar and Messier (1985) Kajzar, F., and J. Messier (1985), Physical Review A 32 (4), 2352.
- Kao and Hockham (1966) Kao, K., and G. Hockham (1966), Proceedings of the Institution of Electrical Engineers 113 (7), 1151.
- Kapron et al. (1970) Kapron, F. P., D. B. Keck, and R. D. Maurer (1970), Applied Physics Letters 17 (10), 423.
- Karpman (1993) Karpman, V. I. (1993), Physical Review E 47 (3), 2073.
- Katsuragawa et al. (2010) Katsuragawa, M., K. R. Pandiri, K. Shiraga, H. Aoki, F. Benabid, F. Couny, and Y. Wang (2010), in Conference on Lasers and Electro-Optics (Optical Society of America) p. CTuT6.
- Keldysh (1965) Keldysh, L. V. (1965), Soviet Journal of Experimental and Theoretical Physics 20 (5), 1307.
- Kerbage and Eggleton (2004) Kerbage, C., and B. Eggleton (2004), Optical Fiber Technology 10 (2), 133.
- Kerbage et al. (2002) Kerbage, C., R. Windeler, B. Eggleton, P. Mach, M. Dolinski, and J. Rogers (2002), Optics Communications 204 (1), 179.
- Kim et al. (2015) Kim, A. V., A. G. Litvak, V. A. Mironov, and S. A. Skobelev (2015), Physical Review A 92 (3), 033856.
- Knight (2003) Knight, J. C. (2003), Nature 424 (6950), 847.
- Knight et al. (1998a) Knight, J. C., T. A. Birks, R. F. Cregan, P. S. J. Russell, and P. D. de Sandro (1998a), Electronics Letters 34 (13), 1347.
- Knight et al. (1998b) Knight, J. C., J. Broeng, T. A. Birks, and P. S. J. Russell (1998b), Science 282 (5393), 1476.
- Kodama and Hasegawa (1987) Kodama, Y., and A. Hasegawa (1987), IEEE Journal of Quantum Electronics 23 (5), 510.
- Konidakis et al. (2014a) Konidakis, I., M. Androulidaki, G. Zito, and S. Pissadakis (2014a), Thin Solid Films 555, 76 .
- Konidakis et al. (2015) Konidakis, I., M. Konstantaki, G. D. Tsibidis, and S. Pissadakis (2015), Optics Express 23 (24), 31496.
- Konidakis and Pissadakis (2014) Konidakis, I., and S. Pissadakis (2014), Materials 7 (8), 5735.
- Konidakis et al. (2014b) Konidakis, I., G. Zito, and S. Pissadakis (2014b), Optics Letters 39 (12), 3374.
- Konorov et al. (2006) Konorov, S. O., C. J. Addison, H. G. Schulze, R. F. B. Turner, and M. W. Blades (2006), Optics Letters 31 (12), 1911.
- Konorov et al. (2003a) Konorov, S. O., A. B. Fedotov, O. A. Kolevatova, V. I. Beloglazov, N. B. Skibina, A. V. Shcherbakov, E. Wintner, and A. M. Zheltikov (2003a), Journal of Physics D: Applied Physics 36 (12), 1375.
- Konorov et al. (2003b) Konorov, S. O., A. B. Fedotov, and A. M. Zheltikov (2003b), Optics Letters 28 (16), 1448.
- Konorov et al. (2005a) Konorov, S. O., A. B. Fedotov, A. M. Zheltikov, and R. B. Miles (2005a), Journal of the Optical Society of America B 22 (9), 2049.
- Konorov et al. (2004a) Konorov, S. O., E. E. Serebryannikov, D. A. Akimov, A. A. Ivanov, M. V. Alfimov, and A. M. Zheltikov (2004a), Physical Review E 70 (6), 066625.
- Konorov et al. (2005b) Konorov, S. O., E. E. Serebryannikov, A. B. Fedotov, R. B. Miles, and A. M. Zheltikov (2005b), Physical Review E 71 (5), 057603.
- Konorov et al. (2005c) Konorov, S. O., E. E. Serebryannikov, A. A. Ivanov, D. A. Akimov, M. V. Alfimov, M. Scalora, and A. M. Zheltikov (2005c), Journal of Experimental and Theoretical Physics Letters 81 (2), 58.
- Konorov et al. (2004b) Konorov, S. O., D. A. Sidorov-Biryukov, A. M. Zheltikov, I. Bugar, D. C. Jr, D. Chorvat, V. I. Beloglazov, N. B. Skibina, M. J. Bloemer, and M. Scalora (2004b), Applied Physics Letters 85 (17), 3690.
- Konorov et al. (2004c) Konorov, S. O., A. M. Zheltikov, P. Zhou, A. P. Tarasevitch, and D. von der Linde (2004c), Optics Letters 29 (13), 1521.
- Korn et al. (1998) Korn, G., O. Dühr, and A. Nazarkin (1998), Physical Review Letters 81 (6), 1215.
- Köttig et al. (2017a) Köttig, F., D. Novoa, F. Tani, M. Cassataro, J. Travers, and P. S. J. Russell (2017a), arXiv preprint arXiv:1701.04843 .
- Köttig et al. (2017b) Köttig, F., F. Tani, J. Travers, and P. S. J. Russell (2017b), arXiv preprint arXiv:1705.08465 .
- Köttig et al. (2017c) Köttig, F., F. Tani, J. Travers, and P. S. J. Russell (2017c), arXiv preprint arXiv:1702.02457 .
- Köttig et al. (2015) Köttig, F., F. Tani, P. Uebel, P. S. J. Russell, and J. C. Travers (2015), in 2015 European Conference on Lasers and Electro-Optics - European Quantum Electronics Conference (Optical Society of America) p. PD_A_7.
- Krausz and Ivanov (2009) Krausz, F., and M. Ivanov (2009), Reviews of Modern Physics 81 (1), 163.
- Kretschmann and Raether (1968) Kretschmann, E., and H. Raether (1968), “Radiative Decay of Non Radiative Surface Plasmons Excited by Light,” arXiv:arXiv:1011.1669v3 .
- Kudlinski et al. (2006) Kudlinski, a., a. K. George, J. C. Knight, J. Travers, a.B. Rulkov, S. V. Popov, and J. Taylor (2006), Optics Express 14 (12), 5715.
- Kuehl (1988) Kuehl, H. H. (1988), Journal of the Optical Society of America B 5 (3), 709.
- Kuhlmey et al. (2009a) Kuhlmey, B. T., S. Coen, and S. Mahmoodian (2009a), Optics Express 17 (18), 16306.
- Kuhlmey et al. (2009b) Kuhlmey, B. T., B. J. Eggleton, and D. K. Wu (2009b), Journal of Lightwave Technology 27 (11), 1617.
- Lægsgaard and Roberts (2008) Lægsgaard, J., and P. J. Roberts (2008), Optics Express 16 (13), 9628.
- Lægsgaard and Roberts (2009) Lægsgaard, J., and P. J. Roberts (2009), Optics Letters 34 (23), 3710.
- Larsen et al. (2003) Larsen, T., A. Bjarklev, D. Hermann, and J. Broeng (2003), Optics Express 11 (20), 2589.
- Le Blanc et al. (1993) Le Blanc, S. P., R. Sauerbrey, S. C. Rae, and K. Burnett (1993), Journal of the Optical Society of America B 10 (10), 1801.
- Lee et al. (2010) Lee, C.-H., C.-H. Chen, C.-L. Kao, C.-P. Yu, S.-M. Yeh, W.-H. Cheng, and T.-H. Lin (2010), Optics Express 18 (3), 2814.
- Lee et al. (2013) Lee, C.-H., C.-W. Wu, C.-W. Chen, H.-C. Jau, and T.-H. Lin (2013), Applied Optics 52 (20), 4849.
- Lee (2012) Lee, H. W. (2012), Plasmonic Photonic Crystal Fiber, Phd thesis (Universitat Erlangen-Nurnberg).
- Lee et al. (2012) Lee, H. W., M. a. Schmidt, and P. S. J. Russell (2012), Optics Letters 37 (14), 2946.
- Lee et al. (2011) Lee, H. W., M. a. Schmidt, R. F. Russell, N. Y. Joly, H. K. Tyagi, P. Uebel, and P. S. J. Russell (2011), Optics Express 19 (13), 12180.
- Lee et al. (2008) Lee, H. W., M. A. Schmidt, H. K. Tyagi, L. P. Sempere, and P. S. J. Russell (2008), Applied Physics Letters 93 (11), 10.1063/1.2982083.
- Lehmeier et al. (1985) Lehmeier, H., W. Leupacher, and A. Penzkofer (1985), Optics Communications 56 (1), 67.
- Lemmon et al. (2013) Lemmon, E., M. Huber, and M. McLinden (2013), “NIST Standard Reference Database 23: Reference Fluid Thermodynamic and Transport Properties-REFPROP,” .
- Lesiak et al. (2007) Lesiak, P., T. Woliński, K. Brzdąkiewicz, K. Nowecka, S. Ertman, M. Karpierz, A. Domański, and R. Dąbrowski (2007), Opto-Electronics Review 15 (1), 10.2478/s11772-006-0051-8.
- Levi et al. (1994) Levi, D., C. R. Menyuk, and P. Winternitz (1994), Self-similarity in stimulated Raman scattering, Vol. 1 (Les Publications CRM, Montreal).
- Levine et al. (1975) Levine, B. F., B. F. Levine, C. G. Bethea, and C. G. Bethea (1975), The Journal of Chemical Physics 63 (6), 2666.
- Li et al. (2004a) Li, J., S. Gauza, and S.-T. Wu (2004a), Journal of Applied Physics 96 (1), 19.
- Li et al. (2004b) Li, J., S. Gauzia, and S.-T. Wu (2004b), Optics Express 12 (9), 2002.
- Li et al. (2016) Li, K., T. Zhang, N. Zhang, M. Zhang, J. Zhang, T. Wu, S. Ma, J. Wu, M. Chen, Y. He, and L. Wei (2016), Frontiers of Optoelectronics 10.1007/s12200-016-0558-7.
- Limpert et al. (2003) Limpert, J., T. Schreiber, S. Nolte, H. Zellmer, and A. Tünnermann (2003), Optics Express 11 (24), 3332.
- Liou et al. (2011) Liou, J.-h., T.-h. Chang, T. Lin, and C.-p. Yu (2011), Optics Εxpress 19 (7), 6756.
- Litchinitser et al. (2002) Litchinitser, N. M., a. K. Abeeluck, C. Headley, and B. J. Eggleton (2002), Optics Letters 27 (18), 1592.
- Litchinitser et al. (2004) Litchinitser, N. M., S. C. Dunn, P. E. Steinvurzel, B. J. Eggleton, T. P. White, R. C. McPhedran, and C. M. de Sterke (2004), Optics Express 12 (8), 1540.
- Liu et al. (2014) Liu, Y., Y. Wang, B. Sun, C. Liao, J. Song, K. Yang, G. Wang, Q. Wang, G. Yin, and J. Zhou (2014), Optics Letters 39 (7), 2148.
- Long (2002) Long, D. (2002), The Raman Efiect: A Unified Treatment of the Theory of Raman Scattering by Molecules (Wiley).
- Luan et al. (2004) Luan, F., J. C. Knight, P. S. J. Russell, S. Campbell, D. Xiao, D. T. Reid, B. J. Mangan, D. P. Williams, and P. J. Roberts (2004), Optics Express 12 (5), 835.
- Lynch-Klarup et al. (2013) Lynch-Klarup, K. E., E. D. Mondloch, M. G. Raymer, D. Arrestier, F. Gerome, and F. Benabid (2013), Optics Express 21 (11), 13726.
- Mach et al. (2002) Mach, P., M. Dolinski, K. Baldwin, J. Rogers, C. Kerbage, R. Windeler, and B. Eggleton (2002), Applied Physics Letters 80 (23), 4294.
- Mahmood et al. (2015) Mahmood, A., V. Kavungal, S. S. Ahmed, G. Farrell, and Y. Semenova (2015), Optics Letters 40 (21), 4983.
- Maier et al. (1969) Maier, M., W. Kaiser, and J. Giordmaine (1969), Physical Review 177 (2), 580.
- Maier (2007) Maier, S. A. (2007), Plasmonics: Fundamentals and Applications (Springer US, Boston, MA).
- Mak et al. (2015) Mak, K. F., M. Seidel, O. Pronin, M. H. Frosz, A. Abdolvand, V. Pervak, A. Apolonski, F. Krausz, J. C. Travers, and P. S. J. Russell (2015), Optics Letters 40 (7), 1238.
- Mak et al. (2013a) Mak, K. F., J. C. Travers, P. Hölzer, N. Y. Joly, and P. S. J. Russell (2013a), Optics Express 21 (9), 10942.
- Mak et al. (2013b) Mak, K. F., J. C. Travers, N. Y. Joly, A. Abdolvand, and P. S. J. Russell (2013b), Optics Letters 38 (18), 3592.
- Malitson (1965) Malitson, I. H. (1965), Journal of the Optical Society of America 55 (10), 1205.
- Mansour et al. (2006) Mansour, B. F., H. Anis, D. Zeidler, P. B. Corkum, and D. M. Villeneuve (2006), Optics Letters 31 (21), 3185.
- Marcatili and Schmeltzer (1964a) Marcatili, E., and R. Schmeltzer (1964a), Bell System Technical Journal 43, 1783.
- Marcatili and Schmeltzer (1964b) Marcatili, E. A. J., and R. A. Schmeltzer (1964b), Bell System Technical Journal 43 (4), 1783.
- Markos (2016) Markos, C. (2016), Scientific Reports 6.
- Markos et al. (2013) Markos, C., G. Antonopoulos, and G. Kakarantzas (2013), IEEE Photonics Technology Letters 25 (20), 2003.
- Markos et al. (2014) Markos, C., I. Kubat, and O. Bang (2014), Scientific Reports 4, 6057.
- Markos et al. (2015) Markos, C., A. Stefani, and O. Bang (2015), in International Conference on Optical Fibre Sensors (OFS24) (International Society for Optics and Photonics) pp. 96343G–96343G.
- Markos et al. (2010) Markos, C., K. Vlachos, and G. Kakarantzas (2010), Optics Express 18 (23), 24344.
- Markos et al. (2011) Markos, C., K. Vlachos, and G. Kakarantzas (2011), in SPIE LASE (International Society for Optics and Photonics) pp. 791427–791427.
- Markos et al. (2012a) Markos, C., K. Vlachos, and G. Kakarantzas (2012a), Optical Materials Express 2 (7), 929.
- Markos et al. (2012b) Markos, C., S. N. Yannopoulos, and K. Vlachos (2012b), Optics Express 20 (14), 14814.
- Mathews et al. (2011) Mathews, S., G. Farrell, and Y. Semenova (2011), Applied Οptics 50 (17), 2628.
- de Matos et al. (2003) de Matos, C., J. Taylor, T. Hansen, K. Hansen, and J. Broeng (2003), Optics Express 11 (22), 2832.
- de Matos et al. (2004) de Matos, C. J. S., S. V. Popov, A. B. Rulkov, J. R. Taylor, J. Broeng, T. P. Hansen, and V. P. Gapontsev (2004), Physical Review Letters 93 (10), 103901.
- May and Li (1996) May, J., and Y.-S. Li (1996), Applied Optics 35 (15), 2527.
- Mcmorrow et al. (1988) Mcmorrow, D., W. T. Lotshaw, and G. a. Kenney-Wallace (1988), IEEE Journal of Quantum Electronics 24 (2), 443.
- Ménard et al. (2016) Ménard, J.-M., F. Köttig, and P. S. J. Russell (2016), Optics Letters 41 (16), 3795.
- Ménard and St.J. Russell (2015) Ménard, J.-M., and P. St.J. Russell (2015), Optics Letters 40 (15), 3679.
- Meng et al. (2017) Meng, F., S. Gao, Y. Wang, P. Wang, J. Liu, S. Wang, B. Liu, Y. Li, C. Wang, and M. lie Hu (2017), in Conference on Lasers and Electro-Optics (Optical Society of America) p. STu3K.4.
- Menyuk (1993) Menyuk, C. (1993), Physical Review A 47 (3), 2235.
- Menyuk and Hilfer (1989) Menyuk, C. R., and G. Hilfer (1989), Optics Letters 14 (4), 227.
- Menyuk et al. (1992) Menyuk, C. R., D. Levi, and P. Winternitz (1992), Physical Review Letters 69 (21), 3048.
- Michieletto et al. (2016) Michieletto, M., J. K. Lyngsø, C. Jakobsen, J. Lægsgaard, O. Bang, and T. T. Alkeskjold (2016), Optics Express 24 (7), 7103.
- Millot et al. (2015) Millot, G., S. Pitois, M. Yan, T. Hovhannisyan, A. Bendahmane, T. W. Hänsch, and N. Picqué (2015), Nature Photonics .
- Milosevic et al. (2000) Milosevic, N., G. Tempea, and T. Brabec (2000), Optics Letters 25 (9), 672.
- Misoguti et al. (2001) Misoguti, L., S. Backus, C. G. Durfee, R. Bartels, M. M. Murnane, and H. C. Kapteyn (2001), Physical Review Letters 87 (1), 013601.
- Mitschke and Mollenauer (1986) Mitschke, F. M., and L. F. Mollenauer (1986), Optics Letters 11 (10), 659.
- Mollenauer et al. (1980) Mollenauer, L. F., R. H. Stolen, and J. P. Gordon (1980), Physical Review Letters 45 (13), 1095.
- Mollenauer et al. (1983) Mollenauer, L. F., R. H. Stolen, J. P. Gordon, and W. J. Tomlinson (1983), Optics Letters 8 (5), 289.
- Monro et al. (2001) Monro, T. M., W. Belardi, K. Furusawa, J. C. Baggett, N. Broderick, and D. Richardson (2001), Measurement Science and Technology 12 (7), 854.
- Monro et al. (1999) Monro, T. M., D. Richardson, and P. Bennett (1999), Electronics Letters 35 (14), 1188.
- Mosley et al. (2010) Mosley, P. J., W. C. Huang, M. G. Welch, B. J. Mangan, W. J. Wadsworth, and J. C. Knight (2010), Optics Letters 35 (21), 3589.
- Motz et al. (2004) Motz, J. T., M. Hunter, L. H. Galindo, J. A. Gardecki, J. R. Kramer, R. R. Dasari, and M. S. Feld (2004), Applied Optics 43 (3), 542.
- Mousavi et al. (2017) Mousavi, S. A., H. C. H. Mulvad, N. Wheeler, P. Horak, T. D. Bradley, S.-u. Alam, J. Hayes, S. R. Sandoghchi, D. Richardson, and F. Poletti (2017), in Proc. of SPIE Vol, Vol. 10088, pp. 100880G–1.
- Murari et al. (2016) Murari, K., G. J. Stein, H. Cankaya, B. Debord, F. Gérôme, G. Cirmi, O. D. Mücke, P. Li, A. Ruehl, I. Hartl, K.-H. Hong, F. Benabid, and F. X. Kärtner (2016), Optica 3 (8), 816.
- Myaing et al. (2003) Myaing, M., J. Ye, T. Norris, T. Thomas, J. Baker Jr, W. Wadsworth, G. Bouwmans, J. Knight, and P. S. J. Russell (2003), Optics Letters 28 (14), 1224.
- Nagasaki et al. (2011) Nagasaki, A., K. Saitoh, and M. Koshiba (2011), Optics Express 19 (4), 3799.
- Nakatsuka et al. (1981) Nakatsuka, H., D. Grischkowsky, and A. C. Balant (1981), Physical Review Letters 47 (13), 910.
- Nampoothiri et al. (2015) Nampoothiri, A. V. V., B. Debord, M. Alharbi, F. Gérôme, F. Benabid, and W. Rudolph (2015), Optics Letters 40 (4), 605.
- Nazarkin et al. (2010) Nazarkin, A., A. Abdolvand, A. Chugreev, and P. S. J. Russell (2010), Physical Review Letters 105 (17), 173902.
- Nazarkin et al. (2009) Nazarkin, A., A. Abdolvand, and P. S. J. Russell (2009), Physical Review A 79 (3), 031805.
- Nazarkin et al. (1999) Nazarkin, A., G. Korn, M. Wittmann, and T. Elsaesser (1999), Physical Review Letters 83 (13), 2560.
- von Neumann and Wigner (1993) von Neumann, J., and E. P. Wigner (1993), in The Collected Works of Eugene Paul Wigner (Springer Berlin Heidelberg, Berlin, Heidelberg) pp. 291–293.
- New and Ward (1967) New, G. H. C., and J. F. Ward (1967), Physical Review Letters 19 (10), 556.
- Newkirk et al. (2016) Newkirk, A. V., J. E. Antonio-Lopez, J. Anderson, R. Alvarez-Aguirre, Z. S. Eznaveh, G. Lopez-Galmiche, R. Amezcua-Correa, and A. Schülzgen (2016), Optics Letters 41 (14), 3277.
- Nielsen et al. (2005) Nielsen, K., D. Noordegraaf, T. Sørensen, A. Bjarklev, and T. P. Hansen (2005), Journal of Optics A: Pure and Applied Optics 7 (8), L13.
- Nisoli et al. (1996) Nisoli, M., S. De Silvestri, and O. Svelto (1996), Applied Physics Letters 68 (20), 2793.
- Nisoli et al. (1997) Nisoli, M., S. De Silvestri, O. Svelto, R. Szipöcs, K. Ferencz, C. Spielmann, S. Sartania, and F. Krausz (1997), Optics Letters 22 (8), 522.
- Noack et al. (2005) Noack, F., O. Steinkellner, P. Tzankov, H.-H. Ritze, J. Herrmann, and Y. Kida (2005), Optics Express 13 (7), 2467.
- Nold (2011) Nold, J. (2011), PhD dissertation, Phd thesis (Universitat Erlangen-Nurnberg).
- Nold et al. (2010) Nold, J., P. Hölzer, N. Y. Joly, G. K. L. Wong, A. Nazarkin, A. Podlipensky, M. Scharrer, and P. S. Russell (2010), Optics Letters 35 (17), 2922.
- Noordegraaf et al. (2007) Noordegraaf, D., L. Scolari, J. Læ gsgaard, L. Rindorf, and T. T. Alkeskjold (2007), Optics Express 15 (13), 7901.
- Noordegraaf et al. (2008) Noordegraaf, D., L. Scolari, J. Laegsgaard, T. Tanggaard Alkeskjold, G. Tartarini, E. Borelli, P. Bassi, J. Li, and S.-T. Wu (2008), Optics Letters 33 (9), 986.
- Novoa et al. (2015) Novoa, D., M. Cassataro, J. Travers, and P. Russell (2015), Physical Review Letters 115 (3), 033901.
- Novotny and Hecht (2006) Novotny, L., and B. Hecht (2006), Principles of Nano-Optics (Cambridge University Press, Cambridge).
- Olausson et al. (2010) Olausson, C. B., L. Scolari, L. Wei, D. Noordegraaf, J. Weirich, T. T. Alkeskjold, K. P. Hansen, and A. Bjarklev (2010), Optics Express 18 (8), 8229.
- Onuki (2004) Onuki, A. (2004), Journal of the Physical Society of Japan 73, 511.
- Ordal et al. (1983) Ordal, M. a., L. L. Long, R. J. Bell, S. E. Bell, R. R. Bell, R. W. Alexander, and C. a. Ward (1983), Applied Optics 22 (7), 1099.
- Ouzounov et al. (2005) Ouzounov, D., C. Hensley, A. Gaeta, N. Venkateraman, M. Gallagher, and K. Koch (2005), Optics Express 13 (16), 6153.
- Ouzounov et al. (2003) Ouzounov, D. G., F. R. Ahmad, D. Müller, N. Venkataraman, M. T. Gallagher, M. G. Thomas, J. Silcox, K. W. Koch, and A. L. Gaeta (2003), Science 301 (5640), 1702 .
- Palik (1997) Palik, E. (1997), Handbook of Optical Constants of Solids (Academic Press).
- Panagiotopoulos et al. (2015) Panagiotopoulos, P., P. Whalen, M. Kolesik, and J. V. Moloney (2015), Nature Photonics 9 (8), 543.
- Peacock and Healy (2016) Peacock, A. C., and N. Healy (2016), Semiconductor Science and Technology 31 (10), 103004.
- Peacock et al. (2014) Peacock, A. C., J. R. Sparks, and N. Healy (2014), Laser & Photonics Reviews 8 (1), 53.
- Pearce et al. (2007) Pearce, G. J., G. S. Wiederhecker, C. G. Poulton, S. Burger, and P. St J Russell (2007), Optics Express 15 (20), 12680.
- Peck and Huang (1977) Peck, E. R., and S. Huang (1977), Journal of the Optical Society of America 67 (11), 1550.
- Peng et al. (2011) Peng, X., M. Mielke, and T. Booth (2011), Optics Express 19 (2), 923.
- Perelomov et al. (1966) Perelomov, A. M., V. S. Popov, and M. V. Terent’ev (1966), Soviet Journal of Experimental and Theoretical Physics 23, 924.
- Phan Huy et al. (2010) Phan Huy, M. C., A. Baron, S. Lebrun, R. Frey, and P. Delaye (2010), Journal of the Optical Society of America B 27 (9), 1886.
- Philbin et al. (2008) Philbin, T. G., C. Kuklewicz, S. Robertson, S. Hill, F. König, and U. Leonhardt (2008), Science 319 (5868), 1367 .
- Pinault and Potasek (1985) Pinault, S. C., and M. J. Potasek (1985), Journal of the Optical Society of America B 2 (8), 1318.
- Poletti (2014) Poletti, F. (2014), Optics Express 22 (20), 23807.
- Poli et al. (2007) Poli, F., A. Cucinotta, and S. Selleri (2007), Photonic Crystal Fibers, 1st ed., Materials Science, Vol. 102 (Springer Netherlands, Dordrecht).
- Pottage et al. (2003) Pottage, J., D. Bird, T. Hedley, J. Knight, T. Birks, P. Russell, and P. Roberts (2003), Optics Express 11 (22), 2854.
- Pricking and Giessen (2011) Pricking, S., and H. Giessen (2011), Optics Express 19 (4), 2895.
- Pryamikov et al. (2011) Pryamikov, A. D., A. S. Biriukov, A. F. Kosolapov, V. G. Plotnichenko, S. L. Semjonov, and E. M. Dianov (2011), Optics Express 19 (2), 1441.
- Rae and Burnett (1992) Rae, S. C., and K. Burnett (1992), Physical Review A 46 (2), 1084.
- Raether (1988) Raether, H. (1988), Springer Tracts in Modern Physics, Springer Tracts in Modern Physics, Vol. 111 (Springer Berlin Heidelberg).
- Raman and Krishnan (1928) Raman, C. V., and K. S. Krishnan (1928), Nature 121, 501.
- Ranka et al. (2000) Ranka, J. K., R. S. Windeler, and A. J. Stentz (2000), Optics Letters 25 (1), 25.
- Rasmussen et al. (2009) Rasmussen, P. D., F. H. Bennet, D. N. Neshev, A. A. Sukhorukov, C. R. Rosberg, W. Krolikowski, O. Bang, and Y. S. Kivshar (2009), Optics Letters 34 (3), 295.
- Raymer and Walmsley (1993) Raymer, M., and I. Walmsley (1993), Progress In Optics 31, 181.
- Raymer et al. (1985) Raymer, M., I. Walmsley, J. Mostowski, and B. Sobolewska (1985), Physical Review A 32 (1), 332.
- Ren et al. (2008) Ren, H., A. Nazarkin, J. Nold, and P. S. Russell (2008), Optics Express 16 (21), 17052.
- Ritari et al. (2004) Ritari, T., J. Tuominen, H. Ludvigsen, J. C. Petersen, T. Sørensen, T. P. Hansen, and H. R. Simonsen (2004), Optics Express 12 (17), 4080.
- Ritchie et al. (1968) Ritchie, R. H., E. T. Arakawa, J. J. Cowan, and R. N. Hamm (1968), Physical Review Letters 21 (22), 1530.
- Roberts et al. (2005) Roberts, P., F. Couny, H. Sabert, B. Mangan, D. Williams, L. Farr, M. Mason, A. Tomlinson, T. Birks, J. Knight, and P. St J Russell (2005), Optics Express 13 (1), 236.
- Roger et al. (2013) Roger, T., M. F. Saleh, S. Roy, F. Biancalana, C. Li, and D. Faccio (2013), Physical Review A 88 (5), 051801.
- Rosberg et al. (2007) Rosberg, C. R., F. H. Bennet, D. N. Neshev, P. D. Rasmussen, O. Bang, W. Krolikowski, A. Bjarklev, and Y. S. Kivshar (2007), Optics Express 15 (19), 12145.
- Russell (2001) Russell, P. (2001), IEE Review 47 (5), 19.
- Russell (2003) Russell, P. (2003), Science (New York, N.Y.) 299 (5605), 358.
- Russell (2006) Russell, P. S. J. (2006), Journal of Lightwave Technology 24 (12), 4729.
- Russell et al. (2014) Russell, P. S. J., P. Hölzer, W. Chang, A. Abdolvand, and J. C. Travers (2014), Nature Photonics 8 (4), 278.
- Saito and Kikuchi (1997) Saito, M., and K. Kikuchi (1997), Optical Review 4 (5), 527.
- Saitoh et al. (2008) Saitoh, K., N. J. Florous, S. K. Varshney, and M. Koshiba (2008), Journal of Lightwave Technology 26 (6), 663.
- Sakurai (1967) Sakurai, J. J. (1967), Advanced Quantum Mechanics (Pearson Education India).
- Saleh et al. (2015a) Saleh, M. F., A. Armaroli, A. Marini, and F. Biancalana (2015a), Optics Letters 40 (17), 4058.
- Saleh et al. (2015b) Saleh, M. F., A. Armaroli, T. X. Tran, A. Marini, F. Belli, A. Abdolvand, and F. Biancalana (2015b), Optics Express 23 (9), 11879.
- Saleh and Biancalana (2011) Saleh, M. F., and F. Biancalana (2011), Physical Review A 84 (6), 063838.
- Saleh and Biancalana (2015) Saleh, M. F., and F. Biancalana (2015), Optics Letters 40 (18), 4218.
- Saleh and Biancalana (2016) Saleh, M. F., and F. Biancalana (2016), Journal of Optics 18 (1), 013002.
- Saleh et al. (2011) Saleh, M. F., W. Chang, P. Hölzer, A. Nazarkin, J. C. Travers, N. Y. Joly, P. S. J. Russell, and F. Biancalana (2011), Physical Review Letters 107 (20), 203902.
- Saleh et al. (2012) Saleh, M. F., W. Chang, J. C. Travers, P. S. J. Russell, and F. Biancalana (2012), Physical Review Letters 109, 113902.
- Santos et al. (2005) Santos, L. F., R. Wolthuis, S. Koljenovic, R. M. Almeida, and G. J. Puppels (2005), Analytical Chemistry 77 (20), 6747.
- Sazio (2006) Sazio, P. J. A. (2006), Science 311 (5767), 1583.
- Schmidt et al. (2009) Schmidt, M. a., N. Granzow, N. Da, M. Peng, L. Wondraczek, and P. S. J. Russell (2009), Optics Letters 34 (13), 1946.
- Schmidt et al. (2008) Schmidt, M. A., L. N. Prill Sempere, H. K. Tyagi, C. G. Poulton, and P. S. J. Russell (2008), Physical Review B - Condensed Matter and Materials Physics 77 (3), 10.1103/PhysRevB.77.033417, arXiv:0711.4553 .
- Schwab and McCreery (1987) Schwab, S. D., and R. L. McCreery (1987), Applied Spectroscopy 41 (1), 126.
- Scolari (2009) Scolari, L. (2009), Liquid crystals in photonic crystal fibers: fabrica- tion, characterization and devices, Ph.D. thesis (Technical University of Denmark).
- Scolari et al. (2005) Scolari, L., T. Alkeskjold, J. Riishede, A. Bjarklev, D. Hermann, A. Anawati, M. Nielsen, and P. Bassi (2005), Optics Express 13 (19), 7483.
- Scolari et al. (2009) Scolari, L., S. Gauza, H. Xianyu, L. Zhai, L. Eskildsen, T. T. Alkeskjold, S.-T. Wu, and A. Bjarklev (2009), Optics Express 17 (5), 3754.
- Seddon (1995) Seddon, A. B. (1995), Journal of Non-Crystalline Solids 184, 44.
- Sempere (2010) Sempere, L. P. (2010), Plasmonic excitations on metallic nanowires embedded in silica photonic crystal bers, Ph.D. thesis (Friedrich-Alexander-Universitat Erlangen-Nurnberg).
- Serebryannikov et al. (2004) Serebryannikov, E. E., D. von der Linde, and A. M. Zheltikov (2004), Physical Review E 70 (6), 066619.
- Serebryannikov et al. (2008) Serebryannikov, E. E., D. von der Linde, and A. M. Zheltikov (2008), Optics Letters 33 (9), 977.
- Serebryannikov and Zheltikov (2014) Serebryannikov, E. E., and A. Zheltikov (2014), Physical Review Letters 113 (4), 043901.
- Shank et al. (1982) Shank, C. V., R. L. Fork, R. Yen, R. H. Stolen, and W. J. Tomlinson (1982), Applied Physics Letters 40 (9), 761.
- Shelton (1990) Shelton, D. P. (1990), Physical Review A 42 (5), 2578.
- Shelton and Mizrahi (1986) Shelton, D. P., and V. Mizrahi (1986), Physical Review A 33 (1), 72.
- Shephard et al. (2004) Shephard, J., J. Jones, D. Hand, G. Bouwmans, J. Knight, P. Russell, and B. Mangan (2004), Optics Express 12 (4), 717.
- Shephard et al. (2005) Shephard, J. D., F. Couny, P. S. J. Russell, J. D. C. Jones, J. C. Knight, and D. P. Hand (2005), Applied Optics 44 (21), 4582.
- Shimizu (1967) Shimizu, F. (1967), Physical Review Letters 19 (19), 1097.
- Shirakawa et al. (2009) Shirakawa, A., H. Maruyama, K. Ueda, C. B. Olausson, J. K. Lyngsø, and J. Broeng (2009), Optics Express 17 (2), 447.
- Skryabin and Yulin (2005) Skryabin, D. V., and A. V. Yulin (2005), Physical Review E 72 (1), 016619.
- Smith et al. (2003) Smith, C. M., N. Venkataraman, M. T. Gallagher, D. Muller, J. A. West, N. F. Borrelli, D. C. Allan, and K. W. Koch (2003), Nature 424, 657–659.
- Sollapur et al. (2017) Sollapur, R., D. Kartashov, M. Zürch, A. Hoffmann, T. Grigorova, G. Sauer, A. Hartung, A. Schwuchow, J. Bierlich, J. Kobelke, et al. (2017), arXiv preprint arXiv:1701.03540 .
- Sommerfeld (1899) Sommerfeld, A. (1899), Annalen der Physik und Chemie 303 (2), 233.
- Soref (2010) Soref, R. (2010), Nature Photonics 4 (8), 495.
- Sparks et al. (2013) Sparks, J. R., P. J. a. Sazio, V. Gopalan, and J. V. Badding (2013), Annual Review of Materials Research 43, 9.1.
- Sprague et al. (2014) Sprague, M. R., P. S. Michelberger, T. F. M. Champion, J. England, D. G. Nunn, X.-M. Jin, W. S. Kolthammer, A. Abdolvand, P. S. J. Russell, and I. A. Walmsley (2014), Nature Photonics 8 (4), 287–291.
- Spring (2011) Spring, K. (2011), “Encyclopedia of Optical Engineering,” .
- Standley and Holden (1974) Standley, R., and W. Holden (1974), Bell System Technical Journal 53 (5), 779.
- Steinvurzel et al. (2005) Steinvurzel, P., B. J. Eggleton, C. M. de Sterke, and M. J. Steel (2005), Electronics Letters 41, 463.
- Stolen (1972) Stolen, R. H. (1972), Applied Physics Letters 20 (2), 62.
- Stolen (2008) Stolen, R. H. (2008), Journal of Lightwave Technology 26 (9), 1021.
- Stolen and Lin (1978) Stolen, R. H., and C. Lin (1978), Physical Review A 17 (4), 1448.
- Stratton, Julius Adams (1941) Stratton, Julius Adams, (1941), Electromagnetic Theory (Mcgraw Hill Book Company).
- Sudo et al. (1990) Sudo, S., I. Yokohama, H. Yasaka, Y. Sakai, and T. Ikegami (1990), IEEE Photonics Technology Letters 2 (2), 128.
- Suhailin et al. (2016) Suhailin, F. H., L. Shen, N. Healy, L. Xiao, M. Jones, T. Hawkins, J. Ballato, U. J. Gibson, and A. C. Peacock (2016), Optics Letters 41 (7), 1360.
- Sun et al. (2015) Sun, B., Y. Huang, D. Luo, C. Wang, J. He, C. Liao, G. Yin, J. Zhou, S. Liu, J. Zhao, and Y. Wang (2015), IEEE Photonics Journal 7 (4), 1.
- Sutherland (1997) Sutherland, R. L. (1997), Optical Engineering Optical Science and Engineering, 36 (3), 964.
- Tai et al. (1986) Tai, K., A. Hasegawa, and A. Tomita (1986), Physical Review Letters 56, 135.
- Tani et al. (2015) Tani, F., F. Belli, A. Abdolvand, J. C. Travers, and P. S. Russell (2015), Optics Letters 40 (6), 1026.
- Tani et al. (2017) Tani, F., M. H. Frosz, J. C. Travers, and P. S. Russell (2017), Optics Letters 42 (9), 1768.
- Tani et al. (2013) Tani, F., J. C. Travers, and P. S. J. Russell (2013), Physical Review Letters 111 (3), 033902.
- Tani et al. (2014) Tani, F., J. C. Travers, and P. St.J. Russell (2014), Journal of the Optical Society of America B 31 (2), 311.
- Tartarini et al. (2007) Tartarini, G., M. Pansera, T. T. Alkeskjold, a. Bjarklev, and P. Bassi (2007), Journal of Lightwave Technology 25 (9), 719.
- Taylor (2005) Taylor, J. R., Ed. (2005), Optical Solitons: Theory and Experiment (Cambridge University Press, Cambridge England ; New York).
- Temelkuran et al. (2002) Temelkuran, B., S. D. Hart, G. Benoit, J. D. Joannopoulos, and Y. Fink (2002), Nature 420 (6916), 650.
- Tempea and Brabec (1998) Tempea, G., and T. Brabec (1998), Optics Letters 23 (16), 1286.
- Thakur et al. (2011) Thakur, H. V., S. M. Nalawade, S. Gupta, R. Kitture, and S. N. Kale (2011), Applied Physics Letters 99 (16), 10.1063/1.3651490.
- Tian et al. (2007) Tian, Y., L. Zhang, J. Zuo, Z. Li, S. Gao, and G. Lu (2007), Analytica Chimica Acta 581 (1), 154.
- Trabold et al. (2013a) Trabold, B., A. Abdolvand, T. Euser, and P. S. J. Russell (2013a), Optics Express 21 (24), 29711.
- Trabold et al. (2013b) Trabold, B., A. Abdolvand, T. Euser, A. Walser, and P. S. J. Russell (2013b), Optics Letters 38 (5), 600.
- Travers et al. (2005) Travers, J., S. V. Popov, and J. Taylor (2005), Optics Letters 30 (23), 3132.
- Travers (2010) Travers, J. C. (2010), Journal of Optics 12 (11), 113001.
- Travers et al. (2011a) Travers, J. C., W. Chang, J. Nold, N. Y. Joly, and P. St. J. Russell (2011a), Journal of the Optical Society of America B 28 (12), A11.
- Travers et al. (2011b) Travers, J. C., P. Hölzer, W. Chang, J. Nold, A. Nazarkin, N. Joly, and P. S. Russell (2011b), in CLEO/Europe and EQEC 2011 Conference Digest (Optical Society of America) p. CJ3_1.
- Treacy (1968) Treacy, E. B. (1968), Physics Letters A 28 (1), 34.
- Tuniz et al. (2016) Tuniz, A., C. Jain, S. Weidlich, and M. A. Schmidt (2016), Optics Letters 41 (3), 448.
- Tyagi (2011) Tyagi, H. K. (2011), Germanium and gold wore arrays embedded in silica photonic crystal fibers, Phd thesis (Universitat Erlangen-Nurnberg).
- Tyagi et al. (2008) Tyagi, H. K., M. A. Schmidt, L. Prill Sempere, and P. S. Russell (2008), Optics Express 16 (22), 17227.
- Uebel (2013) Uebel, P. (2013), Metal Filled Optical Fibers: Photonics and Plasmonics on the Nanoscale, Ph.D. thesis (Universitat Erlangen-Nurnberg).
- Uebel et al. (2013) Uebel, P., S. T. Bauerschmidt, M. A. Schmidt, and P. St.j. Russell (2013), Applied Physics Letters 103 (2), 10.1063/1.4813115.
- Uebel et al. (2016) Uebel, P., M. C. Günendi, M. H. Frosz, G. Ahmed, N. N. Edavalath, J.-M. Ménard, and P. S. Russell (2016), Optics Letters 41 (9), 1961.
- Uebel et al. (2011) Uebel, P., M. A. Schmidt, M. Scharrer, and P. S. J. Russell (2011), New Journal of Physics 13 (6), 063016.
- Urich et al. (2012) Urich, A., R. R. J. Maier, B. J. Mangan, S. Renshaw, J. C. Knight, D. P. Hand, and J. D. Shephard (2012), Optics Express 20 (6), 6677.
- Vaiano et al. (2016) Vaiano, P., B. Carotenuto, M. Pisco, A. Ricciardi, G. Quero, M. Consales, A. Crescitelli, E. Esposito, and A. Cusano (2016), Laser & Photonics Reviews 10 (6), 922.
- Venkataraman et al. (2011) Venkataraman, V., K. Saha, P. Londero, and A. L. Gaeta (2011), Physical Review Letters 107 (19), 10.1103/PhysRevLett.107.193902.
- Vial et al. (2016) Vial, F., K. Gadonna, B. Debord, F. Delahaye, F. Amrani, O. Leroy, F. Gérôme, and F. Benabid (2016), Optics Letters 41 (10), 2286.
- Vieweg (2012) Vieweg, M. (2012), Nonlinear Optics in Selectively Fluid - filled Photonic Crystal Fibers, Ph.D. thesis (Universitat Stuttgart).
- Vieweg et al. (2012a) Vieweg, M., T. Gissibl, Y. V. Kartashov, L. Torner, and H. Giessen (2012a), Optics Letters 37 (13), 2454.
- Vieweg et al. (2010) Vieweg, M., T. Gissibl, S. Pricking, B. T. Kuhlmey, D. C. Wu, B. J. Eggleton, and H. Giessen (2010), Optics Express 18 (24), 25232.
- Vieweg et al. (2012b) Vieweg, M., S. Pricking, T. Gissibl, Y. Kartashov, L. Torner, and H. Giessen (2012b), Optics Letters 37 (6), 1058.
- Voronin and Zheltikov (2008) Voronin, A. A., and A. M. Zheltikov (2008), Physical Review A 78 (6), 063834.
- Wahlstrand et al. (2012) Wahlstrand, J. K., Y.-H. Cheng, and H. M. Milchberg (2012), Physical Review Letters 109 (11), 113904.
- Wai et al. (1986) Wai, P. K. A., C. R. Menyuk, Y. C. Lee, and H. H. Chen (1986), Optics Letters 11 (7), 464.
- Walrafen (1974) Walrafen, G. (1974), Physikalische Blätter 30 (12), 540.
- Walrafen and Stone (1972) Walrafen, G., and J. Stone (1972), Applied Spectroscopy 26 (6), 585.
- Wang (1969) Wang, C.-S. (1969), Physical Review 182 (2), 482.
- Wang et al. (2010a) Wang, Y., C. Wu, F. Couny, M. Raymer, and F. Benabid (2010a), Physical Review Letters 105 (12), 123603.
- Wang et al. (2010b) Wang, Y. Y., F. Couny, P. S. Light, B. J. Mangan, and F. Benabid (2010b), Optics Letters 35 (8), 1127.
- Wang et al. (2011) Wang, Y. Y., N. V. Wheeler, F. Couny, P. J. Roberts, and F. Benabid (2011), Optics Letters 36 (5), 669.
- Wang et al. (2014) Wang, Z., W. Belardi, F. Yu, W. J. Wadsworth, and J. C. Knight (2014), Optics Express 22 (18), 21872.
- Webb et al. (2013) Webb, K. E., Y. Q. Xu, M. Erkintalo, and S. G. Murdoch (2013), Optics Letters 38 (2), 151.
- Wei et al. (2009a) Wei, L., T. T. Alkeskjold, and A. Bjarklev (2009a), IEEE Photonics Technology Letters 21 (21), 1633.
- Wei et al. (2010) Wei, L., T. T. Alkeskjold, and A. Bjarklev (2010), Applied Physics Letters 96 (24), 10.1063/1.3455105.
- Wei et al. (2009b) Wei, L., L. Eskildsen, J. Weirich, L. Scolari, T. T. Alkeskjold, and A. Bjarklev (2009b), Applied Optics 48 (3), 497.
- Wei et al. (2009c) Wei, L., J. Weirich, T. T. Alkeskjold, and A. Bjarklev (2009c), Optics Letters 34 (24), 3818.
- Wei et al. (2009d) Wei, L., W. Xue, Y. Chen, T. T. Alkeskjold, and A. Bjarklev (2009d), Optics Letters 34 (18), 2757.
- Welch et al. (2009) Welch, M. G., K. Cook, R. A. Correa, F. Gérôme, W. Wadsworth, A. Gorbach, D. Skryabin, and J. Knight (2009), Journal of Lightwave Technology 27 (11), 1644.
- Westbrook et al. (2000) Westbrook, P. S., B. J. Eggleton, R. S. Windeler, A. Hale, T. A. Strasser, and G. L. Burdge (2000), IEEE Photonics Technology Letters 12 (5), 495.
- White and Fan (2008) White, I. M., and X. Fan (2008), Optics Express 16 (2), 1020, arXiv:0707.1194 .
- Wolinski (2012) Wolinski, T. (2012), in Photonic Sensing (John Wiley & Sons, Inc., Hoboken, NJ, USA) pp. 147–181.
- Woliński et al. (2009) Woliński, T. R., M. M. Tefelska, M. S. Chychłowski, K. Godyń, R. Dąbrowski, J. Wójcik, T. Nasiłowski, and H. Thienpont (2009), Molecular Crystals and Liquid Crystals 502 (1), 220.
- Wood et al. (1991) Wood, W. M., C. W. Siders, and M. C. Downer (1991), Physical Review Letters 67 (25), 3523.
- Wu et al. (2010) Wu, C., M. Raymer, Y. Wang, and F. Benabid (2010), Physical Review A 82 (5), 053834.
- Wu et al. (2009) Wu, D. K. C., B. T. Kuhlmey, and B. J. Eggleton (2009), Optics Letters 34 (3), 322.
- Wynne and Barabadi (2015) Wynne, R., and B. Barabadi (2015), Applied Optics 54 (7), 1751.
- Xu et al. (2017) Xu, M., F. Yu, M. R. Hassan, and J. Knight (2017), in Conference on Lasers and Electro-Optics (Optical Society of America) p. SF2K.4.
- Yablonovitch (1974) Yablonovitch, E. (1974), Physical Review Letters 32 (20), 1101.
- Yablonovitch (1987) Yablonovitch, E. (1987), Physical Review Letters 58 (20), 2059.
- Yablonovitch et al. (1991) Yablonovitch, E., T. J. Gmitter, and K. M. Leung (1991), Physical Review Letters 67 (17), 2295.
- Yan et al. (2006) Yan, H., C. Gu, C. Yang, J. Liu, G. Jin, J. Zhang, L. Hou, and Y. Yao (2006), Applied Physics Letters 89 (20), 204101.
- Yan et al. (1985) Yan, Y.-X., E. B. Gamble Jr, and K. A. Nelson (1985), The Journal of Chemical Physics 83 (11), 5391.
- Yang and Wu (2014) Yang, D.-K., and S.-T. Wu (2014), Fundamentals of Liquid Crystal Devices (John Wiley & Sons, Ltd, Chichester, UK).
- Yang et al. (2013) Yang, X., A. S. Chang, B. Chen, C. Gu, and T. C. Bond (2013), Sensors and Actuators B: Chemical 176, 64.
- Yang et al. (2011) Yang, X., C. Shi, R. Newhouse, J. Z. Zhang, and C. Gu (2011), International Journal of Optics 2011.
- Yang et al. (2012) Yang, X., A. Y. Zhang, D. A. Wheeler, T. C. Bond, C. Gu, and Y. Li (2012), Analytical and Bioanalytical Chemistry 402 (2), 687.
- Yariv (1989) Yariv, A. (1989), Quantum Electronics (John Wiley and Sons).
- Yeh et al. (1978) Yeh, P., A. Yariv, and E. Marom (1978), Journal of the Optical Society of America 68 (9), 1196.
- Yoshikawa and Imasaka (1993) Yoshikawa, S., and T. Imasaka (1993), Optics Communications 96 (1), 94.
- Y.R.Shen; (1984) Y.R.Shen;, (1984), Principles of Nonlinear Optics (Wiley & Sons).
- Yu and Knight (2013) Yu, F., and J. C. Knight (2013), Optics Express 21 (18), 21466.
- Yu and Knight (2016) Yu, F., and J. C. Knight (2016), IEEE Journal of Selected Topics in Quantum Electronics 22 (2), 146.
- Yu et al. (2012) Yu, F., W. J. Wadsworth, and J. C. Knight (2012), Optics Express 20 (10), 11153.
- Yu et al. (2016) Yu, F., M. Xu, and J. C. Knight (2016), Optics Express 24 (12), 12969.
- Yudin and Ivanov (2001) Yudin, G. L., and M. Y. Ivanov (2001), Physical Review A 64 (1), 013409.
- Zakharov and Ostrovsky (2009) Zakharov, V., and L. Ostrovsky (2009), Physica D: Nonlinear Phenomena 238 (5), 540 .
- Zakharov and Shabat (1972) Zakharov, V. E., and A. B. Shabat (1972), Soviet Journal of Experimental and Theoretical Physics 34, 62.
- Zenneck (1907) Zenneck, J. (1907), Annalen der Physik 328 (10), 846.
- Zhang et al. (2006) Zhang, R., J. Teipel, and H. Giessen (2006), Optics Express 14 (15), 6800.
- Zhang et al. (2007a) Zhang, X., A. L. Lytle, T. Popmintchev, X. Zhou, H. C. Kapteyn, M. M. Murnane, and O. Cohen (2007a), Nature Physics 3 (4), 270.
- Zhang et al. (2007b) Zhang, Y., C. Shi, C. Gu, L. Seballos, and J. Z. Zhang (2007b), Applied Physics Letters 90 (19), 193504.
- Zhavoronkov and Korn (2002) Zhavoronkov, N., and G. Korn (2002), Physical Review Letters 88 (20), 203901.
- Zheltikov (2013) Zheltikov, A. M. (2013), Physical Review A 88 (6), 063847.
- Zheltikova and Zheltikov (2006) Zheltikova, D. A., and A. M. Zheltikov (2006), Applied Physics B 83 (1), 11.
- Ziemienczuk et al. (2012) Ziemienczuk, M., A. Walser, A. Abdolvand, and P. S. J. Russell (2012), Journal of the Optical Society of America B 29 (7), 1563.
- Zografopoulos et al. (2006a) Zografopoulos, D. C., E. E. Kriezis, and T. D. Tsiboukis (2006a), Optics Express 14 (2), 914.
- Zografopoulos et al. (2006b) Zografopoulos, D. C., E. E. Kriezis, and T. D. Tsiboukis (2006b), Journal of Lightwave Technology 24 (9), 3427.
- Zu et al. (2012) Zu, P., C. Chiu Chan, T. Gong, Y. Jin, W. Chang Wong, and X. Dong (2012), Applied Physics Letters 101 (24), 10.1063/1.4772017.