R. Zamanov, S. Boeva, B. Spassov, G. Latev, U. Wolter, K. A. Stoyanov
11institutetext: Institute of Astronomy and NAO, Bulgarian Academy of Sciences, Tsarigradsko shose 72,
BG-1784 Sofia, Bulgaria
22institutetext: Hamburger Sternwarte, Universität Hamburg, Gojenbergsweg 112, 21029 Hamburg, Germany
22email: rkz@astro.bas.bg; kstoyanov@astro.bas.bg
\papertypeSubmitted on 8 March 2019; Accepted on 26 March 2019
Colours of the flickering source of Mira
Abstract
We report photometric observations in Johnson UBV bands of the short term variability of Mira. The amplitude detected is 0.16 mag in B band. Adopting interstellar extinction , we find for the flickering source colour , temperature K, and radius R⊙. The colour of the flickering source is considerably redder than the average B-V colour of cataclysmic variables.
keywords:
stars: AGB and post-AGB – accretion, accretion discs – stars: binaries: symbiotic - stars: individual: omi CetIntroduction
Mira (omicron Ceti) is the prototype of the Mira-type variable stars. This type stars are red giants in the very late stages of the stellar evolution, on the asymptotic giant branch (AGB), having pulsation periods of a few hundred days. Mira pulsates with a period of 332 days (Hoffleit 1997) and an amplitude of about 7 magnitudes in V band (see Fig. 2). It provides an example of a binary system consisting of a mass-losing AGB star (Mira A) and a nearby (0.6 arcsec separation) companion Mira B, which is probably a white dwarf (Karovska et al. 1997, 2005; Sokoloski & Bildsten 2010). Mira is classified as S-type symbiotic star in the recent catalogue based on the 2MASS, WISE and Gaia surveys (Akras et al. 2019), in other words it is an interacting, wide binary system consisting of a red giant star that transfers matter to a much hotter companion.
Here we report CCD photometry of Mira and estimate colour, temperature and radius of the flickering source.
1 Observations


| date | telescope | band | UT start - end | |||
|---|---|---|---|---|---|---|
| hh:mm – hh:mm | ||||||
| 20180907 | 60cm Belogradchik | B | 67 x 60 sec | 23:44 - 01:34 | ||
| V | 67 x 15 sec | 23:47 - 01:35 | ||||
| 20180909 | 60cm Belogradchik | B | 81 x 40 sec | 23:57 - 01:42 | ||
| V | 83 x 10 sec | 23:57 - 01:42 | ||||
| 20180915 | 50/70cm Schmidt | U | 119 x 60 sec | 00:22 - 02:34 |
| date | band | min | max | average | stdev | merr | |
|---|---|---|---|---|---|---|---|
| [mag] | [mag] | [mag] | [mag] | [mag] | |||
| 20180907 | B | 11.006 | 11.165 | 11.1115 | 0.041 | 0.004 | |
| V | 9.286 | 9.376 | 9.344 | 0.023 | 0.003 | ||
| 20180909 | B | 10.998 | 11.088 | 11.0427 | 0.023 | 0.004 | |
| V | 9.261 | 9.345 | 9.3022 | 0.016 | 0.003 | ||
| 20180915 | U | 10.2523 | 10.3440 | 10.3008 | 0.0210 | 0.006 |
| date | parameter | E(B-V)=0 | E(B-V)=0.04 | E(B-V)=0.70 | |
|---|---|---|---|---|---|
| 20180907 | B-V | 1.22 | 1.18 | 0.52 | |
| T [K] | 3556 | 3896 | 6375 | ||
| R [R⊙] | 0.66 | 0.65 | 0.45 | ||
| 20180909 | B-V | 1.36 | 1.32 | 0.66 | |
| T [K] | 3253 | 3604 | 5636 | ||
| R [R⊙] | 0.89 | 0.87 | 0.60 |
The observations were performed with two telescopes equipped with CCD cameras: the 60 cm telescope of the Belogradchik Observatory, Bulgaria (Strigachev & Bachev 2011) and the 50/70 cm Schmidt telescope of the Rozhen National Astronomical Observatory, Bulgaria. Two comparison stars were used during the data reduction. Both are taken from AAVSO data base: HD 14411 (U=12.501 B=10.794 V=9.330) and the star located at J2000 coordinates RA=02:19:08.51 Dec=-02:54:51.0 (U=14.754 B=14.471 V=13.740).
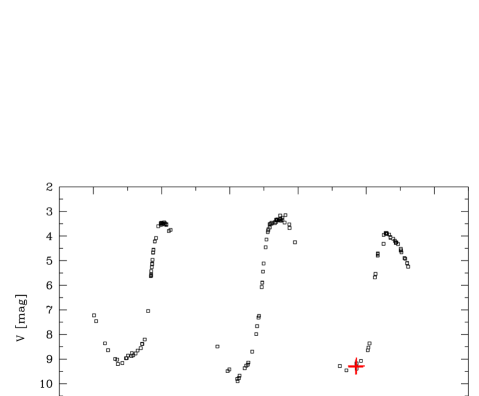
The journal of observations is given in Table LABEL:tab1 and the light curves are plotted on Fig. 2. The detected amplitude in V band is , in B band is 0.16 mag, and in U band is 0.09 mag. In Table LABEL:tab2 are given the measured magnitudes in each run. Fig. 2 illustrates that (1) Mira’s V-band brightness varies during the last 1000 days; (2) our V band observations are in agreement with other data and (3) our runs are close to the minimum of the Mira cycle.
2 Flickering source
Following Bruch (1992), we separate the light curve into two parts – constant light and variable (flickering) source. We calculate the flux of the flickering light source as , where is the average flux during the run and is the minimum flux during the run (corrected for the typical error of the observations). An extension of the method is proposed by Nelson et al. (2011), who suggests to use the , where is the maximum flux during the run. Practically, the method of Bruch (1992) refers to the average luminosity of the flickering source, while that of Nelson et al. (2011) – to its maximal luminosity. and have been calculated for each band, using the values given in Table 1 and the calibration for a zero magnitude star erg cm-2 s-1 Å-1, Å, erg cm-2 s-1 Å-1 and Å as given in the Spanish virtual observatory Filter Profile Service (Rodrigo et al. 2018, see also Bessel 1979).
gives parallax of Mira milliarcseconds, which corresponds to distance pc (No GAIA paralax is available for Mira). Mira is very close to the Earth and the interstellar extinction is probably . However the neutral hydrogen absorbing column cm-2 is derived from UV spectral modeling (Wood et al. 2002). From model fitting of ROSAT and XMM-Newton X-ray data, Kastner & Soker (2004) find cm-2 cm-2. This X-ray derived is a factor of larger than the neutral H absorbing column determined from analysis of the HI Ly line (Wood et al. 2002). This discrepancy suggests that the UV and X-ray emission arise in different zones around Mira B and, specifically, that the X-ray emitting region may be embedded within accretion streams that effectively attenuate the X-rays, as described by Jura & Helfand (1984). Following the relation between and reddening cm-2 mag-1 (Predehl & Schmitt 1995), we estimate that cm-2 corresponds to E(B-V)=0.04, cm-2 – to E(B-V)=0.35, and cm-2 – to .
In Table LABEL:tab3 are given the parameters of the flickering source, calculated using and following Bruch (1992). Assuming , we estimate colour and temperature of the flickering source and K – see Table LABEL:tab3 for more details. Using the method of Nelson et al. (2011) and , we estimate similar colour and temperature:
20180907 , K, R⊙;
20180909 , K, R⊙.
As can be expected the size is larger, because this method refers to the maximum of the flickering.
3 Discussion and Conclusion
Mira AB is a very wide binary system. The infrared spectroscopy (Hinkle et al. 2013) detected no orbital motion in agreement with previous estimates of the orbital period yr and semimajor axes au. ALMA observations revealed a mass of gas surrounding Mira B, with a size of a few tens of AU, which is interpreted as gas flowing from Mira A toward Mira B (Nhung et al. 2016). Hence the white dwarf in Mira accretes material via gravitational capture of the red-giant wind.
Sokoloski & Bildsten (2010) detected optical flickering from Mira with amplitude 0.15 - 0.30 mag in B band during 5 runs in 1997 - 1998. Snaid et al. (2018) found flickering with amplitude 0.05 mag in g’ band in September 2015. The amplitude of the flickering in our data is similar to these results. Given the discussion in Sect. 6.2 of Sokoloski, Bildsten & Ho (2001) about the difficulty of producing rapid variability from the nebular emission, we expect the rapidly variable component of Mira to reflect the physical origin of the variations in the accretion disc around white dwarf.
For the flickering source of the symbiotic Mira EF Aql,
Zamanov et al. 2017 calculated , which is considerably more blue than the colour of the
flickering source of omi Cet.
The B-V colour of the flickering source is calculated in a number of cataclysmic variables and two recurrent novae
(Bruch 1992; Zamanov et al. 2015). It is in the range ,
with average value of 0.16, median value of 0.11, and standard deviation of 0.24.
Our results for Mira indicate that if the interstellar extinction is
low, its flickering source is considerably
more red than the average colour of the cataclysmic variables.
Possible reasons can be:
– (1) the flickering source of Mira has lower temperature than the flickering source
in cataclysmic variables;
– (2) the flickering of Mira is coming from
almost the same place, where the X-rays are generated and
the flickering source is
embedded within the accretion flow
(like the X-ray source, see Kastner & Soker 2004) which makes it to appear redder.
Acknowledgements: This work is supported by the grant K-06-H28/2 08.12.2018 (Bulgarian National Science Fund). We acknowledge with thanks the variable star observations from the AAVSO International Database and the BAA Photometry Database contributed by observers worldwide and used in this research.
References
- [] Akras, S., Leal-Ferreira, M. L., Guzman-Ramirez, L., & Ramos-Larios, G. 2019, MNRAS, 483, 5077
- [] Bessell, M. S. 1979, PASP, 91, 589
- [] Bruch, A. 1992, A&A, 266, 237
- [] Hinkle, K. H., Fekel, F. C., Joyce, R. R., & Wood, P. 2013, ApJ, 770, 28
- [] Hoffleit, D. 1997, Journal of the American Association of Variable Star Observers (JAAVSO), 25, 115
- [] Jura, M., & Helfand, D. J. 1984, ApJ, 287, 785
- [] Karovska, M., Hack, W., Raymond, J., & Guinan, E. 1997, ApJ, 482, L175
- [] Karovska, M., Schlegel, E., Hack, W., Raymond, J. C., & Wood, B. E. 2005, ApJ, 623, L137
- [] Kastner, J. H., & Soker, N. 2004, ApJ, 616, 1188
- [] Nelson, T., Mukai, K., Orio, M., Luna, G. J. M., & Sokoloski, J. L. 2011, ApJ, 737, 7
- [] Nhung, P. T., Hoai, D. T., Diep, P. N., et al. 2016, MNRAS, 460, 673
- [] Predehl, P., & Schmitt, J. H. M. M. 1995, A&A, 293, 889
- [] Rodrigo, C., Solano, E., Bayo, A. http://ivoa.net/documents/Notes/SVOFPS/index.html
- [] Snaid, S., Zijlstra, A. A., McDonald, I., et al. 2018, MNRAS, 477, 4200
- [] Sokoloski, J. L., Bildsten, L., & Ho, W. C. G. 2001, MNRAS, 326, 553
- [] Sokoloski, J. L., & Bildsten, L. 2010, ApJ, 723, 1188
- [] Strigachev, A., & Bachev, R. 2011, Bulgarian Astronomical Journal, 16, 144
- [] Wood, B. E., Karovska, M., & Raymond, J. C. 2002, ApJ, 575, 1057
- [] Zamanov, R., Boeva, S., Latev, G., Stoyanov, K. A., & Tsvetkova, S. V. 2015, Astronomische Nachrichten, 336, 189
- [] Zamanov, R. K., Boeva, S., Nikolov, Y. M., et al. 2017, Astronomische Nachrichten, 338, 680