A deep Hi survey of the M81 group
Abstract
A region, including the M81 complex (M81, M82, NGC 3077), NGC 2976 and IC2574, was mapped during hours with the DRAO synthesis telescope. With a physical resolution of kpc, these observations allow us to probe a large region down to column density levels of over 16 km s-1, mapping the extent of the Hi arm connecting the system and NGC 2976, and resolving the Hi clouds adjacent to the arm. The observations also reveal a few clouds located between the system and IC 2574, probably tidally stripped from a past interaction between the two systems. Given the regular velocity distribution in the Hi envelope of the system, we attempt and derive an idealised large-scale rotation curve of the system. We observe a flat trend for the rotation velocity of the overall system from 20 kpc out to 80 kpc, well beyond the outskirts of the M81 disk, although with asymmetries like a wiggle at the vicinity of M82. This supports the assumption that intergalactic gas and galaxies in the system participate to a large-scale ordered rotation motion which is dominated by M81. Also, our Hi analysis of the group further supports the hypothesis that the galaxies forming the system moved closer from afar, in agreement with numerical simulations.
keywords:
galaxies: groups; galaxies: evolution; galaxies: interactions; galaxies: kinematics and dynamics; galaxies: ISM; galaxies: individual: M81, M82, NGC 3077, NGC 2976, IC 2574, Ho IX.1 Introduction
Galaxy interactions are a key process driving the evolution of galaxies in the Universe. The theory predicts that the morphology and gas content of galaxies are shaped by the interactions with their environment and counterparts (e.g., Toomre & Toomre, 1972; Gunn & Gott, 1972; Dressler, 1980). In particular, tidal interactions are known to affect the stellar disk and star formation rates of galaxies (e.g., Cayatte et al., 1990; Hernquist, 1992; Mihos & Hernquist, 1996; van Dokkum et al., 1999; Hopkins et al., 2006). However, the component of galaxies through which the impact of galaxy interactions is most easily seen is the neutral hydrogen (Hi) envelope, which is known to often extend farther than the stellar disk. In fact, observations of several nearby galaxies exhibiting Hi envelopes revealed signs of interactions with either their environment (e.g., Vollmer et al., 2008; Kenney et al., 2014), or with other galaxies (e.g., Hibbard & van Gorkom, 1996). One of the best examples of these galaxies is arguably the M81 group, whose main galaxy members (M81, M82 and NGC 3077) seem to share a common Hi envelope although their optical disks are distinct.
The M81 group has been the subject of many Hi observational studies over the last two decades. However, most of these studies either focused on individual galaxies in the group at high angular resolution (e.g. THINGS; Walter et al., 2008), or covered a large field of view but lacked angular resolution (e.g. GBT observations, Chynoweth et al., 2008, 2009). The first high resolution (), wide field () map of the group was obtained by Yun et al. (1994) with the VLA telescope, and revealed Hi complexes in the system down to Hi mass limits of . However, the velocity resolution (10.3 km s-1) and Hi column density sensitivity () of the observations conducted by the authors are limited, compared to the above-mentioned THINGS and GBT observations. Recently, a higher resolution VLA map111VLA data publicly available at http://www.astron.nl/~blok/M81data/ of the system was presented by de Blok et al. (2018), where the discovery of a number of kpc-sized low-mass Hi clouds in the vicinity of the M81 complex was reported. The authors achieved a high column density sensitivity level, with a mass detection limit of a few times ; but like in Yun et al. (1994) and the GBT observations, the area covered in these observations only includes the complex and the dwarf galaxy NGC 2976 located south-west of the complex. The map presented by Yun et al. (1994) revealed a filamentary structure located west of M81 (but not connected to the complex), and spanning a length of only kpc. In the subsequent high sensitivity map of Chynoweth et al. (2008) with the GBT, the filament appeared to connect the complex to NGC 2976. However, due to the limited resolution of the GBT ( kpc), it was impossible to resolve the individual clouds and as a result, it was not clear whether the apparent filament was made of discrete clouds or of a long single tail connecting the two structures. The recent observations of de Blok et al. (2018) provided a partial answer to these questions, showing that the filament is in fact a series of discrete clouds connected to the M81 system, but not to NGC 2976. However, the lowest contour in the authors’ total Hi intensity map is . It is quite likely that an increased sensitivity could allow the detection of a more extended Hi filament, possibly connecting to NGC 2976.
To date, none of the existing deep Hi observations has ever covered an area of the group wide enough to include both the M81 system and the distant eastern member of the group, IC 2574. Located at a projected distance of 193 kpc from the centre of M81 group, the galaxy IC 2574 has a systemic velocity coinciding with that of the M81 system, which suggests a possible kinematical association with the system. Moreover, the existence of an “optically dark” galaxy – HIJASS J1021+68 – located west of IC 2574 has been reported in the recent blind Hi HIJASS survey (Hi Jodrell All-Sky Survey, Boyce et al., 2001). This hints at the existence of more low density clouds in the space between the M81 system and IC 2574, and a possible Hi connection of the two entities through discrete clouds. A detection of such clouds, which is only achievable through deep Hi observations, could offer new insights into the dynamics of the galaxy members of the M81 system.
The present observations aim, primarily, at not only making a full census of the Hi clouds around the M81 system and in the region extending towards IC 2574, but also mapping at a high resolution the full extent of the Hi streamers, filaments and tails connecting the main group members. We use the Synthesis Telescope (ST) of the Dominion Radio Astrophysical Observatory222https://www.nrc-cnrc.gc.ca/eng/solutions/facilities/drao.html (DRAO) to map, at high resolution and column density sensitivity, the Hi in and around the M81 complex, including the area located East of the complex and extending out to include the galaxy IC 2574. A total of 30 fields were observed (including archival data), covering an area of 25 squared degrees at a spatial resolution of , which, at the distance of M81 (3.63 Mpc, Karachentsev et al., 2004), corresponds to kpc. This resolution is times lower than that of de Blok et al. (2018), but the achieved sensitivities are sensibly similar.
To achieve an even higher sensitivity than the previous VLA observations, we smooth the DRAO observations to a lower spatial resolution, in an attempt to not only extend the filament between the system and NGC 2976, but also detect any previously undetected gas cloud lying in the vicinity of M81. In fact, numerous high velocity clouds have been detected around M81 (and in the NGC 2403 group) in a GBT observational campaign of the region conducted by Chynoweth et al. (2008), Chynoweth et al. (2009) and Chynoweth et al. (2011), down to an Hi mass limit of a few times . However, when compared to cosmological N-body simulations, Chynoweth et al. (2011) found that the number of detected Hi clouds is significantly lower than predicted by the simulations. Moreover, the authors found a mismatch between the simulated minihalos and the phase space of the observed clouds. The implication of these results is that there must exist a vast population of smaller (<10 kpc) Hi clouds not resolved by the GBT, likely generated by the galaxies themselves and through tidal stripping caused by galaxy interactions. This is confirmed by the de Blok et al. (2018)’s observations where the authors reported the detection of newly discovered kpc-sized low-mass Hi clouds with masses of a few times . This constitutes an evidence that increasing the sensitivity of the data can lead to an increase of the number of new detections.
This paper, which is the first of a series, presents the global results of the deep Hi survey of the M81 group. We present here the distribution and kinematics of the Hi gas in the group, and present global Hi properties of the main group members. In forthcoming papers, we will investigate more deeply the local properties of the Hi, especially the Hi in the discrete clouds, and study the connections between the galaxies. The present paper is organised as follows: in Section 2 we describe the observations conducted with the DRAO ST and the data reduction method. Next, we present the Hi profiles of the M81 system member galaxies and the Hi maps obtained from the observations in Section 3 where we discuss the new features. A kinematical study of the M81 group is presented in Section 4, and we discuss the possible dynamical evolutions of the main galaxies of the group in Section 5. Finally, we summarise our results and give brief conclusions in Section 6.
2 Observations and data reduction
2.1 Observations
The observations were conducted between 2016 and 2018 using the DRAO telescope. The goals of the observations are as follow: i) detect and better resolve Hi streamers, filaments and tails that connect group members over a larger area of the group than the existing Hi maps, ii) follow up on the 9 Hi clouds discovered in the GBT studies (Chynoweth et al., 2008, 2011) to better resolve them and clarify their relationship with the galaxies and intergalactic Hi, and iii) add to the number of newly detected Hi clouds in the M81 group, and search among these for possible candidate Hi clouds associated with dark matter minihaloes, or new clouds analogous to the enigmatic population in the M31-M33 system (Wolfe et al., 2013; Wolfe et al., 2016).
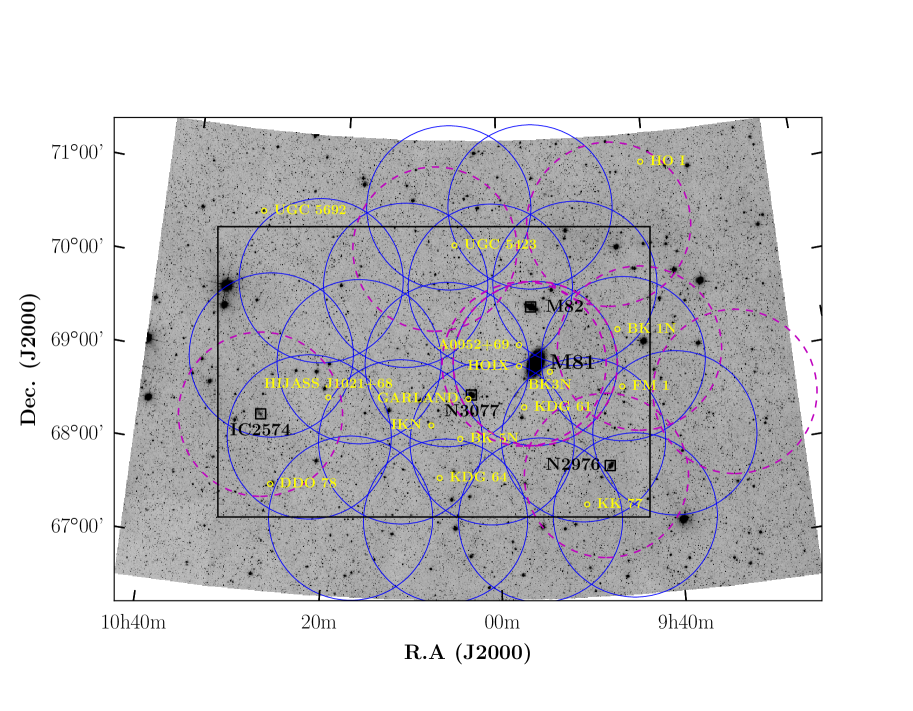
With a primary beam full-width at half-power of in the 21cm, the DRAO ST consists of 7 antennas of 9m diameter each, arranged such that they form an east-west baseline with a maximum separation of 617.1m (see Landecker et al., 2000, for telescope specifications). The telescope was used to observe, at 1420 MHz, a total of 20 fields (for 144 hrs each) centred on a 25 region including the M81 complex, IC 2574 and NGC 2976. Moreover, 10 additional fields (with four centred on two different coordinates) were recovered from the DRAO archive and added to the observed data to increase the SNR in certain key areas (around M81, IC 2574, NGC 2976, and the area between M81 and NGC 2976). In Table 1 we give the centre coordinates of each of these fields, which are overlaid on an optical WISE (Wright et al., 2010) W1 grayscale image of the region in Fig. 1. With a spacing of , the centres of the 20 individual observed fields were chosen to give a uniform sensitivity across the region containing the major galaxy members of the group, while allowing to look for Hi in clouds and filaments connecting and bridging galaxy members. It also allows to search for more widespread massive Hi clouds associated with the DM halos of the group, whose existence is predicted by numerical simulations and expected to lie within 1 Mpc of the major DM haloes (Blitz et al., 1999). Upcoming observations with the DRAO ST will increase the sensitivity in the eastern region of the mosaic, around the galaxy IC 2574.
The spectrometer used for the observations provides a 4 MHz bandwidth distributed across 256 channels, which corresponds to a channel width of 3.3 km s-1 for a spectral resolution of about 5.3 km s-1. The observations were centred on the velocity km s-1, which is approximately the central velocity of the complex, and cover the range km s-1 to 382 km s-1. The working observed noise at the field centres was on average 1.35 K per channel (or per channel) and varied only by 0.07 K from field to field. The archived fields are all centred on 0 km s-1 velocity and although they do not capture the entire velocity width of Hi from the M81 system, after reprocessing to the same spatial and velocity resolution as the 20 new fields, they have similarly low rms noise levels in the range of K per channel. Six of these fields (all except HP03, JG5, JG6 and MB) have a bandwidth of 1 MHz and originally spanned only 64 channels, ranging in velocity from about km s-1 to 105 km s-1. The field HP03, like the present observations, has a bandwidth of 4 MHz, covering the range km s-1 to 422 km s-1. JG5 and JG6 were observed using the 2 MHz bandwidth, making their velocity coverage to 211 km s-1. As for the field MB, the bandwidth is 0.5 MHz and also centred on 0 km s-1, which corresponds to the narrower range of about km s-1 to 53 km s-1.
As an interferometer, the ST is limited in its ability to accurately recover the fluxes of large scale structures, i.e those at angular sizes larger than , as given by the telescope’s shortest baseline of 12.9m. To compensate for this, single dish observations are combined to interferometric observations to perform a short-spacing correction. In this work, we used single-dish data from the 100m Effelsberg telescope obtained as part of the EBHIS Hi survey (Winkel et al., 2016) to apply this short-spacing correction to the ST observations. The EBHIS data have a spatial resolution of and a full spectral resolution of 1.44 km s-1, and covers our whole field both spatially and in velocity.
| Field ID | J2000 position | Obs. date | range | rms | ||||||
| R.A | Dec. | (YYYY/MM) | (′′) | (∘) | (MHz) | (km s-1) | (km s-1) | (km s-1) | () | |
| (1) | (2) | (3) | (4) | (5) | (6) | (7) | (8) | (9) | (10) | |
| MG1 | 09:55:33.17 | +69:03:55.0 | 2015/09 | -90.8 | 4.0 | 3.30 | 5.28 | -459 – 382 | 8.40 | |
| MG2 | 09:44:48.11 | +69:03:55.0 | 2015/09 | -81.4 | 4.0 | 3.30 | 5.28 | -459 – 382 | 8.24 | |
| MG3 | 09:50:10.64 | +69:55:06.6 | 2015/10 | -91.9 | 4.0 | 3.30 | 5.28 | -459 – 382 | 7.90 | |
| MG4 | 10:00:55.70 | +69:55:06.6 | 2015/10 | -86.3 | 4.0 | 3.30 | 5.28 | -459 – 382 | 7.77 | |
| MG5 | 10:06:18.23 | +69:03:55.0 | 2016/01 | -101.4 | 4.0 | 3.30 | 5.28 | -459 – 382 | 8.22 | |
| MG6 | 10:00:55.70 | +68:12:43.4 | 2016/01 | -94.4 | 4.0 | 3.30 | 5.28 | -459 – 382 | 7.99 | |
| MG7 | 09:50:10.64 | +68:12:43.4 | 2016/01 | -90.2 | 4.0 | 3.30 | 5.28 | -459 – 382 | 8.23 | |
| MG8 | 10:11:40.76 | +69:55:06.6 | 2015/11 | -94.0 | 4.0 | 3.30 | 5.28 | -459 – 382 | 8.12 | |
| MG9 | 09:39:25.58 | +68:12:43.4 | 2016/06 | -74.6 | 4.0 | 3.30 | 5.28 | -459 – 382 | 8.52 | |
| MG10 | 10:06:18.23 | +70:46:18.2 | 2016/06 | -76.8 | 4.0 | 3.30 | 5.28 | -459 – 382 | 8.14 | |
| MG11 | 09:44:48.11 | +67:21:31.8 | 2016/06 | -81.9 | 4.0 | 3.30 | 5.28 | -459 – 382 | 8.56 | |
| MG12 | 09:55:33.17 | +70:46:18.2 | 2016/06 | -84.1 | 4.0 | 3.30 | 5.28 | -459 – 382 | 8.26 | |
| MG13 | 09:55:33.17 | +67:21:31.8 | 2016/08 | -89.5 | 4.0 | 3.30 | 5.28 | -459 – 382 | 8.05 | |
| MG14 | 10:06:18.23 | +67:21:31.8 | 2016/08 | -88.8 | 4.0 | 3.30 | 5.28 | -459 – 382 | 8.43 | |
| MG15 | 10:11:40.76 | +68:12:43.4 | 2016/08 | -87.1 | 4.0 | 3.30 | 5.28 | -459 – 382 | 8.12 | |
| MG16 | 10:17:03.29 | +69:03:55.0 | 2016/09 | -81.7 | 4.0 | 3.30 | 5.28 | -459 – 382 | 8.43 | |
| MG17 | 10:22:25.82 | +69:55:06.6 | 2016/10 | -84.1 | 4.0 | 3.30 | 5.28 | -459 – 382 | 8.28 | |
| MG18 | 10:17:03.29 | +67:21:31.8 | 2016/10 | -88.6 | 4.0 | 3.30 | 5.28 | -459 – 382 | 8.41 | |
| MG19 | 10:22:25.82 | +68:12:43.4 | 2016/11 | -83.9 | 4.0 | 3.30 | 5.28 | -459 – 382 | 8.09 | |
| MG20 | 10:27:48.35 | +69:03:55.0 | 2017/01 | -68.0 | 4.0 | 3.30 | 5.28 | -459 – 382 | 7.70 | |
| HP03∗ | 09:55:33.17 | +69:03:55.0 | 2014/03 | -79.1 | 4.0 | 3.30 | 5.28 | -422 – 422 | 7.48 | |
| JG5∗ | 09:55:33.17 | +69:03:55.0 | 2012/07 | -74.5 | 2.0 | 1.65 | 2.64 | -211 – 211 | 8.80 | |
| JG6∗ | 10:28:23.48 | +68:24:44.0 | 2012/07 | -94.7 | 2.0 | 1.65 | 2.64 | -211 – 211 | 8.32 | |
| NN∗ | 09:45:20.69 | +70:32:11.3 | 2009/05 | -92.7 | 1.0 | 0.84 | 1.32 | -105 – 105 | 8.01 | |
| PO∗ | 10:08:02.65 | +70:19:16.1 | 2010/12 | -102.5 | 1.0 | 0.84 | 1.32 | -105 – 105 | 8.01 | |
| PP∗ | 09:47:46.22 | +67:48:35.4 | 2010/11 | -92.1 | 1.0 | 0.84 | 1.32 | -105 – 105 | 8.91 | |
| MB∗ | 09:56:54.88 | +69:03:50.5 | 2005/07 | -67.2 | 0.5 | 0.41 | 0.66 | -53 – 53 | 8.64 | |
| MB2∗ | 09:56:54.88 | +69:03:50.5 | 2009/01 | -97.1 | 1.0 | 0.84 | 1.32 | -105 – 105 | 8.00 | |
| PM∗ | 09:42:42.72 | +69:09:55.2 | 2011/03 | -87.1 | 1.0 | 0.84 | 1.32 | -105 – 105 | 8.43 | |
| PN∗ | 09:31:48.72 | +68:35:05.2 | 2011/03 | -91.5 | 1.0 | 0.84 | 1.32 | -105 – 105 | 8.47 | |
2.2 Data reduction
Calibration, reduction and data-processing on individual datacubes for each of the fields are undertaken before combining them into a mosaic. The approach used is essentially identical to that developed for the Canadian Galactic Plane Survey (see Section 2.2, Taylor et al., 2003), and also used in Chemin et al. (2009). Hi 21cm line (spectrometer) DRAO ST data are bandpass calibrated immediately post-observation, after correlated UV data are formed. At this stage continuum data are brightness-temperature (total intensity) calibrated through observations of sources 3C48, 3C147, 3C286 and 3C295. The spectrometer data are not initially total-intensity calibrated with these astronomical sources at the same time as the continuum; rather this is done at a later stage. Instead, we first perform a channel-by-channel subtraction of the continuum emission in the datacubes. This is achieved by averaging line-free channels at both ends of each datacube, providing two continuum maps (respectively at the low and high velocity ends) that are then linearly interpolated in the velocity space to obtain the continuum level. This continuum level is then subtracted from each channel map of the datacube, providing a continuum-subtracted datacube that is then calibrated. DRAO field observations are bracketed by observing a set of strong compact and non-time variable calibrator sources (3C48, 3C147, 3C286 and 3C295; see Landecker et al., 2000), and continuum maps in each of the 1420 MHz and 408 MHz bands are flux-density calibrated and phase referenced in the post-processing stages of the data product preparation. We use these calibrated continuum maps to calibrate the Hi line data as discussed below. The second step consists in performing the calibration, for which two continuum maps are created for each individual datacube: one created by CLEANing (around strong sources) a calibrated continuum map of each field obtained in the 30 MHz-wide band of the DRAO, and a second one created by averaging the above-mentioned end-channels continuum maps. A comparison of the fluxes of point sources between these two continuum maps is then performed, allowing to calibrate the fluxes in the cubes. This calibration method provides uncertainties of about 5%. At this point, the individual fields are continuum-subtracted and calibrated, and spatially overlap as shown in Fig. 1. They are then added together following an rms-weighting scheme, to form a single mosaic datacube of pixels in size, where each pixel is wide.
The final step of the reduction consists in adding the single-dish EBHIS data to the DRAO ST data to apply the short-spacing correction. This was done in the image plane, and consisted of smoothing the ST mosaic to the same resolution as the EBHIS data () then subtracting the smoothed mosaic from the EBHIS data to leave the missing structures that the DRAO ST did not detect. The difference cube, essentially containing structures invisible to the ST, was then added back to the full resolution DRAO mosaic. Due to the careful calibration of our interferometer data and the excellent overlap between spatial structures observed by the ST and the Effelsberg telescopes, the final short-spacings corrected DRAO mosaic shows no negative bowls around structures as large as the MW Hi, and as small as the M81/82 galaxies themselves.
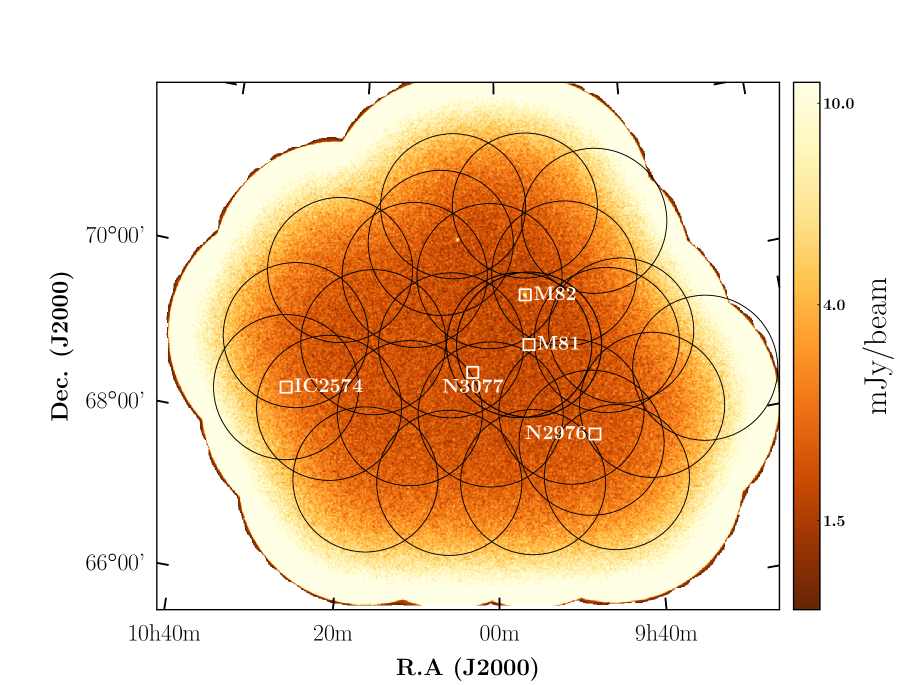
The spectral and spatial resolutions of the short-spacing corrected datacube are 5.2 km s-1 and respectively, with a channel width of 3.3 km s-1 and a pixel size of . The average noise around the M81/82 system is , increasing to around NGC 2976, and reaching around IC 2574. In terms of column densities at a 16 km s-1 velocity width, these noise levels correspond to , and respectively around M81, NGC 2976 and IC 2574. In Fig. 2 we show a sensitivity map of the datacube, derived from the emission-free channels in the cube. The noise values in the map were determined from a total of 41 emission-free channels (out of a total of 244 channels333Twelve of the 256 channels, located at the edges of the cube, were removed because of strong artefacts.) selected at each spectral end of the datacube. We also overplot in the figure the different DRAO ST fields used for the mosaic.
To increase the column density sensitivity of the observations, we have also produced a smoothed version of the cube, with a lower angular resolution of . At the distance of M81, this translates to a physical resolution of 1.9 kpc. This low resolution cube has a spatial resolution of , and a velocity resolution of 5.2 km s-1. Like the full-resolution cube, it also has a channel width of 3.3 km s-1. The average noise in the cube is around the M81 system, which translates to a column density sensitivity of at a velocity width of 16 km s-1. Because of its higher sensitivity, we will only use this smoothed version of the cube for the rest of the analysis in this paper.
2.3 Milky Way emission
A major problem with mapping the Hi in galaxies at low systemic velocity is the contamination from the Milky Way (MW). Several techniques exist to remove the MW’s foreground Hi from observations, ranging from manual mitigations to statistical methods (e.g. Sofue & Reich, 1979). Chynoweth et al. (2008) performed, in their work, a spectral interpolation of the signal-of-interest over the contaminated channels, allowing to “guess” the shape of the target emission in these channels. Although this technique provides an acceptable representation of the targeted emission, it does not provide an accurate description of the global profile of the emission, especially for high spectral (and spatial) resolution.
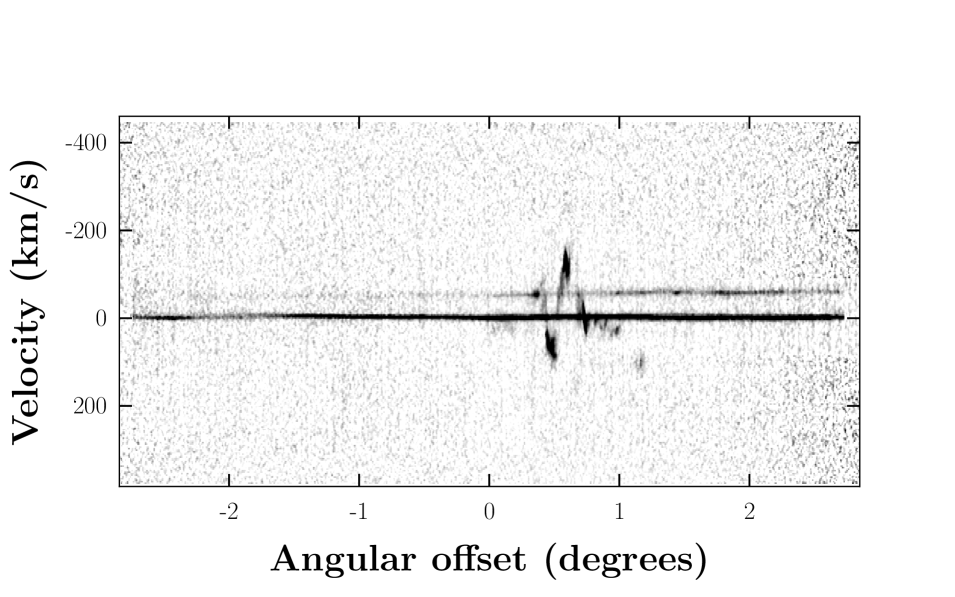
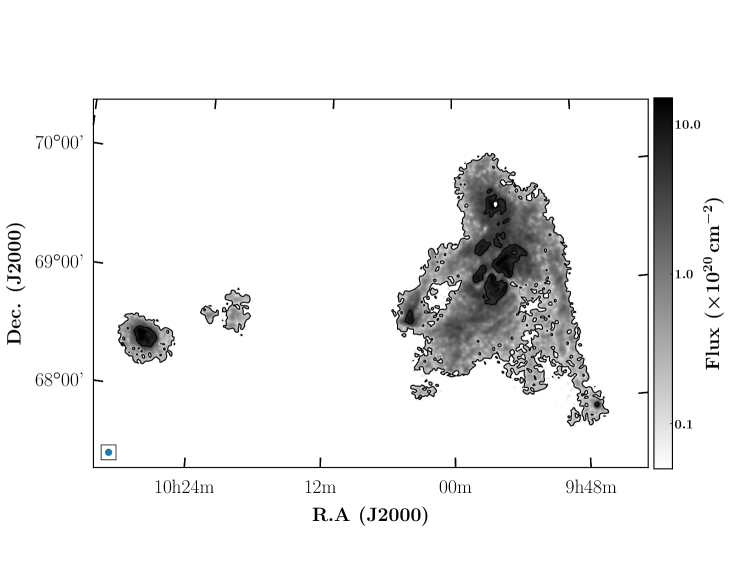
The technique used in the present work is somewhat similar to that described in Chemin et al. (2009), and consists of subtracting a modelled MW emission from the observations. We started by identifying the channels affected by the MW emission and found a total of 24 channels, covering the velocity range km s-1 to km s-1 and km s-1 to km s-1. In Fig. 3 we present a position-velocity diagram obtained by considering a horizontal slice cutting through the centre of M81, which illustrates the two peaks of the MW emission at km s-1 and km s-1, respectively. Next, we constructed a total Hi intensity (zeroth moment) map from the MW-free channels, based on a mask created using the “smooth and clip” method described in Section 3.2 below. This MW channels-free intensity map, presented in Fig. 4, was obtained by blanking the above-mentioned 24 channels affected by MW emission. The map was then used as a mask to identify and blank the emission of the M81 system from the data. This means that any pixel in the contaminated channels that has a non-zero value in the constructed moment map was blanked. This leaves us with a datacube which has no M81 emission in the MW-contaminated channels. In a subsequent step, we used a two-dimensional gaussian kernel of standard deviation equals to (equivalent to about 2.3 beams) to interpolate from the non-blanked pixels and replace the previously blanked pixels that presumably represent the emission from the M81 system. Kernels of smaller sizes were found to poorly model the MW emission and therefore produce artefacts in the inner regions of the M81 system, and larger sizes sensibly provide similar results. The interpolation is done individually for all the planes that are MW-contaminated and, in theory, fills the M81 pixels (i.e, pixels that belong to the M81 system) with Galactic foreground emission. Given the high level of foreground contamination of the data, it is best to rule all emission in the affected channels and outside the M81 system as noise or galactic foreground emission. Therefore, the pixels in the affected channels that lie outside M81 (i.e, the pixels outside the moment map) can be discarded by either setting them to zero, or to a pure statistical noise value. In practice, the second option is equivalent to replacing these pixels with their counterparts from emission-free channels selected outside the velocity range of M81. This produces a datacube in which the MW emission is almost completely removed.
An inspection of the resulting cube showed that the procedure described above successfully mitigated most of the foreground Hi in the data. However, because of the zero spacing correction of the data, the entire planes of a few channels (where the foreground emission peaks) were completely covered with bright MW emission. No emission from the M81 system could be detected in these channels because of their low flux relative to the Galactic Hi. The applied technique did not succeed at completely removing the foreground emission in these channels due to its relatively high brightness, especially at projected regions around the M82 galaxy and in the northern parts of the western arm of the complex where residual emission are seen. This is partly because the spatial region spanned by the M81 system (masked before modelling the MW emission) represents an important part of the area covered by the mosaic. This therefore lowers the accuracy of the constructed model, resulting in a poor subtraction of the MW in certain regions. However, given the limited number of affected channels and regions, this does not significantly impact the overall global Hi properties of the system.
3 Hi distribution in the system
3.1 Major galaxies of the group
The major three galaxies of the group have been the target of numerous studies in several bands, which helped to shed light on their structure and properties. The general picture of the group is the MW-like galaxy M81 with a stellar mass of interacting with M82 and NGC 3077 of stellar masses and respectively. Their optical properties, as well as those of the other two massive members of the group (NGC 2976 and IC 2574), are listed in Table 2. Being the most massive galaxy in the group, M81 (NGC 3031) is a prototypical grand design spiral galaxy. Optical HST observations of the galaxy (Chandar et al., 2001) have revealed the presence of a young, blue cluster population, whose formation appeared to have begun about 600 Myr ago as a result of the galaxy’s interaction with its counterparts. Later, Davidge (2009) found that the specific SFR in the M81 disk is consistent with that expected for an isolated galaxy of a similar mass, indicating that the SFR in M81 has not significantly increased in the past few tens of millions of years. The second largest galaxy M82 (NGC 3034) is a starburst galaxy at a distance of 3.5 Mpc (Jacobs et al., 2009), host of several reported supernovae (Mattila et al., 2013; Gendre et al., 2013) including the recently discovered bright, Type Ia supernova SN 2014J (Goobar et al., 2014). It is a well studied edge-on galaxy, classified as an irregular galaxy in the RC3 catalogue (de Vaucouleurs et al., 1991) but probably more an SBc (Mayya et al., 2005), and provides a good laboratory to study in great detail the properties of the neutral and molecular gas (e.g., Yun et al., 1993; Neininger et al., 1998; Matsushita et al., 2005). Walter et al. (2002b) detected molecular streamers in and below the M82’s disk, whose structures provide evidence that the molecular gas within the optical disk of the galaxy is disrupted by the interaction with M81. This further confirms an earlier claim by Sofue (1998), who described M82 as a low-mass galaxy with a strong central concentration of mass and hardly any evidence for a dark matter halo. The smallest of the three galaxies, NGC 3077, was found to have lost its gas during a close encounter with M81 (e.g., Brouillet et al., 1991; Thomasson & Donner, 1993; Yun et al., 1993) and high resolution observations show that as much as 90% of the galaxy’s atomic gas is situated in a prominent tidal arm (Walter et al., 2002a).
| Object | J2000 position | Type | Distance | P.A | Incl. | ||||
| R.A | Dec. | (Mpc) | (mag) | () | (′) | (∘) | (∘) | ||
| (1) | (2) | (3) | (4) | (5) | (6) | (7) | (8) | (9) | |
| M81 | 09 55 33.2 | 69 03 55.1 | SAab | 3.63 | 7.89 | 63.8 | |||
| M82 | 09 55 52.7 | 69 40 45.8 | SBca | 3.53 | 9.30 | 12.1 | |||
| NGC 3077 | 10 03 19.1 | 68 44 02.1 | Smb | 3.82 | 10.61 | 2.1 | |||
| NGC 2976 | 09 47 15.5 | 67 54 59.0 | SAc pec | 3.56 | 10.82 | 1.2 | |||
| IC2574 | 10 28 23.5 | 68 24 43.7 | SABm | 4.02 | 10.80 | 0.4 | |||
3.2 Global Hi profiles and moment maps
To compute the global profile of the total Hi in the field and the moment maps, we first built a mask of the datacubes. This was done using the smooth and clip algorithm of the SoFiA pipeline (Serra et al., 2015). The pipeline takes as input the (MW-subtracted) datacube and a weight map of the field, computed by taking the inverse of the rms noise at each spatial position of the cube. The data presented a long horizontal artefact below the system and east of NGC 2976, so this region was flagged in the masking process. The algorithm creates different convolved versions of the cube, and for each of them builds a mask using a user-defined threshold. These masks are later combined into a single, final mask which, in principle, contains both the bright and low-column density structures. Because of the non-uniformity in the distribution of the noise throughout the cube, we used the median absolute deviation (MAD) method on the negative side of the flux histogram to derive the noise in the data. This method computes the noise from the negative voxels only, which are less likely to contain real emission. We performed extensive tests and found that the MAD method provides a more robust measure of the noise than the standard deviation. We also found that the optimum mask is obtained with a combination of six smoothing kernels, which convolve each the data to resolutions equal to 1, 2 or 3 times the original resolution along either the spatial or spectral axes. The convolution process of the data uses a Gaussian kernel along the spatial axes, and a boxcar kernel along the spectral axis. The detection threshold at each of these resolutions is , where is the noise level at the given resolution determined using the above-mentioned MAD method. During the merging phase of the detected pixels into individual sources, we have required that only sources spanning at least 10 channels (33 km s-1) be retained. This ensures that noise peaks spanning a few channels are discarded. An additional test was made with a lower velocity constraint of 23 km s-1, but no new feature was discovered. Furthermore, we have used the reliability module of the package (illustrated in Serra et al., 2012) to evaluate the reliability of the different sources from the distribution of their “positive” and “negative” detections. The positive (negative) detections are defined as having a total positive (negative) total flux. Then we required that sources with a reliability less than 90% be discarded. A masked version of the datacube was created by applying the resulting mask to the data, and the total Hi intensity map (zeroth moment), the intensity-weighted velocity field (first moment) and the velocity dispersion map (second moment) were computed from the masked data using the moment task in Miriad (Sault et al., 1995). Also, the global Hi profiles of the field were computed by integrating all fluxes within each plane of the masked data.
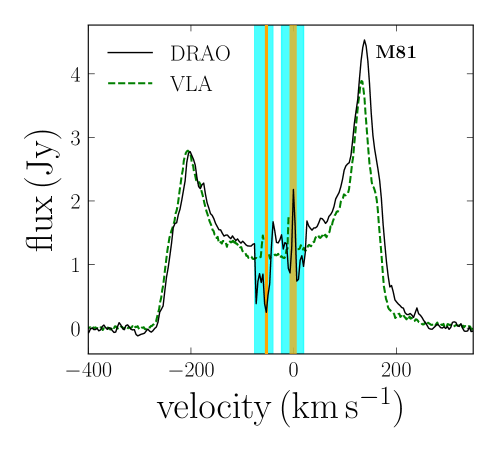
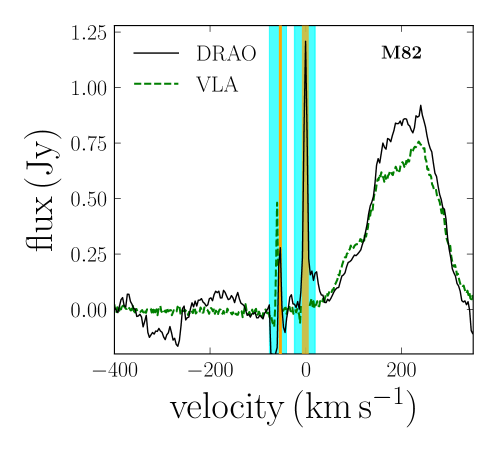
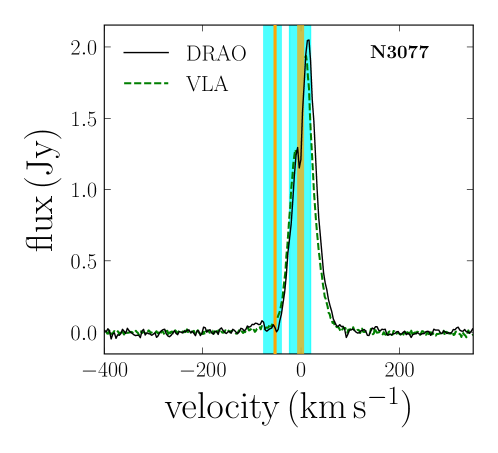
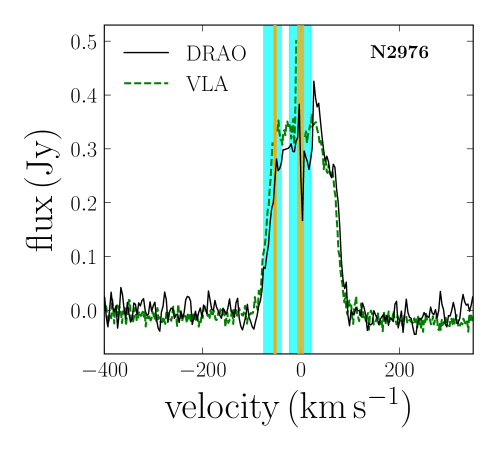
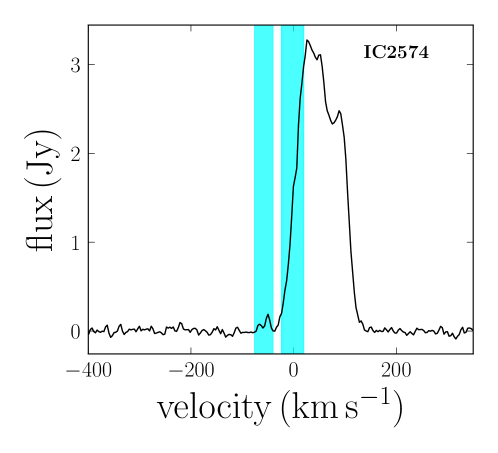
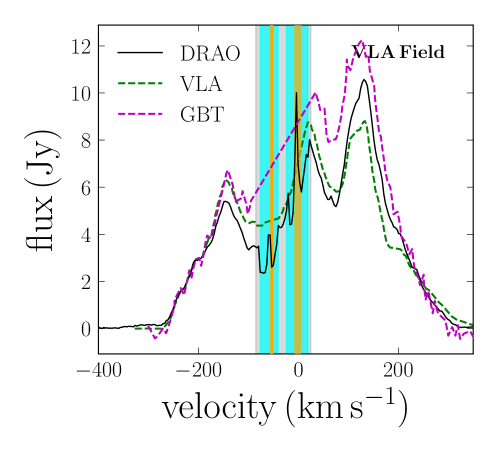
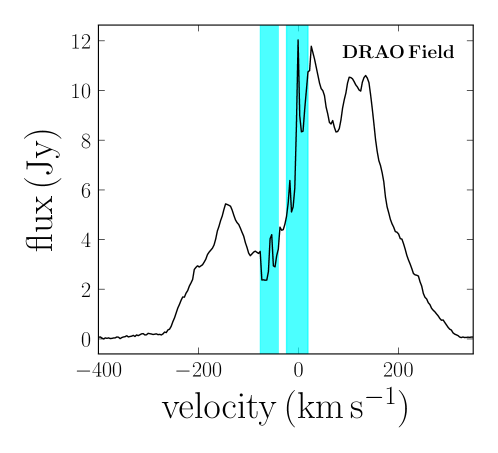
In Fig. 5 we show the integrated Hi profiles of each of the major galaxies in the field-of-view; for comparison, we overplot in the figure the Hi profiles (of the galaxies in the VLA field-of-view) derived from the VLA D-array data. The profiles were extracted within ellipses corresponding to the optical size of the galaxies. We also show in the figure, a comparison of the Hi profiles of the DRAO mosaic, VLA D-array mosaic (de Blok et al., 2018) and GBT (Chynoweth et al., 2008) observations, integrated over the same area: the field-of-view of the VLA mosaic. The profiles show an agreement between the DRAO and VLA data for most of the galaxies, except for M82 where DRAO recovers more flux than the VLA. This is because, unlike the VLA D-array data, the DRAO data is zero-spacing corrected and is therefore more sensitive to large-scale, faint structures that exist around M82. It is worth noting that the VLA+GBT mosaic of de Blok et al. (2018) also showed the presence of diffuse gas around the galaxy. Because of the continuum at the centre of M82, any emission or absorption at the core of the galaxy is not reliable; we therefore blanked the inner of the galaxy prior to deriving the Hi profile. In fact, the bright core of M82 seemed to have phase errors associated with it, which causes baseline variations in the data. Since this is not well modelled by the linear continuum baseline that was fitted and subtracted from the data, the values of the fluxes in this part of the galaxy were found to be inaccurate.
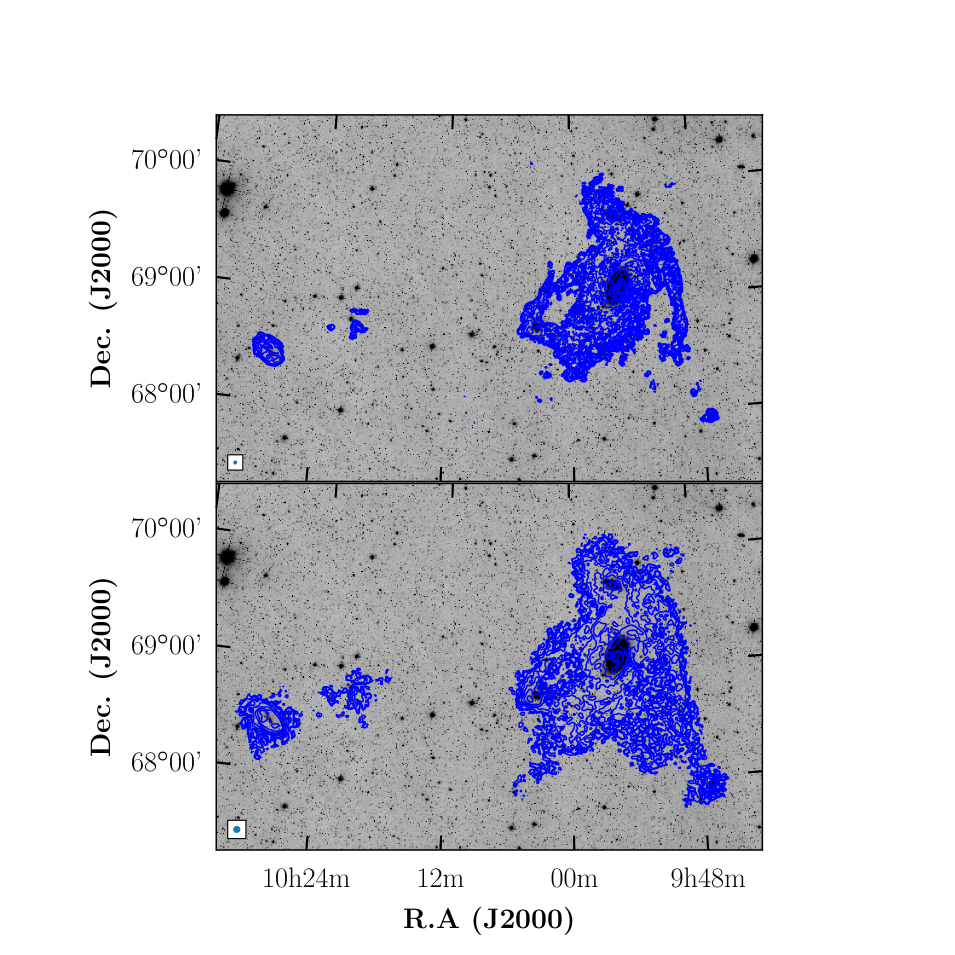
The total Hi intensity map of the system, computed from the full resolution and smoothed resolution datacubes, are presented in Fig. 6. The western arm of the system is found to extend as far as to NGC 2976. The projected length of the arm is , which corresponds to a physical size of kpc at the distance of M81, and has an Hi mass of . Moreover, numerous intergalactic Hi clumps were detected in the region between the “main body” of the system and the arm. The previous GBT map revealed an extended cloud of gas in the region (the so-called “Cloud 3” of Chynoweth et al. 2008), and the subsequent VLA D-array map of de Blok et al. (2018, Fig. 11 therein) also showed Hi clouds at that position, connecting to the arm. What is new in the present map is that more small clouds are detected in the area, and they tend to fill the space between the arm and the south-western side of M81.
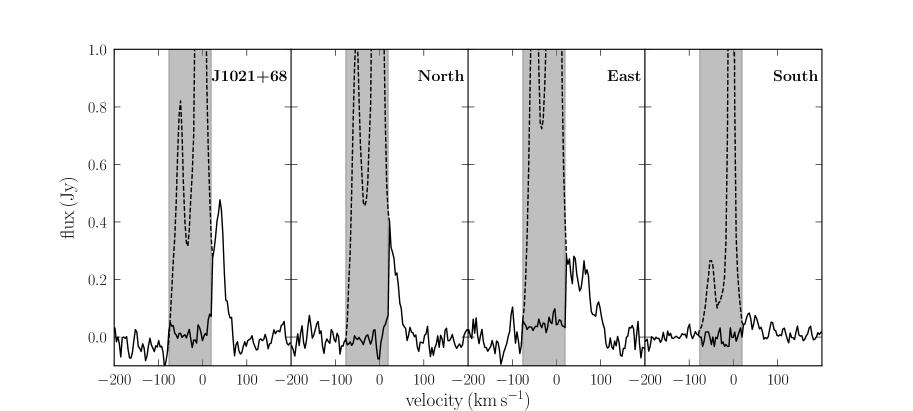
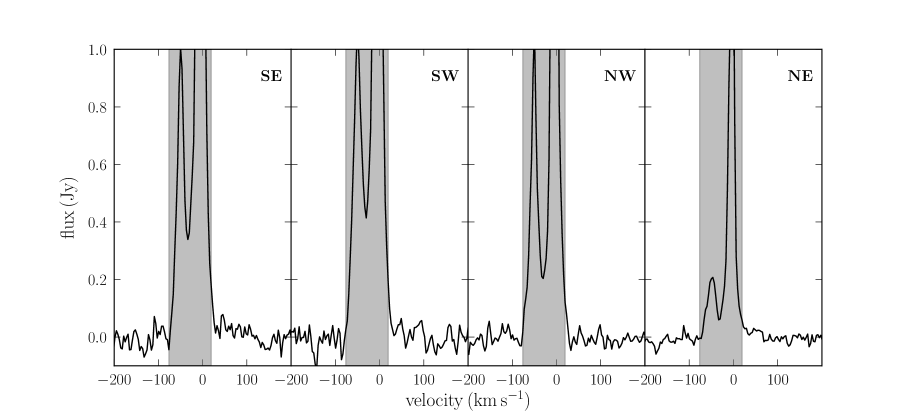
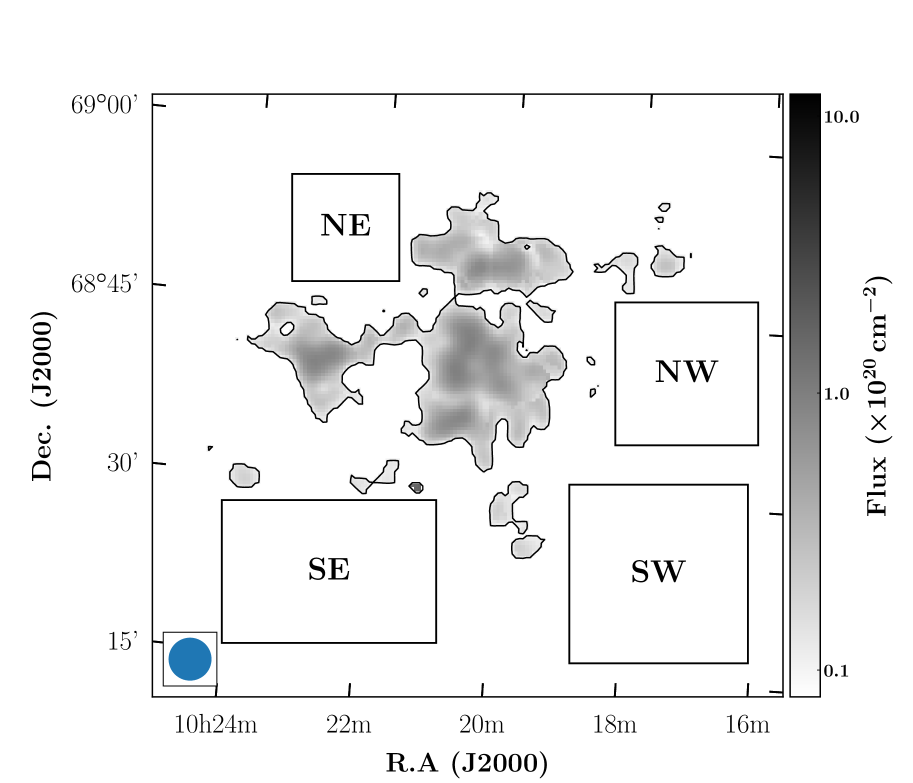
The primary aim of the present DRAO observations is to make a complete census of Hi clouds around the M81 system, and in the space between the system and IC 2574. At a projected distance of 46.5 kpc west of IC 2574, we detected the previously catalogued dwarf galaxy HIJASS J1021+68 (Boyce et al., 2001; Lang et al., 2003) which is not optically detected. The galaxy, which was previously observed to be a single concentration, appears to be surrounded by Hi clouds of various sizes. It also appears to be connected to IC 2574, as was suggested by Boyce et al. (2001). However, unlike the single-dish observations, the high resolution DRAO mosaic allows to resolve the connection between the two galaxies, and it is clear in Fig. 6 that there exists a “filament”-like complex of clouds connecting the two galaxies. In Fig. 7 we show the Hi profile of HIJASS J1021+68, as well as those of the neighbouring clouds. Although the systemic velocities of the clouds – and that of the dark galaxy as well – coincide with the MW emission, the profiles show that they are located in spectral regions that are not greatly affected by MW emission and therefore did not require a MW subtraction. However, the position of the peak emission of these clouds with respect of the MW emission suggests that they may just be wings of broader MW emission. To ensure that these structures are not just an extension of the Galactic emission, we have extracted the profiles of four “control” regions of various sizes, at various positions around HIJASS J1021+68. These “control” profiles are shown in Fig. 8, and the respective regions they are extracted from are represented by boxes in Fig. 9. Contrarily to the profiles of HIJASS J1021+68 and associated clouds, the control spectra show no presence of broad Hi emission extending outside the MW-subtracted channels, showing that the clouds are most likely real and are not just remnant Galactic emission.
The derived Hi mass of HIJASS J1021+68 is , in agreement with the quoted HIJASS mass of . For the complex of small Hi clouds lying east of the object, which seem to form a “filament” towards IC 2574, we measured a total Hi mass of . The northern cloud of HIJASS J1021+68, which seems to connect to the dark galaxy, has an Hi mass of , and the cloud south to the galaxy has a mass of . A more detailed study of this eastern region of the M81 group will be presented in a subsequent paper.
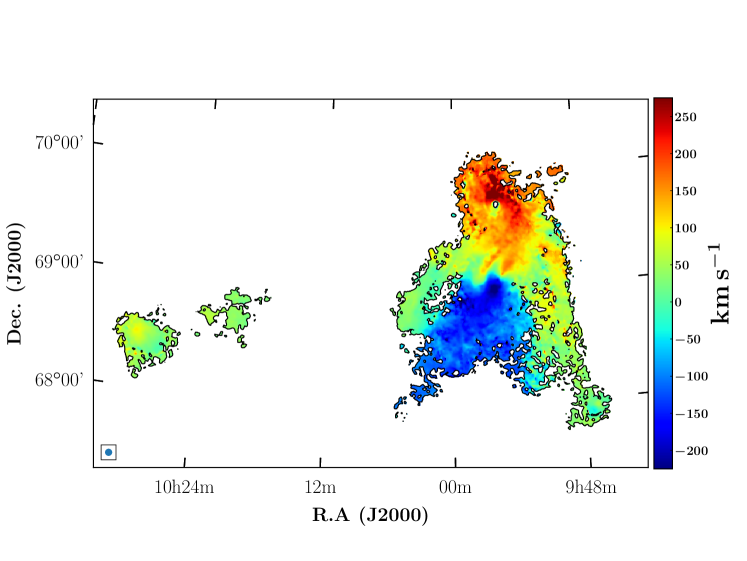
In Fig. 10 we present the velocity field of the complex, computed from the DRAO datacube with the Miriad task moment. As noted in de Blok et al. (2018), the velocity field shows a regular rotation of the disk, especially in the inner regions. Beyond a certain radius (approximately 10 kpc along the minor axis) the rotation of the galaxy is disrupted, especially along its minor axis and towards the position of the dwarf galaxy HoIX. There is little velocity gradient along the western arm, implying that the arm is almost contained in the plane of sky. We also note an arc connecting HoIX to M82, hinting at a kinematical association between the two galaxies. There seems to be a velocity continuity between the western side of IC 2574, the gas cloud HIJASS J1021+68, and the region of the system containing NGC 3077 and the eastern bridge of the system. This, together with the fact that there exists a peak of an apparent cloud in the space between HIJASS J1021+68 and the NGC 3077, may suggest that IC 2574 is not completely isolated from the system.
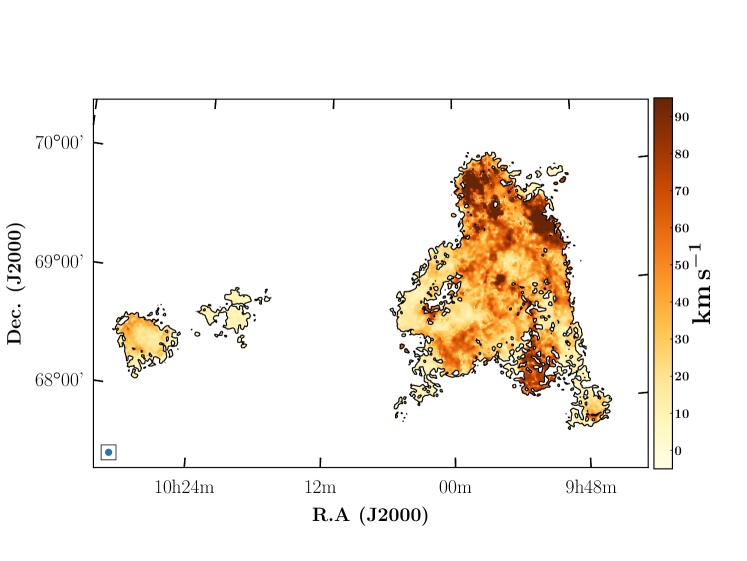
The velocity dispersion map of the group, presented in Fig. 11, shows that the velocity dispersion is, as expected, highest around M82 and in the northernmost region of the western arm. While the dispersion may be intrinsically high around M82, a comparison of the velocity dispersion map with that obtained from the blanked MW channels data has suggested that the high dispersion value in the upper region of the western arm and in the region northeast of M82 is undoubtedly artificial and is likely a result of the MW subtraction.
3.3 Hi masses
The overall Hi detected in the field of the VLA observations, encompassing the M81 system as well as NGC 2976, has a total Hi mass of (at the distance of M81) as derived from the DRAO data. As discussed in de Blok et al. (2018), determining the Hi mass of the individual galaxies in the complex can only be done with a limited accuracy, due to the presence of tidal Hi features that make it impossible to determine their true Hi extent. Several authors (Appleton et al., 1981; Yun, 1999; Chynoweth et al., 2008; de Blok et al., 2018) who have determined the Hi mass of the complex’s members have performed the measurement within the optical disks of the galaxies. Although this method is likely to underestimate the Hi masses (given that the Hi envelope is known to extend father than the optical disk), it provides, at the moment, the best estimate that one can obtain. We use here the optical size () of the different galaxies to derive their Hi mass, which we compare in Table 3 to the values in the literature. We find that the masses derived in this work are higher than those of the VLA D-array of de Blok et al. (2018), but lower than those of Chynoweth et al. (2008). This is consistent with the expectations, given that the DRAO data is corrected for short-spacing unlike the VLA-only data. Also, the values of Chynoweth et al. (2008) are not only derived from a single-dish telescope, but the fluxes of the sources in the MW-affected channels of the GBT Hi datacube are a linear interpolation of the fluxes outside those channels. The masses of Yun (1999) are systematically higher than those measured in the present work, in de Blok et al. (2018), and in Chynoweth et al. (2008). It is not clear what ellipses Yun (1999) measured the Hi masses in, and what the method used for the MW Hi subtraction is. To get an estimate of the uncertainty in the Hi masses, de Blok et al. (2018) measured the masses within a radius of and their obtained masses are still lower than those of Yun (1999). The method adopted to determine the masses of the individual galaxies due to the complexity of the system is highly dependent on the ellipses considered, and the different definitions of the size of the galaxies constitute a source of discrepancy between the different Hi masses.
Also, it is not clear what method the authors used to mitigate the foreground galactic Hi in their data, which covers a non-negligible part of the M81 group. Besides M81, the Hi masses of all galaxies derived in Appleton et al. (1981) are higher than those derived in this work, which may be due to the reasons mentioned above.
The total Hi mass of the galaxies in the M81 system is , whereas the total Hi mass detected in the field is . This implies that only about 31% of the Hi in the region resides in galaxies. The majority of the Hi is in the form of intergalactic gas and “lives” in structures like bridges, tails and clouds.
| Galaxy | () | ||||
| DRAO | dB18 | C08 | Y99 | A81 | |
| M81 | 2.54 | 2.29 | 2.67 | 2.81 | 2.17 |
| M82 | 0.44 | 0.44 | 0.75 | 0.80 | 0.72 |
| NGC 3077 | 0.33 | 0.23 | 1.01 | 0.69 | 1.00 |
| NGC 2976 | 0.14 | … | 0.52 | … | 0.16 |
| Total | 11.2 | 7.74 | 10.46 | 5.6 | 5.4 |
| IC2574 | 1.4 | … | … | … | 1.0 |
| Total+IC2574 | 12.6 | … | … | … | 6.4 |
3.4 Zero-spacing corrected VLA data
The zero-spacing corrected version of the C+D array data presented in de Blok et al. (2018) was obtained using a GBT dataset from Chynoweth et al. (2011). This GBT dataset covers the M81/M82 and NGC 2403 groups, and has a sensitivity of (at a spatial resolution of ) in the area covering the system. However, due to the baseline subtraction procedure used for the GBT data, the zero-spacing corrected VLA cube contains many artefacts in the Galactic velocity range. This makes it hard to apply the MW subtraction technique described in Section 2.3, and the analysis in de Blok et al. (2018) excludes the MW-affected velocity range. Because of the poor overlap between the two datasets in the uv plane (35m to 90m), the data also shows negative bowls around emission peaks, and especially around M82. We therefore re-applied the zero-spacing correction to the VLA data using the Effelsberg EBHIS data of the area covering the M81 galaxies, in order to improve the detection of gas in that region with respect to the analysis made in de Blok et al. (2018). The EBHIS survey is properly Nyquist sampled on the sky, and can be considered “complete” in the sense that it observes all spatial structures down to its resolution limit. Also, the baseline subtraction procedure was done in a better way than the GBT data, such that there are no negative artefacts in the EBHIS data of the M81 region.
The resulting data contains less artefacts, and shows an improvement over the GBT zero-spacing data. The datacube is pixels in size, with a pixel size of and a channel spacing of 2 km s-1. Applying the technique described in Section 2.3, we subtracted the MW emission from the datacube, and used once again the smooth and clip algorithm implemented in SoFiA to build a mask of the resulting datacube. For such a large size of data, SoFiA requires an unusual amount of computing power to work efficiently (see Serra et al., 2015). However, the beam size of the data is , translating to a sampling of more than 6 pixels per beam (along the beam’s major axis). We therefore spatially resampled the cube to about 3.2 pixels per beam, decreasing its size to pixels. This was done with the Miriad task Regrid. The optimal mask, sensitive to low column density emission and extended structures, was obtained from a combination of masks at a clipping level at resolutions (1,1,1), (1,1,2), (2,2,1), (2,2,2) and (3,3,1), where the first two numbers of each triplet represent the multiples of the two spatial resolutions, and the third number the multiple of the velocity resolution. In the masking process, we flagged an aliasing effect that was contained in the VLA mosaic, and appeared East of NGC 3077.
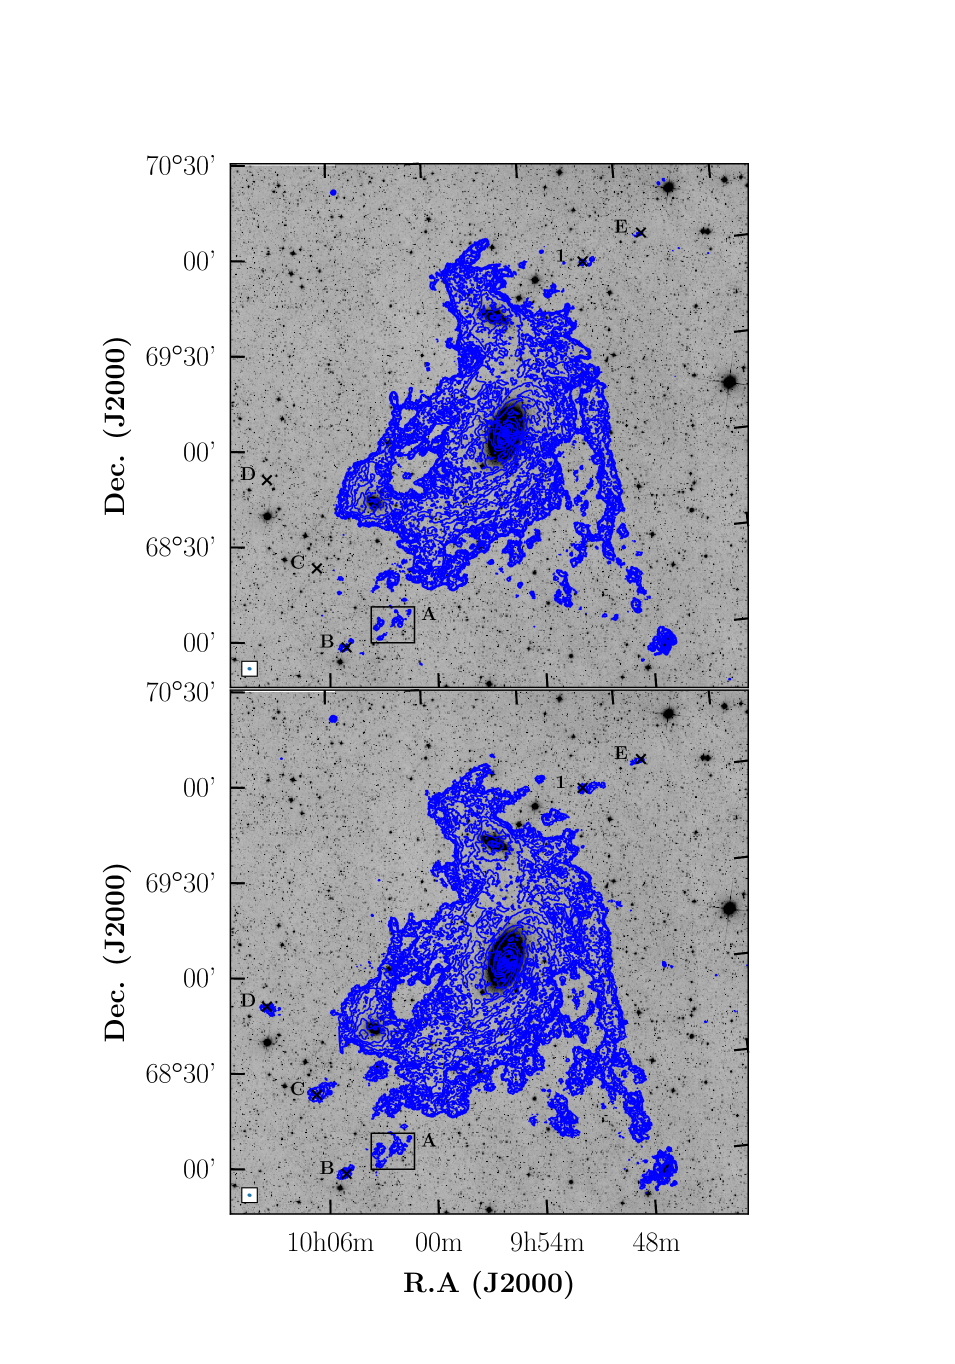
In Fig. 12 we show a comparison of the re-processed VLA+EBHIS data and the GBT zero-spacing (VLA+GBT) data published in de Blok et al. (2018). It is clear that our re-processing of the VLA data with other short baselines has improved the detection of gas with respect to de Blok et al. (2018). In particular, the western arm connected to NGC 2976 is neater, and the emission between that arm and the “main body” of the system is more extended. Also, the C+D map of de Blok et al. (2018) revealed a few low-mass Hi clouds in the vicinity of the system, which they labelled as cloud “1” (North-West of M82), complex “A” and cloud “B” (South of NGC 3077) in their Figure 11. These clouds are found to be more extended in the new “EBHIS-added” mosaic, and we detect two additional clouds east of the system. These additional clouds, which we denote clouds “C” and “D”, appear at velocities of the MW emission and their association to the system is therefore uncertain. However, the peak of cloud “D” appears in the GBT data of Chynoweth et al. (2008) at , but it remains unclear at what velocity the peak is located. At about (translating to a projected distance of about 18 kpc) North-West of cloud “1”, is located a second cloud (cloud “E”) whose peak is seen in the de Blok et al. (2018) data but appears more extended in the combined data. In Table 4 we list the respective Hi masses of the different clouds, and for completeness, we also list the Hi masses from Chynoweth et al. (2008) and de Blok et al. (2018). We note that the VLA+EBHIS Hi masses of the clouds “1” and “B” are intermediate between the VLA-only and the GBT respective masses. The masses measured in the combined mosaic are about 1.5 higher that those measured in the VLA-only mosaic. This confirms that the extended structures of these clouds are not just a resolution effect, but we detect low column density gas that was previously unseen in the VLA+GBT mosaic. The mass of the complex “A” is higher than in both the VLA-only data and the GBT data, which previously detected two clouds and a single overdensity, respectively. In fact, the GBT mass of “A” and “B” listed in Table 4 are masses corresponding to the peak flux of the respective clouds in the GBT map, quoted in de Blok et al. (2018). Therefore, the listed GBT mass of “A” does not necessarily account for the total mass of the 3 individual clouds, and may thus underestimate the total mass. Similarly to the DRAO mosaic, the VLA+EBHIS map of NGC 2976 shows a cloud South-East of the galaxy, and likely associated the galaxy. This cloud, whose peak only appears in the VLA+GBT map, is also seen in the GBT map as a distinct object from NGC 2976.
| Cloud | J2000 position | (Jy km s-1) | () | |||
| RA | Dec | VLA+EBHIS | VLA-only | GBT | ||
| 1 | 09 50 18.3 | 69 56 26.0 | 1.68 | 0.52 | 0.32 | 1.47 |
| Aa | 10 02 23.1 | 68 06 43.3 | 4.72 | 1.48 | 0.48 | 1.2 |
| B | 10 05 05.0 | 67 58 28.9 | 1.52 | 0.47 | 0.32 | 1.2 |
| C | 10 06 42.5 | 68 23 25.1 | 3.18 | 1.00 | … | … |
| D | 10 09 34.2 | 68 51 13.5 | 1.15 | 0.35 | … | … |
| E | 09 46 35.7 | 70 03 57.6 | 0.56 | 1.74 | 0.02 | … |
4 Hi kinematics of the system
Besides the major galaxies M81, M82 and NGC 3077, the existence of several dwarf galaxies has been reported in the immediate vicinity of the M81 group (see e.g., Börngen & Karachentseva, 1982, 1985; Karachentsev et al., 2000; Karachentsev et al., 2004; Chiboucas et al., 2009; Chiboucas et al., 2013), some of which may have formed as a result of tidal stripping (Makarova et al., 2002; de Mello et al., 2008; Sabbi et al., 2008). Obviously, each of these galaxies orbits on its own plane, and are not necessarily contained in the same plane.
The major galaxies of the group are believed to have interacted closely at least once in the past (Cottrell, 1977; van der Hulst, 1979; Yun et al., 1994; Yun, 1999; Okamoto et al., 2015); and the hierarchical model of the CDM cosmology requires that the group was formed through the infall of the individual galaxies. Using semi analytic models, Oehm et al. (2017) investigated the possible orbits of the three major galaxies and found that both or at least one of the galaxies M82 and NGC 3077 started out from far away and was not bound to the central M81 galaxy 7 Gyr ago.
In Fig. 13 we show an interactive 3-dimensional map (inspired by Fig. 4 in Hess et al., 2018) of the DRAO Hi datacube of the M81 group. The volume rendering was produced with the SlicerAstro package (Punzo et al., 2017), which allows the user to manually set the flux in the data. The package contains different modules designed for viewing and analysing Hi line data. To optimise the volume rendering of the M81 cube, we have used a gaussian filter in the AstroSmoothing module to smooth the cube down to a resolution, and have chosen 3 separate intensity ranges to distinguish different components of the complex. These components are represented by different colours and opacities in the figure: the green transparent contours representing the Hi envelope of the complex, the yellow contours showing the intermediate column density component of the system containing the Hi northern and southern tidal bridges connecting the galaxies of the system as well as part of the western arm. This intermediate column density component also reveals a few Hi clouds around the system and IC 2574, and the optically dark galaxy HIJASS J1021+68. Finally, the core objects of the M81 are revealed by the high column density component shown in opaque red in the figure.
It is evident from the figure that the members of the system are not contained in the same plane, with M81 being more inclined than the plane of the envelope engulfing the individual galaxies, and the companion galaxies having different inclinations. However, despite the complexity of the geometry in this inner region of the group and the interactions between the members the common envelope seems to cut through the discs of M81 and M82 around their respective centres and presents little perturbations. Furthermore, the velocity field of the complex in Fig. 10 suggests a large-scale, ordered motion of the galaxies around the M81 galaxy, with the receding northern part that contains M82 and A0952+69 (the Arp’s loop), while the southern part containing KDG61 and pointing towards BK5N and KDG64 approaches the observer. In that large-scale framework, regions at the systemic velocity of the system would contain BK3N, and the arms pointing towards NGC 3077 and Garland (East) and NGC 2976 (West) also at velocities close to systemic would act like prominent wiggles (streaming motions). It is thus tempting to fit an idealised kinematic model to the velocity field, like the usual tilted-ring model. We test that hypothesis in the following section.
4.1 Tilted-ring model
To measure the large-scale rotational pattern, we used the tilted ring model implemented in the Gipsy (van der Hulst et al., 1992) task rotcur (Begeman, 1989). However, unlike for single galaxies whose rotational pattern is easily described by a circular orbit, the complex structure of the M81 group requires an extra caution. This is because the system is made of galaxies of different sizes and not necessarily orbiting in the same plane. Moreover, some of these galaxies are known to be strongly interacting, which is likely to cause non-negligible, non-circular motions that will influence the overall rotation of the large-scale system. Therefore, instead of assuming a circular orbit to describe the gas in the complex as is usually done for individual galaxies, one has to consider an additional radial, non-circular velocity component. The observed velocity is therefore the projection of the rotation and radial velocities along the line-of-sight, and can be written
| (1) |
where , , and are respectively the systemic, rotation and radial velocities, and and are respectively the inclination and the azimuthal angle in the assumed plane of the complex. The latter is function of the position angle of the semi-major axis of the receding side of the system.
The tilted ring model was fitted to the velocity field presented in Fig. 10, with the optical parameters (centre position, position angle and inclination) of M81 as initial parameters. This choice of initial parameters is motivated by the fact that the velocity field is centred on the galaxy, and seems to expand out to the other two major galaxies of the system. With all parameters let free, we derived, in turn, the systemic velocity and dynamical centre of the complex. Because of the particularly complex structure of the system and to be sensitive to the local motions, we used a uniform weighting function where all points in a given ring are given the same weight.
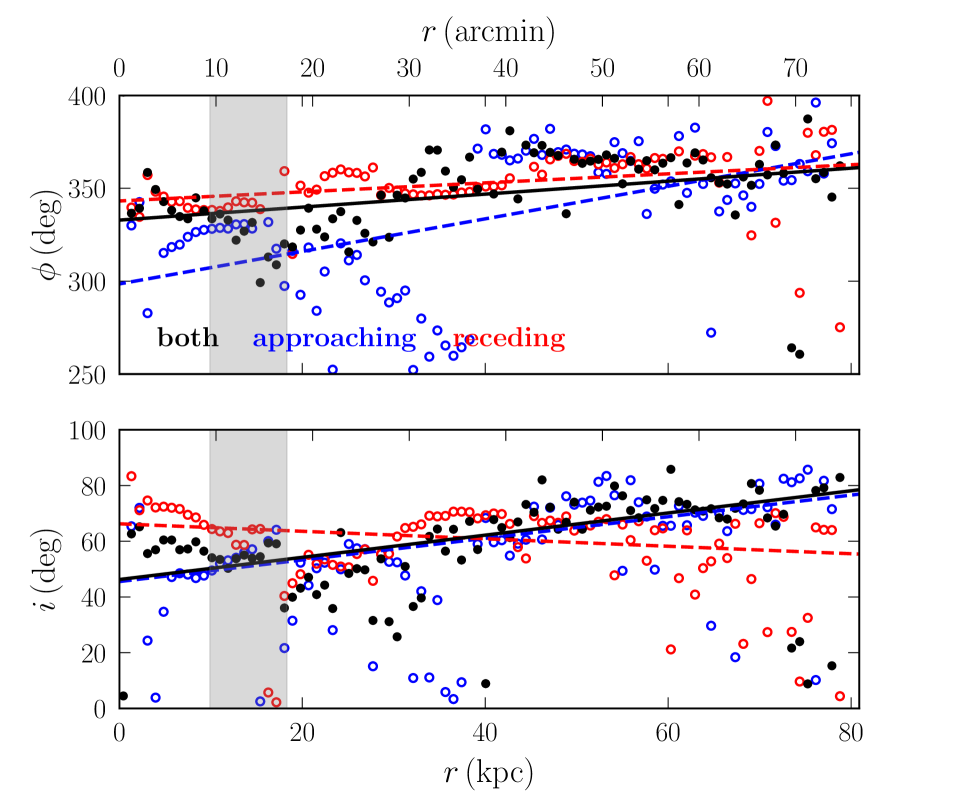
We found that the dynamical centre is at = (09:56:22.9, +69:03:05), with a systemic velocity of km s-1. To put this in context, the dynamical centre is located east and 29 km s-1 away from M81 centre (M81’s systemic velocity is km s-1, Appleton et al. 1981). Keeping these parameters fixed and all others left free, a third rotcur run was used to determine the position angle and inclination of the system out to 79 kpc. The inclination is found to be increasing with the radius, while the position angle shows little variation. The velocity field of the system shows perturbations due to its complex structure, with the most noticeable being the deviation along the minor axis of M81, at the position of the dwarf galaxy HoIX. This region seems directly connected in velocity space with M82 through an arc. To exclude as much as possible these perturbations from the rotation curve, we fitted a first order polynomial to the inclination and position angle whose variations are partly caused by these perturbations. We ran rotcur once more with these parameters fixed to the fitted values, with only the rotation velocity allowed to vary freely. The process was repeated for the approaching and the receding sides separately, and we show in the left panel of Fig. 14 the variations of the position angle and inclination with the radius. The trends of the P.A for the 3 models (approaching, receding and both sides) are similar, with a highest slope noted for the approaching side. In the inner regions of the system, the approaching side shows, on average, lower values of P.A than the other two models. The variations of the inclinations, on the other hand, tend to be similar for the approaching side and the “both sides” models, while the trend of the receding side is different: while the inclination tends to increase with the radius for the approaching side and both sides, we observe a slight decrease of the inclination on the receding side, for which there is a large scatter in the outer parts. The average values of the adopted inclination and P.A for the overall model are respectively and
4.2 Rotation curve
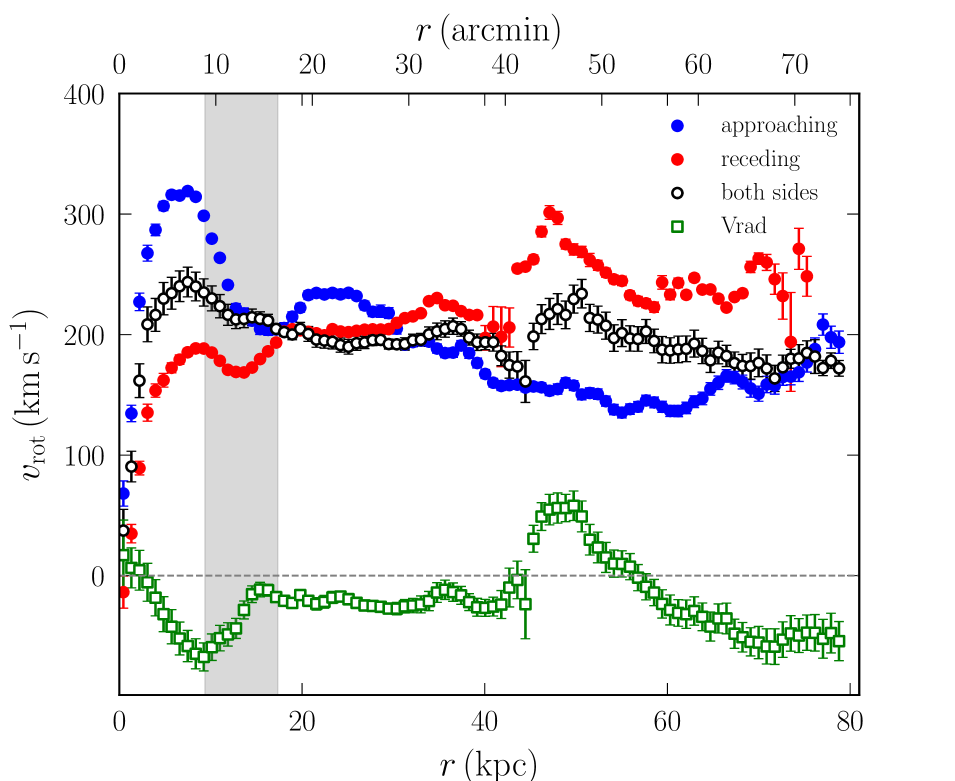
The rotation curve of the M81 system is presented in the right panel of Fig. 14. The uncertainties on the velocities of the average model of both sides are the quadratic sums of the uncertainties of the Rotcur fits and half the difference between the approaching and the receding side. Also shown are the rotation curves for each of the approaching and receding sides. Not surprisingly, the approaching side is very different from the receding side, with the former peaking in the innermost region before gradually decreasing with the radius down to about 100 km s-1. The receding side, on the other hand, increases slowly in the inner regions, shows signs of perturbation around the position of HoIX, and stays more or less flat in the external regions with a spike between and , corresponding to the position of M82. This difference in the trends of the approaching and receding sides agree with the expectations, given the complex structure of the Hi in the complex. In fact, as noted earlier, the galaxies in the system are not contained in the same plane, and lie each at a different inclination. Each of these galaxies affects the rotation of the gas in a different way: on the receding side, the average inclination of the complex is lower than M82’s inclination of , which tends to overestimate the rotation velocities; on the other hand, the average inclination is higher than NGC 3077’s inclination of , which is located on the approaching side of the complex. This results in an underestimation of the velocities of the approaching side.
Despite these differences, the observation of a “flat” velocity curve in the outermost regions, with an amplitude comparable to that in the innermost region (the M81 disk) corroborates the visual aspect of a common rotational pattern for the interacting galaxies, that has M81 at the mass centre.
The large-scale ordered motion is also accompanied with a significant non-circular, radial motion (green symbols). In the inner part, it is likely caused by the prominent spiral structure of M81, while in the outer regions it could reflect the respective motions of gas and galaxy companions with respect to M81. Due to the complexity and the unknown 3D geometry of the system, it is not possible to constrain whether the radial motions are directed inwards or outwards.
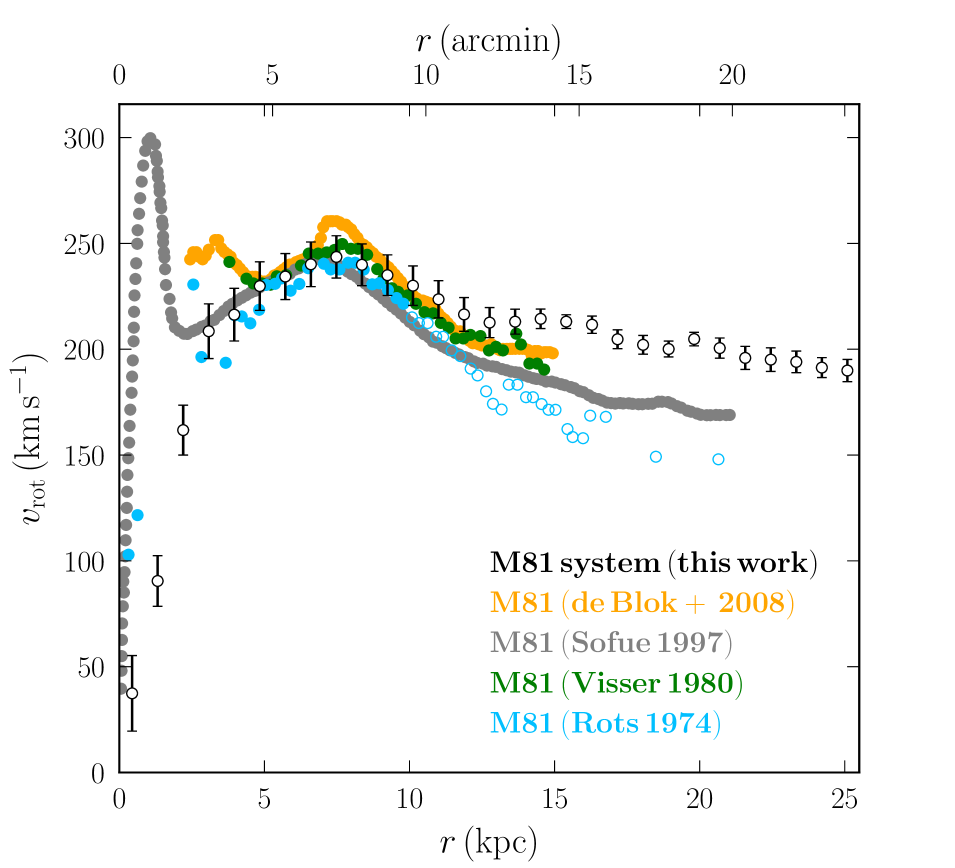
The rotation curves of the individual galaxies M81 and M82 have been derived by a few authors (e.g., Rots 1974, Visser 1980 and de Blok et al. 2008 for M81 using Hi data, Sofue & Yoshiaki 1997 for M81 and M82 using CO(2-1) and Hi data), and they revealed the complex rotations of the galaxies. The Hi rotation curve of M81 derived by Rots (1974) extended out to kpc and showed that beyond kpc, the curve of the receding side rises to high positive velocities, whereas that of the approaching side decreases monotonically. Unsurprisingly, this picture of the M81 galaxy’s rotation resembles the trends that are seen in the rotation curve of the complex shown in Fig. 14, given that the galaxy constitutes the central part of the complex. Moreover, Visser (1980) and de Blok et al. (2008) found that the rotation velocity of the galaxy is of the order of 250 km s-1, and slightly decreases in the outer parts (from about 7 kpc) out to 15 kpc. This presents a picture of the galaxy whose rotation is high in the central regions, but tends to slow down as one moves to the outer regions. On the other hand, the hybrid rotation curve of the galaxy derived in Sofue & Yoshiaki (1997) showed that its rotation velocity peaks to about 300 km s-1 in the central regions, before staying slightly over 200 km s-1 out to about 10 kpc. Beyond this point, the curve decreases very slightly below 200 km s-1 out to kpc. This discrepancy with the Hi rotation curve shows that the atomic and molecular gas rotate differently in the galaxy. As for M82, Sofue & Yoshiaki (1997) found that the galaxy’s rotation curve decreases monotonically from 200 km s-1 to about 50 km s-1 in its inner kpc. They later attribute this unusual shape of the galaxy’s rotation curve to its interaction with M81 (Sofue, 1998). In Fig. 15 we show a comparison of the different above-mentioned rotation curves of M81 to the inner parts of system’s large-scale rotation curve, where each curve was corrected to the same distance scale. Although no robust and direct comparison of the rotation of the two systems can be made because of the difference in the adopted kinematical parameters, the agreement of the different curves in the regions between kpc shows us that the M81 system’s rotation is significantly influenced by the M81’s disk. The discrepancy between the system’s rotation curve derived in this work and those of the literature is likely an effect of beam smearing due to the lower resolution of our data (see, e.g. Swaters et al., 2009; Sorgho et al., 2019).
5 Dynamical evolution of the group
The large-scale maps derived from the present observations reveal new Hi features of the M81 system that help to understand the evolution of the group. The presence of gas clouds near the system, as well as the continuity of velocity in the region between the eastern side of NGC 3077 and the western side of IC 2574 suggests that there may exist more low column density gas around the system that was not detected in the present observations. This raises more questions about the formation and dynamics of the member galaxies of the group. Of course, a definite evolutionary scenario can only be obtained through numerical simulations, but the observational view offered by the present Hi data suggests the galaxies have formed individually at different positions, and have moved closer to each other, up to a point where they are interacting. We will discuss this scenario more in depth in this section.
The structures of the Hi bridges between the three members of the system suggest strong tidal interactions between the galaxies (see van der Hulst, 1979; Yun et al., 1993, 1994). These interactions have caused the truncation of the M82 disk (Sofue, 1998) and the displacement of the atomic and molecular gas of NGC 3077 from its stellar component (Walter et al., 2002a). These effects suggest that the interactions between the galaxies are violent, and they are thought to be the origin of the increased star formation rates in M81, M82 and NGC 3077 (Yun, 1999), in agreement with the idea proposed by Toomre & Toomre (1972) that such tidal disruptions could enhance starburst or AGN activity in the interacting galaxies. Such violent interactions require that at least some of the member galaxies have acquired a large momentum, which favours the idea that they have travelled a certain distance and have initiated an interaction with the other members with a high enough velocity. This is in agreement with numerical simulations of the major galaxies of the system (e.g. Gunn & Gott, 1972; Yun, 1999; Oehm et al., 2017). The simulation used in Yun (1999)444see an animation at http://www.aoc.nrao.edu/m̃yun/movie.gif successfully reproduces both the spatial distribution of the high column density Hi gas in the system, and predicts that the nearest approach of M82 and NGC 3077 to the central galaxy M81 happened respectively 220 and 280 Myr ago. This timescale is consistent with the ages of starbursts in all three galaxies, and successfully reproduces the Hi northern (between M82 and NGC 3077) and southern (between M81 and NGC 3077) tidal bridges revealed by the early observations of the group. However, it is now clear that there exists a tail connecting the system to NGC 2976, hinting at an interaction between the galaxy and the system. Although a further numerical analysis is required to determine the orbit of NGC 2976, the tail mapped in Hi shows an evidence that the galaxy has recently passed near the position of at least one of the system’s members.
The same hypothesis can be formulated, although with less confidence, for IC 2574; the galaxy may have crossed the path of at least some of the galaxies in the system. Indeed, multi-wavelength studies of IC 2574 have revealed that the galaxy has undergone two significant starburst events in the past Myr (Pasquali et al., 2008; Weisz et al., 2009). Although these starbursts were attributed to stellar feedback in the galaxy, there is a possibility that its recent interaction with the system may have somehow contributed to enhance its star formation activity.
Also, the existence of the optically dark galaxy HIJASS J1021+68 and its connection with IC 2574 further supports this hypothesis of interaction of IC 2574 with the system. In fact, Boyce et al. (2001) hinted that HIJASS J1021+68 is a possible tidal dwarf galaxy in which star formation has not begun. The present observations (bottom panel of Fig. 6) revealed additional clouds in the neighbourhood of the HIJASS J1021+68, and an Hi envelope of IC 2574 that seems to point towards the tidal dwarf. These new features suggest that HIJASS J1021+68, as well as the neighbouring clouds, may in fact be a complex of Hi gas that was initially in IC2574.
While most of the observational features of the group revealed in this work corroborate existing numerical simulations, it is not clear what the role of IC 2574 is with respect to the evolution of the M81 system. There is no direct evidence of a past interaction between the galaxy and the system, and one can only speculate from the observations. Part of the scenario is supported by existing numerical simulations, but further studies are required to account for the newly discovered low column density features. In particular, the nature of the Hi complex west of IC 2574 (including HIJASS J1021+68) is unclear, and this region of the group will be investigated more in detail in an upcoming paper. As stated in Section 2.1, additional DRAO observations are underway, and will be presented in subsequent papers. These observations will undoubtedly unveil more Hi features of the M81 group, that will help to better constrain numerical models of the dynamical evolution of the group (e.g., Oehm et al., 2017).
6 Conclusions
We used the DRAO synthesis telescope to map a 25 squared degrees area of the Hi in the M81 group. The aim of the observations was to make a full census of the Hi in the M81 system and the eastern region extending to the “isolated” galaxy IC 2574. Similarly to previous Hi observations of the group, we found that the interacting three major galaxies of the group – M81, M82 and NGC 3077 – are connected through Hi bridges and intergalactic Hi clouds. We also mapped the full extent of the western Hi arm connecting the three galaxies to NGC 2976, the fourth galaxy of the group located at a projected distance of 87.3 kpc southwest of M81. We have mapped, to a higher resolution than the previous GBT observations of Chynoweth et al. (2008), the gas clouds residing in the space between the M81 system and the arm. The observations revealed that what was previously thought, from the GBT observations, to be an extended cloud is in fact a complex of small clouds filling the space between the arm and the “main body” of the system.
The galaxy HIJASS J1021+68, previously detected with the 76m Lovell (Boyce et al., 2001; Lang et al., 2003) and the 100m GBT (Chynoweth et al., 2008) single-dish telescopes, was resolved in the present observations. The DRAO mosaic in the present work suggests that the connection between the galaxy and IC 2574 (previously hinted by Boyce et al., 2001) is through a “filament” of small clouds spanning the space between the two galaxies.
Reprocessing the VLA mosaic of de Blok et al. (2018) with the Effelsberg single-dish data in lieu of the GBT as the authors did, we have obtained a datacube less affected by artefacts, and from which the MW Hi emission could be subtracted. We have mapped three previously detected clouds to a larger extent, and their respective measured Hi masses reveal that we have recovered more Hi fluxes that were undetected in the VLA-only and VLA+GBT mosaics.
Accounting for the ordered motion of the Hi gas around the M81 galaxy, and assuming that all gas and galaxies lie in a common rotating system, we have derived the rotation curve of the system using the tilted-ring model. This revealed that the dynamical centre of the system is located at a projected distance of about 4.7 kpc east of M81, and at systemic velocity of -5.0 km s-1. The average inclination and position angle of the common plane of the system gas are and , respectively. The rotation curve of the system is observed to be roughly constant over a large range of radii, with a prominent wiggle associated to M82, as if the outermost gas and galaxies were rotating at the same speed as the inner disk of M81. Although the velocities of the approaching and receding sides of the system differ, the flat trend corroborates the assumption of a large-scale rotating system dominated by M81. Our idealised rotating tilted-ring model is accompanied by a non-negligible radial motion, perhaps highlighting the streaming of outer gas and galaxies with respect to M81.
As the mapping at DRAO is still being performed, the sensitivity at the vicinity of IC 2574 will be increased. That will allow us to study the Hi environment of the dwarf galaxy more precisely, and investigate better its relation with HIJASS J1021+68, and the possible relation with the main M81 system. Future articles from this series will particularly focus on this analysis.
Acknowledgments
The authors are very grateful to the staff at DRAO, particularly to Operations Manager Dr. Andrew Gray for his flexibility and assistance in observing the many fields and gathering archived data for our work. We thank Prof. Tom H. Jarrett for providing the WISE stellar masses of the main galaxies of M81 in Table 2. We acknowledge Dr. Kelley M. Hess for her enormous contribution in making the interactive 3D map presented in Fig. 13. Kelley provided us with a step-by-step guide and advice on how to improve the display of the rendering. We also thank Prof. Jacqueline van Gorkom for the interesting discussions, which has certainly added value to the quality of the paper. The comments of the anonymous referee were very useful and helped to improve the quality of the present work, and for that we are grateful to them. The work of CC is based upon research supported by the South African Research Chairs Initiative (SARChI) of the Department of Science and Technology (DST), the South African Radio Astronomy Observatory (SARAO) and the National Research Foundation of South Africa (NRF). The research of AS has been supported by SARChI and SARAO fellowships. The research of LC is supported by the Comité Mixto ESO-Chile and the DGI at University of Antofagasta.
References
- Appleton et al. (1981) Appleton P. N., Davies R. D., Stephenson R. J., 1981, MNRAS, 195, 327
- Begeman (1989) Begeman K. G., 1989, A&A, 223, 47
- Blitz et al. (1999) Blitz L., Spergel D. N., Teuben P. J., Hartmann D., Burton W. B., 1999, ApJ, 514, 818
- Börngen & Karachentseva (1982) Börngen F., Karachentseva V. E., 1982, AN, 303, 189
- Börngen & Karachentseva (1985) Börngen F., Karachentseva V. E., 1985, AN, 306, 301
- Boyce et al. (2001) Boyce P. J., et al., 2001, ApJ, 560, L127
- Brouillet et al. (1991) Brouillet N., Baudry A., Combes F., Kaufman M., Bash F., 1991, A&A, 242, 35
- Cayatte et al. (1990) Cayatte V., Balkowski C., van Gorkom J. H., Kotanyi C., 1990, AJ, 100, 604
- Chandar et al. (2001) Chandar R., Tsvetanov Z., Ford H. C., 2001, AJ, 122, 1342
- Chemin et al. (2009) Chemin L., Carignan C., Foster T., 2009, ApJ, 705, 1395
- Chiboucas et al. (2009) Chiboucas K., Karachentsev I. D., Tully R. B., 2009, AJ, 137, 3009
- Chiboucas et al. (2013) Chiboucas K., Jacobs B. A., Tully R. B., Karachentsev I. D., 2013, AJ, 146, 126
- Chynoweth et al. (2008) Chynoweth K. M., Langston G. I., Yun M. S., Lockman F. J., Rubin K. H. R., Scoles S. A., 2008, AJ, 135, 1983
- Chynoweth et al. (2009) Chynoweth K. M., Langston G. I., Holley-Bockelmann K., Lockman F. J., 2009, AJ, 138, 287
- Chynoweth et al. (2011) Chynoweth K. M., Langston G. I., Holley-Bockelmann K., 2011, AJ, 141, 9
- Cottrell (1977) Cottrell G. A., 1977, MNRAS, 178, 577
- Davidge (2009) Davidge T. J., 2009, ApJ, 697, 1439
- Dressler (1980) Dressler A., 1980, ApJ, 236, 351
- Gendre et al. (2013) Gendre M. A., Fenech D. M., Beswick R. J., Muxlow T. W. B., Argo M. K., 2013, MNRAS, 431, 1107
- Goobar et al. (2014) Goobar A., et al., 2014, ApJ, 784, L12
- Gunn & Gott (1972) Gunn J. E., Gott J. R. I., 1972, ApJ, 176, 1
- Hernquist (1992) Hernquist L., 1992, ApJ, 400, 460
- Hess et al. (2018) Hess K. M., et al., 2018, eprint arXiv:1811.12405
- Hibbard & van Gorkom (1996) Hibbard J. E., van Gorkom J. H., 1996, AJ, 111, 655
- Hopkins et al. (2006) Hopkins P. F., Hernquist L., Cox T. J., Di Matteo T., Robertson B., Springel V., 2006, ApJS, 163, 1
- Jacobs et al. (2009) Jacobs B. A., Rizzi L., Tully R. B., Shaya E. J., Makarov D. I., Makarova L., 2009, AJ, 138, 332
- Karachentsev et al. (2000) Karachentsev I. D., et al., 2000, A&A, 363, 117
- Karachentsev et al. (2004) Karachentsev I. D., Karachentseva V. E., Huchtmeier W. K., Makarov D. I., 2004, AJ, 127, 2031
- Karachentseva et al. (1979) Karachentseva V. E., Karachentsev I. D., Shcherbanovsky A. L., 1979, AISAO, 11, 3
- Kenney et al. (2014) Kenney J. D. P., Geha M., Jáchym P., Crowl H. H., Dague W., Chung A., van Gorkom J., Vollmer B., 2014, ApJ, 780, 119
- Landecker et al. (2000) Landecker T. L., et al., 2000, A&AS, 145, 509
- Lang et al. (2003) Lang R. H., et al., 2003, MNRAS, 342, 738
- Makarova et al. (2002) Makarova L. N., et al., 2002, A&A, 396, 473
- Matsushita et al. (2005) Matsushita S., Kawabe R., Kohno K., Matsumoto H., Tsuru T. G., Vila-Vilaro B., 2005, ApJ, 618, 712
- Mattila et al. (2013) Mattila S., Fraser M., Smartt S. J., Meikle W. P. S., Romero-Canizales C., Crockett R. M., Stephens A., 2013, MNRAS, 431, 2050
- Mayya et al. (2005) Mayya Y. D., Carrasco L., Luna A., 2005, ApJ, 628, L33
- Mihos & Hernquist (1996) Mihos J. C., Hernquist L., 1996, ApJ, 464, 641
- Neininger et al. (1998) Neininger N., Guelin M., Klein U., Garcia-Burillo S., Wielebinski R., 1998, A&A, 339, 737
- Nilson (1973) Nilson P., 1973, Acta Universitatis Upsaliensis. Nova Acta Regiae Societatis Scientiarum Upsaliensis - Uppsala Astronomiska Observatoriums Annaler
- Oehm et al. (2017) Oehm W., Thies I., Kroupa P., 2017, MNRAS, 467, 273
- Okamoto et al. (2015) Okamoto S., Arimoto N., Ferguson A. M. N., Bernard E. J., Irwin M. J., Yamada Y., Utsumi Y., 2015, ApJ, 809, L1
- Pasquali et al. (2008) Pasquali A., et al., 2008, ApJ, 687, 1004
- Punzo et al. (2017) Punzo D., van der Hulst J. M., Roerdink J. B. T. M., Fillion-Robin J. C., Yu L., 2017, A&C, 19, 45
- Rots (1974) Rots A. H., 1974, PhD thesis, Univerity of Groningen, http://adsabs.harvard.edu/abs/1974PhDT.......114R
- Sabbi et al. (2008) Sabbi E., Gallagher J. S., Smith L. J., de Mello D. F., Mountain M., 2008, ApJ, 676, L113
- Sault et al. (1995) Sault R. J., Teuben P. J., Wright M. C. H., 1995, ASPC, 77, 433
- Serra et al. (2012) Serra P., Jurek R., Floer L., 2012, PASA, pp 296–300
- Serra et al. (2015) Serra P., et al., 2015, MNRAS, 452, 2680
- Sofue (1998) Sofue Y., 1998, PASJ, 50, 227
- Sofue & Reich (1979) Sofue Y., Reich W., 1979, A&AS, 38, 251
- Sofue & Yoshiaki (1997) Sofue Y., Yoshiaki 1997, PASJ, 49, 17
- Sorgho et al. (2019) Sorgho A., et al., 2019, MNRAS, 482, 1248
- Swaters et al. (2009) Swaters R. A., Sancisi R., van Albada T. S., van der Hulst J. M., 2009, A&A, 493, 871
- Taylor et al. (2003) Taylor A. R., et al., 2003, AJ, 125, 3145
- Thomasson & Donner (1993) Thomasson M., Donner K. J., 1993, Astronomy and Astrophysics, Vol.272, NO. 1/MAYI, P. 153, 1993, 272, 153
- Toomre & Toomre (1972) Toomre A., Toomre J., 1972, ApJ, 178, 623
- Visser (1980) Visser H. C. D., 1980, A&A, 88, 149
- Vollmer et al. (2008) Vollmer B., Braine J., Pappalardo C., 2008, A&A, 464, 455
- Walter et al. (2002a) Walter F., Weiss A., Martin C., Scoville N., 2002a, AJ, 123, 225
- Walter et al. (2002b) Walter F., Weiss A., Scoville N., 2002b, ApJ, 580, L21
- Walter et al. (2008) Walter F., Brinks E., de Blok W. J. G., Bigiel F., Kennicutt R. C., Thornley M. D., Leroy A., 2008, AJ, 136, 2563
- Weisz et al. (2009) Weisz D. R., Skillman E. D., Cannon J. M., Walter F., Brinks E., Ott J., Dolphin A. E., 2009, ApJ, 691, L59
- Winkel et al. (2016) Winkel B., Kerp J., Flöer L., Kalberla P. M. W., Bekhti N. B., Keller R., Lenz D., 2016, A&A, 585, A41
- Wolfe et al. (2013) Wolfe S. A., Pisano D. J., Lockman F. J., McGaugh S. S., Shaya E. J., 2013, Nature, 497, 224
- Wolfe et al. (2016) Wolfe S. A., Lockman F. J., Pisano D. J., 2016, ApJ, 816, 81
- Wright et al. (2010) Wright E. L., et al., 2010, AJ, 140, 1868
- Yun (1999) Yun M. S., 1999, IAUS, 186, 81
- Yun et al. (1993) Yun M. S., Ho P. T. P., Lo K. Y., 1993, ApJ, 411, L17
- Yun et al. (1994) Yun M. S., Ho P. T., Lo K. Y., 1994, Nature, 372, 530
- de Blok et al. (2008) de Blok W. J. G., Walter F., Brinks E., Trachternach C., Oh S.-H., Kennicutt R. C., 2008, AJ, 136, 2648
- de Blok et al. (2018) de Blok W. J. G., et al., 2018, AJ, 865, 26
- de Mello et al. (2008) de Mello D. F., Smith L. J., Sabbi E., Gallagher J. S., Mountain M., Harbeck D. R., 2008, AJ, 135, 548
- de Vaucouleurs et al. (1991) de Vaucouleurs G., de Vaucouleurs A., Corwin, H. G. J., Buta R. J., Paturel G., Fouqué P., 1991, Third Reference Catalogue of Bright Galaxies. Volume I: Explanations and references. Volume II: Data for galaxies between 0h and 12h. Volume III: Data for galaxies between 12h and 24h. Springer, http://adsabs.harvard.edu/abs/1991S{&}T....82Q.621D
- van Dokkum et al. (1999) van Dokkum P. G., Franx M., Fabricant D., Kelson D. D., Illingworth G. D., 1999, ApJ, 520, L95
- van der Hulst (1979) van der Hulst J. M., 1979, A&A, 75, 97
- van der Hulst et al. (1992) van der Hulst J. M., Terlouw J. P., Begeman K. G., Zwitser W., Roelfsema P. R., 1992, ASPC, 25, 131