Emission Line Luminosity Distributions of Seyfert 2 Galaxies
Abstract
We probed the relation between line activities of Seyfert 2 galaxies and their host galaxies. We selected Seyfert 2 galaxies from the Sloan Digital Sky Survey Data Release 10 with redshifts less 0.2. We used the luminosity of the emission lines as indicators of AGN power. We found that the Seyfert 2 galaxies seem to have two populations in the emission line luminosity distributions. We considered the ratio as an accretion rate indicator and found that the two Seyfert 2 distributions seem to have different accretion rates. We found that these two Seyfert 2 populations, although classified by their emission line distributions, turned out to have different morphology distributions. These results indicate that these different populations of the Seyfert 2 galaxies might be significantly different in their physical conditions.
keywords:
galaxies: active – galaxies: Seyfert – galaxies: bulges – galaxies: statistics1 Introduction
According to the traditional unification model of Seyferts (Antonucci, 1993; Urry & Padovani, 1995), Seyfert 1 and Seyfert 2 galaxies are intrinsically the same. The difference between Seyfert 1 and Seyfert 2 galaxies is only caused by the viewing orientation. Seyfert 1 galaxies are viewed face-on relative to their tori and accretion disks whereas Seyfert 2 galaxies are viewed edge-on. The polarized optical spectra of some Seyfert 2 galaxies showed broad emission lines and suggested that these Seyfert 2 galaxies have hidden broad line regions (Antonucci & Miller, 1985; Antonucci, 1993); these results strongly support the traditional unification model. However, some other Seyfert 2 galaxies did not show broad emission lines in the polarized optical spectroscopic observations (Tran, 2003; Nicastro et al., 2003). The Seyfert 2 galaxies with broad emission lines in the polarized spectrum are considered as hidden broad line region (HBLR) Seyfert 2 galaxies, whereas the Seyfert 2 galaxies without broad emission lines in the polarized spectrum are called as non-HBLR Seyfert 2s (Tran, 1995; Heisler et al., 1997; Tran, 2001). The different characteristic in the optical spectra of the Seyfert 2 galaxies suggests that there might be different origins for the Seyfert 2 activities.
It was unclear what physical mechanisms generate these different Seyfert 2 phenomena. The optical spectral features of Seyfert 2 galaxies contain many different narrow emission lines with both high- and low-ionization. Most of these emission lines are believed to be caused by photoionized gas surrounding the super massive black hole (SMBH) in the galaxy center (Rees, 1984; Veilleux & Osterbrock, 1987). However, there are another possible explanations to account for the phenomena of Seyfert 2 galaxies; for example, Terlevich & Melnick (1985) examined the effect of a number of young hot stars in the nucleus of Seyfert galaxies and suggested that the activity power of Seyfert 2 galaxies is associated with extreme star-formation rate. Besides, Kraemer et al. (1998) suggested that the mechanism for Seyfert 2 galaxies can be explained by dominant photoionization with an additional heating of collision by shock after comparing ultraviolet and optical spectra for different regions within 100 pc of the nucleus of NGC 1068 with the results of emission line ratios from photoionization models. Watabe et al. (2008) found that the correlation between nuclear starburst luminosity and AGN luminosity is tighter than that between circumnuclear starburst luminosity and AGN luminosity, indicating that central starburst of AGN is related to AGN mass accretion.
The physical origin for the presence of both high- and low- ionization emission lines in the optical spectra of Seyfert 2 galaxies is still difficult to reproduce with a single model. The observed emission line ratios of Seyfert 2 galaxies could be modeled by fast-velocity radiative shocks, while the low-ionization LINERs might be produced by shocks with low velocities (Dopita & Sutherland, 1995). On the other hand, photoionization models taking into account the effect of dust succeeded to reproduce observed ratios of emission-lines for Seyfert 2 galaxies with high ionization parameters (Groves et al., 2004). Investigating the emission lines in the spectra of Seyfert 2 galaxies will help us to understand the physical process of the Seyfert 2 galaxies.
In this paper, we investigate relationship between the emission line activity of the Seyfert 2 galaxies and their host galaxies to probe the origin of Seyfert 2 phenomena. We have selected more than 30000 Seyfert 2 galaxies from the Sloan Digital Sky Survey (SDSS) for statistical analysis. In Section 2, we describe the selection of our Seyfert 2 samples. In Section 3, we present the relationship between bulge magnitudes and the luminosities of different emission lines for our Seyfert 2 samples. In Section 4, we present the relationship between the accretion rate indicator and the stellar age indicator (4000) for our Seyfert 2 galaxies. Finally, we discuss and summary our results in Section 5 & 6. In this paper, we used =70 km s-1 Mpc-1, , , , .
2 Sample Selection
We selected the Seyfert 2 sample from the SDSS DR10 (Ahn et al., 2014). We first considered the SDSS sources that have both photometry and spectrum data and were classified as “GALAXY” in the SDSS photometry. We only selected sources with redshift less than 0.2 in order to cover some important emission lines within the spectral range. There are 738180 SDSS galaxies in the redshift range. We then selected Seyfert 2 galaxies using the following criteria:
-
•
Criteria of Kewley et al. (2006)
-
–
-
–
-
–
-
•
Full width at half maximum (FWHM) of the Balmer lines
-
•
Signal-to-noise ratio 3 of [OIII] and H emission lines
The distribution of [SII]/H showed a bimodal distribution separating LINER from Seyfert 2 galaxies according to Kewley et al. (2006). Therefore, we used these two criteria listed above to separate Seyfert 2 galaxies from star-forming galaxies and LINERs. Finally, we have 30768 Seyfert 2 galaxies.
3 Bulge Magnitudes and Emission Lines
We investigated the relationship between bulge magnitudes and the luminosities of emission lines for our Seyfert 2 samples. Bulge magnitudes were derived by using the parameters derived from SDSS galaxy fitting. The galaxy was fitted by the “cmodel” that is a combination of a de Vaucouleurs flux and an exponential flux. The de Vaucouleurs profile was used to fit the bulge of the galaxy and the exponential profile was used to fit the disk of the galaxy. We used the cmodel flux to represent the flux of the whole galaxy and the bulge flux were derived from the cmodel flux multiplied by FracDev, which is a coefficient to represent the fraction of the de Vaucouleurs term in the host galaxy in the SDSS fitting, to get the bulge magnitude of our galaxy samples. We considered the emission lines of [OIII] and to represent the AGN activities; the fluxes of the emission lines were obtained from table of the galSpecLine in the SDSS DR10 and derived by the methods of Tremonti et al. (2004) and Brinchmann et al. (2004).
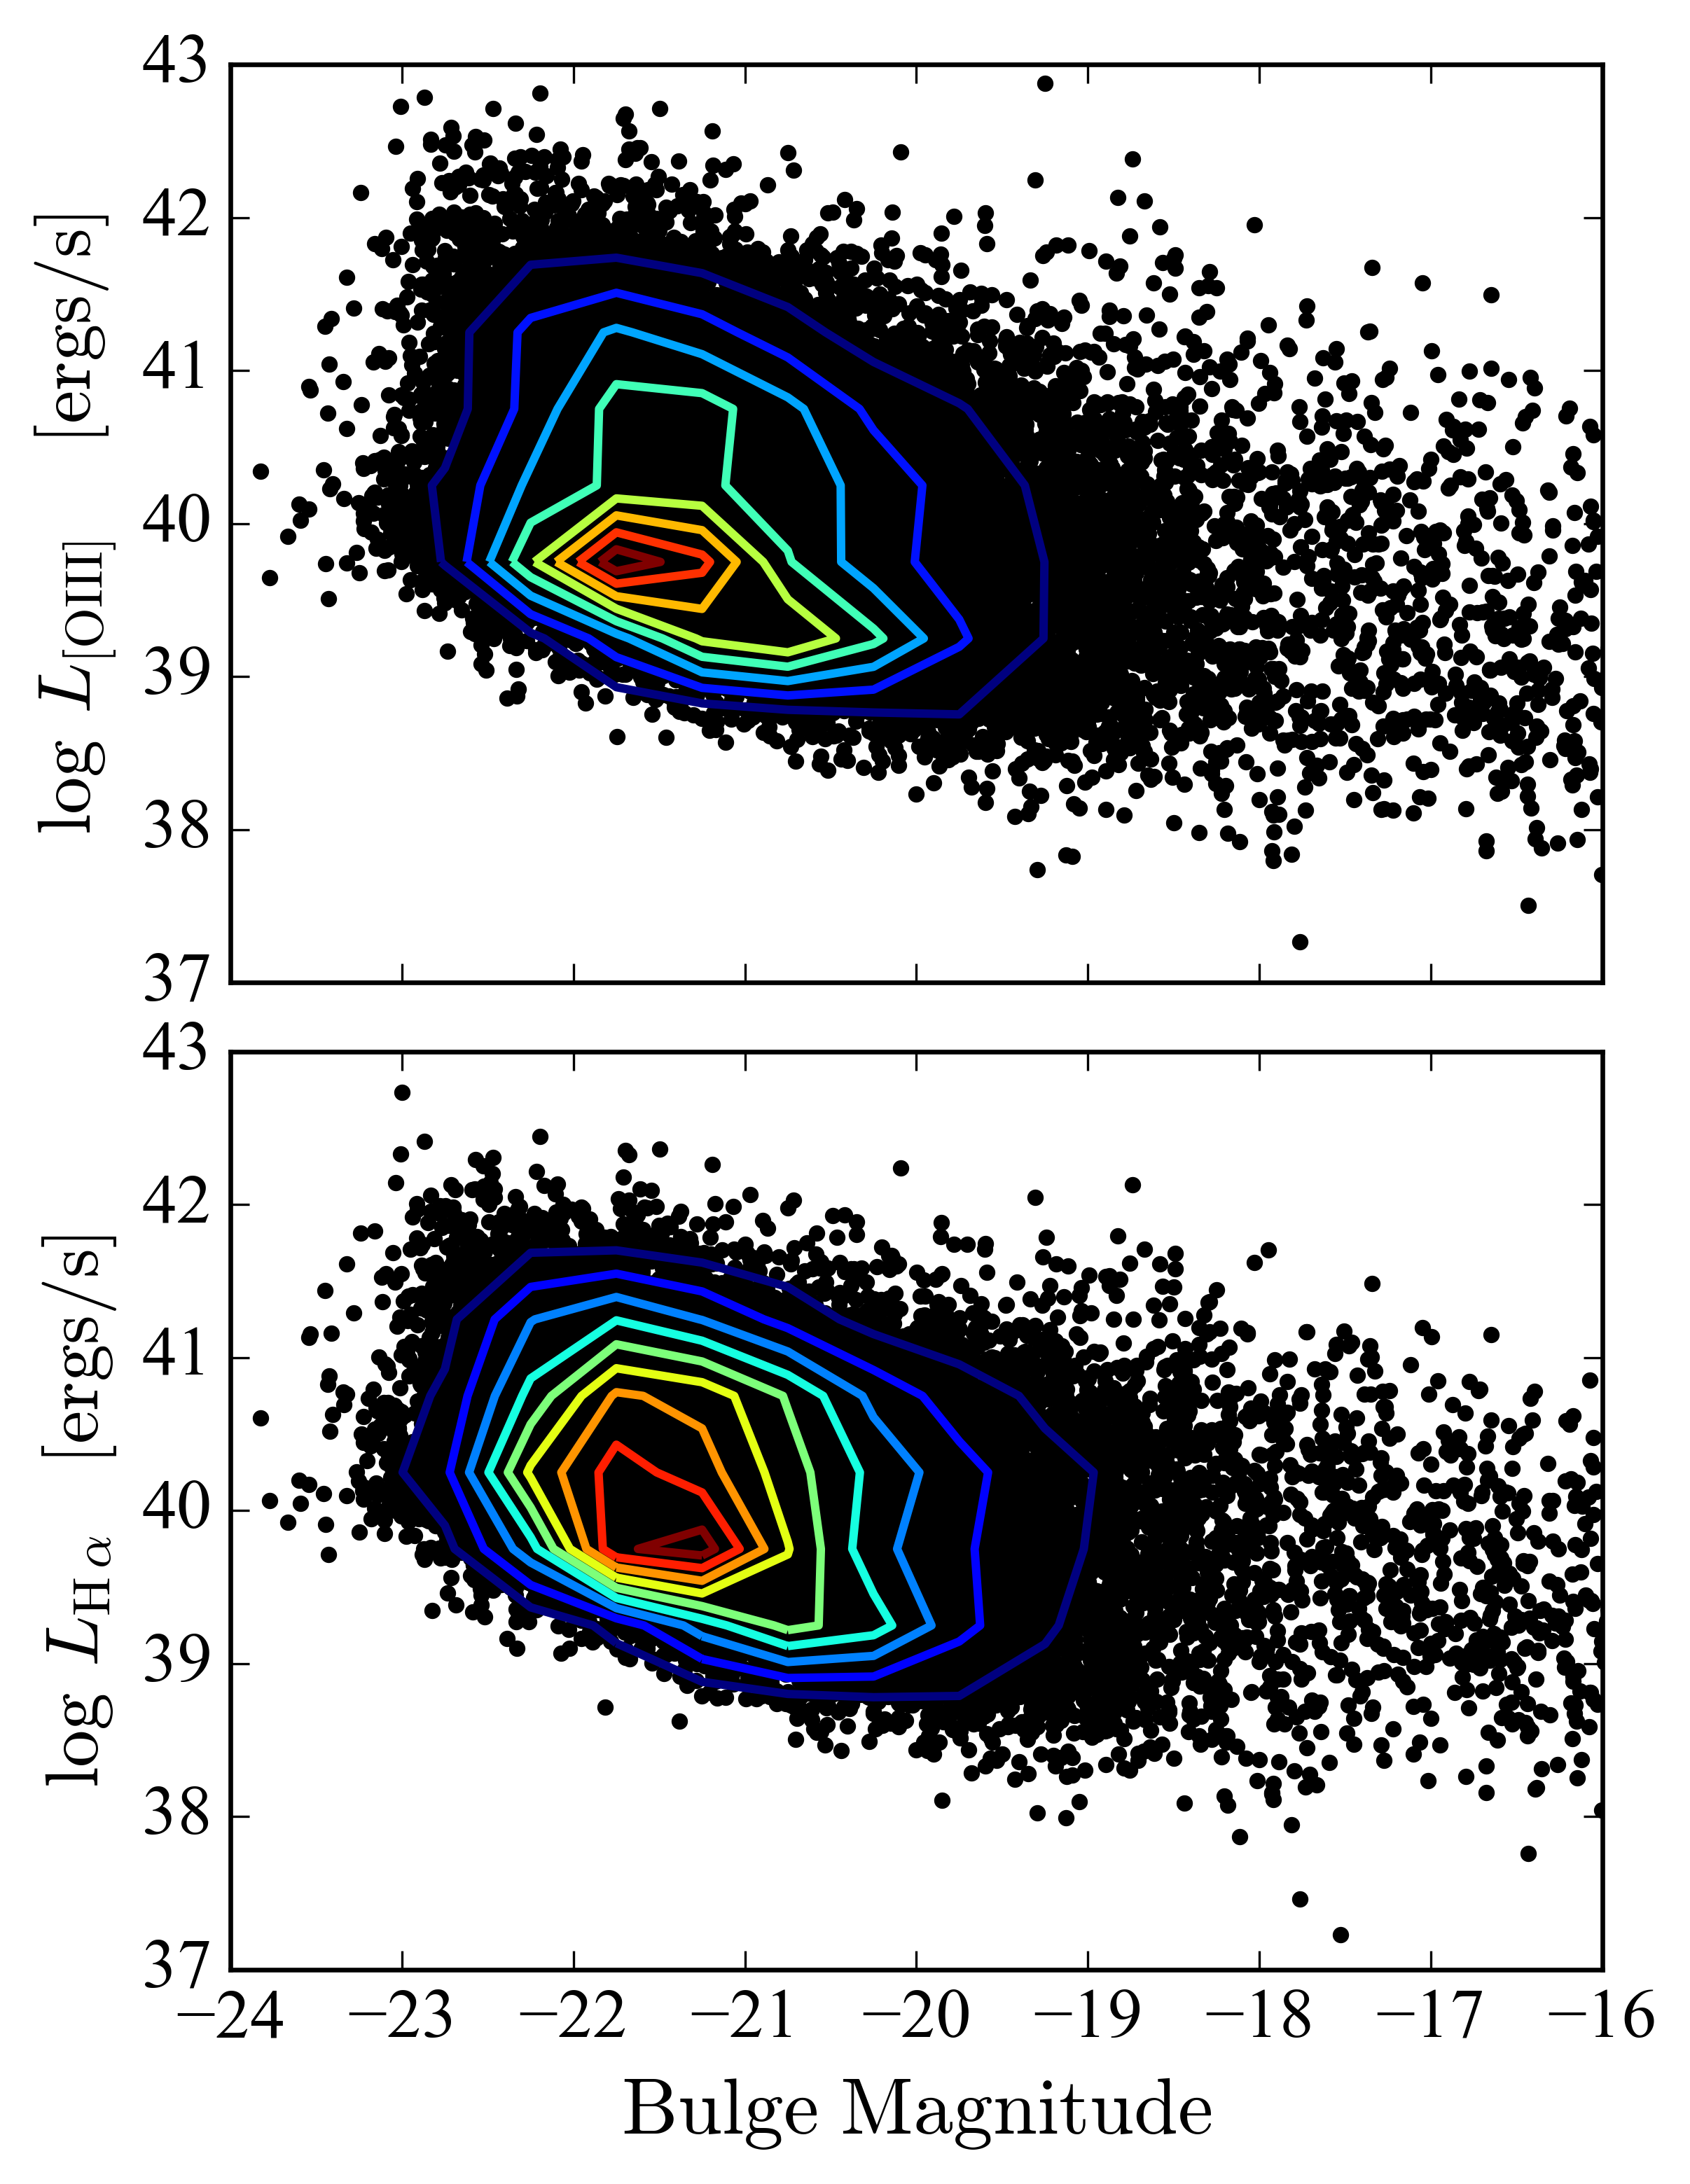
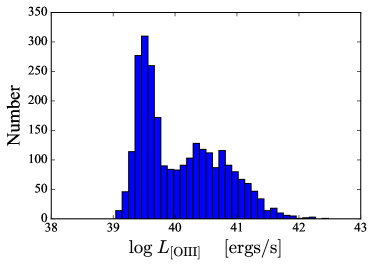
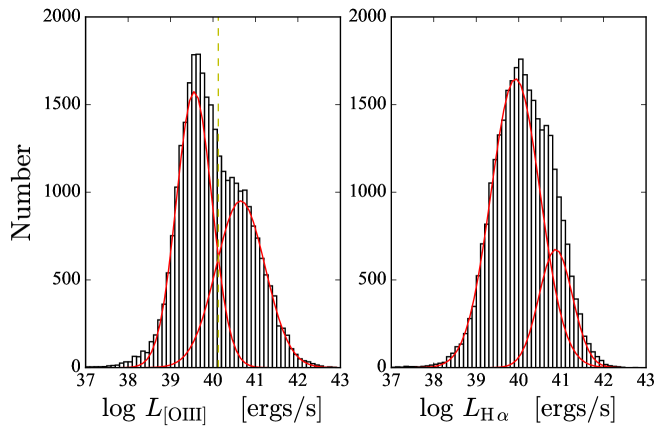
Fig. 1 shows the bulge magnitudes versus the luminosities of emission lines for our Seyfert 2 galaxies. We found that brighter bulge magnitudes generally have stronger emission line luminosities; however, the surface density distribution of the sources seems to be extended along the line luminosity. To demonstrate the extended line distribution, we plotted the for a sub-sample of Seyfert 2 galaxies with bulge magnitude between -22 and -21 in Fig. 2. The double-peaked and extended distribution in Fig. 2 shows that there are more than one component in the distribution of Seyfert 2 galaxies with similar bulge magnitudes. To further investigate the distributions of line luminosities in Seyfert 2 galaxies, we plotted the total distributions of the line luminosities of [OIII] and H for all selected Seyfert 2 galaxies in Fig. 3. We also found that the distributions are not gaussian and show an extending tail in the high luminosity end. There are some Seyfert 2 galaxies showing unusual stronger luminosity than most Seyfert 2 galaxies doing.
| One-gaussian function | 42.94 | 6.10 |
|---|---|---|
| Two-gaussian function | 1.63 | 1.30 |
We fitted a single gaussian function to the distributions of the emission line luminosities. We did the chi-square () test to compare the distributions of the emission line luminosities with the fitting gaussian function. Table 1. shows the results of the reduced chi-square. The results of one-gaussian function show large reduced chi-square values, suggesting that the line distributions can not be well described by a single gaussian function. We also fitted a two-gaussian function to the distributions of the emission line luminosities. We found that the reduced chi-square values for the two-gaussian fits can improve significantly comparing with the results of the one-gaussian function. We found that the reduced chi-square values suggest that the two-gaussian function fitting for the [OIII] luminosity distributions is acceptable. Therefore, we assumed that there are two populations in the Seyfert 2 sample; and we used the two-gaussian function fitting to separate the Seyfert 2 into high and low luminosity populations and tried to investigate the possible difference of their physical properties.
4 Accretion Rate Indicator and (4000) Index
To investigate the origin of these two populations, we divided our Seyfert 2 galaxies into high and low luminosity samples using as the separation luminosity. Therefore, we have 18015 low luminosity Seyfert 2 galaxies and 12753 high luminosity Seyfert 2 galaxies.
The separation line of at 40.125 is about 1.34 away from the peak value of the low luminosity gaussian component, corresponding to the cut line of 9%. In other word, the sources from the low luminosity gaussian with greater than 40.125 are expected to be less than 9% (or less than 1781 sources). Therefore, more than 86.3% ((12753-1781)/12753=0.8603) of the sources with should be real sources from a different population. On the other hand, the mean value and the standard deviation of for the high-luminosity component are 40.65 and 0.57. The separation at is about 0.9 away from the mean of the high-luminosity component, suggesting that about 19% or 2991 sources within the the high luminosity component might be classified as low luminosity sources. Below the separation luminosity, there are 18015 sources. Therefore, about 83.4% ((18015-2991)/18015) sources should be from the real low luminosity components.
The luminosity of AGN is proportional to its accretion rate and its black hole mass. The black hole mass of an AGN is proportional to its bulge magnitude (Kormendy & Richstone, 1995), and is related to the AGN power (Heckman et al., 2004). Therefore, we use as the relative accretion rate of the Seyfert 2 galaxies. We also probed the stellar populations of our Seyfert 2 galaxies using the (4000) strengths, which were defined by Bruzual (1983) and Balogh et al. (1999) as:
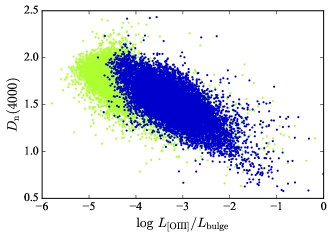
The value of (4000) can be considered as an age indicator of the stellar populations in the central regions of the host galaxies (Kauffmann et al., 2003a). We obtained the (4000) values of our Seyfert 2 sources from the SDSS databases (Brinchmann et al., 2004). Fig. 4 shows the relation between and (4000) in the Seyfert 2 galaxies. The Seyfert 2 galaxies with larger values of tend to have smaller values of (4000). Besides, the Seyfert 2 galaxies with high seem to concentrate around low values of (4000). The low values of (4000) might be caused by young stellar populations or affected by AGN continuum (e.g., Yu et al., 2013).
5 Discussion
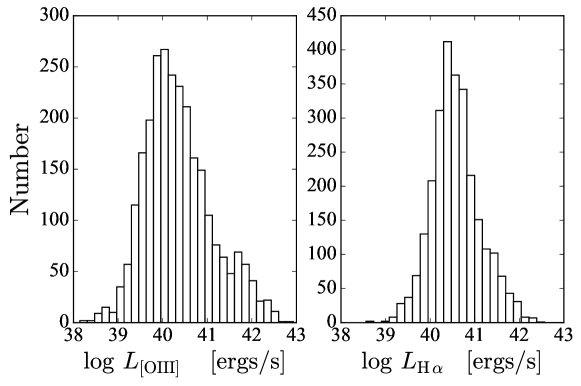
Fig. 4 demonstrates that the Seyfert 2 galaxies with larger accretion rates have smaller values of (4000). This result might suggest that the Seyfert 2 galaxies with younger stellar populations in the host galaxies have larger accretion rates (e.g., Heckman et al., 2004; Wang, 2015). Kewley et al. (2006) showed a similar trend for (4000) versus in the Seyfert 2 galaxy samples selected from SDSS-DR4 with redshifts from 0.04 to 0.1. We noted that the Seyfert 2 galaxies of high have smaller (4000) values than the Seyfert 2 sources of Kewley et al. (2006). These high Seyfert 2 sources have typical (4000) values around 1, which is even lower than the lowest (4000) values of the Seyfert 2 galaxies in Kewley et al. (2006). These results suggest that the low values of (4000) in the high sources might be also affected by some other different mechanisms, such as the AGN continuum (e.g., Yu et al., 2013) and can not be simply explained with the young stellar populations in the host galaxies. Furthermore, we notice that both the low and high luminous Seyfert 2 galaxies possess sources with (4000) from 1.5 to 2.0, but these sources have different ratios of in these two populations, suggesting that even these two populations have similar stellar populations in their host galaxies, they might still have different accretion powers.
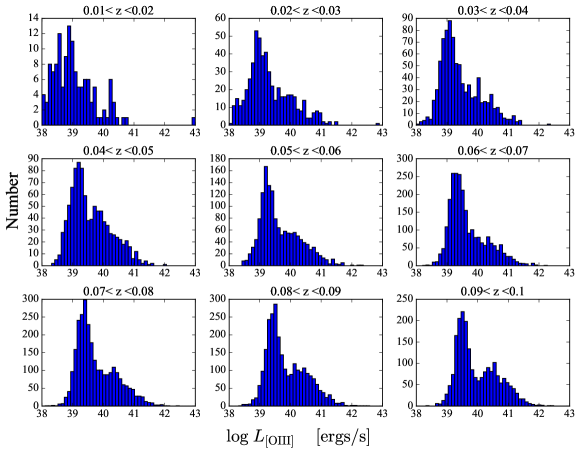
To check whether our results are affected by our selection criteria, we also selected the Seyfert 2 galaxies identified by the Véron Catalog (13th) from the Sloan Digital Sky Survey (SDSS) with redshifts less 0.2. Fig. 5 shows the distributions of emission lines of the Seyfert 2 galaxies identified by the Véron catalog. We find that the emission line luminosities of the Seyfert 2 galaxies identified by the Véron catalog still show an extended distributions in high luminous end. This results indicate that the extended tail of the emission line distributions of the Seyfert 2 galaxies is not caused by our selection criteria of Seyfert 2 galaxies.
We select a sub-sample of Seyfert 2 galaxies to check whether our results could be affected by some biases. First, we excluded the sources with FWHM < 100 km s-1, which are not well resolved in the SDSS spectroscopy and might be affected by HII regions. Second, we removed 2337 special sources, which include ROSAT targets and luminous red galaxies. Third, we inspected 55438 spectra of the high luminous Seyfert 2 galaxies by eyes to remove 745 Seyfert 1.9 galaxies. Fourth, we limited the redshifts to be from 0.05 to 0.1 to reduce possible aperture effects. Last, we only considered detection with S/N > 5 for both [OIII] and H to have sufficient accuracy of measurements. This sub-sample has 8127 sources. We show the L[OIII] distributions of the sub-sample in Fig. 6 and find that the distributions still have a tail in the high luminosity part. This indicates that our results are not affected by these biases.
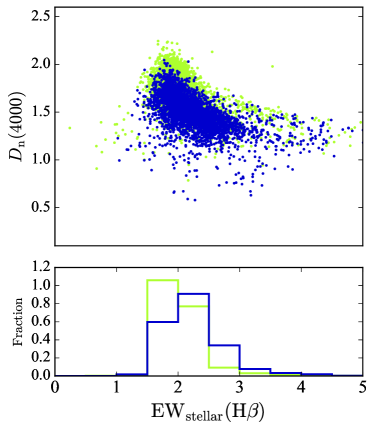
We used the stellar H equivalent width of the Seyfert 2 galaxies as another stellar age tracer (Marcillac et al., 2006). The equivalent widths of H are obtained from galSpecLINE table of the SDSS DR10. The EW of the stellar population is derived from the EW of the emission line without accounting for stellar absorption (REQW) and the EW of the emission line considering stellar absorption (EQW), which was derived from fitting various stellar templates (Tremonti et al., 2004). In other words, the stellar EW is equal to REQW subtracted by EQW (REQW-EQW) as mentioned in the table of galSpecLINE (Tremonti et al., 2004; Brinchmann et al., 2004). Fig. 7 shows that both these two Seyfert 2 populations have sources with large and small H equivalent widths; this suggests these two Seyfert 2 populations could have both young and old host galaxies.
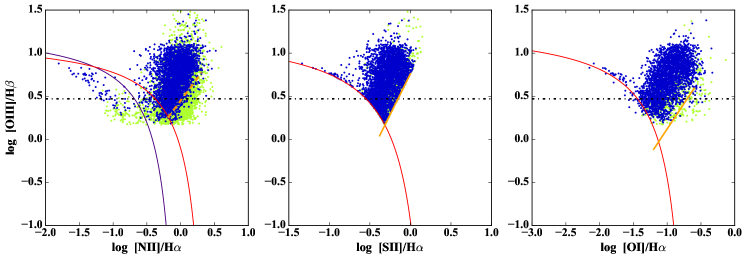
We used the BPT diagram (Baldwin et al., 1981) for the 8127 sources to investigate possible different ionizing mechanisms between our low and high luminosity Seyfert 2 galaxies. The emission lines are constrained with S/N in each diagram of Fig. 8. We found that there are no distinct distributions between the low and high luminosity Seyfert 2 galaxies on these three BPT diagrams. However, we notice that in the diagram of [NII]/H there are a few Seyfert 2 galaxies located below the line of the definition of an AGN (Kauffmann et al., 2003b). This suggests that these Seyfert 2 galaxies, which have relatively strong [SII] as shown in the middle plot of Fig. 8, have relatively weak [NII]; these Seyfert 2 galaxies contradicts the early results of Storchi-Bergmann & Pastoriza (1990), which suggested that the abundances of [SII] and [NII] should be correlated.
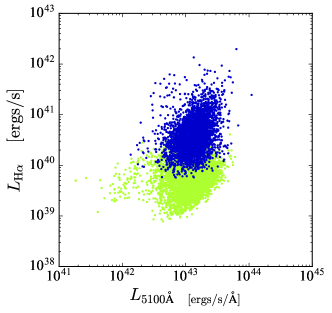
We compared the continuum emission of the Seyfert 2 galaxies to check whether the origin of these two distributions of the Seyfert 2 galaxies are related to their continuum emission. We estimated the luminosity density at 5100 Å, which was estimated by averaging the luminosity from 5050 Å to 5150 Å in the rest-frame. Fig. 9 presents the results of versus . We found that although the two populations have different power of , their distributed over similar luminosity range.
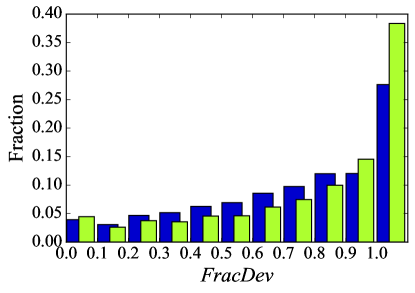
We further investigate host galaxy morphology of the sub sample of the Seyfert 2 galaxies. We use FracDev as a morphology indicator. This parameter describes the bulge contribution in a galaxy and ranges from 0 to 1. A galaxy is more bulge-dominant as FracDev is closer to 1. Fig. 10 shows the FracDev distributions of the Seyfert 2 galaxies. We found that the low and high luminous populations of the Seyfert 2 galaxies have slightly different morphology distributions. We did a Kolmogorov-Smirnov (K-S) test for the FracDev distributions of the two populations of the Seyfert 2 galaxies. The results of the K-S test have K-S statistic (D) = 0.136 and p-value=1.877. The extreme low p-value indicates that the probability of the high and low luminous Seyfert 2 galaxies drawn from the same populations is very low. These results suggest that the differences between the high and low luminous Seyfert 2 galaxies are also related to their host galaxy morphology. In other words, the AGN activity of these Seyfert 2 galaxies is related to the morphology of their host galaxies. We also noticed that the FracDev distribution of the high luminous Seyfert 2 galaxies is similar to the distribution of Seyfert 1 galaxies (Chen & Hwang, 2017). This might suggest that the physical properties of the high luminous Seyfert 2 galaxies are similar to those of the Seyfert 1 galaxies.
6 Summary
Seyfert 2 galaxies show a correlation between the bulge magnitudes and luminosities of emission lines. We found that there are two groups of Seyfert 2 galaxies with different emission line luminosity distributions. The Seyfert 2 galaxies with larger emission line luminosity have low values of (4000), and have larger accretion rates to the central super massive black holes. The significant difference between the two groups of the Seyfert 2 galaxies is related to their host galaxy morphology.
Acknowledgements
This work is supported by the Ministry of Science and Technology of Taiwan (grant MOST 107-2119-M-008-009-MY3). We thank L. Kewley, P. C. Yu, Z. Y. Chen, J. C. Huang, R. Ruffini, and P. Giommi for discussion and comments.
Funding for SDSS-III has been provided by the Alfred P. Sloan Foundation, the Participating Institutions, the National Science Foundation, and the U.S. Department of Energy Office of Science. The SDSS-III web site is http://www.sdss3.org/. SDSS-III is managed by the Astrophysical Research Consortium for the Participating Institutions of the SDSS-III Collaboration including the University of Arizona, the Brazilian Participation Group, Brookhaven National Laboratory, Carnegie Mellon University, University of Florida, the French Participation Group, the German Participation Group, Harvard University, the Instituto de Astrofisica de Canarias, the Michigan State/Notre Dame/JINA Participation Group, Johns Hopkins University, Lawrence Berkeley National Laboratory, Max Planck Institute for Astrophysics, Max Planck Institute for Extraterrestrial Physics, New Mexico State University, New York University, Ohio State University, Pennsylvania State University, University of Portsmouth, Princeton University, the Spanish Participation Group, University of Tokyo, University of Utah, Vanderbilt University, University of Virginia, University of Washington, and Yale University.
References
- Ahn et al. (2014) Ahn C. P., Alexandroff R., Allende Prieto C. et al. 2014, ApJS, 211, 17
- Antonucci & Miller (1985) Antonucci R. R. J., & Miller J. S. 1985, ApJ, 297, 621
- Antonucci (1993) Antonucci R. R. J. 1993, ARA&A, 31, 473
- Baldwin et al. (1981) Baldwin J. A., Phillips M. M. & Terlevich R. 1981, PASP, 93, 5
- Balogh et al. (1999) Balogh M. L., Morris S. L., Yee H. K. C., Carlberg R. G., Ellingson E. 1999, ApJ, 527, 54
- Berney et al. (2015) Berney S., Koss M., Trakhtenbrot B. et al. 2015, MNRAS, 454, 3622
- Brinchmann et al. (2004) Brinchmann J., Charlot S., White S. D. M. et al. 2004, MNRAS, 351, 1151
- Bruzual (1983) Bruzual A. G. 1983, ApJ, 273, 105
- Chen & Hwang (2017) Chen Y.-C. & Hwang C.-Y. 2017, Astrophys Space Sci, 362, 230
- Dopita & Sutherland (1995) Dopita M. A. & Sutherland R. S., 1995, ApJ, 455, 468
- Groves et al. (2004) Groves B. A., Dopita M. A. & Sutherland R. S., 2004, ApJS, 153, 75
- Heckman et al. (2004) Heckman T. M., Kauffmann G., Brinchmann J. et al. 2004, ApJ, 613, 109
- Heisler et al. (1997) Heisler C. A., Lumsden S. L., & Bailey J. A. 1997, Natur, 385, 700613, 109
- Kauffmann et al. (2003a) Kauffmann G. et al., 2003, MNRAS, 341, 33
- Kauffmann et al. (2003b) Kauffmann G., Heckman T. M., Tremonti C. et al. 2003, MNRAS, 346, 1055
- Kewley et al. (2001) Kewley L. J., Dopita M. A., Sutherland R. S., Heisler C. A., Trevena J. 2001, ApJ, 556, 121
- Kewley et al. (2006) Kewley L. J., Groves B., Kauffmann G., Heckman T. 2006, MNRAS, 372, 961
- Khachikian & Weedman (1974) Khachikian, E. Ye., Weedman, D. W. 1974. ApJ, 192, 581
- Komossa (2008) Komossa S. 2008, RMxAC, 32, 86
- Kormendy & Richstone (1995) Kormendy J. & Richstone D. 1995, ARA&A, 33, 581
- Kraemer et al. (1998) Kraemer S. B., Ruiz J. R. & Crenshaw D. M. 1998, ApJ, 508, 232
- Ludwig et al. (2009) Ludwig R. R., Wills B., Greene J. E., & Robinson E. L. 2009, ApJ, 706, 995
- Marcillac et al. (2006) Marcillac D., Elbaz D., Charlot S. et al. 2006, A&A, 458, 369
- McConnell & Ma (2013) McConnell N. J. & Ma C.-P. 2013, ApJ, 764, 184
- Nicastro et al. (2003) Nicastro F., Martocchia A, & Matt G. 2003, ApJ, 589, L13
- Osterbrock (1977) Osterbrock D. E. 1977, ApJ, 215, 733
- Osterbrock (1981) Osterbrock D. E. 1981, ApJ, 249, 462
- Rees (1984) Rees M. J. 1984, ARA&A, 22, 471
- Schawinski et al. (2007) Schawinski K., Thomas D., Sarzi M., Maraston C., Kaviraj S., Joo S.-J., Yi S. K., Silk J., 2007, MNRAS , 382, 1415
- Schawinski et al. (2010) Schawinski K. et al. 2010, ApJ, 711, 284
- Storchi-Bergmann & Pastoriza (1990) Storchi-Bergmann, T. & Pastoriza, M. G. 1990, PASP, 102, 1359
- Storchi-Bergmann et al. (2001) Storchi-Bergmann, T., Gonz lez Delgado, R. M., Schmitt, H. R., Cid Fernandes, R., & Heckman, T. 2001, ApJ, 559, 147
- Terlevich & Melnick (1985) Terlevich R. & Melnick J. 1985, MNRAS, 213, 841
- Tran (1995) Tran H. D. 1995, ApJ, 440, 565
- Tran (2001) Tran H. D. 2001, ApJ, 554, L19
- Tran (2003) Tran H. D. 2003, ApJ, 583, 632
- Tremonti et al. (2004) Tremonti C. A., Heckman T. M., Kauffmann G. et al. 2004, ApJ, 613, 898
- Urry & Padovani (1995) Urry C. M. & Padovani P. 1995, PASP, 107, 803
- Veilleux & Osterbrock (1987) Veilleux S., & Osterbrock D. E. 1987, ApJS, 63, 295
- Véron-Cetty & Véron (2010) Véron-Cetty M. P. & Véron P. 2010, A&A, 518, A10
- Wang (2015) Wang J. 2015, NewA, 37, 15
- Watabe et al. (2008) Watabe Y., Kawakatu N. & Imanishi M. 2008, ApJ, 677, 895
- Yu & Hwang (2011) Yu P.-C. & Hwang C.-Y. 2011, AJ, 142, 14
- Yu et al. (2013) Yu P.-C., Huang K.-Y., Hwang C.-Y. & Ohyama Y. 2013, ApJ, 768, 30