Discovery of a Pulsar-powered Bow Shock Nebula in the Small Magellanic Cloud Supernova Remnant DEM S5
Abstract
We report the discovery of a new Small Magellanic Cloud Pulsar Wind Nebula (PWN) at the edge of the Supernova Remnant (SNR) DEM S5. The pulsar powered object has a cometary morphology similar to the Galactic PWN analogs PSR B1951+32 and ‘the mouse’. It is travelling supersonically through the interstellar medium. We estimate the Pulsar kick velocity to be in the range of 700–2000 km s-1 for an age between 28–10 kyr. The radio spectral index for this SNR-PWN-pulsar system is flat (–0.29 0.01) consistent with other similar objects. We infer that the putative pulsar has a radio spectral index of –1.8, which is typical for Galactic pulsars. We searched for dispersion measures (DMs) up to 1000 cm-3 pc but found no convincing candidates with a S/N greater than 8. We produce a polarisation map for this PWN at 5500 MHz and find a mean fractional polarisation of P 23 percent. The X-ray power-law spectrum (2) is indicative of non-thermal synchrotron emission as is expected from PWN-pulsar system. Finally, we detect DEM S5 in Infrared (IR) bands. Our IR photometric measurements strongly indicate the presence of shocked gas which is expected for SNRs. However, it is unusual to detect such IR emission in a SNR with a supersonic bow-shock PWN. We also find a low-velocity H i cloud of 107 km s-1 which is possibly interacting with DEM S5. SNR DEM S5 is the first confirmed detection of a pulsar-powered bow shock nebula found outside the Galaxy.
keywords:
ISM: individual objects: DEM S5 – ISM: supernova remnants – Radio continuum: ISM – Radiation mechanisms: general – Magellanic Clouds1 Introduction
The Small Magellanic Cloud (SMC) is a gas-rich irregular dwarf galaxy orbiting the Milky Way (MW). However, the proper motion of both the SMC and the Large Magellanic Cloud (LMC) is high, with Besla et al. (2007, and references therein) arguing that it could be on its first passage about the MW. With a current star formation rate (SFR) of 0.021–0.05 M⊙ yr-1 (For et al., 2018), it is ranked as the second nearest star forming galaxy after the LMC to the MW. The relatively nearby distance of 60 kpc (Macri et al., 2006) and the low Galactic foreground absorption (6 1020 cm-2) enables the entire source population in the SMC to be studied in X-rays down to a luminosity of 1033 erg s-1 (Haberl et al., 2012c). The recent star formation activity over the last 50 Myr has created an environment where supernova remnants (SNRs) and X-ray pulsars are expected to be plentiful. In line with this, a large population of high-mass X-ray binaries (HMXBs) have been discovered and extensively studied by Haberl & Sturm (2016). These objects are typically tens of millions of years old and have spin periods ranging from 1 to 1000 s. However, the younger population of neutron stars (NSs) is still largely missing.
There are only two known young SMC pulsars: an 8.02 s anomalous X-ray pulsar, CXOU J010043.1–721134, with a characteristic age of 6700 yr (Tiengo et al., 2008); The second one powers the only confirmed pulsar wind nebula (PWN) in the SMC, inside the large (74.5 pc diameter) SNR IKT 16. IKT 16 hosts a suspected pulsar with a spin-down luminosity () 1037 erg s-1 and an age of 14.7 kyr (Owen et al., 2011; Maitra et al., 2015). The PWN within IKT 16 was discovered with a dedicated Chandra observation, which resolved the hard (2–4.5 keV) X-ray point source seen with XMM-Newton into a faint and soft symmetric nebula surrounding a bright and hard point source. The symmetric morphology suggested that the PWN has not yet interacted with the reverse shock of the SNR. IKT 16 was also detected at radio continuum frequencies with a typical flat spectral energy distribution (SED)111Defined as but without any indication of a point source coinciding with the X-ray point source at the centre of the nebula.
Other well studied SNRs in the SMC include SXP 1062 (Haberl et al., 2012a) which hosts a young Be X-ray binary pulsar with a long spin period in the centre of the remnant. Crawford et al. (2014) investigated the SNR HFPK 334 which has a prominent X-ray point source close to the centre of the SNR. This X-ray source was considered to be a background object and not associated with the SNR. At the same time Roper et al. (2015) noted a lack of confirmed and prominent type Ia SNRs, indicating that the sample of 25 SNRs in the SMC may not be representative for any normal galaxy. However and recently, Maggi et al. (in prep) list three likely type Ia SNRs in the SMC.
Bozzetto et al. (2017) showed that only five PWNe (out of some 60 confirmed SNRs) are detected so far in the LMC. A further instance was investigated for a relationship between the LMC SNR J0529–6653 and the pulsar B0529–66 (Bozzetto et al., 2012, 2017) where the displacement between the midpoint (geometric centre) of the SNR to a pulsar candidate would be consistent with typical kick velocities. However, there was no radio frequency trail of the kind seen in other SNR/PWN systems.
Pulsars and their PWNe, moving supersonically through the ambient medium, are characterised by bow shaped shocks around the pulsar and/or cometary tails (Reynolds et al., 2017). This population is characterised by Rotation-Powered Pulsars (RPPs) with ages between 10 kyr–3 Myr, with a spin-down power () ranging from 1033–1037 erg s-1 (Kargaltsev et al., 2017). Currently, there are 28 known pulsars which show indications of supersonic motion (most with measured velocities). All of them reside in our Galaxy and exhibit a wide range of morphology (c.f.: Pavan et al., 2014a, b; Kargaltsev et al., 2017; Barkov et al., 2019). Although the LMC pulsar J0537–6910 (a.k.a SNR N157 B or 30 Dor B) shows indications of some supersonic motion, its nature is yet to be firmly established. Similarly, LMC SNR N 206 (Klinger et al., 2002) shows an interesting linear tail-like feature but without an identifiable point source (pulsar) association. The other well established PWNe in the LMC do not exhibit a bow shock morphology, but a typically flat radio SED is evident and located more or less centrally within the remnant (Haberl et al., 2012b).
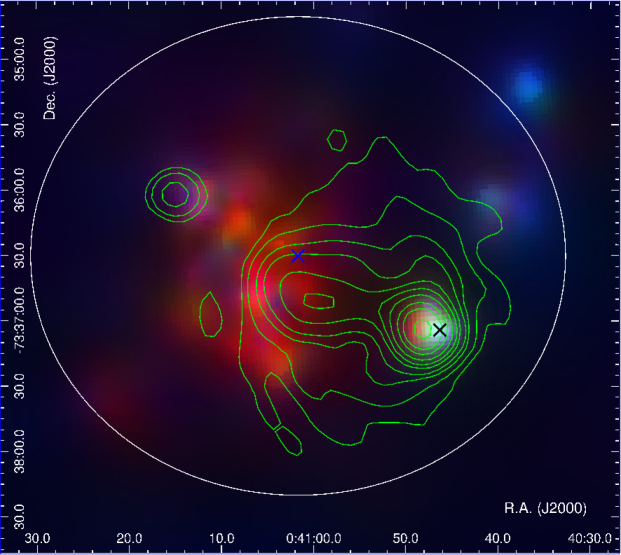
DEM S5 (MCSNR J0041–7336; HFPK530) is among the largest SNRs in the SMC with a size of 245.5 219.7 arcsec (71.4 63.9 pc at the distance of 60 kpc to the SMC; see Fig. 1), is X-ray faint, and has a complex shell like structure. The size of DEM S5 is measured from optical (MCELS; see section 2.3) images while both X-ray and radio images show a smaller extent. With the present sensitivity (and resolution) of our X-ray and radio observations we cannot see the complete shell of SNR DEM S5, specifically, we are unable to measure any emission in the north and north-west region of the SNR. Therefore the size of the complete shell can only be reliably measured from the optical MCELS images. While lack of sensitivity may play an important role, this could also indicate that the outer regions seen in [O iii] as radiative shocks contains gas too cool to emit X-rays or radio continuum. A previous XMM-Newton study of DEM S5 based on observations in which the source was substantially off-axis (8 arcmin) yielded poor constraints on the properties of the SNR due to statistical limitations (Filipović et al., 2008). However, an interesting outcome of the study was the detection of a soft X-ray source 67.5 arcsec from the centre at RA(J2000)= 00h40m47.7s, and DEC(J2000)= –73∘3703. Filipović et al. (2008) noted then that the hard X-ray emission also coincided with the peak of the radio continuum image obtained with Australia Telescope Compact Array (ATCA).
Confirmation of the nature of this source is essential to refine our knowledge of pulsars in the SMC and more generally for stellar population studies of dwarf irregular galaxies. In particular, the detection of a new bow shock PWN would be of critical importance to study this small subsample of PWN systems. Furthermore, since the star formation history and metallicity of the SMC is different from that of our Galaxy, it is an interesting system for studying the pulsar population, and comparing the younger population with the plentiful older ones (HMXBs).
2 Observations and Data
2.1 Radio continuum observations
We used ATCA observational data from projects CX310 and CX403 that were taken on the 2014 December 30th and 31st; 2015 January 4th and 2017 December 22nd. These observations used the Compact Array Broadband Backend (CABB) (with 2048 MHz bandwidth) in the 6A and 6C array configuration, centred at wavelengths of 3/6 cm (= 4500–6500 and 8000–10000 MHz; centred at 5500 and 9000 MHz), and 13 cm (= 2100 MHz). The observations were carried out in a frequency switching mode, totaling 444 minutes of integration at 4500–6500 and 8000–10000 MHz bands and 153 minutes of integration at 2100 MHz frequency. Source PKS B1934–638 was used as the primary (flux density) calibrator for the 2014 December 30th, 2014 December 31th, and 2015 January 4th data; and source PKS B0252–712 for the 2017 December 22nd data. Source PKS B0230–790 was used as the secondary (phase) calibrator for all four observations (Table LABEL:tab1). The miriad222http://www.atnf.csiro.au/computing/software/miriad/ (Sault et al., 1995) and karma333http://www.atnf.csiro.au/computing/software/karma/ (Gooch, 1995) software packages were used to reduce and analyze the data. Images were formed using miriad and the multi-frequency synthesis tasks (Sault & Wieringa, 1994) therein with a Briggs weighting robust= –1 parameter for the 5500 MHz image and 0 for the 2100 MHz image. Both images were deconvolved by applying a primary beam correction. The same procedure was used for both the Q and U stokes parameter maps (see Fig. 2).
The 2100 MHz image has a resolution of 3.7 2.9 arcsec with position angle (PA)= 58.1 deg, while the 5500 MHz image had a resolution of 1.2 0.89 arcsec and PA= 21.3 deg. Because of the low surface brightness and lack of short spacings, we were unable to create a reliable image at 9000 MHz to sample the entire DEM S5 extended emission. However, we use the 9000 MHz image for studying point sources within the field as they are largely not affected by the above shortcomings. Our new images at 2100, 5500, and 9000 MHz have an RMS noise of 0.1, 0.013, and 0.012 mJy beam-1 respectively.
We measured the integrated flux density of DEM S5 PWN from 11 separate images spanning a frequency range of 88 to 8640 MHz, which are summarised in Table LABEL:tbl-flux. At the same time, we were able to measure the flux density from our two new CABB observations (5500 and 9000 MHz) of the two point-like sources in the field of DEM S5 which we associate with the putative pulsar and an unrelated background source (RA(J2000)= 00h41m14.82s, and DEC(J2000)= –73°35′59.9″).
Similar to the studies of the radio continuum from the LMC by Bozzetto et al. (2017) and Maggi et al. (2018; in prep), we have used all available radio continuum data described in previous SMC surveys (Filipovic et al., 1997, 1998; Turtle et al., 1998; Filipović et al., 2002; Payne et al., 2004; Filipović et al., 2005b; Reid et al., 2006; Payne et al., 2007; Wong et al., 2011a, b; Crawford et al., 2011; Wong et al., 2012a; Wong et al., 2012b). These data have been taken with the ATCA, Parkes and the Molonglo Synthesis Telescope (MOST). Additionally, we make use of Murchison Widefield Array (MWA) data from For et al. (2018) and Joseph et al. (2019, in prep.) obtained from the Australia Square Kilometre Array Pathfinder (ASKAP) Early Science Project observations of the SMC.
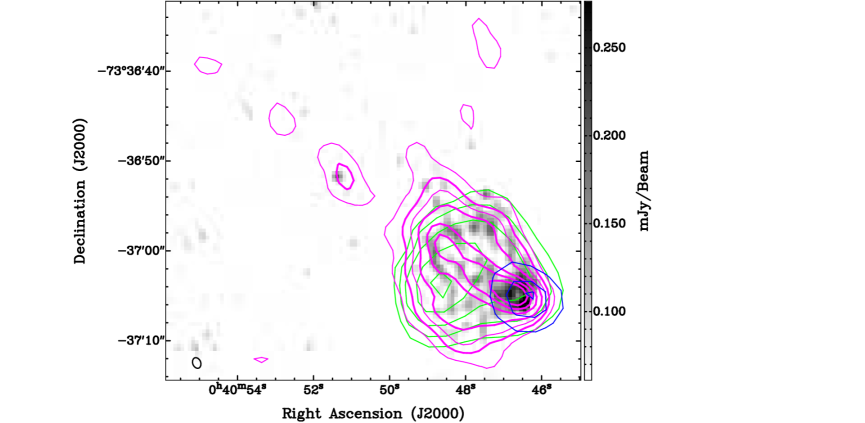
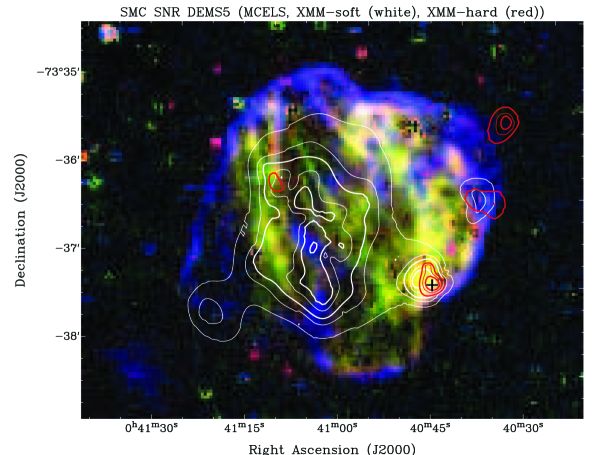
In Fig. 3 we show the new ATCA radio continuum images at 5500 and 2100 MHz with the X-ray soft (0.2–1.0 keV) and hard (2–4.5 keV) band contours overlaid, obtained from XMM-Newton. For all radio surveys (except the MWA), we used the miriad task imfit in order to extract source integrated flux density, extensions (diameter/axes (D) and PA). Errors in flux density measurements predominately arose from uncertainties in defining the ‘edge’ of the remnant. However, we estimate these errors to be 10 percent.
To estimate the flux density from the MWA surveys, we cut out 3 3 deg areas around the source from the GLEAM wide-band extragalactic catalogue images (Hurley-Walker et al., 2017; For et al., 2018)444http://gleam-vo.icrar.org. Using the Aegean Tools package (Hancock et al., 2012, 2018)555https://github.com/PaulHancock/Aegean, we ran the Background And Noise Estimator and the Aegean source-finder on the 170–231 MHz image to detect the SNR/PWNe. We then used the measured position as a prior and allowed the flux to vary when finding it in the 72–103, 103–134, and 139–170 MHz images (‘priorized fitting’). The errors on the integrated flux densities take into account the local RMS, the fitting errors, and the overall flux scale calibration (Hurley-Walker et al., 2017, 13 percent at this low Declination). The source DEM S5 was unresolved at all MWA frequencies (as expected) so the integrated flux density is identical to the (background-subtracted) peak flux density.
2.2 X-ray observations and analysis
DEM S5 was observed serendipitously with XMM-Newton twice between 2006 and 2015 albeit at substantial off-axis angles. The observation details are given in Table LABEL:tabxray. Fig. 1 displays the XMM-Newton EPIC RGB image of DEM S5, showing the supernova remnant in X-rays and a hard point-like X-ray source shown with a black cross in the south-west direction at a distance of 21.2 pc from the geometrical centre of the remnant. During both observations the point-like X-ray source was located on a malfunctioning CCD of MOS1 and in the case of ObsID 0764780201, the source was also outside the readout area of the PN operated in small window mode. XMM-Newton/EPIC (Strüder et al., 2001; Turner et al., 2001) observations were processed with the XMM-Newton, data analysis software SAS version 16.1.0666Science Analysis Software (SAS): http://xmm.esac.esa.int/sas/.
We searched for periods of high background flaring activity by extracting light curves in the energy range of 7.0–15.0 keV and removed the time intervals with background rates 8 and 2.5 cts ks-1 arcmin-2 for EPIC-PN and EPIC-MOS respectively (Sturm et al., 2013). Events were extracted using the SAS task evselect by applying the standard filtering criteria (#XMMEA_EP && PATTERN<=4 for EPIC-PN and #XMMEA_EM && PATTERN<=12 for EPIC-MOS).
In order to investigate whether the hard X-ray point-like source is extended, we extracted a radial profile centered on the source in the energy range of 1–2 keV from the EPIC-PN image (ObsID 0301170301) as the signal to noise ratio peaks in this energy range. This was fitted with a Gaussian profile and the derived width was compared to that of the XMM-Newton Point Spread Function (PSF) at the source position. The radial profile of the hard X-ray source is consistent with the PSF and we derived a 3 upper limit of 14 arcsec for the X-ray extent of the PWN. To further investigate the presence of a diffuse soft X-ray emission that may be associated with the source (and as may be indicated from Fig. 3, green contours), we performed the same exercise of comparison with the PSF in the energy range of 0.5–1 keV. An additional soft X-ray emission is detected peaking at 78 arcsec, which originates from the X-ray SNR with its peak in emission at this distance (see X-ray image in Fig. 1).
We extracted the spectrum of the hard X-ray point source using a circular region of radius 20 arcsec centered around the source position obtained by Filipović et al. (2008). The background was chosen from two circular regions of radius 20 arcsec north and south of the source extraction region at a similar distance to the centre of the SNR. This should remove the contribution of soft X-ray emission from the SNR DEM S5, but given the irregular morphology of the SNR some uncertainty remains.
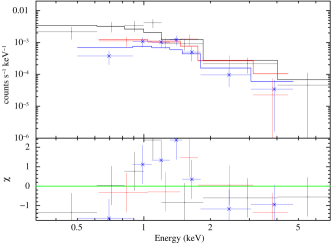
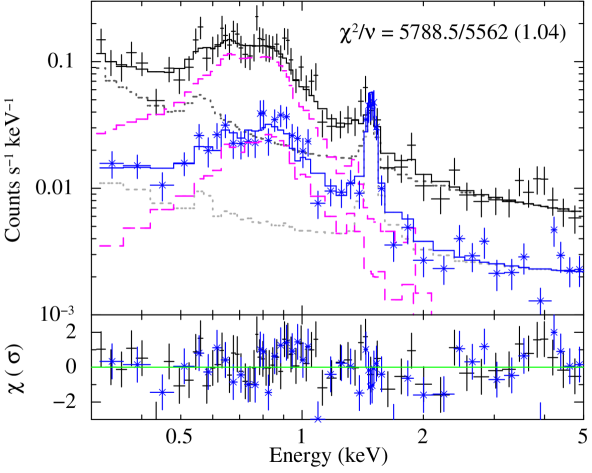
The SAS tasks rmfgen and arfgen were used to create the redistribution matrices and ancillary files for the spectral analysis. The spectrum was binned to achieve a minimum of one count per spectral bin. The spectral analysis was performed using the XSPEC fitting package, version 12.9 (Arnaud, 1996) using the C-statistic. Errors were estimated at 90 percent confidence intervals. The spectra from both observations were fitted simultaneously with absorbed single-component emission models. Given the low statistics of the spectra power-law (photon index 2), Bremsstrahlung (temperature kT 1.7 keV) and APEC plasma emission (kT 2.1 keV) yield formally indistinguishable fit quality ( values of 121.2, 121.1 and 119.9, respectively, for 185 deg of freedom). The spectra with best-fit absorbed power-law model is shown in Fig. 4. The index of the emitting particles (p) has been calculated by using the equation p= 2 – 1, where is the index of the (synchrotron) energy spectrum. the p value is consistent with the expected range of 1 p 3 for non-thermal emission. The spectral parameters are tabulated in Table 4. No excess absorption was required apart from the Galactic value along the line of sight to the SMC. This is in further support of the source being located at the near side of the SMC and argues against the source being a background object, as the absorption at the source position through the depth of the SMC is N4 1021 cm-2 (Stanimirovic et al., 1999). The value of is consistent with typical X-ray spectral slopes observed in (Kargaltsev & Pavlov, 2008) as is expected from non-thermal synchrotron emission originating from a PWN/pulsar. We further verified that the X-ray spectral shape and the flux were stable between the two XMM-Newton observations separated by 8-years by setting the and normalizations free between the observations. A non-varying spectrum is in further support of a PWN (containing a putative pulsar unresolved in the current observations) origin of the source. The detection of a hard X-ray point source with XMM-Newton ascertains the fact that we are unable to further resolve the PWN/pulsar composite, and require a higher spatial resolution on-axis Chandra observation for the purpose.
In parallel, we extracted spectra for the diffuse X-ray emission in the east part of the SNR. For such faint extended emission we did not subtract background emission, but rather modeled all sources of background directly in the analysis and added a model for the diffuse emission on top of it. The method we used has been described extensively for XMM-Newton in Maggi et al. (2016). Even though we included MOS2 data from a second XMM-Newton observation (Table LABEL:tabxray) not available in the first analysis of Filipović et al. (2008), the analysis is still hampered by a relatively short exposure time and off-axis location of the source.
The spectrum of the diffuse emission, shown in Fig. 5, is obviously thermal, typical for shock-heated plasma in SNRs. We fit the spectrum with a non-equilibrium ionisation shock model with variable abundances (vpshock in XSPEC), finding a temperature keV and ionisation age s cm-3. When let free, the abundances of the main elements (O, Ne, Mg, Fe, and Si) do not depart significantly from the SMC ISM abundance pattern (Russell & Dopita, 1992) With an observed flux in the 0.5–8 keV band of erg cm-2 s-1absorption-corrected flux of erg cm-2 s-1, DEM S5 is in the faint end of the SMC SNR population (e.g. Maggi et al., 2016). The best-fit absorption column (on top of the Galactic one) is relatively low ( cm-2) and at the level consistent with 0, as for the PWN candidate. Therefore, from the point of view of absorption, both the hard X-ray source and the diffuse emission are consistent within one another.
Naively, the shape and location of this emission would suggest that it is thermal emission from the supernova ejecta which was shocked and heated by the reverse shock. However, this is not sustained by the data, which are fully consistent with SMC abundances, suggesting instead a shocked ISM origin. It remains possible that shock-heated ejecta contribute to the diffuse emission, at a level low enough not to be significantly detected in the available XMM-Newton data.
| Date | Project | Array | Integrated time | Flux density | Phase | Channels | Frequency | Bandwidth |
|---|---|---|---|---|---|---|---|---|
| code | configuration | (minutes) | calibration | calibration | (MHz) | (MHz) | ||
| 2014-12-30 | CX310 | 6A | 29.3 | 1934–638 | 0230–790 | 2049 | 5500, 9000 | 2048 |
| 2014-12-31 | CX310 | 6A | 153 | 1934–638 | 0230–790 | 2049 | 2100 | 2048 |
| 2015-01-04 | CX310 | 6A | 37.3 | 1934–638 | 0230–790 | 2049 | 5500, 9000 | 2048 |
| 2017-12-22 | CX403 | 6C | 377.3 | 0252–712 | 0230–790 | 2049 | 5500, 9000 | 2048 |
| PWN | Pulsar | Background | Telescope | Reference | |
|---|---|---|---|---|---|
| (MHz) | (Jy) | (Jy) | (Jy) | ||
| 88 | MWA | For et al. (2018) | |||
| 118 | MWA | For et al. (2018) | |||
| 155 | MWA | For et al. (2018) | |||
| 200 | MWA | For et al. (2018) | |||
| 843 | MOST | Maggi et. al. (in prep.) | |||
| 960 | ASKAP | Joseph et. al. (in prep.) | |||
| 1320 | ASKAP | Joseph et. al. (in prep.) | |||
| 1420 | ATCA | Maggi et. al. (in prep.) | |||
| 2100 | – | ATCA | This work | ||
| 2370 | ATCA | Maggi et. al. (in prep.) | |||
| 4800 | ATCA | Maggi et. al. (in prep.) | |||
| 5500 | – | ATCA | This work | ||
| 8640 | ATCA | Maggi et. al. (in prep.) | |||
| 9000 | – | ATCA | This work | ||
| Date | ObsID | Exposure | CCD Readout mode | Off-axis angle | Telecope vignetting |
|---|---|---|---|---|---|
| PN / MOS2 | PN / MOS2 | PN / MOS2 | PN / MOS2 | ||
| yyyy/mm/dd | (ks) | ||||
| 2006/06/04 | 0301170301 | 15.5 / 21.1 | Full Frame / Full Frame | 8.4′/ 7.4′ | 0.61 / 0.65 |
| 2015/10/16 | 0764780201 | – / 47.9 | Small Window / Full Frame | – / 9.7′ | – / 0.53 |
2.3 Optical and Infrared observations
The Magellanic Cloud Emission Line Survey (MCELS) was carried out at the 0.6-m University of Michigan/CTIO Curtis Schmidt telescope, equipped with a SITE 2048 2048 CCD, which gave a field of 1.35 1.35 deg at a scale of 2.4 2.4 arcsec pixel-1 (Smith et al., 2000; Pellegrini et al., 2012). The SMC was mapped in narrow bands corresponding to H, [O iii] (= 5007 Å), and [S ii] (= 6716, 6731 Å), plus matched red and green continuum bands. All the data have been continuum subtracted, flux-calibrated and assembled into mosaic images. A cutout around the area of DEM S5 can be seen in Fig. 6.
We also make use of SMC observations from Spitzer SAGE (Surveying the Agents of a Galaxy’s Evolution, Gordon et al., 2011). Specifically, we used 4 IRAC bands: band-1 (3.6 m), band-2 (4.5 m), band-3 (5.8 m), and band-4 (8.0 m), as well as MIPS at 24 m.
2.4 H i observations
Observations of H i have previously been carried out over the whole SMC (20 deg2) by Stanimirovic et al. (1999) using the ATCA 375-m configuration and the Parkes telescopes. The angular resolution was 98 arcsec, and velocity resolution was 1.65 km s-1, with a column density sensitivity of 4.2 1018 cm-2 in the same velocity interval. The heliocentric reference frame was used to define velocities.
Recent ASKAP data are also available over a similar field-of-view, but at the higher angular resolution of 27 35 arcsec and the lower velocity resolution of 3.9 km s-1 (McClure-Griffiths et al., 2018). The column density sensitivity per 3.9 km s-1 channel is similar to the ATCA data at 5.2 1018 cm-2.
3 Results
3.1 PWN and compact source inside the SNR DEM S5
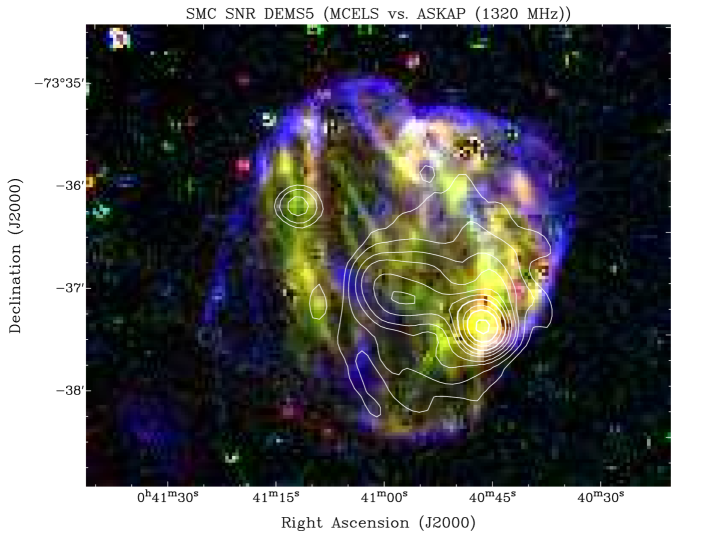
We detect a point-like source at 5500 MHz, which we consider likely to be a pulsar, at RA(J2000)= 00h40m46.49s, and DEC(J2000)= –73°37′5.8″, with a trail/jet behind it and a nebulosity which is morphologically indicative of a PWN (Fig. 3). This trail is clearly visible only in our 2100 and 1320 MHz images because of the sensitivity and missing short spacings at higher frequencies. One should also consider that this trail might be a so-called ‘relic’ PWN behind the present putative pulsar similar to Galactic SNR/PWN G5.4–1.2 (Kothes, 2017). While somewhat unlikely, as the trail is still part of PWN-system (see Fig. 1), only future higher sensitivity and resolution radio continuum observations may reveal true nature of this possibility.
The position of the radio point source is also coincident with the hard X-ray point source. There seems to be a small displacement ( 2 arcsec) between the centremost blue (2–4.5 keV) X-ray contour and the radio point-like source. This is attributed to the fact that the X-ray counterpart of the putative pulsar cannot be separated from the PWN/pulsar composite with the current XMM-Newton observations and hence its accurate X-ray position cannot be ascertained. Fig. 3 further shows that the PWN emission close to the pulsar is dominated by hard X-rays. This is due to the fact that the X-ray synchrotron electrons have a much shorter lifetime than radio ones and the X-ray synchrotron spectrum from the PWN would get steeper when moving further away from the pulsar.
The measured integrated flux density of the point source (putative pulsar) at 5500 and 9000 MHz is 0.42ṁJy (14) and 0.22 mJy (3) respectively. At 2100 MHz, we cannot precisely measure flux density, but there is a strong indication of an order of magnitude stronger integrated flux density (around 3 mJy, see Table LABEL:tbl-flux). This would make the SED of this point source (putative pulsar) very steep with a spectral index of –1.8. The SED of most known Galactic pulsars can be described above 100 MHz by a simple power-law with a mean spectral index of –1.8 (Han et al., 2016), with a range from –0.46 to –4.84. Therefore, we propose that this point source is most likely the compact remnant (pulsar or a fast spinning NS) of the DEM S5 supernova explosion with its associated PWN. Also, ultra steep spectrum and Compact Steep Spectrum (CSS) sources would have such a steep radio spectrum (Collier et al., 2016). However, as we see the nebulosity behind the point source, it is very unlikely to be CSS with jet Active Galactic Nuclei (AGN) like structure.
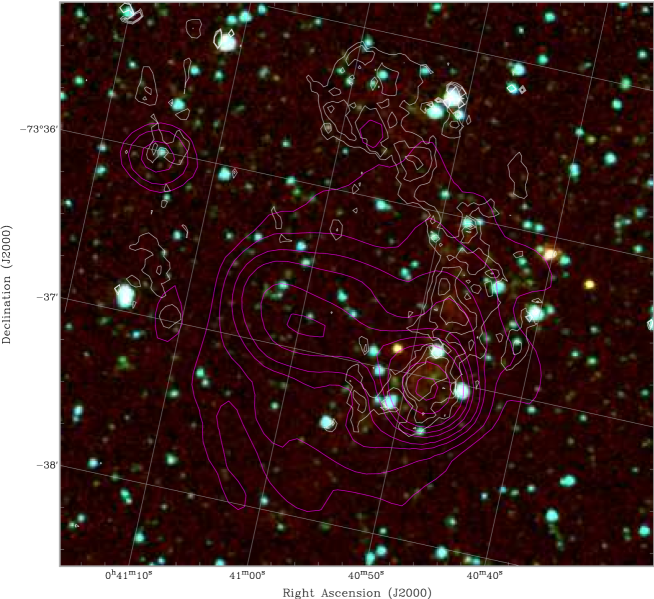
Figs. 1, 3 and 7 show trail-like emission from PWN with the length of 37 arcsec (10.8 pc). The direction of the trail is pointing towards the geometric centre of the SNR (RA(J2000)= 00h41m01.675s and DEC(J2000)= –73°36′30.38″). We also note that the putative pulsar (compact source) is ‘leading’ the conically shaped PWN that trail behind it. This is a strong indication that the putative pulsar is moving away from the SNR explosion site at a supersonic velocity (see Table 5). Morphologically, this would qualify the DEM S5 system (pulsar and PWN) as a ‘rifle bullet’ type (Barkov et al., 2019) where the spin and velocity are aligned. The most likely Galactic bow shock PWN analog would be PSR B1951+32 in SNR CTB 80 (see Safi-Harb et al., 1995; Moon et al., 2004) and ‘mouse’ PWN (J1747–2956) (Gaensler et al., 2004; Klingler et al., 2018) where a similar morphology is detected. However, according to Kargaltsev et al. (2017) PSR B1951+32 doesn’t move supersonically. Fig. 7 clearly shows that the putative pulsar with its PWN is reaching the edge of the optical remnant. The putative pulsar may be even outside of it, if the motion is not entirely perpendicular to the line of sight. Although purely visually, it would be probably just at the edge. The densities outside and inside the SNR should be different, with outside expected to be much higher. Therefore, we expect the PWN to be somewhat narrower with higher ambient density.
In Table 5, we used various SNR ages (from 5 to 50 kyr) to estimate the kick (transverse) velocity of the pulsar. We also varied the distance to DEM S5 as Scowcroft et al. (2016) suggested that at the western end of the SMC might reach up to 67.5 kpc. The observed distance between the radio point-like source (putative pulsar) and the centre of the SNR is measured to be 73 arcsec (or 21.2/23.9 pc at the 60/67.5 kpc distance respectively and assuming motion to be perpendicular to the line of sight).
The kick (transverse) velocities in other similar PWN bow shock systems are estimated to be in range of 60–2000 km s-1 (Kargaltsev et al., 2017, see their table 1) for the pulsar through the ambient medium. We take this velocity as a possible upper limit which then indicates a very high DEM S5 pulsar velocity through the ambient medium given that the minimum age would be in order of 10 kyr (see Table 5). Other constraints on the age of DEM S5 come from the IKT 16 PWN/SNR system which has an estimated age of 14.7 kyr and has a somewhat larger SNR diameter of 74.5 pc vs 67.6 pc for DEM S5 indicating that IKT 16 PWN/SNR is expanding at a somewhat lower rate probably because the local environment is denser than in/around DEM S5 (4 1021 cm-2 for DEM S5 vs. 6 1021 cm-2 for IKT 16). However, one should be cautious about the line-of-sight column density, calculated by integrating along several kpc for the SMC because of variations in the local ambient medium density. This would suggest that the age of DEM S5 PWN is between 10 and 15 kyr with kick velocities of 1500–2500 km s-1. Also, Reynolds et al. (2017) suggest that the pulsar would eventually leave the SNR at an age of 20–200 kyr which further limits our DEM S5 PWN as it is still within the SNR boundaries. Given a lower age limit of 10 kyr, the kick-off velocity of 2000 km s-1 is derived using its distance from the DEM S5 geometric centre, which is the most likely explosion site in a uniform ISM. If the ISM is inhomogeneous or has a large scale gradient the explosion site would be shifted (4.5 arcsec or 1.3 pc) from the geometrical centre towards the west (at RA(J2000)= 00h41m01.53s and DEC(J2000)= –73°36′26.6″; with ellipse radius of 34 22 pc). In any case, a large kick velocity would certainly still need to be accounted for. We emphasize that the age and size of different SNRs might not be appropriate to compare as they all come with their own unique characteristics.
The fastest known moving pulsars are ‘Morla’ (J0357+3205) (Kargaltsev et al., 2017; Marelli et al., 2013) and ‘Lighthouse’ (Pavan et al., 2014a, b; Kargaltsev et al., 2017) at 2000 km s-1. We note that our DEM S5 PWN cometary tail has a conical shape with the angle behind the putative pulsar of 75–80 deg, which suggests somewhat slower velocity than 2000 km s-1 that we estimate above; unless our PWN system is not just characterised as ‘rifle bullet’ but also ‘frisbee’ or ‘cart-wheel’ (Barkov et al., 2019). Additionally, Holland-Ashford et al. (2017) and Katsuda et al. (2018) suggested that pulsars move preferentially opposite to the ejecta, which lends support to the interpretation that the diffuse X-ray emission originates from shock heated ejecta.
DEM S5 is a very large SNR in general, which argues for a late stage of evolution. We use Cioffi et al. (1988) for calculations of radiative SNRs. Using their equations for the onset of the pressure driven snowplow or radiative phase, we obtain a minimum ambient density of 0.35 cm-3 and a lower limit for the age of 24 kyr, using 22 pc radius (towards the west) and 1051 erg for the explosion energy – certainly nothing unusual. For a density of 1 cm-3 the age would be about 48 kyr but the age estimate could be even a lot higher. We also need to consider the amount of material that would have been swept up in such a large volume if we have normal densities. For this to still be a Sedov SNR we would need very low densities to make this still applicable. The largest distance between the most likely location of the supernova explosion and the edge of the SNR – as indicated by the [O iii] shell – is almost straight to the east. In between, we find the diffuse X-ray emission, which might be including some shock heated ejecta. In this case, the reverse shock must have past this area which stretches all the way to the centre of the SNR. With an assumed ejecta mass of 10 solar masses, a radius of 40 pc and the canonical value for the explosion energy of 1051 erg, we require an ambient density of 0.02 cm-3 – if the reverse shock just reached the location of the SN (McKee & Truelove, 1995, see their equations). This is the typical density in the interior of a stellar wind bubble (e.g. Weaver et al., 1977). With these parameters the age would be 28 kyr and the PWN/Pulsar system kick-off velocity would decrease to a ‘reasonable’ 700–800 km s-1. We note that the ejecta mass is not very critical here. If we insert this into the equations of Cioffi et al. (1988) we get an ambient density of 0.45 cm-3 for the right (west) part of the SNR. Therefore, this scenario seems to be at least plausible. This implies that the supernova went off inside a low density bubble close to the edge. Alternatively, if the plasma temperature ( keV represents that of shocked ambient ISM as the limited spectral analysis indicates, a naive Sedov model can be used to set an age 15 kyr, or, taking a non detection in X-ray of the outer, radiative shell ( keV), an even larger age limit of 30 kyr would be implied.
3.2 Radio Spectral Index
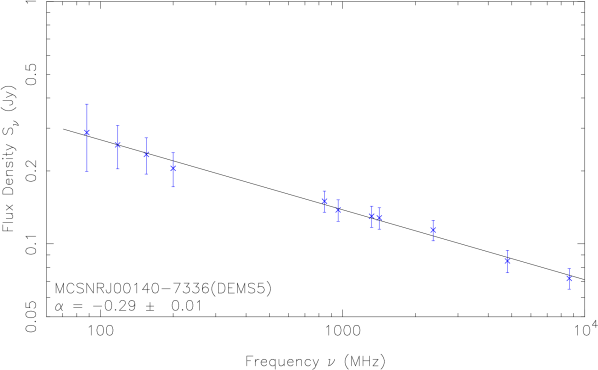
Using the flux density measurements from Table LABEL:tbl-flux, we estimate a spectral index of = –0.29 0.01 across the remnant (including pulsar and PWN) (Fig. 8). The radio spectral index is estimated from the slope of a linear least squares regression, in logarithmic space. From all our radio images it is clear that emission from the putative PWN dominates the radio emission (see section 3.4).
| Parameters | Value |
|---|---|
| 1.99 | |
| Flux a (0.5–8.0 keV) | 3.1 0.9 |
| Flux (unabsorbed) a (0.3–8.0 keV) | 3.6 1.0 |
| X-ray Luminosity at = 60 kpc (erg s-1) | 1.5 1034 |
| X-ray Luminosity at = 67.5 kpc (erg s-1) | 1.9 1034 |
a Flux in units of 10-14 erg cm-2 s-1
b Absorption was fixed equal to the Galactic value along the line of sight of SMC to NHgal= 61020 cm-2
The overall radio continuum spectral index = –0.29 0.01 of the remnant (Fig. 8) adds further support to our claim of the PWN nature of the emission. This value of falls below that of a typical SNR of –0.5 (Bozzetto et al., 2017), and is in line with what is expected from a SNR/PWN system (e.g., the spectral index of the SNR and PWN for LMC SNR J0453–6829 is –0.39 0.03; Haberl et al. (2012b)). As we were unable to disentangle the PWN emission from the rest of the shell, we were not able to estimate the spectral index of the SNR separately. We also note that the estimated value of = –0.29 could be somewhat flatter as our flux density estimates at lower frequencies includes the emission of the pulsar which might not be negligible but is a minor flux density contributor to the whole DEM S5 system (SNR-PWN-Pulsar). We cannot rule out radio emission from the shell but the present radio images show little evidence of any, so we assume that all the radio emission is coming from the putative pulsar (compact source) and its PWN even though we recognise that some emission must come from the SNR itself.
3.3 Search for the Radio Pulsar at Parkes
On 2018 September 14th we observed the point-like source for 2700 seconds using the Directors Time of the ATNF Parkes radio telescope in NSW, Australia. The central beam of the multibeam receiver was used and data were recorded using the Parkes Digital Filterbank (PDFB) systems. We used a 2-bit sampling and a sampling time of 64 microsecond with 512 frequency channels over 256 MHz bandwidth (centred at 1369 MHz). The pulsar searching software package PRESTO (Ransom, 2001) was used to carry out RFI zapping and masking, de-dispersion and searches of periodic signals. We searched for dispersion measures (DMs) of up to 1000 cm-3 pc, but found no convincing candidates with a S/N greater than 8. For a pulse period of 10 ms and DM of 200 cm-3 pc and assuming a pulse duty cycle of 10 percent, our observations provide a flux density limit of 0.24 mJy at 1369 MHz (see e.g., equation 9 of Dai et al., 2017).
| SNR age | ||
|---|---|---|
| (kyr) | (km s-1) | (km s-1) |
| 5.0 | 4157 | 4676 |
| 7.5 | 2771 | 3117 |
| 10.0 | 2078 | 2338 |
| 12.5 | 1663 | 1870 |
| 15.0 | 1386 | 1559 |
| 17.5 | 1188 | 1336 |
| 20.0 | 1039 | 1169 |
| 22.5 | 924 | 1039 |
| 25.0 | 831 | 935 |
| 30.0 | 693 | 779 |
| 40.0 | 520 | 584 |
| 50.0 | 416 | 468 |
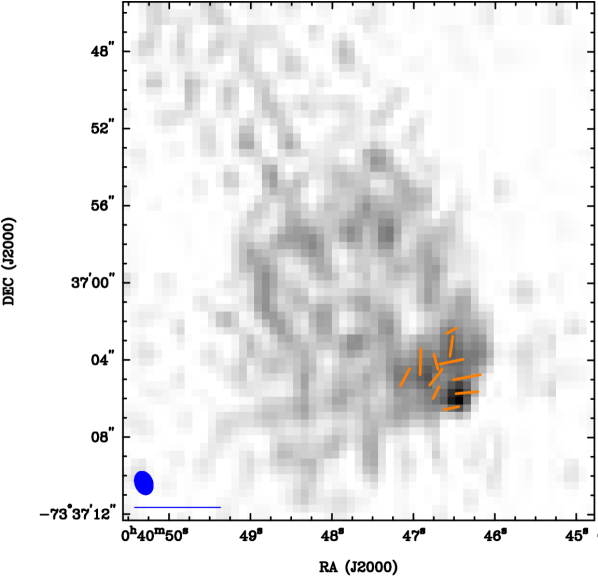
3.4 Radio Polarisation
Linear polarisation images of DEM S5 at 5500 MHz were created using the Q and U Stokes parameters as shown in Fig. 2. However, no reliable polarisation images could be created at any other frequency, due to the poor signal-to-noise ratio (9000 MHz) and depolarisation (2100 MHz) and/or missing short spacings. The fractional polarisation at 5500 MHz has been evaluated using the standard miriad task impol. The majority of the polarised emission is located at the position of the suggested PWN. Our estimated peak fractional polarisation value is P= 32 7 percent while average polarisation is about 23 percent. Such polarisation that we detected in this area would disfavor extragalactic origin of the object and strongly advocate for the SMC birthplace. Moreover, this is in agreement with our other LMC PWN measurements such as Haberl et al. (2012b).
3.5 Optical Morphology
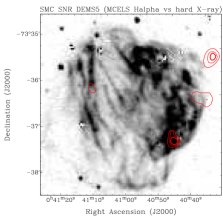
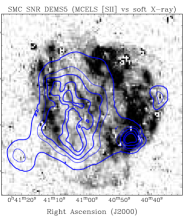
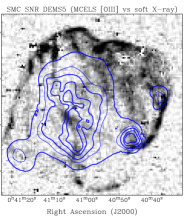
The outer borders of DEM S5 show that [O iii] emission dominates in this part of the remnant (Figs. 6, 7 and 9). The X-rays show no oxygen enhancement and the [O iii] emission clearly delineates the outer blast waves (Fig. 9; right panel). This indicates that it is likely caused by radiative shocks, since [O iii] is the strongest coolant of gas at a few 105 K. Since DEM S5 is probably in a radiative phase it presents very different characteristics than found in much younger SNR like Cas A or G292.0+1.8.
DEM S5 is some 300 pc west of the main body of the SMC where the stellar environment and star formation would favour a Type Ia scenario (Maggi et al., 2016). This is the only known SMC SNR with a lack of recent star formation in the Star Formation History (SFH) map of Harris & Zaritsky (2004). All other SMC SNRs are associated with a recent peak in SFH, although some might be just in projection. However, it is possible that the progenitor of DEM S5 was itself a companion in a binary system that got ejected when the primary exploded (i.e. a runaway star), as the linear distance traveled by a runaway star would be pc. Therefore, it is possible that if the progenitor of DEM S5 was in a binary system with a much more massive (and thus short-lived) companion, it had time to reach its current location, devoid of intense recent star-forming activity. Since the orientation of the PWN propagation is also away from the main body of the SMC, we consider the possibility that the motion of DEM S5 PWN could reflect the peculiar velocity of the progenitor star instead of a kick. However, the runaway velocity is unlikely to be that large, so possibly some compounded velocities (progenitor runaway + pulsar kick) are needed.
The central region is dominated by a keV-temperature thermal plasma from the X-rays (Fig. 9) that runs in the north-south direction of DEM S5. Diffuse X-ray emission to the left (east) in the interior is likely thermal emission from either shock-heated ISM or ejecta that was overran by the reverse shock, which now should have dissipated for the whole SNR. Therefore, the SNR is probably in a late stage of evolution and the missing or very weak radio synchrotron emission should support that as well as the missing thermal X-ray emission from the shell. The radius differences seem to indicate that the right hand part (west) is further evolved and therefore expanding in a medium of higher density. The missing or very weak X-ray emission from the ejecta should support that too. We also recognise a somewhat smaller circular shell at the west side of DEM S5 in H and [S ii] bands. This could be because of a density gradient across the entire SNR. If so, the explosion site might not be at the geometric centre but offset to the west which could result in a somewhat lower putative pulsar kick velocity.
3.6 Infrared Morphology
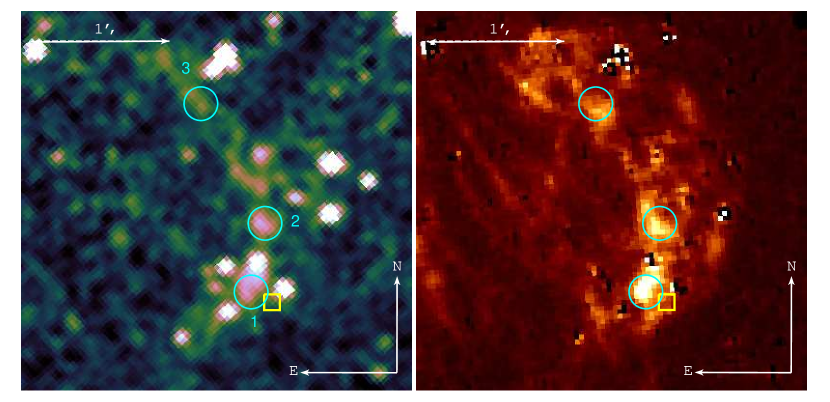
We used the Spitzer SAGE survey (Gordon et al., 2011) to search for any extended mid-IR emission in the direction of DEM S5. We found enhanced emission in several bands with 8 m (IRAC band-4) being the most prominent (see Fig. 10). The IR emission clearly extends towards the north-west of DEM S5 and tightly follows the [S ii]/H emission in this region just above the radio PWN. Neither the optical nor the IR emission peaks precisely at the putative pulsar position. However, we interpret this displacement as shocked gas trailing the whole PWN DEM S5 system. Alternatively, it could come from the SNR shock itself.
To ascertain the nature of the mid-IR nebulosity, we measure the integrated flux density in the brightest hotspots, and compare across the IRAC colors to discern the dominant emission components. The field is dense with stars, notably in the IRAC-1 band image, and we carefully choose the apertures to avoid stars while also maximizing the diffuse emission captured in the aperture. Three positions are identified, with apertures chosen to be 7.5 arcsec in radius, centered on the equatorial J2000 positions: (#1: 10.203408∘, –73.617633∘), (#2: 10.198245∘, –73.608746∘) and (#3: 10.225005∘, –73.594583∘). These positions correspond to the brightest IRAC-4 band nebulosity near the PWN and along the northern extension; see Figs. 10 and 11.
Emission is detected in all four IRAC bands for the three positions; the integrated flux density measurements (magnitude and mJy units) for the first and brightest position (marked #1 in Fig. 11) are shown in Table 6. We then compute the IRAC colors ratios: F(4.5)/F(8.0) and F(3.6)/F(5.8), which are used to decode the emission. For the brightest hotspot, the corresponding colors are 0.56 and 0.41, respectively. The other two positions have similar colors: (0.46, 0.37) and (0.44, 0.35) for positions #2 and #3, respectively. The errors of the IRAC colour ratios are small ( few percent). We now consider the nature of the emission based on these colors.
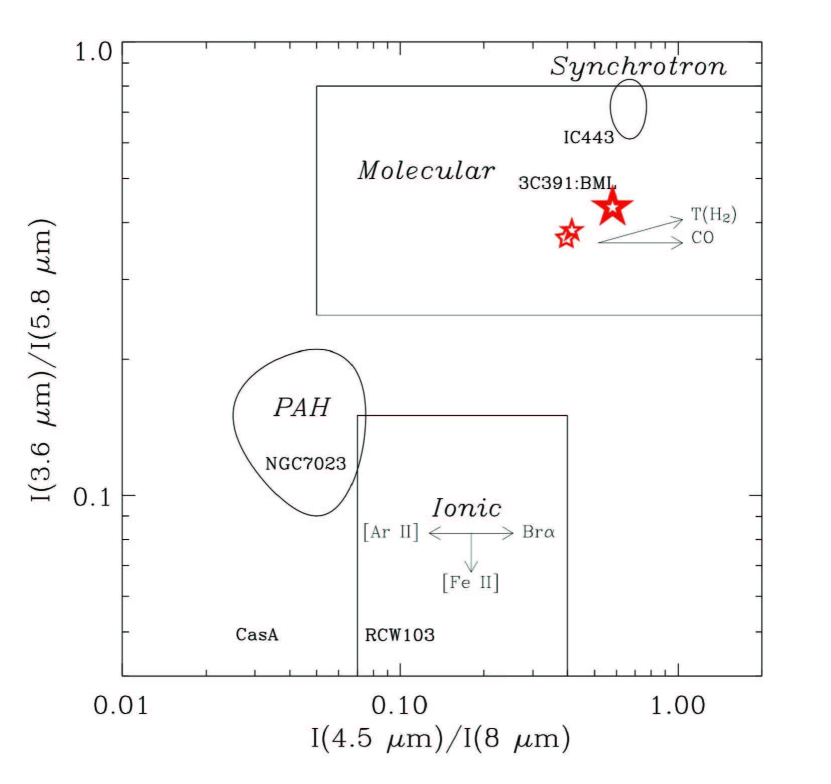
Mid-IR emission arises from atomic, molecular and dust species, excited by star formation and shocks in the ISM. The four broad-bands of IRAC have been effectively used to study SNRs in the Milky Way, including those embedded within dense gas. Reach et al. (2006) modeled the major emission mechanisms and created a set of diagnostics to assess the mid-IR emission associated with SNRs (Reach et al., 2006, see their figs. 1 and 2). They considered thermal (star formation) and shock excitation, with the latter divided between the diffuse and dense gas ( 102 cm-3) ISM. For example, where ionic line emission dominates, the IRAC-3 and 4 bands tend to be very bright relative to the other bands due to the presence of strong [Ar ii] and [Fe ii] lines (see their fig. 1). The Galactic SNR RCW103 is a classic example of IRAC colors influenced by ionic-dominated lines. Alternatively, if the blast wave and subsequent shock passes through dense gas, the dominant coolant is molecular hydrogen, and in conjunction with a molecular CO band head in the IRAC-2 band window, the colors conspire to look very different from the ionic case. The other Galactic SNR IC443 is an example of a SNR embedded within a molecular cloud. The color-color diagnostic of Reach et al. (2006) is shown in Fig. 12, where we have plotted the colors of the DEM S5 mid-IR nebulosity.
Based on the IRAC mid-IR emission diagnostic, the DEM S5 nebulosity is consistent with shock-excited molecular hydrogen. It has colors that are similar to the notably (molecular cloud) embedded SNRs, such as in Galactic SNRS IC443, W44, G311.5, and G346.6 (Reach et al., 2006, see fig. 22). The IR emission is spatially coincident with the radio continuum (see Fig. 11), which may indicate synchrotron contribute to the infrared signal at some low level. Nevertheless, the IRAC colors clearly indicate that molecular emission is the dominant cooling mechanism of the shock front seen in DEM S5.
| Band | RA(J2000) | Dec(J2000) | f | mag | dmag | S/N |
|---|---|---|---|---|---|---|
| (degree) | (degree) | (mJy) | ||||
| IRAC-1 | 10.20294 | –73.61740 | 0.146 | 15.714 | 0.396 | 2.7 |
| IRAC-2 | 10.20309 | –73.61750 | 0.236 | 14.704 | 0.309 | 3.5 |
| IRAC-3 | 10.20324 | –73.61760 | 0.357 | 13.769 | 0.272 | 4.0 |
| IRAC-4 | 10.20380 | –73.61760 | 0.425 | 12.946 | 0.236 | 4.6 |
While it is not unusual to detect SNRs in the IR bands (see e.g. Reach et al., 2006; Bojičić et al., 2007; Lakićević et al., 2015) this would be the first bow shock supersonic PWN that potentially shows IR emission compared to a population of 28 described by Kargaltsev et al. (2017, see their table 1). However, there are a few cases in our Galaxy and in the LMC of detected IR emission from PWN, e.g. B0540–69.3 (Williams et al., 2008; Brantseg et al., 2014), G54.1+0.3 (Temim et al., 2010), and others. Still, none of these bright IR SNRs have bow-shock PWN that moves supersonically. At the same time, the prominent IR emission from DEM S5 clearly following the [S ii] emission which would therefore argue for a more classical SNR origin, with the IR emission associated with the outer SNR shock rather than with the PWN/bow shock. Also, DEM S5 is just the second SMC SNR (among a 25 SNR strong population) detected in IR along with SMC SNR J0106–7205 (a.k.a. IKT 25) (Koo et al., 2007) indicating that the SNR appearance in IR frequencies are indeed rare. However, the sensitivity of the present generation of IR telescopes and especially at the distance of the SMC might play an important role in the poor detection rate of IR emission from the SMC SNRs.
3.7 H i Morphology
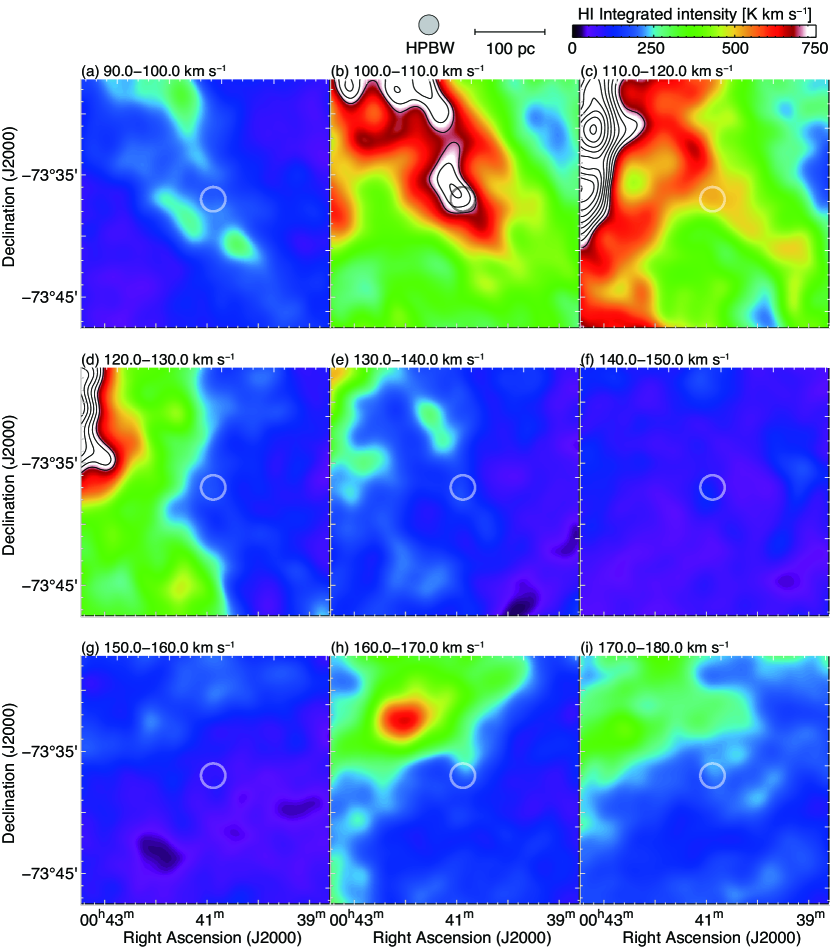
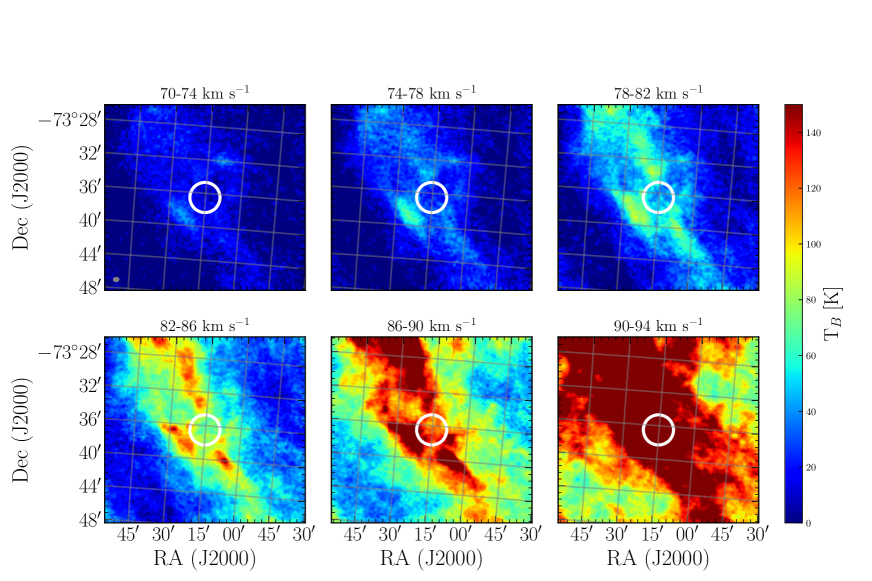
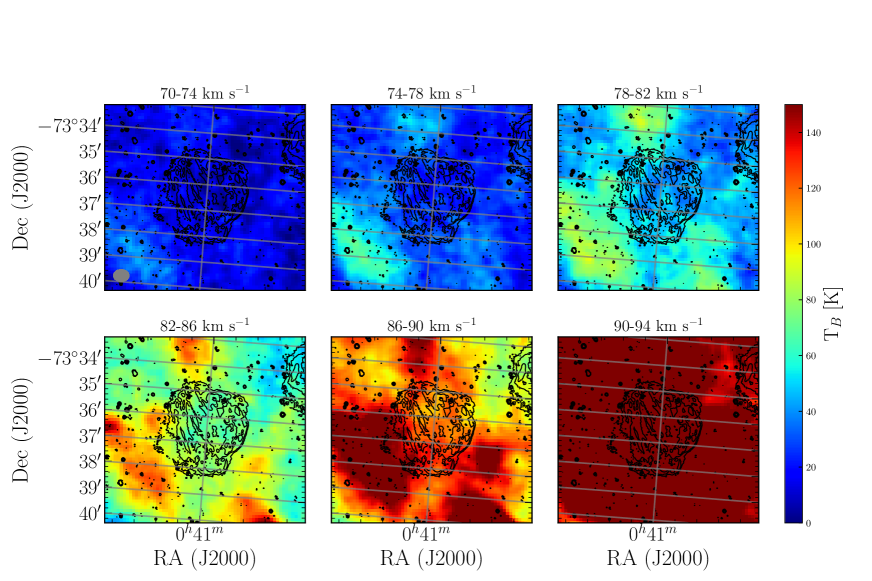
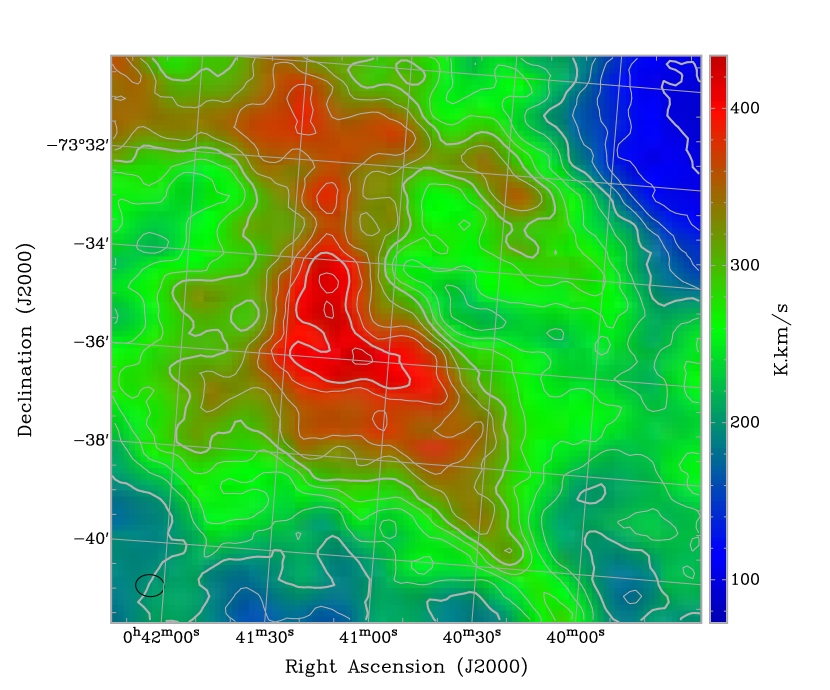
Fig. 13 shows the velocity channel maps of H i obtained with the ATCA and Parkes telescopes (Stanimirovic et al., 1999). We find two prominent H i peaks at the radial velocities of 107 km s-1 (hereafter low-velocity cloud) and 166 km s-1 (hereafter high-velocity cloud). The intensity peak of the high-velocity cloud is 100 pc away from the SNR (Fig. 13; bottom middle panel) and unlikely to be associated. For the low-velocity cloud the intensity peak shows a good spatial correspondence with the position of the SNR (Fig. 13; top middle panel), and a possible cavity-like structure is seen (top left panel). Recent data taken with the ASKAP telescope of the SMC (McClure-Griffiths et al., 2018) shows this cavity in more detail in Fig. 14. The ASKAP data has three times better spatial resolution (35 27 arcsec) compared to ATCA data and an RMS of 0.7 K per a 3.9 km s-1 wide spectral channel. Fig. 14 shows a filament like H i structure that has a cavity corresponding to the location and size of the H emission of SNR DEM S5. A moment map in this velocity range of 96–104 km s-1 of the ASKAP data is shown in Fig. 15.
However, the radius of this cavity (70 pc) is over twice as large as the SNR, so may not be directly associated, or may represent the combined energy input from the progenitor and previous generations of nearby stars and SNe. Possible line-splitting is present. If interpreted as shell expansion, the expansion velocity is 8 km s-1, which leads to a dynamical age of 5 Myr, an average mechanical luminosity of 400 L☉ and a total energy of erg, assuming an ambient density of 2 cm-3 (Staveley-Smith et al., 1997). These values indicate that an association with the SNR is plausible, particularly if the SNR has re-accelerated a shell or pre-existing structure created by past events.
4 Discussion
We explore two possible scenarios for the nature of this object. Namely:
-
1.
A PWN associated with DEM S5: This is supported by (a) the detection of a radio point source coincident with the hard X-ray point source (PWN/pulsar composite), (b) an X-ray spectrum consistent with a power law with photon index typical as seen from PWN/pulsar spectra and the stability of the X-ray flux, (c) the radio spectral indices and (d) shocked IR emission. In the case of PWNe, the extent of the radio emission is generally greater than that in X-rays because of the longer cooling time of radio-emitting electrons. The radio emission may therefore trace the path of the PWN from the centre of the SNR as indicated by the current radio data of DEM S5 at 2100 MHz (Fig. 6). The detection of the cometary morphology in radio indicates a large kick velocity of the pulsar at birth. The estimated distance between the point-like source and the centre of the SNR indicates that the transverse velocity of the putative pulsar could be as high as 2000 km s-1 with an age of 10–15 kyr. The lower and somewhat more realistic limits would put this SNR/PWN system into 28 kyr age and kick-off velocity of 700–800 km s-1. Determination of the putative pulsar velocity is important to determine the birth kick distribution of the NS which can further constrain supernova explosion models and kick mechanisms (e.g. Ng & Romani, 2007). Finding such a source in the SMC is particularly exciting as there might be differences in the pulsar birth, explosion and kick properties in the low-metallicity environment of SMC.
To some extent DEM S5 resembles similar morphological appearance like two well-studied LMC SNRs – MCSNR J0508–6902 (Bozzetto et al., 2014) and MCSNR J0527–7104 (Kavanagh et al., 2016) as well as, for example, Galactic SNR MSH 11-61A (Filipovic et al., 2005a) or G332.5–5.6 (Stupar et al., 2007). While two LMC SNRs are classified as a likely Type Ia, they all have apparent ‘mixed-morphology’ appearance where SNR looks quite different at different wavebands. Mixed-morphology SNRs have shell-like radio morphologies combined with center-filled X-ray morphologies. The central X-ray morphology is produced by thermal emission rather than a central PWN (Rho & Petre, 1998; Pannuti et al., 2017). What makes DEM S5 different from other so called ‘mixed-morphology’ SNRs is its bow-shock PWN.
-
2.
An AGN in the background of the SMC: It is possible that the hard X-ray point source is not associated with the SNR but is instead a background AGN coincident with the SMC. The diffuse radio emission would in this case be due to a radio lobe or jets. A greater absorption component would then be expected to account for the line of sight through the SMC, although this may be sometimes balanced by a soft excess component (Turner & Pounds, 1989). As seen in Section 2.2, the absorption at the source position through the depth of the SMC indicates that the source is most likely located in the SMC. We also searched for a possible AGN association of the source using the ALLWISE criterion in the mid-infrared and from the existing quasar catalogs. We did not find any AGN within 3 of the source position (Maitra et al., 2018).
5 Conclusions and Future Studies
We have presented results of a newly discovered pulsar-powered nebula associated with SNR DEM S5 in the SMC. The object exhibits a cometary morphology which suggests a pulsar leading the PWN and traveling supersonically through the ambient medium. This is the first detected extragalactic source to exhibit this type of morphology. The distance of this object (21.2 pc) from the centre of DEM S5 SNR would require a kick velocity as high as 2000 km s-1 and as low as 700 km s-1 for the pulsar at birth. The SNR/PWN/Pulsar system exhibits a typically flat SED of –0.29 0.01 inline with most other PWNe. We found no convincing DMs candidates (up to 1000 cm-3 pc) with a S/N greater than 8. We also detect radio polarisation in the locale of the emission from this object with a peak (fractional) value at 5500 MHz of P= 32 7 percent and average of 23 percent which strongly indicates non-thermal emission. At IR frequencies, we detect associated shock emission that indicates that the DEM S5 SNR is still expanding. Finally, our H i velocity channel maps show possible interaction with the low-velocity cloud at 107 km s-1.
Future follow-up multi-frequency observations of this object with a high spatial resolution in X-rays will be able to accurately measure the extent of the hard X-ray point source within DEM S5, and resolve the compact object from the diffuse nebula. We will also search for a radio pulsar at this position. Another objective will be to accurately measure the position of the compact object within DEM S5, which will help to better constrain the motion of the pulsar within the SNR and identify its counterpart at other wavelengths.
Finally, the study of PWNe at TeV gamma-ray energies (where the inverse-Compton process provides the gamma-ray photons) allows important constraints on the magnetic field and transport properties of the PWN electrons (e.g. Aharonian et al., 1997). The now well-established X-ray and TeV gamma-ray emission correlation in PWNe (Mattana et al., 2009; Kargaltsev et al., 2013; H. E. S. S. Collaboration et al., 2018) can provide a prediction of the potential TeV flux. For the pulsar spin-down power and characteristic age of DEM S5, the TeV flux could be a factor 5 to 10 times higher than its X-ray flux (3.6 10-14 erg cm-2 s-1). Such a TeV flux level is within the reach of the forthcoming Čerenkov Telescope Array (CTA) (Martin et al., 2019; Cherenkov Telescope Array Consortium et al., 2019). A similar X-ray to TeV flux scaling may apply to the other PWN in the SMC, IKT 16 (Maitra et al., 2015), bringing it within the reach of the CTA.
Acknowledgements
The Australian Compact Array and the Australian SKA Pathfinder (ASKAP) are part of the Australian Telescope which is funded by the Commonwealth of Australia for operation as National Facility managed by CSIRO. This paper includes archived data obtained through the Australia Telescope Online Archive (http://atoa.atnf.csiro.au). We used the karma and miriad software packages developed by the ATNF. Operation of ASKAP is funded by the Australian Government with support from the National Collaborative Research Infrastructure Strategy. ASKAP uses the resources of the Pawsey Supercomputing Centre. Establishment of ASKAP, the Murchison Radio-astronomy Observatory and the Pawsey Supercomputing Centre are initiatives of the Australian Government, with support from the Government of Western Australia and the Science and Industry Endowment Fund. We acknowledge the Wajarri Yamatji people as the traditional owners of the Observatory site. M.S. acknowledges support by the Deutsche Forschungsgemeinschaft (DFG) through the Heisenberg research grant SA 2131/4–1 and the Heisenberg professor grant SA 2131/5–1. This work is part of project No. 176005, ‘Emission nebulae: structure and evolution’, supported by the Ministry of Education, Science, and Technological Development of the Republic of Serbia. Parts of this research were conducted with support of Australian Research Council Centre of Excellence for All Sky Astrophysics in 3 Dimensions (ASTRO 3D), through project number CE170100013. The authors would like to thank the anonymous referee for a constructive report and useful comments.
References
- Aharonian et al. (1997) Aharonian F. A., Atoyan A. M., Kifune T., 1997, MNRAS, 291, 162
- Arnaud (1996) Arnaud K. A., 1996, in Jacoby G. H., Barnes J., eds, Astronomical Society of the Pacific Conference Series Vol. 101, Astronomical Data Analysis Software and Systems V. p. 17
- Barkov et al. (2019) Barkov M. V., Lyutikov M., Khangulyan D., 2019, MNRAS, 484, 4760
- Besla et al. (2007) Besla G., Kallivayalil N., Hernquist L., Robertson B., Cox T. J., van der Marel R. P., Alcock C., 2007, ApJ, 668, 949
- Bojičić et al. (2007) Bojičić I. S., Filipović M. D., Parker Q. A., Payne J. L., Jones P. A., Reid W., Kawamura A., Fukui Y., 2007, MNRAS, 378, 1237
- Bozzetto et al. (2012) Bozzetto L. M., et al., 2012, MNRAS, 420, 2588
- Bozzetto et al. (2014) Bozzetto L. M., et al., 2014, MNRAS, 439, 1110
- Bozzetto et al. (2017) Bozzetto L. M., et al., 2017, ApJS, 230, 2
- Brantseg et al. (2014) Brantseg T., McEntaffer R. L., Bozzetto L. M., Filipovic M., Grieves N., 2014, ApJ, 780, 50
- Cherenkov Telescope Array Consortium et al. (2019) Cherenkov Telescope Array Consortium T., et al., 2019, Science with the Cherenkov Telescope Array. WORLD SCIENTIFIC (https://www.worldscientific.com/doi/pdf/10.1142/10986), doi:10.1142/10986, https://www.worldscientific.com/doi/abs/10.1142/10986
- Cioffi et al. (1988) Cioffi D. F., McKee C. F., Bertschinger E., 1988, ApJ, 334, 252
- Collier et al. (2016) Collier J. D., Norris R. P., Filipović M. D., Tothill N. F. H., 2016, Astronomische Nachrichten, 337, 36
- Crawford et al. (2011) Crawford E. J., Filipovic M. D., de Horta A. Y., Wong G. F., Tothill N. F. H., Draskovic D., Collier J. D., Galvin T. J., 2011, Serbian Astronomical Journal, 183, 95
- Crawford et al. (2014) Crawford E. J., Filipović M. D., McEntaffer R. L., Brantseg T., Heitritter K., Roper Q., Haberl F., Urošević D., 2014, AJ, 148, 99
- Dai et al. (2017) Dai S., Johnston S., Hobbs G., 2017, MNRAS, 472, 1458
- Filipovic et al. (1997) Filipovic M. D., Jones P. A., White G. L., Haynes R. F., Klein U., Wielebinski R., 1997, A&AS, 121, 321
- Filipovic et al. (1998) Filipovic M. D., Haynes R. F., White G. L., Jones P. A., 1998, A&AS, 130, 421
- Filipović et al. (2002) Filipović M. D., Bohlsen T., Reid W., Staveley-Smith L., Jones P. A., Nohejl K., Goldstein G., 2002, MNRAS, 335, 1085
- Filipovic et al. (2005a) Filipovic M. D., Payne J. L., Jones P. A., 2005a, Serbian Astronomical Journal, 170, 47
- Filipović et al. (2005b) Filipović M. D., Payne J. L., Reid W., Danforth C. W., Staveley-Smith L., Jones P. A., White G. L., 2005b, MNRAS, 364, 217
- Filipović et al. (2008) Filipović M. D., et al., 2008, A&A, 485, 63
- For et al. (2018) For B. Q., et al., 2018, MNRAS, 480, 2743
- Gaensler et al. (2004) Gaensler B. M., van der Swaluw E., Camilo F., Kaspi V. M., Baganoff F. K., Yusef-Zadeh F., Manchester R. N., 2004, ApJ, 616, 383
- Gooch (1995) Gooch R., 1995, in Shaw R. A., Payne H. E., Hayes J. J. E., eds, Astronomical Society of the Pacific Conference Series Vol. 77, Astronomical Data Analysis Software and Systems IV. p. 144
- Gordon et al. (2011) Gordon K. D., et al., 2011, AJ, 142, 102
- H. E. S. S. Collaboration et al. (2018) H. E. S. S. Collaboration et al., 2018, A&A, 612, A3
- Haberl & Sturm (2016) Haberl F., Sturm R., 2016, A&A, 586, A81
- Haberl et al. (2012a) Haberl F., Sturm R., Filipović M. D., Pietsch W., Crawford E. J., 2012a, A&A, 537, L1
- Haberl et al. (2012b) Haberl F., et al., 2012b, A&A, 543, A154
- Haberl et al. (2012c) Haberl F., et al., 2012c, A&A, 545, A128
- Han et al. (2016) Han J., Wang C., Xu J., Han J.-L., 2016, Research in Astronomy and Astrophysics, 16, 159
- Hancock et al. (2012) Hancock P. J., Murphy T., Gaensler B. M., Hopkins A., Curran J. R., 2012, MNRAS, 422, 1812
- Hancock et al. (2018) Hancock P. J., Trott C. M., Hurley-Walker N., 2018, Publ. Astron. Soc. Australia, 35, e011
- Harris & Zaritsky (2004) Harris J., Zaritsky D., 2004, AJ, 127, 1531
- Holland-Ashford et al. (2017) Holland-Ashford T., Lopez L. A., Auchettl K., Temim T., Ramirez-Ruiz E., 2017, ApJ, 844, 84
- Hurley-Walker et al. (2017) Hurley-Walker N., et al., 2017, MNRAS, 464, 1146
- Kargaltsev & Pavlov (2008) Kargaltsev O., Pavlov G. G., 2008, in Bassa C., Wang Z., Cumming A., Kaspi V. M., eds, American Institute of Physics Conference Series Vol. 983, 40 Years of Pulsars: Millisecond Pulsars, Magnetars and More. pp 171–185 (arXiv:0801.2602), doi:10.1063/1.2900138
- Kargaltsev et al. (2013) Kargaltsev O., Rangelov B., Pavlov G. G., 2013, preprint, p. arXiv:1305.2552 (arXiv:1305.2552)
- Kargaltsev et al. (2017) Kargaltsev O., Pavlov G. G., Klingler N., Rangelov B., 2017, Journal of Plasma Physics, 83, 635830501
- Katsuda et al. (2018) Katsuda S., et al., 2018, ApJ, 856, 18
- Kavanagh et al. (2016) Kavanagh P. J., et al., 2016, A&A, 586, A4
- Klinger et al. (2002) Klinger R. J., Dickel J. R., Fields B. D., Milne D. K., 2002, AJ, 124, 2135
- Klingler et al. (2018) Klingler N., Kargaltsev O., Pavlov G. G., Ng C.-Y., Beniamini P., Volkov I., 2018, ApJ, 861, 5
- Koo et al. (2007) Koo B.-C., et al., 2007, PASJ, 59, S455
- Kothes (2017) Kothes R., 2017, Radio Properties of Pulsar Wind Nebulae. Springer International Publishing, Cham, pp 1–27, doi:10.1007/978-3-319-63031-1_1, %****␣mnras_template.tex␣Line␣1025␣****https://doi.org/10.1007/978-3-319-63031-1_1
- Lakićević et al. (2015) Lakićević M., et al., 2015, ApJ, 799, 50
- Macri et al. (2006) Macri L. M., Stanek K., Bersier D., Greenhill L., Reid M., 2006, The Astrophysical Journal, 652, 1133
- Maggi et al. (2016) Maggi P., et al., 2016, A&A, 585, A162
- Maitra et al. (2015) Maitra C., Ballet J., Filipović M. D., Haberl F., Tiengo A., Grieve K., Roper Q., 2015, A&A, 584, A41
- Maitra et al. (2018) Maitra C., Ballet J., Esposito P., Haberl F., Tiengo A., Filipović M. D., Acero F., 2018, A&A, 612, A87
- Marelli et al. (2013) Marelli M., et al., 2013, ApJ, 765, 36
- Martin et al. (2019) Martin P., Lu C.-C., Voelk H., Renaud M., Filipovic M., 2019, KSP: Large Magellanic Cloud Survey. pp 125–141 (https://www.worldscientific.com/doi/pdf/10.1142/97898132700910007), doi:10.1142/9789813270091_0007, https://www.worldscientific.com/doi/abs/10.1142/97898132700910007
- Mattana et al. (2009) Mattana F., et al., 2009, ApJ, 694, 12
- McClure-Griffiths et al. (2018) McClure-Griffiths N. M., et al., 2018, Nature Astronomy, 2, 901
- McKee & Truelove (1995) McKee C. F., Truelove J. K., 1995, Phys. Rep., 256, 157
- Moon et al. (2004) Moon D. S., et al., 2004, ApJ, 610, L33
- Ng & Romani (2007) Ng C.-Y., Romani R. W., 2007, ApJ, 660, 1357
- Owen et al. (2011) Owen R. A., et al., 2011, A&A, 530, A132
- Pannuti et al. (2017) Pannuti T. G., et al., 2017, ApJ, 839, 59
- Pavan et al. (2014a) Pavan L., et al., 2014a, in International Journal of Modern Physics Conference Series. p. 1460172, doi:10.1142/S2010194514601720
- Pavan et al. (2014b) Pavan L., et al., 2014b, A&A, 562, A122
- Payne et al. (2004) Payne J. L., Filipović M. D., Reid W., Jones P. A., Staveley-Smith L., White G. L., 2004, MNRAS, 355, 44
- Payne et al. (2007) Payne J. L., White G. L., Filipović M. D., Pannuti T. G., 2007, MNRAS, 376, 1793
- Pellegrini et al. (2012) Pellegrini E. W., Oey M. S., Winkler P. F., Points S. D., Smith R. C., Jaskot A. E., Zastrow J., 2012, ApJ, 755, 40
- Ransom (2001) Ransom S. M., 2001, in American Astronomical Society Meeting Abstracts. p. 119.03
- Reach et al. (2006) Reach W. T., et al., 2006, AJ, 131, 1479
- Reid et al. (2006) Reid W. A., Payne J. L., Filipović M. D., Danforth C. W., Jones P. A., White G. L., Staveley-Smith L., 2006, MNRAS, 367, 1379
- Reynolds et al. (2017) Reynolds S. P., Pavlov G. G., Kargaltsev O., Klingler N., Renaud M., Mereghetti S., 2017, Space Sci. Rev., 207, 175
- Rho & Petre (1998) Rho J., Petre R., 1998, ApJ, 503, L167
- Roper et al. (2015) Roper Q., McEntaffer R. L., DeRoo C., Filipovic M., Wong G. F., Crawford E. J., 2015, ApJ, 803, 106
- Russell & Dopita (1992) Russell S. C., Dopita M. A., 1992, ApJ, 384, 508
- Safi-Harb et al. (1995) Safi-Harb S., Ogelman H., Finley J. P., 1995, ApJ, 439, 722
- Sault & Wieringa (1994) Sault R. J., Wieringa M. H., 1994, A&AS, 108, 585
- Sault et al. (1995) Sault R. J., Teuben P. J., Wright M. C. H., 1995, in Shaw R. A., Payne H. E., Hayes J. J. E., eds, Astronomical Society of the Pacific Conference Series Vol. 77, Astronomical Data Analysis Software and Systems IV. p. 433 (arXiv:astro-ph/0612759)
- Scowcroft et al. (2016) Scowcroft V., Freedman W. L., Madore B. F., Monson A., Persson S. E., Rich J., Seibert M., Rigby J. R., 2016, The Astrophysical Journal, 816, 49
- Smith et al. (2000) Smith C., Leiton R., Pizarro S., 2000, in Alloin D., Olsen K., Galaz G., eds, Astronomical Society of the Pacific Conference Series Vol. 221, Stars, Gas and Dust in Galaxies: Exploring the Links. p. 83
- Stanimirovic et al. (1999) Stanimirovic S., Staveley-Smith L., Dickey J. M., Sault R. J., Snowden S. L., 1999, MNRAS, 302, 417
- Staveley-Smith et al. (1997) Staveley-Smith L., Sault R. J., Hatzidimitriou D., Kesteven M. J., McConnell D., 1997, MNRAS, 289, 225
- Strüder et al. (2001) Strüder L., et al., 2001, A&A, 365, L18
- Stupar et al. (2007) Stupar M., Parker Q. A., Filipović M. D., Frew D. J., Bojičić I., Aschenbach B., 2007, MNRAS, 381, 377
- Sturm et al. (2013) Sturm R., et al., 2013, A&A, 558, A3
- Temim et al. (2010) Temim T., Slane P., Reynolds S. P., Raymond J. C., Borkowski K. J., 2010, ApJ, 710, 309
- Tiengo et al. (2008) Tiengo A., Esposito P., Mereghetti S., 2008, ApJ, 680, L133
- Turner & Pounds (1989) Turner T. J., Pounds K. A., 1989, MNRAS, 240, 833
- Turner et al. (2001) Turner M. J. L., et al., 2001, A&A, 365, L27
- Turtle et al. (1998) Turtle A. J., Ye T., Amy S. W., Nicholls J., 1998, Publ. Astron. Soc. Australia, 15, 280
- Weaver et al. (1977) Weaver R., McCray R., Castor J., Shapiro P., Moore R., 1977, ApJ, 218, 377
- Williams et al. (2008) Williams B. J., et al., 2008, ApJ, 687, 1054
- Wong et al. (2011a) Wong G. F., Filipovic M. D., Crawford E. J., de Horta A. Y., Galvin T., Draskovic D., Payne J. L., 2011a, Serbian Astronomical Journal, 182, 43
- Wong et al. (2011b) Wong G. F., et al., 2011b, Serbian Astronomical Journal, 183, 103
- Wong et al. (2012a) Wong G. F., et al., 2012a, Serbian Astronomical Journal, 184, 93
- Wong et al. (2012b) Wong G. F., Filipovic M. D., Crawford E. J., Tothill N. F. H., De Horta A. Y., Galvin T. J., 2012b, Serbian Astronomical Journal, 185, 53