Composite Event Recognition for Maritime Monitoring
Abstract.
Maritime monitoring systems support safe shipping as they allow for the real-time detection of dangerous, suspicious and illegal vessel activities. We present such a system using the Run-Time Event Calculus, a composite event recognition system with formal, declarative semantics. For effective recognition, we developed a library of maritime patterns in close collaboration with domain experts. We present a thorough evaluation of the system and the patterns both in terms of predictive accuracy and computational efficiency, using real-world datasets of vessel position streams and contextual geographical information.
1. Introduction
The International Maritime Organization (IMO)111http://www.imo.org/en/OurWork/Environment/Pages/Default.aspx states that 90% of the global trade is handled by the shipping industry. Maritime monitoring systems support safe shipping by detecting, in real-time, dangerous, suspicious and illegal vessel activities. Such systems typically use the Automatic Identification System (AIS)222http://www.imo.org/en/OurWork/Safety/Navigation/Pages/AIS.aspx, a tracking technology for locating vessels at sea through data exchange. AIS integrates a VHF transceiver with a positioning device (e.g., GPS), and other electronic navigation sensors, such as a gyrocompass or rate of turn indicator, thus producing valuable data regarding the vessel and its current status. The acquisition of positional data is achieved by AIS base stations along coastlines, or even by satellites when out of range of terrestrial networks.
Maritime monitoring systems have been attracting considerable attention for economic as well as environmental reasons (Jousselme et al., 2016a; Vandecasteele and Napoli, 2012; Idiri and Napoli, 2012; Snidaro et al., 2015; Terroso-Saenz et al., 2016; Riveiro, 2011; Jousselme et al., 2016b; Shahir et al., 2015; Greidanus et al., 2017). Terosso-Saenz et al. (Terroso-Saenz et al., 2016), e.g., presented a system detecting abnormally high or low vessel speed, as well as when two vessels are in danger of colliding. SUMO (Greidanus et al., 2017) is an open-source system combining AIS streams with synthetic aperture radar images for detecting illegal oil dumping, piracy and unsustainable fishing. van Laere et al. (van Laere and Nilsson, 2009) evaluated a workshop aiming at the identification of potential vessel anomalies, such as tampering, rendez-vous between vessels and unusual routing.
In previous work, we presented a maritime monitoring system (Patroumpas et al., 2017) with a component for trajectory simplification, allowing for efficient maritime stream analytics, and a composite event recognition component, combining kinematic vessel streams with contextual (geographical) knowledge for real-time vessel activity detection. To improve the accuracy of the system, we collaborated, in the context of this paper, with domain experts in order to construct effective patterns of maritime activity. Thus, we present a library of such patterns in the Event Calculus (Artikis et al., 2015)—the language of the composite event recognition component. Furthermore, we evaluate these patterns and the maritime monitoring system both in terms of predictive accuracy and efficiency, using real datasets.
Our data comes from the datAcron project333http://datacron-project.eu/. First, we used a publicly available stream of 18M AIS position signals, transmitted by 5K vessels sailing in the Atlantic Ocean around the port of Brest, France, between October 2015 and March 2016 (Ray et al., 2018). Second, we employed a stream of 55M terrestrial and satellite AIS position signals transmitted by 34K vessels during January 2016 in the European seas (Camossi et al., 2017). These streams are consumed in conjunction with static geographical data, such as areas represented as polygons—fishing areas (Vespe et al., 2016; Natale et al., 2015), (protected) Natura 2000 areas444http://ec.europa.eu/environment/nature/natura2000/index_en.htm, etc.
The contributions of this paper are then the following:
-
•
A monitoring system with a formal specification of effective maritime patterns. In contrast to related systems, these patterns concern a wide range of maritime activities.
-
•
An evaluation of the system and the patterns in terms of both efficiency and accuracy using large, real datasets.
All composite maritime activities that were recognised on the dataset of Brest have been made publicly available (Pitsikalis and Artikis, 2019), in order to aid further research, such as the development of machine learning algorithms for pattern construction and classification.
The remainder of the paper is structured as follows. In Section 2 we present the background of this work. Then, in Section 3 we present the maritime patterns in the language of RTEC, our composite event recognition engine. The empirical evaluation is presented in Section 4, while in Section 5 we summarise the work and discuss further research directions.
2. Background
2.1. Spatial Preprocessing & Trajectory Simplification
Composite event recognition (CER) on vessel position signals, as we have defined it (Patroumpas et al., 2017), requires two online tasks/steps: (a) computing a set of spatial relations among vessels, such as proximity, and among vessels and areas of interest (e.g., fishing areas), and (b) labelling position signals of interest as ‘critical’—such as when a vessel changes its speed, turns, stops, moves slowly or stops transmitting its position. Figure 1 illustrates these steps. AIS position signals are streamed into the system, and go through a spatial preprocessing step, for the computation of the spatial relations required by the composite event patterns (Santipantakis et al., 2018). These relations are displayed at the top of Table 1. Then, the relevant position signals are annotated as critical—see the middle part of Table 1. Subsequently, the position signals may be consumed by the CER component either directly (see ‘enriched AIS stream’ in Figure 1), or after being compressed, i.e. after removing all signals that have not been labelled as critical (see ‘critical point stream’ in Figure 1). In Section 4, we present the effects of such a compression on the efficiency and the accuracy of the system.
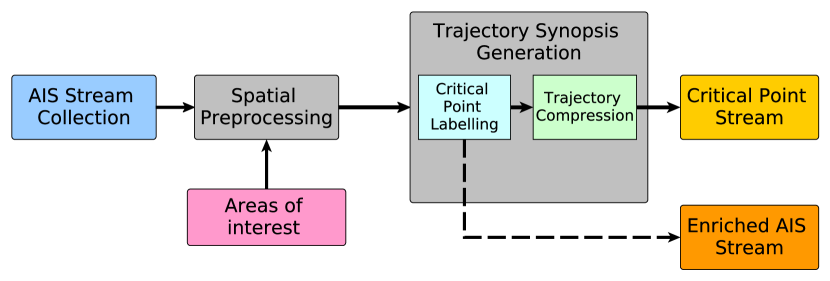
Critical point labelling is performed as part of trajectory synopsis generation, whereby major changes along each vessel’s movement are tracked. This process can instantly identify critical points along each trajectory, such as a stop, a turn, or slow motion. Using the retained critical points, we may reconstruct a vessel trajectory with small acceptable deviations from the original one. Empirical results have indicated that 70-80% of the input data may be discarded as redundant, while compression ratio can be up to 99% when the frequency of position updates is high (Patroumpas et al., 2017).
2.2. Composite Event Recognition
We perform CER using the ‘Event Calculus for Run-Time reasoning’ (RTEC) (Artikis et al., 2015; Artikis and Sergot, 2010), an open-source Prolog implementation of the Event Calculus (Kowalski and Sergot, 1986), designed to compute continuous narrative assimilation queries for pattern matching on data streams. RTEC has a formal, declarative semantics—composite patterns are (locally) stratified logic programs (Przymusinski, 1987). Moreover, RTEC includes optimisation techniques for efficient pattern matching, such as ‘windowing’, whereby all input events that took place prior to the current window are discarded/‘forgotten’. Details about the reasoning algorithms of RTEC, including a complexity analysis, may be found in (Artikis et al., 2015).
| Event/Activity | Description | |
|---|---|---|
| Spatial | Vessel enters area | |
| Vessel leaves area | ||
| Vessels and are close to each other | ||
| Critical | Vessel stopped sending | |
| position signals | ||
| Vessel resumed sending | ||
| position signals | ||
| Vessel started moving at a low speed | ||
| Vessel stopped moving | ||
| at a low speed | ||
| Vessel started being idle | ||
| Vessel stopped being idle | ||
| Vessel started changing its speed | ||
| Vessel stopped changing its speed | ||
| Vessel changed its heading | ||
| Composite | Vessel has high speed near coast | |
| Vessel is anchored or moored | ||
| Vessel is drifting | ||
| Vessel is trawling | ||
| Vessels and are engaged | ||
| in tugging | ||
| Vessels and are engaged in | ||
| pilot boarding | ||
| Vessels and are having | ||
| a rendez-vous | ||
| Vessel is loitering | ||
| Vessel is engaged in a | ||
| search and rescue (SAR) operation |
| Predicate | Meaning |
|---|---|
| happensAt | Event occurs at time |
| holdsAt | The value of fluent is at time |
| holdsFor | is the list of the maximal intervals for which holds continuously |
| initiatedAt | At time a period of time for which is initiated |
| terminatedAt | At time a period of time for which is terminated |
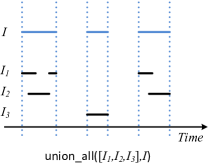
| union_all | is the list of maximal intervals produced by the union of the lists of maximal intervals of list |
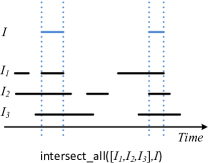
| intersect_all | is the list of maximal intervals produced by the intersection of the lists of maximal intervals of list |
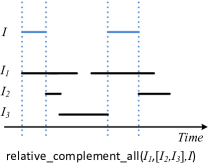
| relative_complement_all | is the list of maximal intervals produced by the relative complement of the list |
| of maximal intervals with respect to every list of maximal intervals of list |
The time model in RTEC is linear and includes integer time-points. An event description includes rules that define the event instances with the use of the happensAt predicate, the effects of events on fluents—time-varying properties—with the use of the initiatedAt and terminatedAt predicates, and the values of the fluents with the use of the holdsAt and holdsFor predicates. Table 2 summarises the main predicates of RTEC.
Fluents are ‘simple’ or ‘statically determined’. In brief, simple fluents are defined by means of initiatedAt and terminatedAt rules, while statically determined fluents are defined by means of application-dependent holdsFor rules, along with the interval manipulation constructs of RTEC: union_all, intersect_all and relative_complement_all. See Table 2 for a brief explanation of these constructs and Figure 2 for an example visualisation. Composite events/activities are typically durative; thus the task generally is to compute the maximal intervals for which a fluent expressing a composite activity has a particular value continuously. Below, we discuss the representation of fluents/composite maritime activities, and briefly present the way in which we compute their maximal intervals.
3. Maritime Activity Patterns
In previous work, we developed a system for maritime surveillance focusing mostly on efficiency (Patroumpas et al., 2017). To improve the accuracy of the system, we collaborated with the domain experts of the datAcron project in order to construct effective patterns of maritime activity. In what follows, we present a formalisation of some of these patterns in the language of RTEC.
3.1. Building Blocks
We begin by presenting a set of building blocks that will be later used for the construction of more involved patterns.
3.1.1. Vessel within area of interest
Calculating the time periods during which a vessel is in an area of some type, such as a (protected) Natura 2000, fishing or anchorage area, is particularly useful in maritime (e.g. fishing) patterns. Consider the formalisation below:
| (9) |
Variables start with an upper-case letter, while predicates and constants start with a lower-case letter. is a simple fluent indicating that a is within an area of some type. We chose to define as a Boolean fluent, as opposed to a multi-valued one, since areas of different types may overlap. and are input events computed at the spatial preprocessing step (see the top part of Table 1), indicating that a entered (respectively left) an area with . is an atemporal predicate storing the areas of interest of a given dataset. is initiated when a enters an area of , and terminated when the leaves the area of . is also terminated when the trajectory synopsis generator produces a event (see the middle part of Table 1), indicating the beginning of a communication gap (in the subsection that follows we discuss further communication gaps). In this case we chose to make no assumptions about the location of the vessel. With the use of rule-set (9), RTEC computes the maximal intervals during which a vessel is said to be within an area of some type.
| Fluent | Min Speed | Max Speed |
|---|---|---|
| (knots) | (knots) | |
| 0 | 0.5 | |
| 0.5 | 5 | |
| 0.5 | min service speed | |
| of vessel type | ||
| min service speed | max service speed | |
| of vessel type | of vessel type | |
| max service speed | ||
| of vessel type | - | |
| 1.2 | 15 | |
| 1.0 | 9.0 | |
| 2.7 | - |
3.1.2. Communication gap
According to the trajectory synopsis generator, a communication gap takes place when no message has been received from a vessel for at least 30 minutes. All numerical thresholds, however, may be tuned (e.g. by machine learning algorithms) to meet the requirements of the application under consideration. A communication gap may occur when a vessel sails in an area with no AIS receiving station nearby, or because the transmission power of its transceiver allows broadcasting in a shorter range, or when the transceiver is deliberately turned off. The rules below present a formalisation of communication gap:
| (18) |
is a simple, multi-valued fluent, and are input critical events (see Table 1), ‘not’ expresses Prolog’s negation-by-failure (Clark, 1978), while variables starting with ‘_’, such as , are free. We chose to distinguish between communication gaps occurring near ports from those occurring in the open sea, as the first ones usually do not have a significant role in maritime monitoring. According to rule-set (18), a communication gap is said to be initiated when the synopsis generator emits a ‘gap start’ event, and terminated when a ‘gap end’ is detected. Given this rule-set, RTEC computes the maximal intervals for which a vessel is not sending position signals.
3.1.3. Speed-related building blocks
We have defined a number of speed-related building blocks that are useful in the specification of the more complex maritime patterns, which will be presented in the following section. Table 3 presents these building blocks. e.g. indicates that the vessel has speed between 0 and 0.5 knots. All numerical thresholds have been set in collaboration with domain experts. Moreover, as mentioned earlier, these thresholds may be optimised for different monitoring applications. is specified by means of the and input critical events. Similarly, indicates that the vessel sails at a speed between 0.5 and 5 knots, and is defined by means of the and critical events. and are independent of the vessel type. In contrast, the multi-valued fluent takes into consideration the minimum and maximum service speed—the speed maintained by a ship under normal load and weather conditions—of the type of vessel . For example, when is a cargo vessel and its speed is between 9 and 15 knots.
is used for the specification of tugging, i.e. the activity of pulling a ship into a port, is restricted to fishing vessels, while concerns search and rescue (SAR) vessels. For example, is true when the SAR vessel has speed above 2.7 knots (as indicated in Table 3, we have not set an upper speed limit for SAR vessels). In addition to the building blocks displayed in Table 3, we employ , a fluent expressing the maximal intervals during which a vessel is changing its speed, according to the input and critical events (see Table 1).

3.2. Maritime Situational Indicators
Our aim is to detect in real-time Maritime Situational Indicators (Jousselme et al., 2016b), i.e. maritime activities of special significance. The indicators that we have formalised are the synthesis of the outcomes of workshops on user requirements elicitation (Andler et al., 2009; Roy and Davenport, 2010), restricting attention to AIS data (Ray et al., 2019). Figure 3 displays the hierarchy of our formalisation, i.e. the relations between the indicators’ specifications. In this figure, an arrow from fluent to fluent denotes that is used in the specification of . To avoid clutter, we omit the presentation of the input stream elements (items above the double horizontal line in Table 1) from Figure 3.
3.2.1. Vessel with high speed near coast
Several countries have regulated maritime zones. In French territorial waters, for example, there is a 5 knots speed limit for vessels or watercrafts within 300 meters from the coast. One of the causes of marine accidents near the coast is vessels sailing with high speed, thus the early detection of violators ensures safety by improving the efficiency of law enforcement. Figure 4 illustrates a vessel not conforming to the above regulations. Consider the following formalisation:
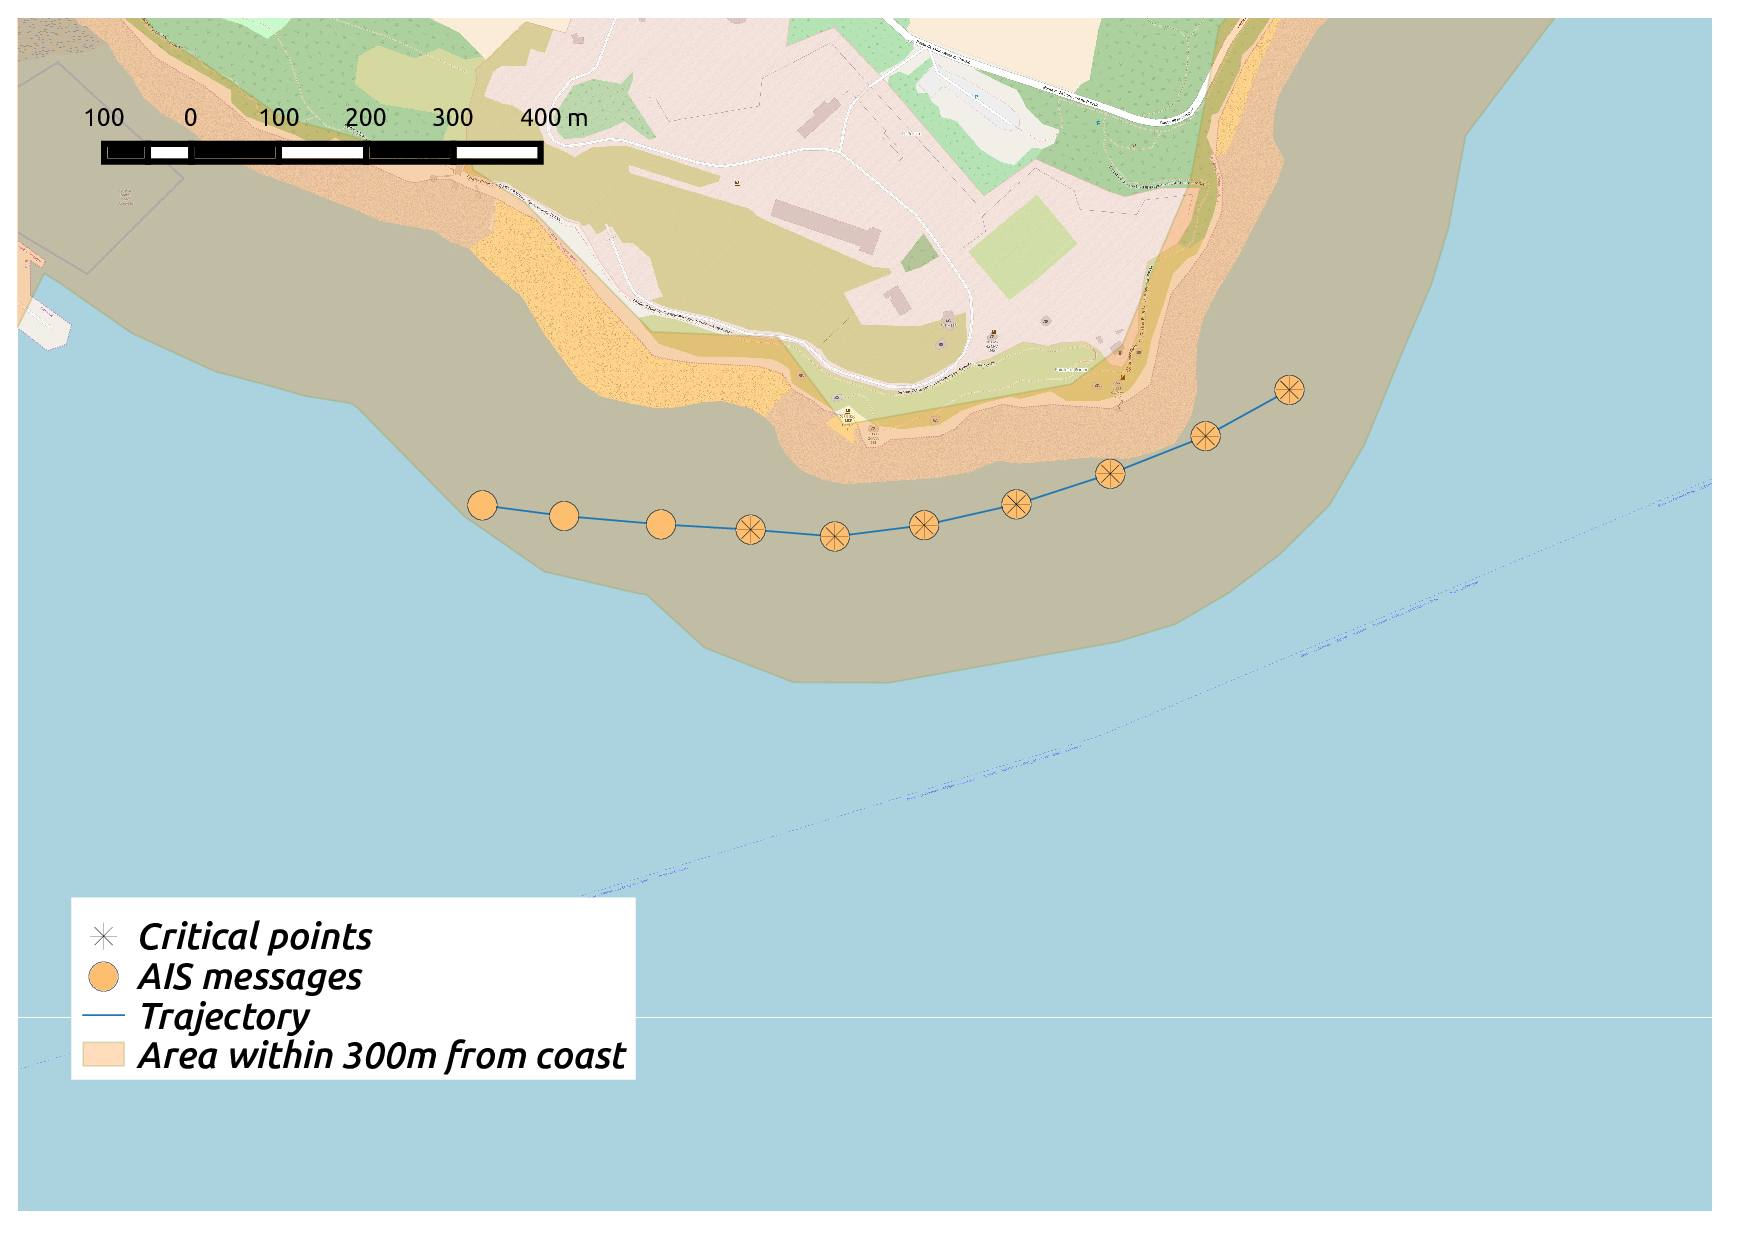
| (28) |
is a Boolean simple fluent indicating that a is exceeding the speed limit imposed near the coast. is input contextual information expressing the speed, course over ground (CoG) and true heading of a vessel (the use of the last two parameters will be illustrated in the following sections). This information is attached to each incoming AIS message. Recall that variables starting with ‘_’ are free. expresses the time periods during which a is within 300 meters from the French coastline (see rule-set (9) for the specification of ). is an auxiliary atemporal predicate recording the numerical thresholds of the maritime patterns. The use of this predicate supports code transferability, since the use of different thresholds for different applications requires only the modification of the predicate, and not the modification of the patterns. end (respectively start) is an RTEC built-in event indicating the ending (resp. starting) points for which holds continuously. According to rule-set (28), therefore, is initiated when the sails within 300 meters from the French coastline with speed above 5 knots, and terminated when its speed goes below 5 knots, sails away (further than 300 meters) from the coastline, or stops sending position signals (recall that is terminated/ended by ).
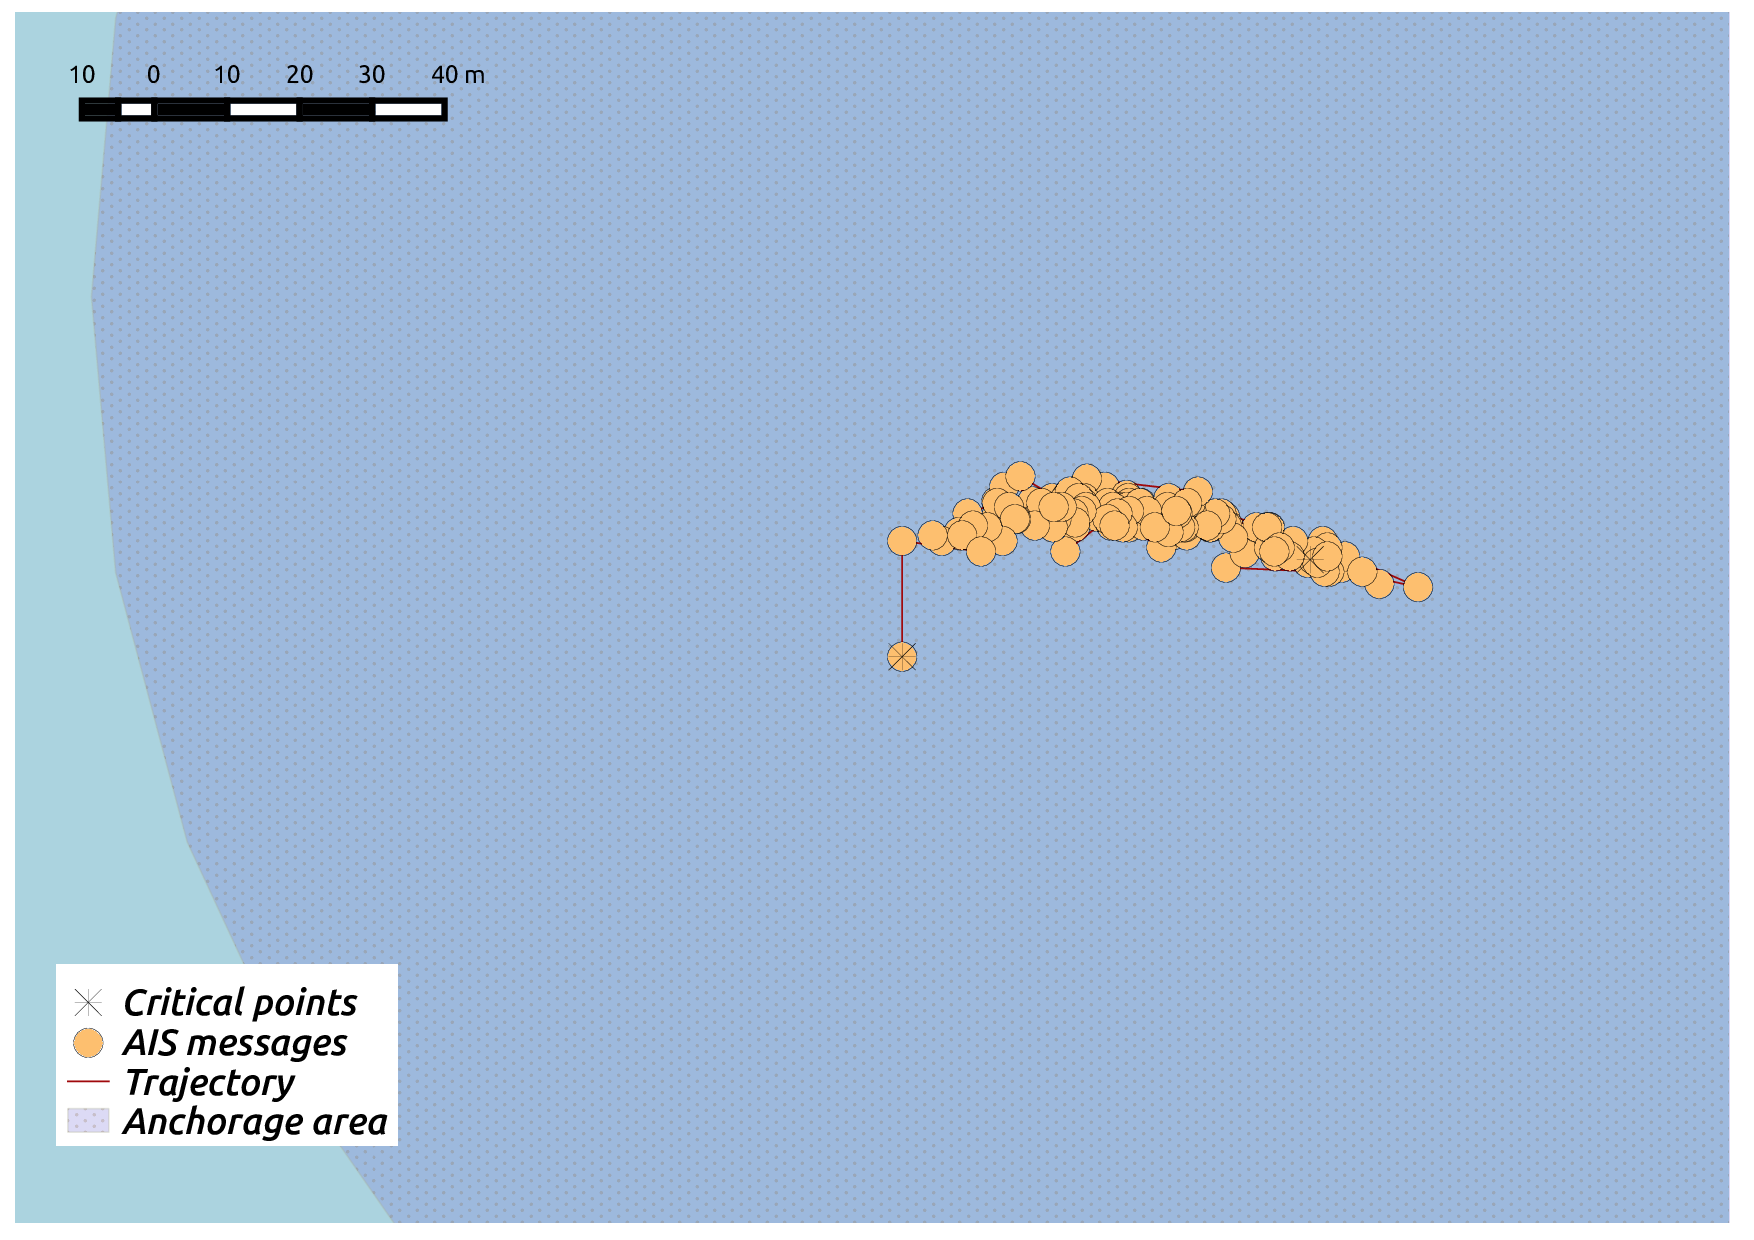
3.2.2. Anchored or moored vessel
A vessel lowers its anchor in specific areas—e.g. waiting to enter into a port, or taking on cargo or passengers where insufficient port facilities exist. See Figure 5 for an example of a vessel stopped in an anchorage area. Furthermore, vessels may be moored, i.e. when a vessel is secured with ropes in any kind of permanent fixture such as a quay or a dock. Consider the specification below:
| (36) |
is a statically determined fluent, i.e. it is specified by means of a domain-dependent holdsFor predicate and interval manipulation constructs—intersect_all and union_all in this case, that compute, respectively, the intersection and union of lists of maximal intervals (see Table 2 and Figure 2). Recall that is a fluent recording the intervals in which a vessel is stopped (see Table 3)—this may be far from all ports or near some port(s). is an auxiliary predicate keeping only the intervals of list with length greater than . , therefore, holds when the is stopped in an anchorage area or near some port, for a time period greater than some threshold (see in rule (36)). In our experiments, this threshold was set to 30 minutes.

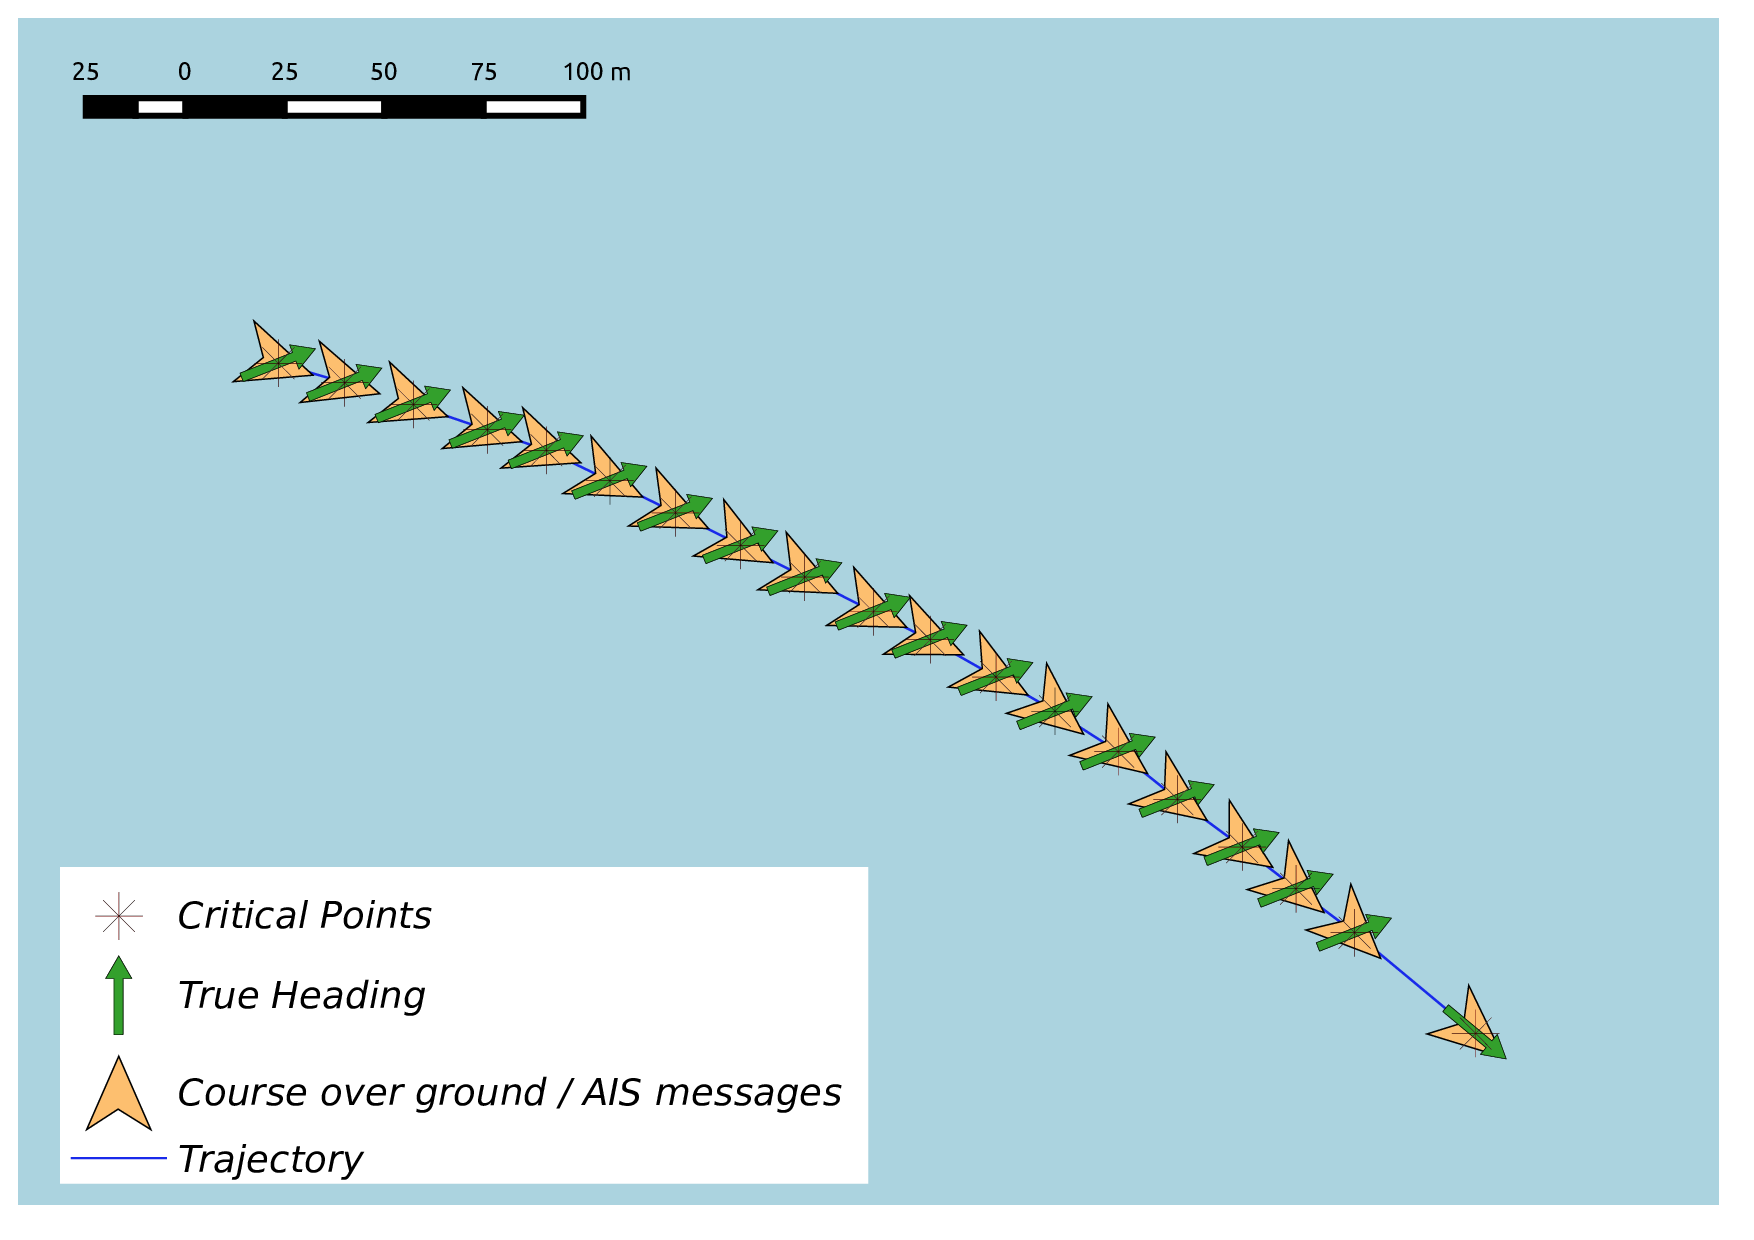
3.2.3. Drifting vessel
A vessel is drifting when its course over ground, i.e. the direction calculated by the GPS signal, is heavily affected by sea currents or harsh weather conditions. Typically, as illustrated in Figure 7, when the course over ground deviates from the true heading of a sailing vessel, i.e. the direction of the ship’s bow, then the vessel is considered drifting. Consider the formalisation below:
| (48) |
is a Boolean simple fluent, while, as mentioned earlier, is input contextual information, attached to each AIS message, expressing the speed, course over ground (CoG) and true heading of a vessel. is an auxiliary predicate calculating the absolute minimum difference between two angles and . The intervals during which are computed by the union of the intervals during which the vessel is moving, i.e. , and (see Table 3). The use of in the initiation and termination conditions of (see rule-set (48)) expresses the constraint that only moving vessels can be considered to be drifting.
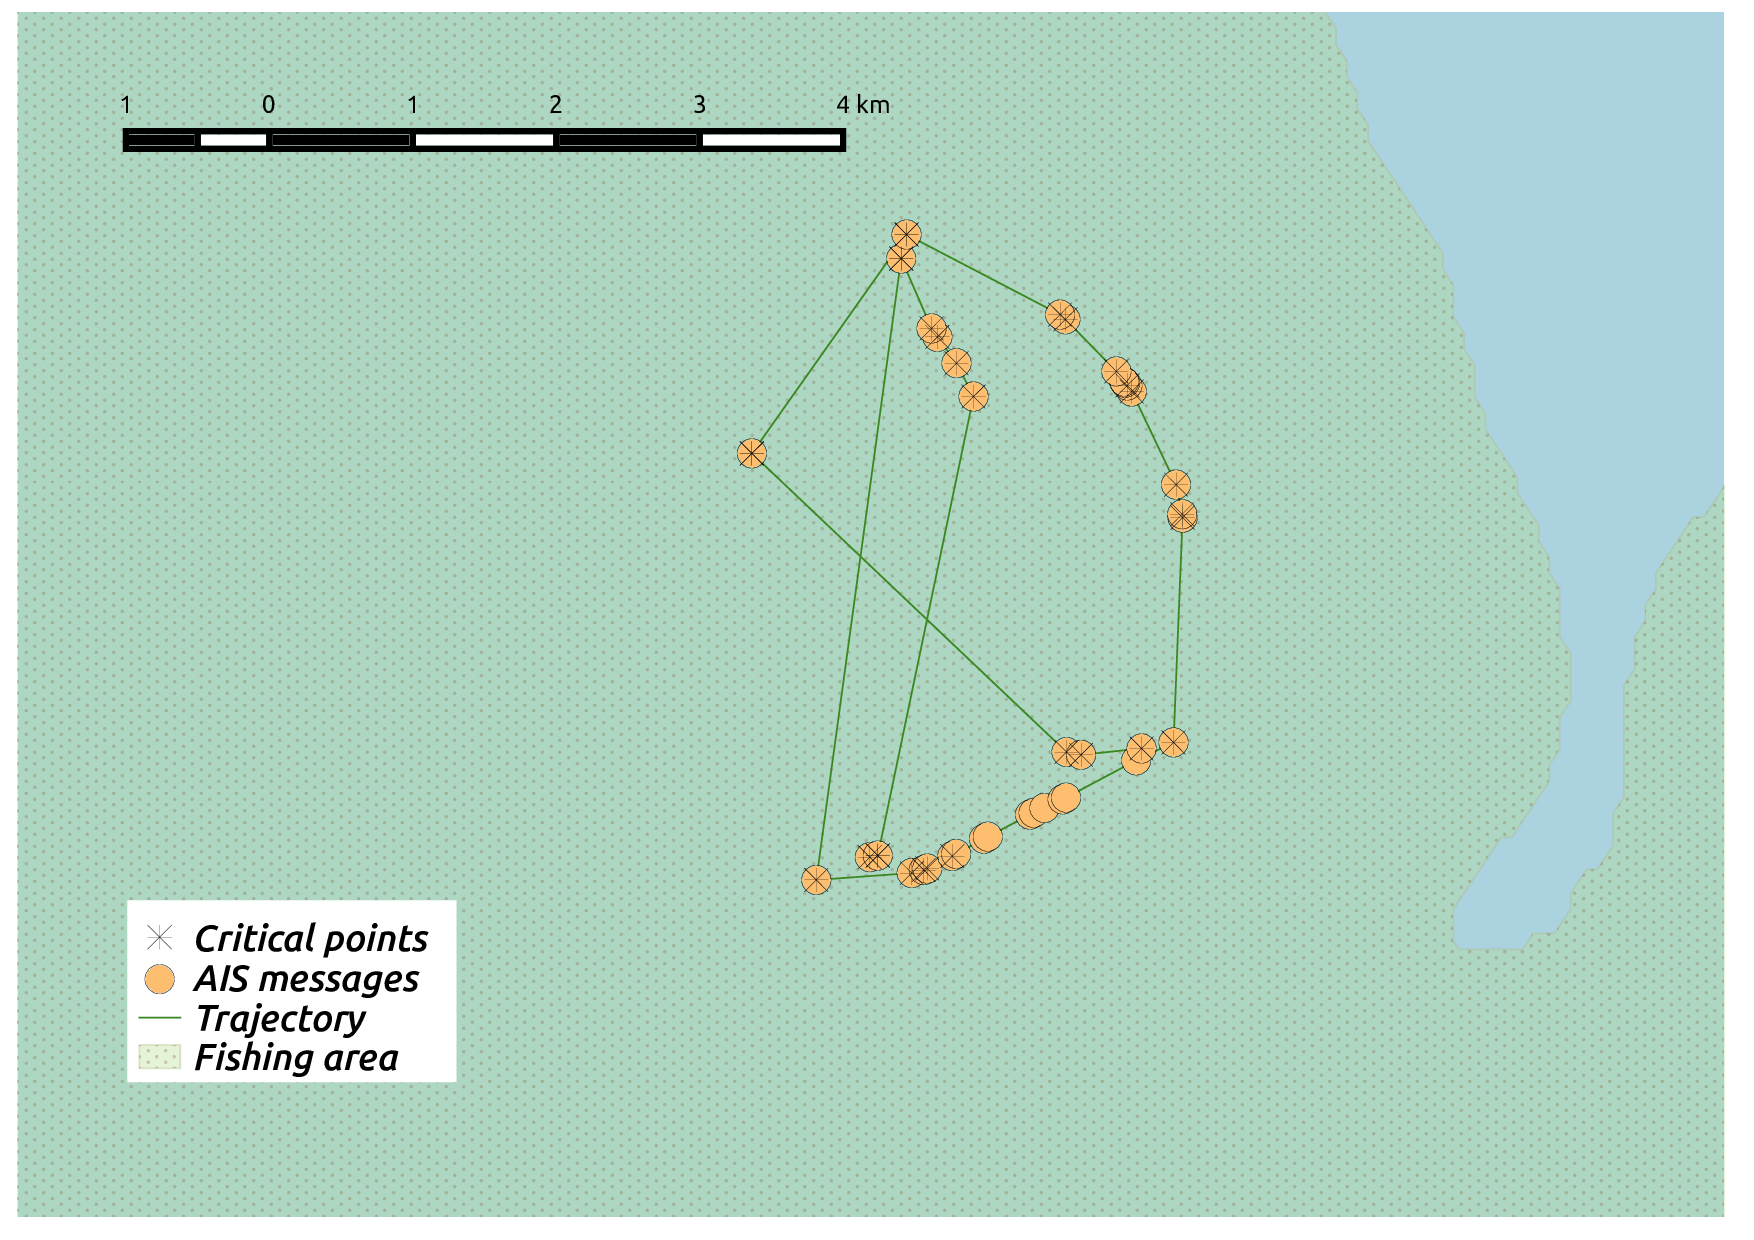
3.2.4. Trawling
Fishing is an activity that exploits natural resources, and thus needs to be regulated to safeguard fair access and sustainability (Jousselme et al., 2016b). Maritime monitoring enables better regulation and monitoring of fishing activities. A common fishing method is trawling, involving a boat—trawler—pulling a fishing net through the water behind it. The trawler has steady—trawling—speed and a wide heading angle distribution. See Figure 8 for an illustration. A formalisation of trawling movement may be found below:
| (55) |
is defined as a simple fluent, is an input critical event detected at the trajectory synopsis step, and is an auxiliary atemporal predicate recording the vessel types of a given dataset. is subject to the ‘deadlines’ mechanism of RTEC, i.e. this fluent is automatically terminated after a designated period of time—10 minutes in the experiments presented in the following section—has elapsed since its last initiation. (We omit the corresponding RTEC declarations to simplify the presentation.) As shown in rule-set (55), is also terminated when the vessel in question leaves the fishing area. (In other applications, it may be desirable to relax the constraint of restricting attention to designated fishing areas.) Consequently, is true as long as the fishing performs a sequence of heading changes, each taking place at the latest 10 minutes after the previous one, while sailing in a fishing area. Trawling can then be specified as follows:
| (61) |
is a statically determined fluent and is a simple fluent recording the intervals during which a vessel sails at trawling speed (see Table 3). According to rule (61), therefore, a vessel is said to be trawling if it is a fishing vessel, has trawling movement and sails in trawling speed for a period of time greater than (1 hour in our experiments).
3.2.5. Tugging
A vessel that should not move by itself—e.g. a ship in a crowded harbor or a narrow canal—or a vessel that cannot move by itself is typically pulled or towed by a tug boat. Figure 9 shows an example. It is expected that during tugging the two vessels are close and their speed is lower than normal, for safety and manoeuvrability reasons. We have formalised tugging as follows:
| (69) |
is a relational fluent referring to a pair of vessels, as opposed to the fluents presented so far that concern a single vessel. is an auxiliary predicate stating whether one of vessels is a tug boat. Similarly, states whether one of vessels is a pilot boat. Piloting will be discussed shortly. is a durative input fluent computed at the spatial preprocessing step (see Table 1), expressing the time periods during which two vessels are ‘close’ (in the presented experiments, their distance is less than 100 meters). is a simple fluent expressing the intervals during which a vessel is said to be sailing at tugging speed (see Table 3).
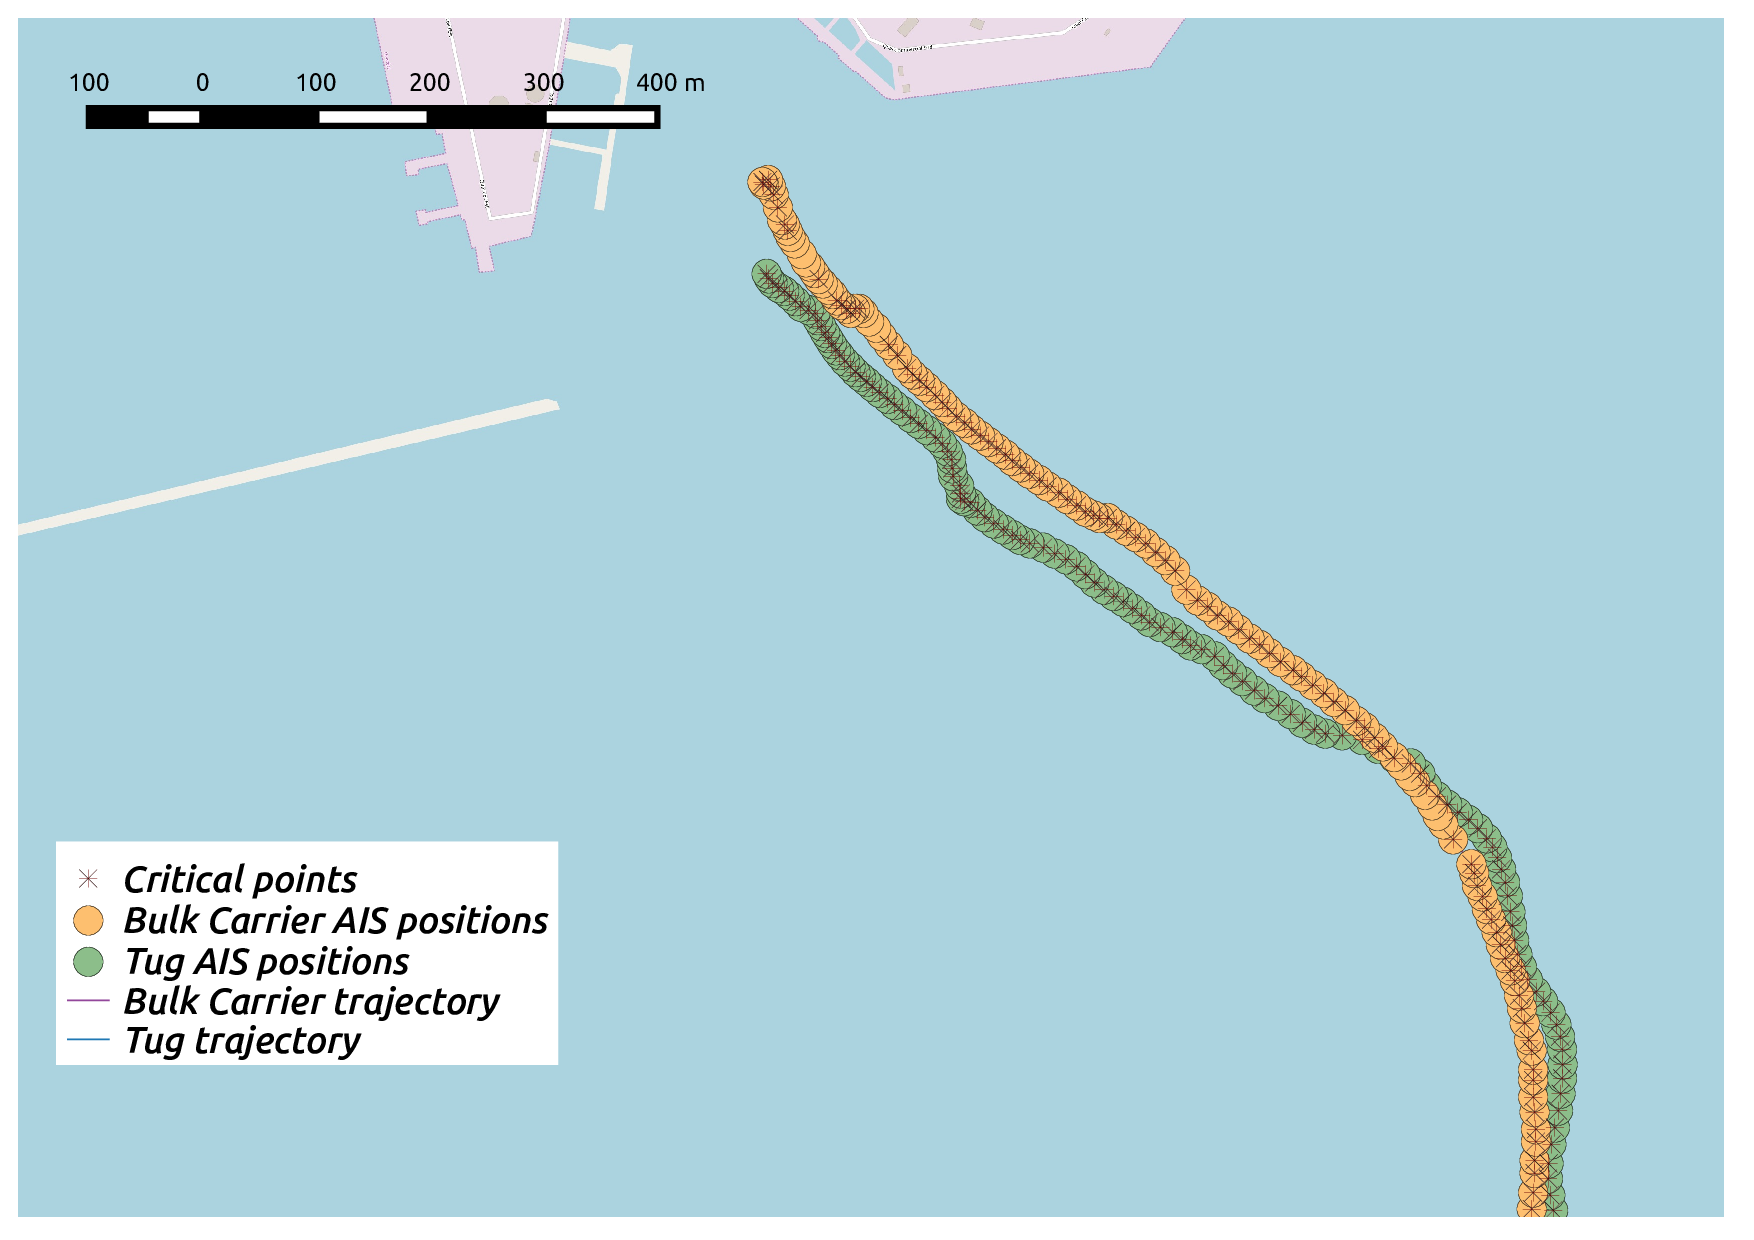
According to rule (69), two vessels are said to be engaged in tugging if one of them is a tug boat, neither of them is a pilot boat, and, for at least time-points, they are close to each other and sail at tugging speed.
3.2.6. Piloting
During piloting, a highly experienced sailor in navigation in specific areas—a maritime pilot—approaches with a pilot boat, boards and manoeuvres another vessel through dangerous or congested areas. Maritime pilots are navigational experts with knowledge of a particular area such as its depth, currents and hazards. Piloting, therefore, is of major importance for maritime safety. A formalisation of pilot boarding may be found below:
| (84) |
is a relational fluent referring to a pair of vessels, while is a fluent recording the intervals during which a vessel sails at low speed (see Table 3). relative_complement_all is an interval manipulation construct of RTEC (see Table 2 and Figure 2). According to rule (84), holds when one of the two vessels is a pilot vessel, neither of them is a tug boat, are close to each other, and they are stopped or sail at low speed far from the coast. According to domain experts, the boarding procedure in pilot operations takes place far from the coast for safety reasons.
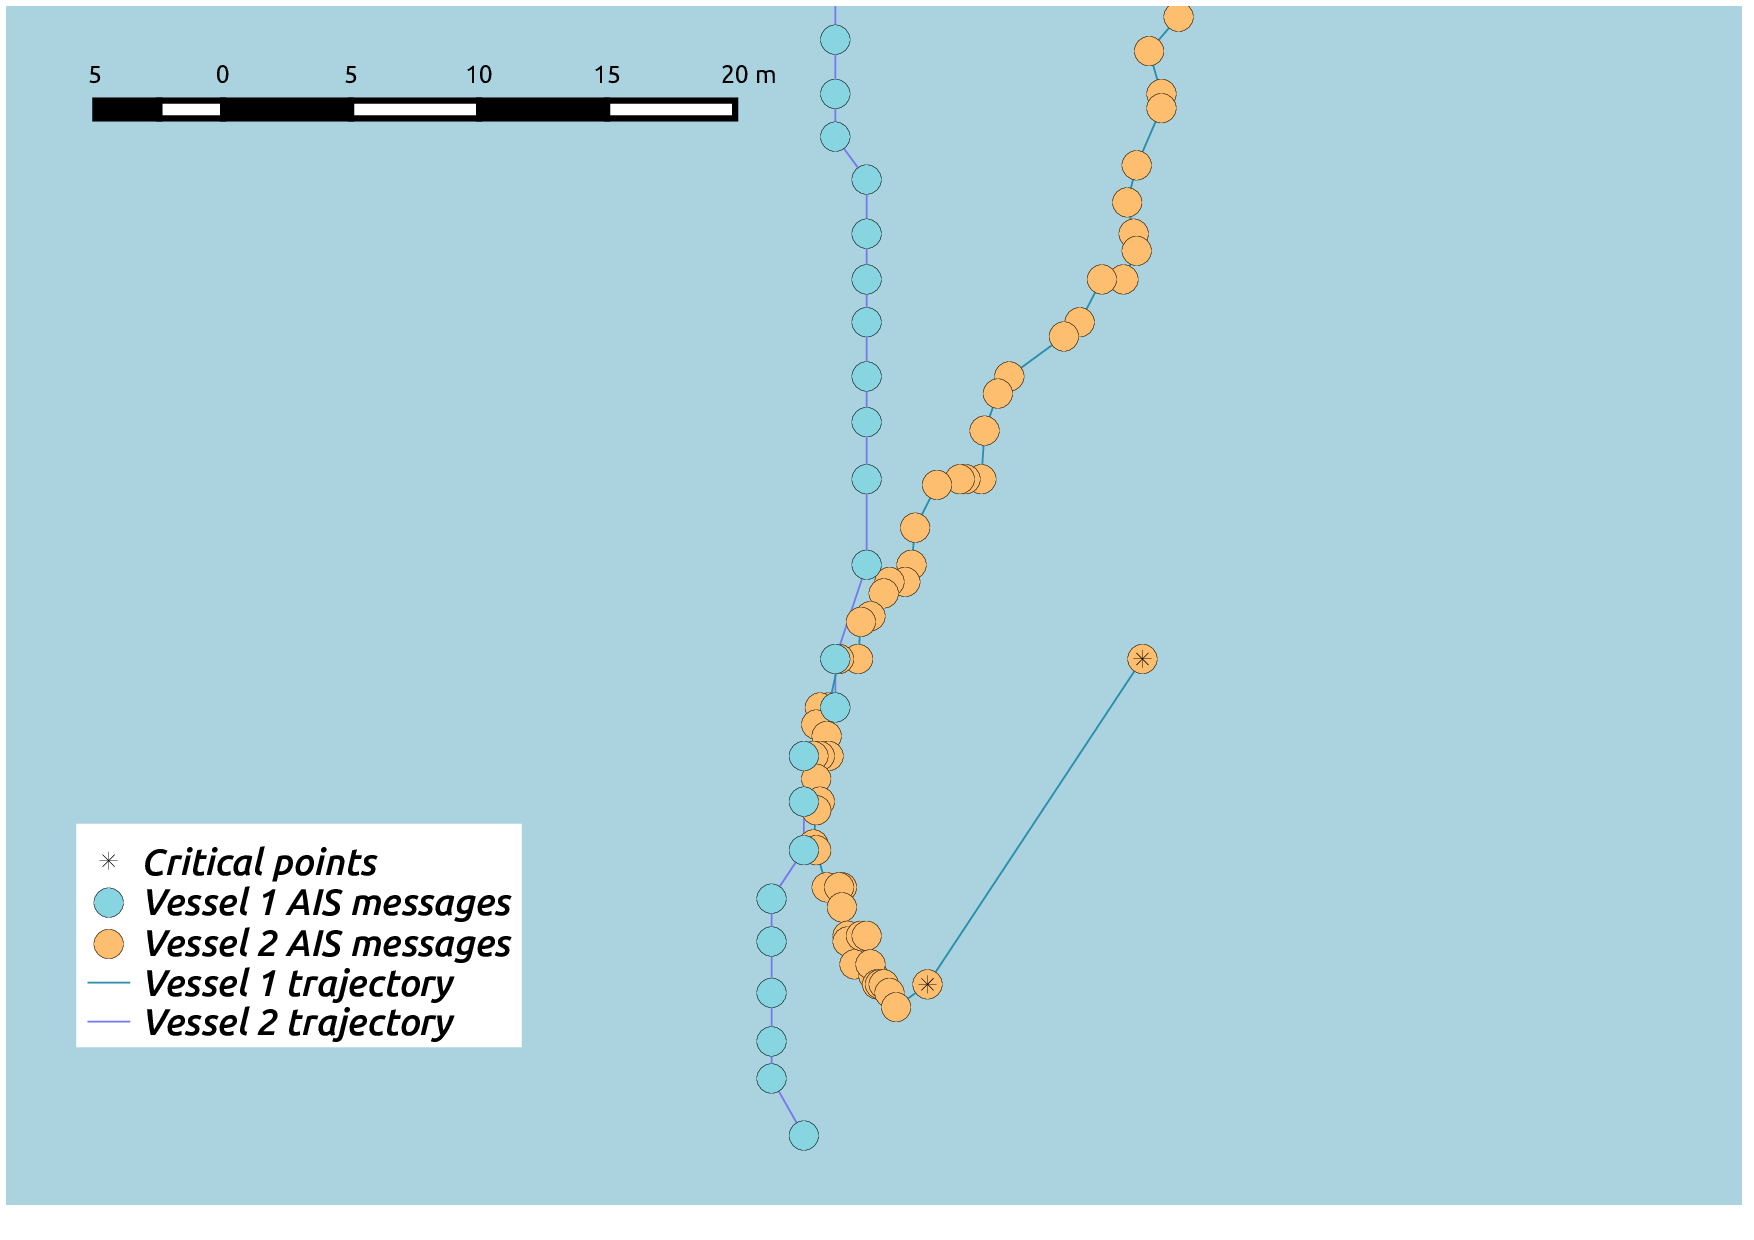
3.2.7. Vessel rendez-vous
A scenario that may indicate illegal activities, such as illegal cargo transfer, is when two vessels are nearby in the open sea, stopped or sailing at a low speed. See Figure 10 for an illustration. A specification of ‘rendez-vous’, or ‘ship-to-ship transfer’, may be found below:
| (101) |
The above formalisation is similar to that of pilot boarding. The differences are the following. First, the specification of excludes pilot vessels (and tug boats). Second, we require that both vessels are far from ports, as two slow moving or stopped vessels near some port would probably be moored or departing from the port. Similar to pilot boarding, we require that the two vessels are not near the coastline. The rationale in this case is that illegal ship-to-ship transfer typically takes place far from the coast. Note that, depending on the chosen distance thresholds for and , a vessel may be ‘far’ from the coastline and at the same time ‘near’ some port. Moreover, a vessel may be ‘far’ from all ports and ‘near’ the coastline.
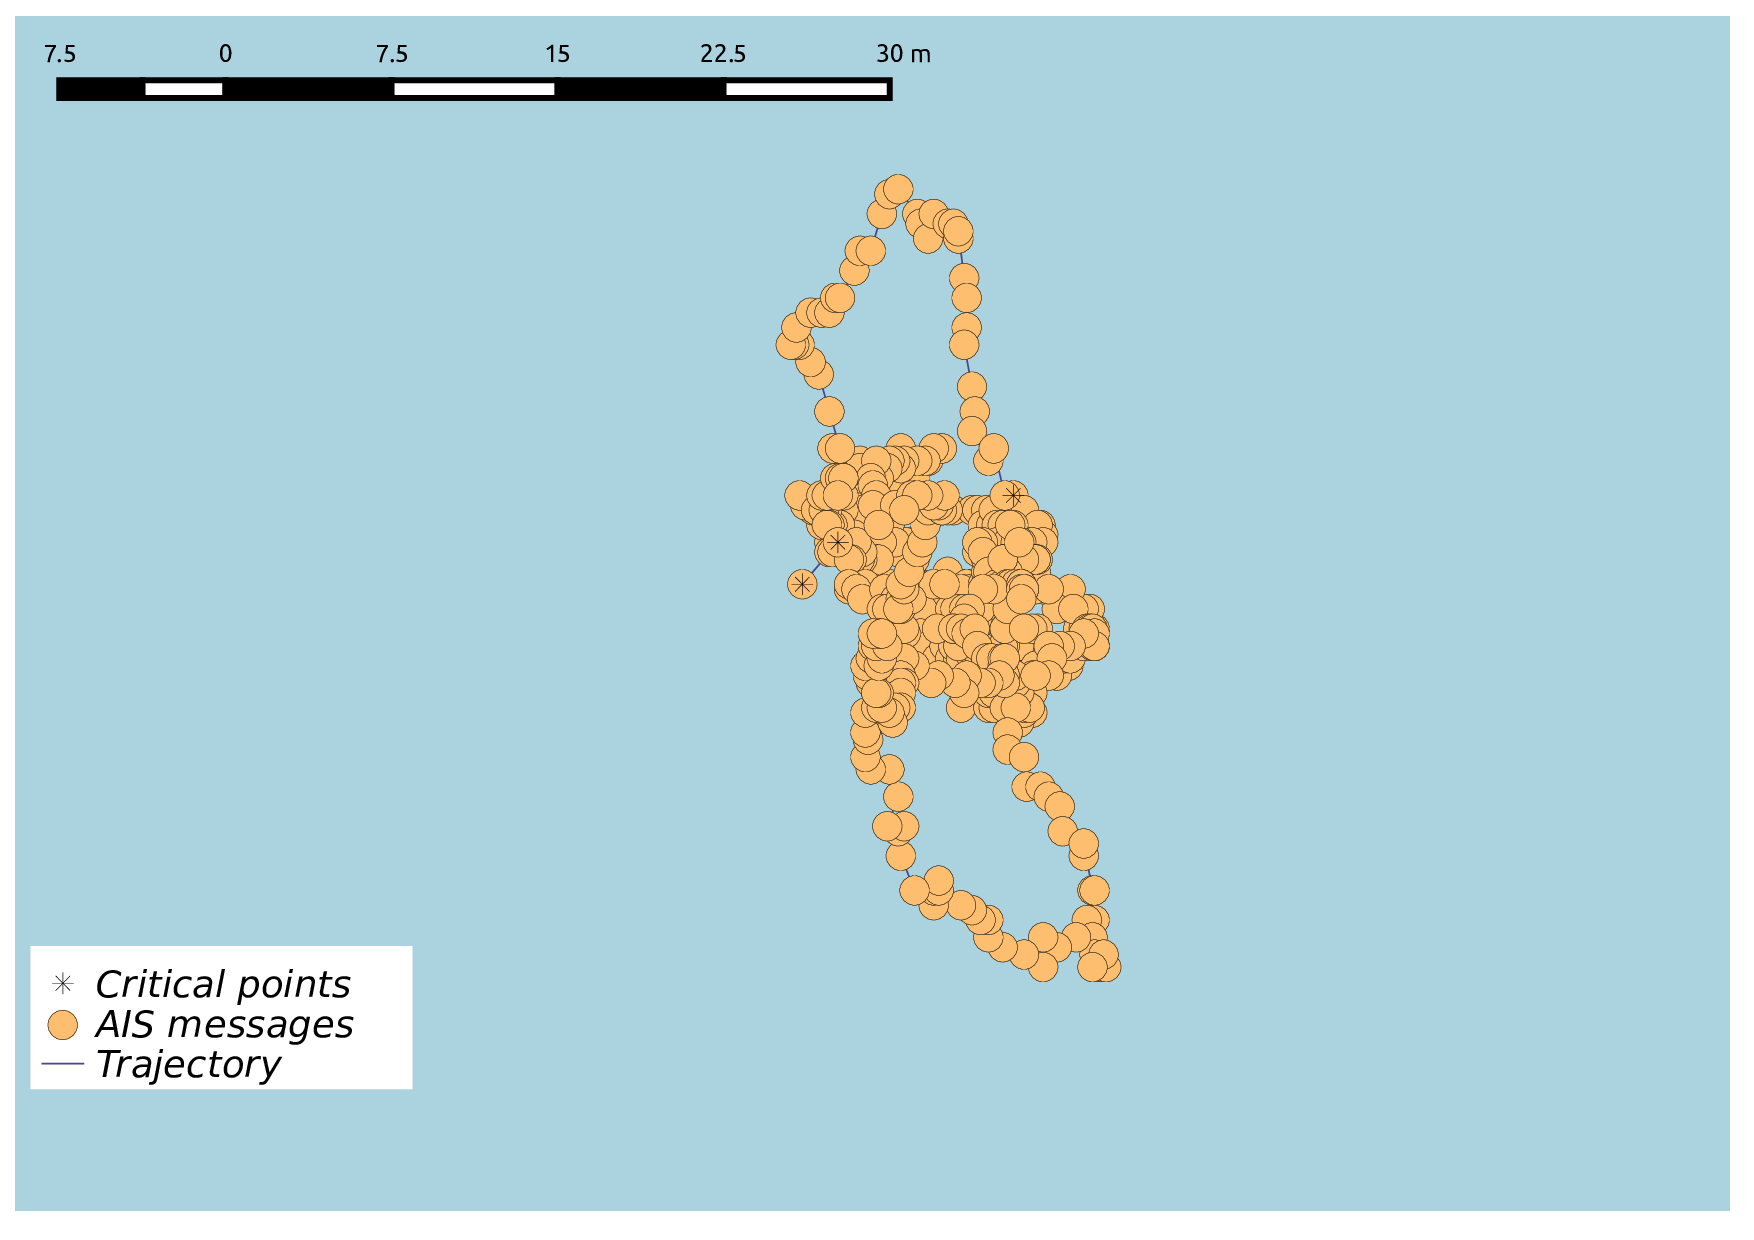
3.2.8. Loitering
Loitering is the act of remaining in a particular area for a long period without any evident purpose. Figure 11 presents an illustration. In sea, this behaviour is an indicator of a potentially unlawful activity. Consider the formalisation below:
| (110) |
According to rule (110), a vessel is said to loiter when it is stopped or sails at a low speed far from ports and the coastline, and it is not anchored, for a period greater than time-points. For the experiments presented in Section 4, we have set to 30 minutes.
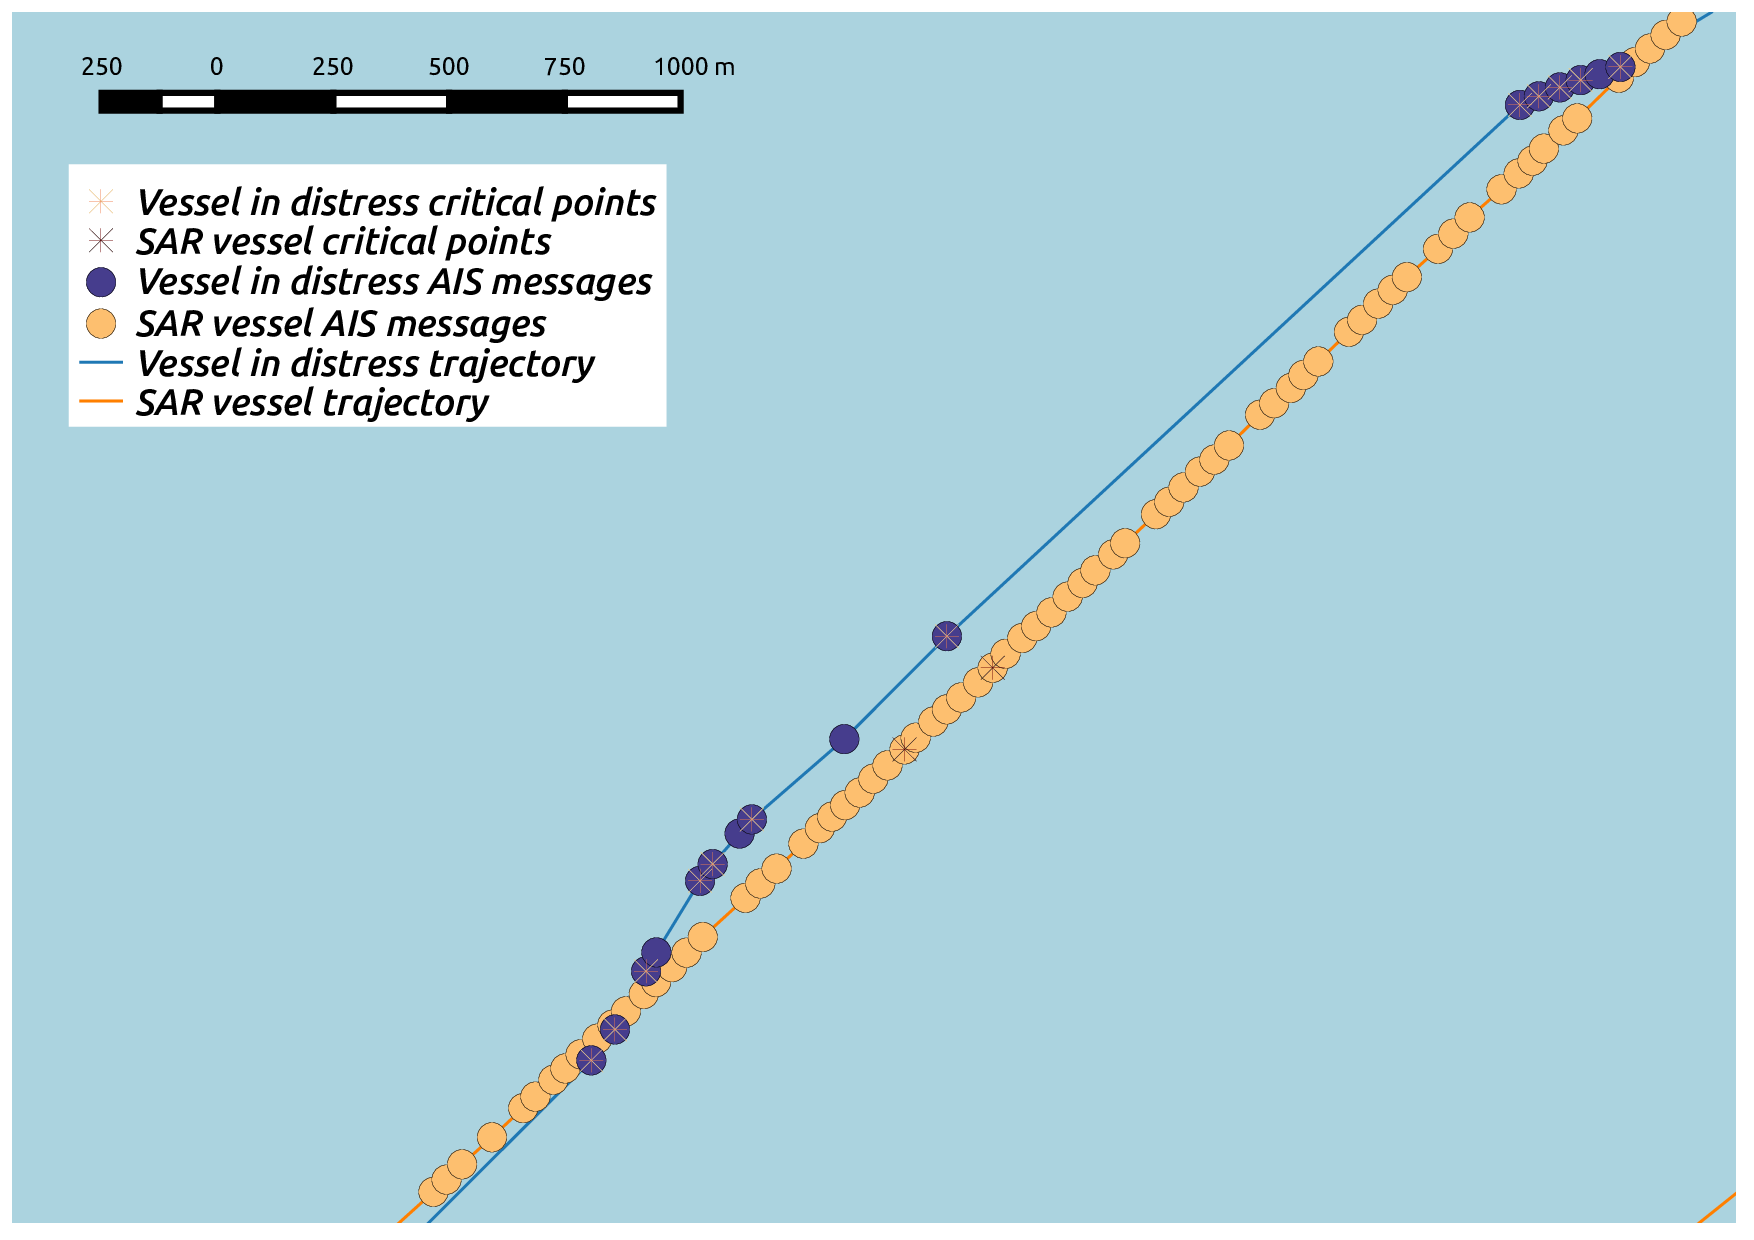
3.2.9. Search and rescue operations
Search and rescue (SAR) operations aim to provide aid to people who are in distress or imminent danger. See Figure 12 for an illustration of such an operation. Research has indicated that vessels engaged in SAR operations change speed and heading more often compared to other voyages (Chatzikokolakis et al., 2018). Taking this into consideration, we developed the formalisation below:
| (117) |
is an auxiliary fluent recording the intervals of potential SAR operations. is an input critical event, while is a fluent expressing the maximal intervals during which a vessel is changing its speed, according to the input and critical events (see Table 1). start is a built-in event of RTEC indicating the starting points of the maximal intervals during which holds continuously. According to rule-set (117), is initiated when a SAR vessel changes heading or starts changing speed. Similar to (see rule (55)), is subject to the ‘deadlines’ mechanism of RTEC, i.e. it is automatically terminated at the latest at some—30 minutes, in our experiments—time-points after its last initiation. We use the auxiliary fluent to express SAR operations as follows:
| (123) |
is a statically determined fluent denoting that is engaged in a SAR operation. expresses the speed range of SAR vessels (see Table 3). According to rule (123), is true when the has the speed and movement of a vessel in a SAR operation for at least time-points (1 hour in our experiments). In the future, we aim to develop a relational formalisation of SAR operations, including a representation of the vessel in distress.
4. Experimental Analysis
We present an evaluation of our maritime monitoring system in terms of efficiency and accuracy using the real-world datasets of the datAcron project.
4.1. Experimental Setup
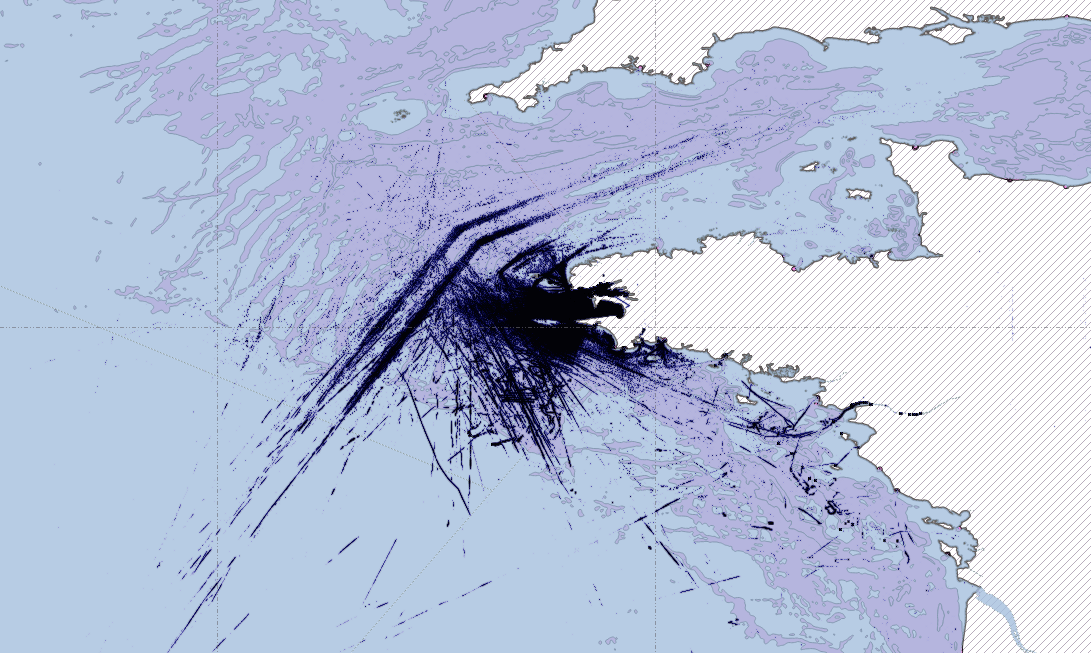
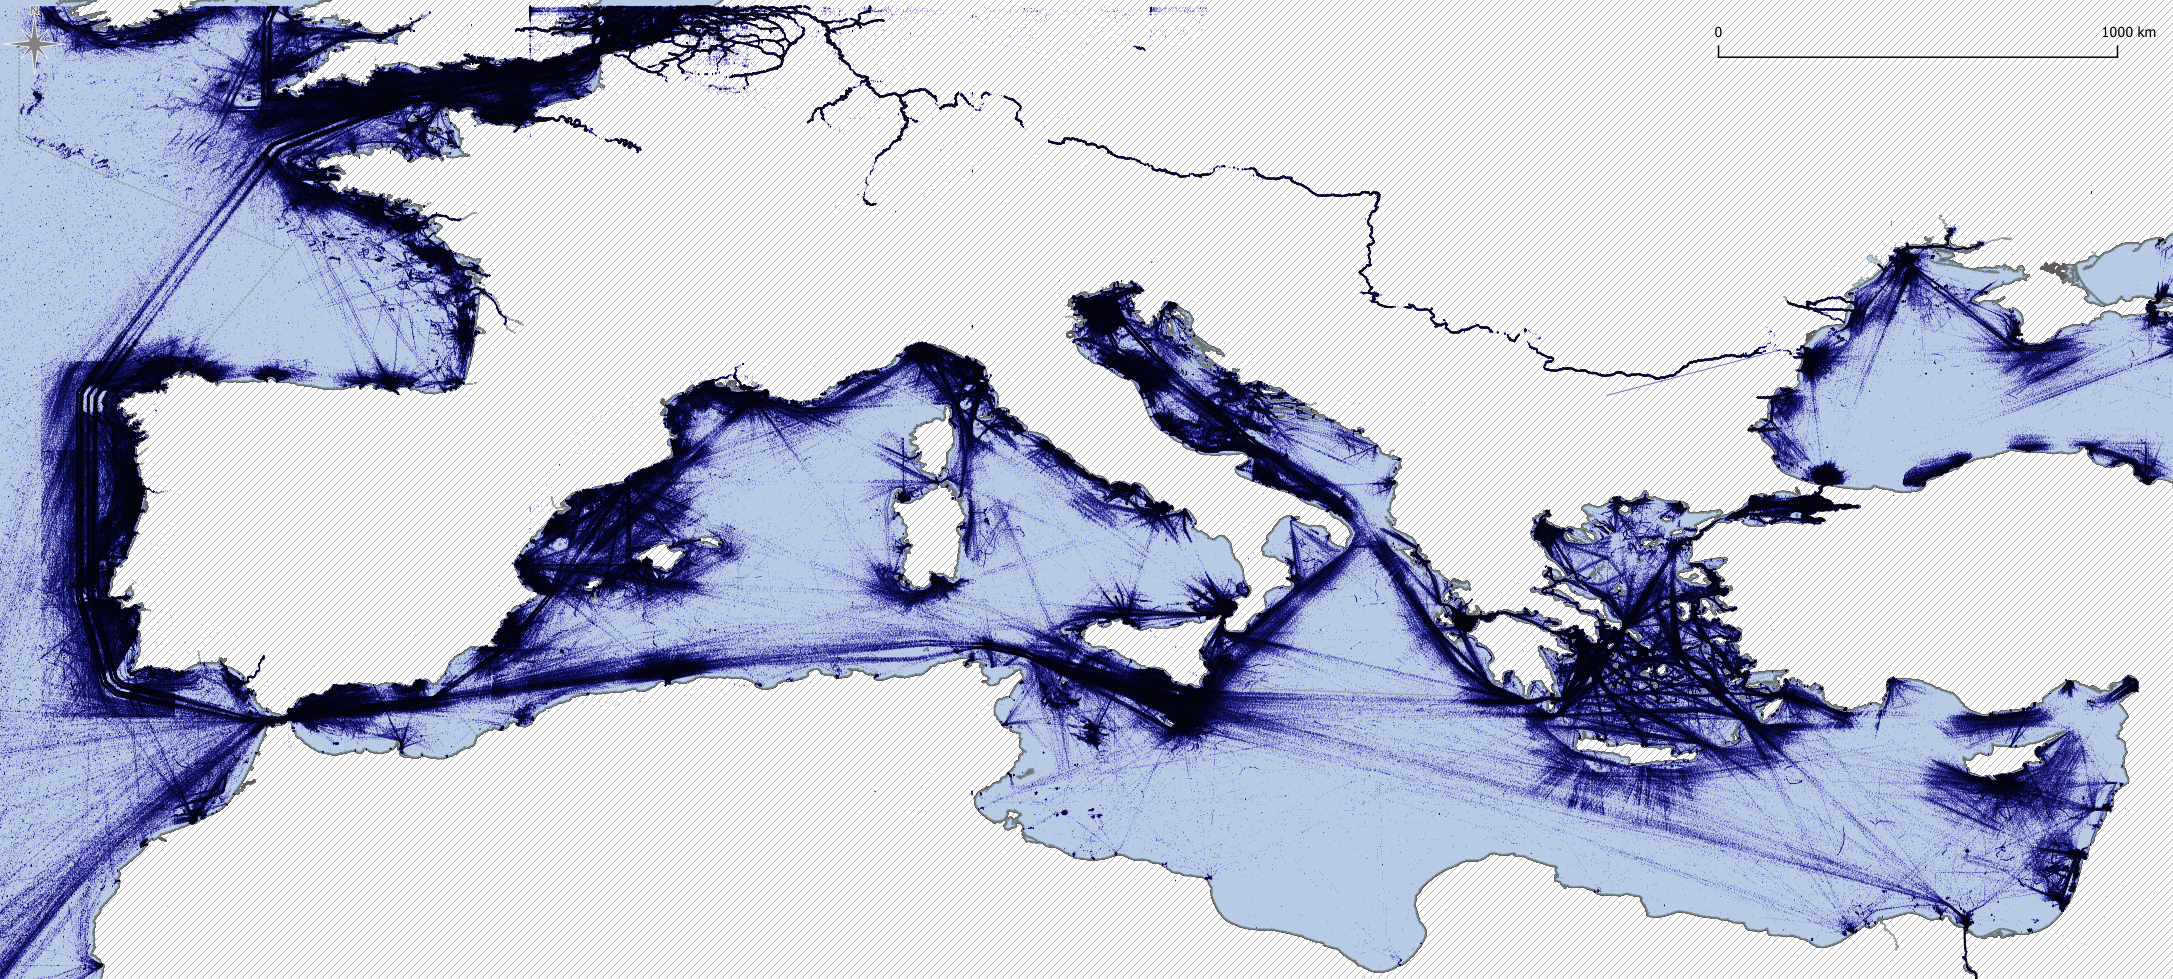
Figure 13 illustrates the geographical coverage of the datasets, while Table 4 outlines their characteristics. A summary of the datasets is presented below.
| Attribute | Brest | Europe |
| Period (months) | 6 | 1 |
| Vessels | 5K | 34K |
| Position signals | 18M | 55M |
| Spatio-temporal events | 374K | 11M |
| Critical position signals | 4.6M | 17M |
| Fishing areas | 263 | 1K |
| Natura 2000 areas | 1.2K | 2.6K |
| Anchorage areas | 9 | 9 |
| Ports | 222 | 2201 |
Brest, France. We employed a publicly available dataset consisting of 18M position signals from 5K vessels sailing in the Atlantic Ocean around the port of Brest, France, between October 1st 2015 and 31st March 2016 (Ray et al., 2018). The spatial preprocessing module produced 374K spatio-temporal events linking vessels with, among others, 263 fishing areas and 1.2K Natura 2000 areas (Vespe et al., 2016; Natale et al., 2015), as well as vessels with other vessels. The trajectory synopsis generator labelled 4.6M position signals as critical.
Europe. IMIS Global555https://imisglobal.com, our partner in the datAcron project, made available a dataset consisting of 55M position signals from 34K vessels sailing in the European seas between January 1-30, 2016 (Ray et al., 2016; Camossi et al., 2017). In contrast to the Brest dataset, signals transmitted via satellites are also included, thus capturing vessels sailing out of the range of terrestrial antennas. The synopsis generator labelled 17M position signals as critical, while the spatial preprocessing module produced 11M spatio-temporal events. In this dataset we did not have access to all areas of interest—e.g. we did not have access to any anchorage areas away from the Brest area.
The experiments were conducted using the open-source RTEC composite event recognition engine666https://github.com/aartikis/RTEC, under YAP-6 Prolog, in a machine running Ubuntu 16.04.3 LTS, with Intel Core i7-i7700 CPU @ 3.60GHz x 8 and 16 GB 2133 MHz RAM. The input of RTEC consisted of streams of the input events shown above the two horizontal lines of Table 1, while instances of all composite activities shown below these two lines were recognised. For the Brest dataset, these composite activity instances are publicly available (Pitsikalis and Artikis, 2019).
| Composite Event | TP | FP | Precision |
|---|---|---|---|
| 3067 | 4 | 0.999 | |
| 29 | 0 | 1.000 | |
| 117 | 0 | 1.000 | |
| 80 | 0 | 1.000 | |
| 52 | 2 | 0.963 |
4.2. Accuracy
4.2.1. Expert Feedback
The datasets presented above do not have an annotation of composite activities. For this reason, domain experts were asked to provide feedback on the recognised instances of a representative subset of the formalised activities: ‘anchored or moored’, ‘trawling’, ‘tugging’, ‘pilot boarding’ and ‘rendez-vous’ (Masson and Barre, 2018). Given that this evaluation process is highly time-consuming, as there are several thousand instances of recognised activities, the experts provided feedback only for the first month of the Brest dataset. Table 5 presents the number of True Positives (TP), False Positives (FP) and the Precision score for the selected activities. (False Negatives and hence Recall could not be computed due to the absence of complete ground truth.) The results show nearly perfect scores. The four False Positives of were caused by four vessels that continued transmitting position signals while on land. Concerning , the experts stated that for two recognised instances of this pattern, there were too few position signals to classify the activities as rendez-vous. Hence the two False Positives shown in Table 5.
4.2.2. Compression Effects
In addition to measuring accuracy based on expert feedback, we assessed the impact of trajectory compression on CER. We considered as reference the composite activities detected when consuming the complete AIS stream with the critical point labels—see the ‘enriched AIS stream’ in Figure 1—and then compared those activities against the ones detected when consuming the compressed AIS stream where all non-critical events have been removed—see the ‘critical point stream’ in Figure 1.
| Composite Event | Brest — Europe | |||||
|---|---|---|---|---|---|---|
| Precision | Recall | -Score | ||||
| 1.000 | 0.999 | 0.978 | 0.979 | 0.989 | 0.989 | |
| 1.000 | 1.000 | 1.000 | 1.000 | 1.000 | 1.000 | |
| 0.999 | - | 0.998 | - | 0.999 | - | |
| 0.988 | 0.997 | 0.999 | 0.999 | 0.994 | 0.998 | |
| 0.991 | 0.968 | 1.000 | 0.934 | 0.994 | 0.951 | |
| 1.000 | 1.000 | 1.000 | 1.000 | 1.000 | 1.000 | |
| 1.000 | 1.000 | 1.000 | 1.000 | 1.000 | 1.000 | |
| 1.000 | 1.000 | 1.000 | 1.000 | 1.000 | 1.000 | |
| 0.998 | 0.987 | 0.999 | 0.990 | 0.998 | 0.988 | |
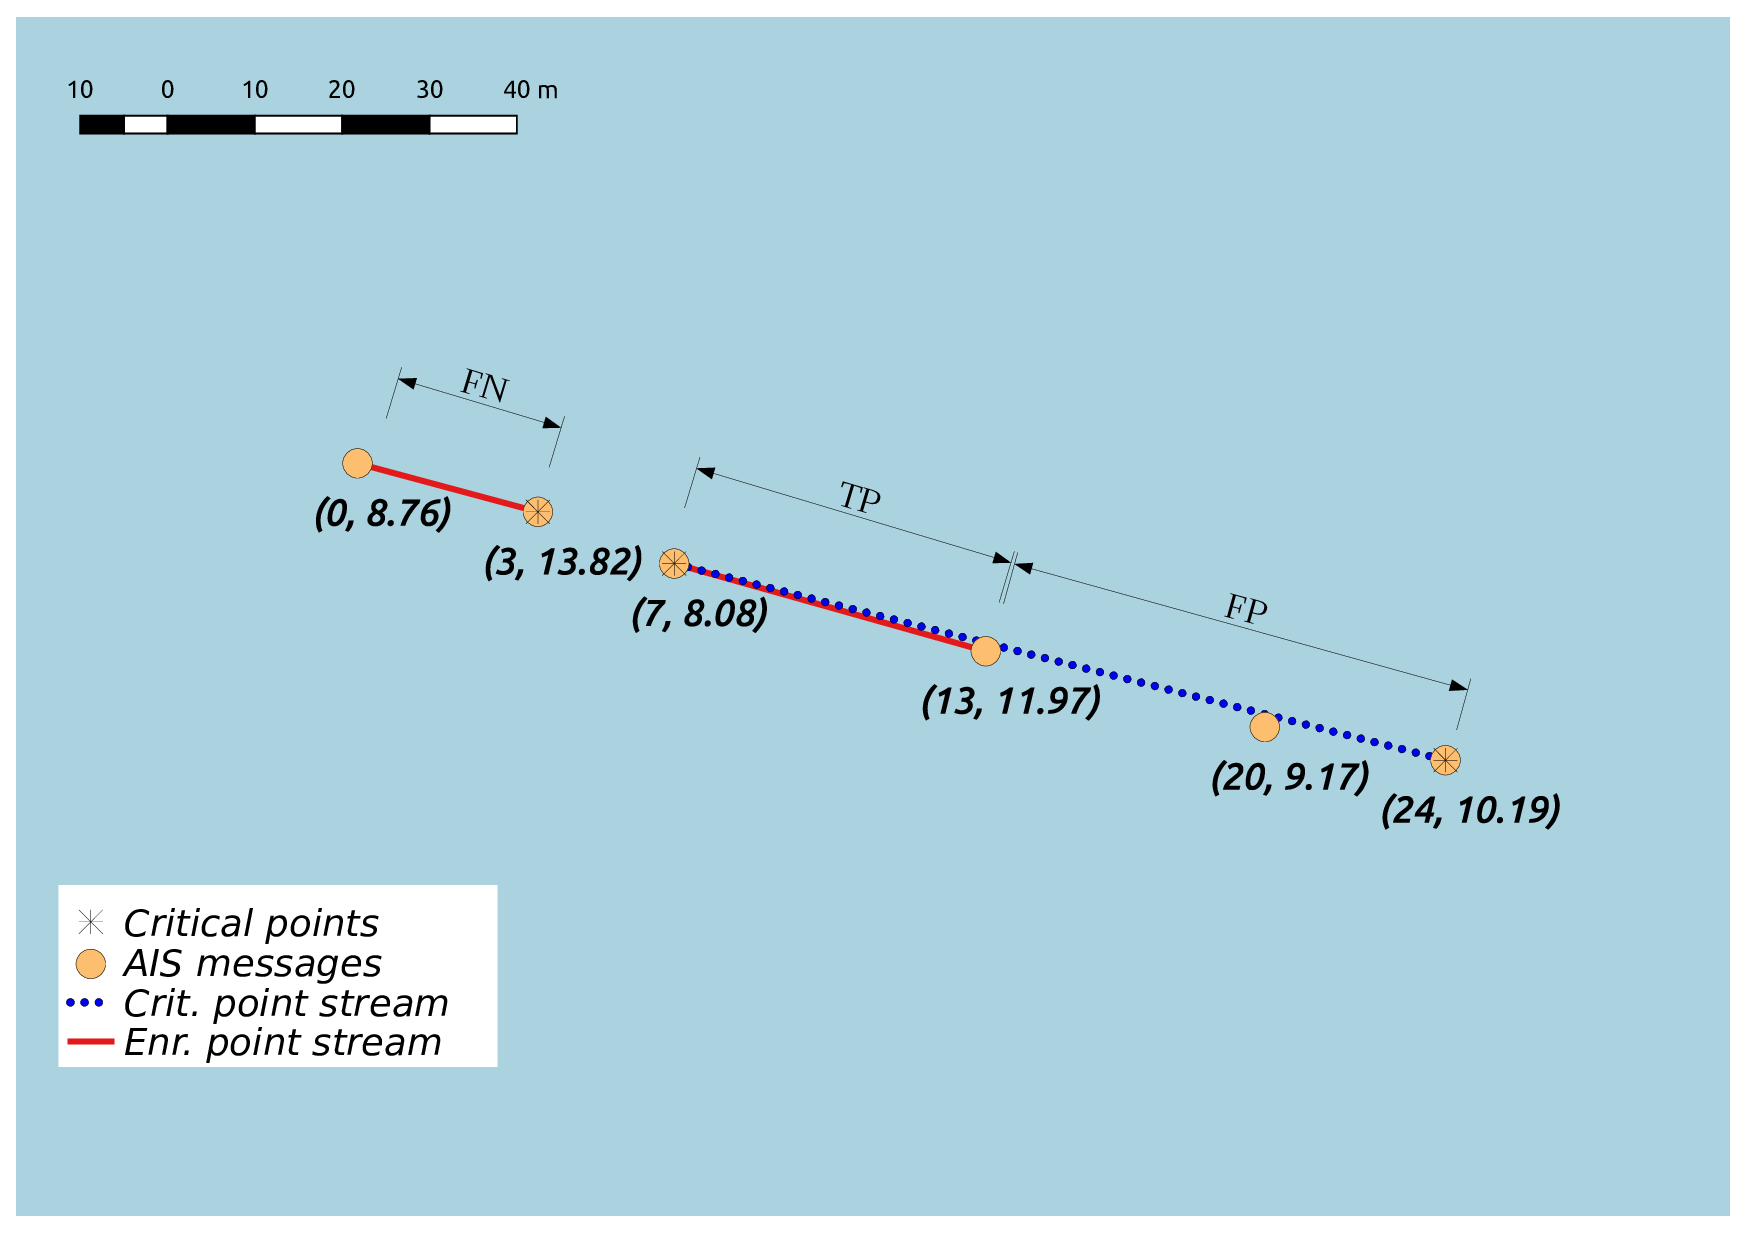
Table 6 presents the comparison results in terms of Precision, Recall and -score on the complete Brest dataset as well as the Europe dataset. is missing from the latter dataset because information concerning the true heading of vessels was not available. The set of True Positives expresses the time-points (seconds) in which a composite activity is recognised when consuming the enriched AIS stream and the critical point stream. Similarly, the set of False Positives (respectively, False Negatives) expresses the seconds in which a composite activity is recognised when consuming the critical point (respectively, enriched AIS) stream but not detected when consuming the enriched AIS (critical point) stream.
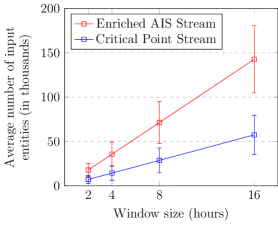
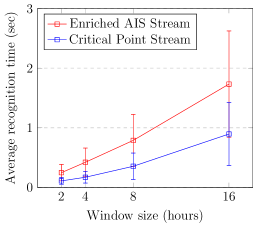
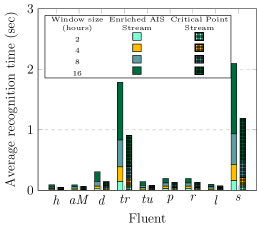
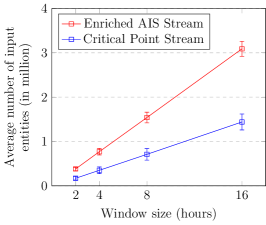
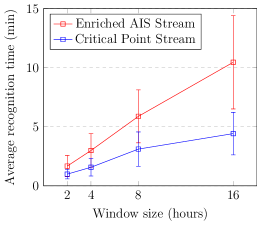

Table 6 shows that some of the recognised activities have perfect scores. The patterns of these activities are defined only in terms of critical points and spatio-temporal events, that are part of both the enriched AIS stream and the critical point stream. For the remaining activities, there are some minor deviations between the results obtained by consuming the enriched AIS stream and the critical point stream. Those activities have some False Positives and False Negatives, thus compromising Precision and Recall. False Positives are created when a composite activity is terminated later when consuming the critical point stream than when consuming the enriched AIS stream. Similarly, False Negatives are created when an activity is initiated later when consuming the critical point stream than when consuming the enriched AIS stream.
Figure 14 illustrates this issue using , which is used in the specification of trawling (see rule (61)). is initiated when the speed of the vessel in question is between 1–9 knots, and terminated otherwise (see Table 3). According to the example of Figure 14, is initiated at time-point when the speed of the vessel is 8.76 knots, and terminated at when the speed becomes 13.82 knots. Similarly, is initiated at and terminated . When consuming the critical point stream, however, different intervals are computed, since some of the AIS messages have been removed due to compression. For example, the AIS message at has been removed, thus not triggering the initiation of and consequently creating False Negatives. Moreover, the AIS message at has also been removed, delaying the termination of , and thus creating False Positives.
4.3. Efficiency
Figure 15 presents the experimental results in terms of efficiency on both datasets. Results are shown for the enriched AIS stream and the critical point stream. RTEC performs CER over a sliding window (Artikis et al., 2015). In these experiments, we varied the window size from 2 hours to 16 hours, while the slide step was set to 2 hours. Overlapping windows, as in the cases of and hours in our experiments, are common in maritime monitoring, since AIS position signals may arrive with (substantial) delay at the CER system. This is especially the case for position signals arriving via satellites (i.e. when vessels sail out of the range of terrestrial antennas), as in the case of the Europe dataset.
Figures 15a and 15d display the average number of input events per window size, while Figures 15b and 15e show the average recognition times for all patterns. As expected, the performance is better in the smaller critical point stream rather than the enriched AIS stream. In both cases, RTEC performs real-time CER. For example, in the Brest dataset, a window of 16 hours, including more than 50K events in the critical point stream, is processed in less than a second in a single core of a standard desktop computer.
We may trivially parallelise CER by allocating different patterns to different processing units. Figures 15c and 15f show the average recognition times per pattern. As discussed in Section 3, the maritime patterns form a hierarchy, in the sense that the specification of a pattern depends on the specification of other, lower-level patterns. For example, the specification of depends on the specification of , and (see Figure 3). Thus, in Figures 15c and 15f the displayed recognition times of include the recognition times of all patterns that contribute to its specification.
5. Summary and Further Work
We presented a CER system for maritime monitoring extending our previous work (Patroumpas et al., 2017; Pitsikalis et al., 2018). The system includes a formal specification of effective maritime patterns that has been constructed in collaboration with, and evaluated by domain experts. In contrast to the related literature, these patterns concern a wide range of maritime activities. Furthermore, our evaluation on real datasets demonstrated that our system is capable of real-time CER for maritime monitoring. The activities recognised on the 6-month dataset of the Brest area are publicly available (Pitsikalis and Artikis, 2019), in order to aid further research, such as the development of machine learning algorithms for pattern construction.
There are several directions for further work. We are implementing RTEC in Scala in order to pave the way for distributed CER. Additionally, we are developing machine learning techniques for continuously refining patterns given new data streaming into the system (Katzouris et al., 2016, 2015). Finally, in the context of the EU-funded INFORE project, we are integrating satellite images with position signals and geographical information for a more complete account of maritime situational awareness.
Acknowledgements.
This work was supported by the datAcron project and the INFORE project, which have received funding from the European Union’s Horizon 2020 research and innovation programme, under, respectively, grant agreement No 687591 and No 825070, and by the SYNTELESIS project (MIS 5002521), funded by the Operational Programme “Competitiveness, Entrepreneurship and Innovation” (NSRF 2014-2020), and co-financed by Greece and the European Union (European Regional Development Fund). We would like to thank Louis Le Masson and Jules Barre for their help in the evaluation of the maritime patterns. Moreover, we would like to thank MarineTraffic777https://www.marinetraffic.com/ for giving us access to the vessel types for the dataset of Europe.References
- (1)
- Andler et al. (2009) Sten Andler, Mikael Fredin, Per Gustavsson, Joeri Laere, Maria Nilsson, and Pontus Svenson. 2009. SMARTracIn–A concept for spoof resistant tracking of vessels and detection of adverse intentions.
- Artikis and Sergot (2010) Alexander Artikis and Marek J. Sergot. 2010. Executable specification of open multi-agent systems. Logic Journal of the IGPL 18, 1 (2010), 31–65.
- Artikis et al. (2015) Alexander Artikis, Marek J. Sergot, and Georgios Paliouras. 2015. An Event Calculus for Event Recognition. IEEE Trans. Knowl. Data Eng. 27, 4 (2015), 895–908.
- Camossi et al. (2017) Elena Camossi, Anne-Laure Jousselme, Cyril Ray, Melita Hadzagic, Richard Dreo, and Christophe Claramunt. 2017. Maritime Experiments Specification, H2020 datAcron project deliverable D5.3. (2017). http://datacron-project.eu/.
- Chatzikokolakis et al. (2018) Konstantinos Chatzikokolakis, Dimitrios Zissis, Giannis Spiliopoulos, and Konstantinos Tserpes. 2018. Mining Vessel Trajectory Data for Patterns of Search and Rescue. Zenodo.
- Clark (1978) Keith L. Clark. 1978. Negation as Failure. In Logic and Databases, H. Gallaire and J. Minker (Eds.). Plenum Press, 293–322.
- Greidanus et al. (2017) Harm Greidanus, Marlene Alvarez, Carlos Santamaria, François-Xavier Thoorens, Naouma Kourti, and Pietro Argentieri. 2017. The SUMO Ship Detector Algorithm for Satellite Radar Images. Remote Sensing 9, 3 (2017). http://www.mdpi.com/2072-4292/9/3/246
- Idiri and Napoli (2012) Bilal Idiri and Aldo Napoli. 2012. The automatic identification system of maritime accident risk using rule-based reasoning. In 2012 7th International Conference on System of Systems Engineering (SoSE). 125–130.
- Jousselme et al. (2016a) Anne-Laure Jousselme, Elena Camossi, Melita Hadzagic, Cyril Ray, Christophe Claramunt, Eric Reardon, Karna Bryan, and Michael Ilteris. 2016a. A Fishing Monitoring Use Case in Support to Collaborative Research. In In Proceedings of Maritime Knowledge Discovery and Anomaly Detection Workshop. 57–61.
- Jousselme et al. (2016b) Anne-Laure Jousselme, Cyril Ray, Elena Camossi, Melita Hadzagic, Christophe Claramunt, Karna Bryan, Eric Reardon, and Michael Ilteris. 2016b. Maritime Use Case description, H2020 datAcron project deliverable D5.1. (2016). http://datacron-project.eu/.
- Katzouris et al. (2015) Nikos Katzouris, Alexander Artikis, and Georgios Paliouras. 2015. Incremental learning of event definitions with Inductive Logic Programming. Machine Learning 100, 2-3 (2015), 555–585.
- Katzouris et al. (2016) Nikos Katzouris, Alexander Artikis, and Georgios Paliouras. 2016. Online learning of event definitions. TPLP 16, 5-6 (2016), 817–833.
- Kowalski and Sergot (1986) Robert A. Kowalski and Marek J. Sergot. 1986. A Logic-based Calculus of Events. New Generation Comput. 4, 1 (1986), 67–95.
- Masson and Barre (2018) L. Le Masson and J. Barre. 2018. Complex Event Recognition support for maritime monitoring in the context of European datAcron project. Final year project. French naval academy.
- Natale et al. (2015) Fabrizio Natale, Maurizio Gibin, Alfredo Alessandrini, Michele Vespe, and Anton Paulrud. 2015. Mapping Fishing Effort through AIS Data. PLOS ONE 10, 6 (06 2015), 1–16.
- Patroumpas et al. (2017) Kostas Patroumpas, Elias Alevizos, Alexander Artikis, Marios Vodas, Nikos Pelekis, and Yannis Theodoridis. 2017. Online event recognition from moving vessel trajectories. GeoInformatica 21, 2 (2017), 389–427.
- Pitsikalis and Artikis (2019) M. Pitsikalis and A. Artikis. 2019. Composite Maritime Events (Version 0.1) [Data set]. https://zenodo.org/record/2557290.
- Pitsikalis et al. (2018) Manolis Pitsikalis, Ioannis Kontopoulos, Alexander Artikis, Elias Alevizos, Paul Delaunay, Jules-Edouard Pouessel, Richard Dreo, Cyril Ray, Elena Camossi, Anne-Laure Jousselme, and Melita Hadzagic. 2018. Composite Event Patterns for Maritime Monitoring. In Proceedings of the 10th Hellenic Conference on Artificial Intelligence (SETN ’18). ACM, New York, NY, USA, Article 29, 4 pages.
- Przymusinski (1987) Teodor Przymusinski. 1987. On the Declarative Semantics of Stratified Deductive Databases and Logic Programs. In Foundations of Deductive Databases and Logic Programming. Morgan.
- Ray et al. (2019) Cyril Ray, Elena Camossi, Richard Dréo, Anne-Laure Jousselme, Clément Iphar, Maximilian Zocholl, and Melita Hadzagic. 2019. Use case design and big data analytics evaluation for fishing monitoring. In OCEANS 2019.
- Ray et al. (2016) Cyril Ray, Elena Camossi, Anne-Laure Jousselme, Melita Hadzagic, Christophe Claramunt, and Ernie Batty. 2016. Maritime Data Preparation and Curation, H2020 datAcron project deliverable D5.2. (2016). http://datacron-project.eu/.
- Ray et al. (2018) Cyril Ray, Richard Dréo, Elena Camossi, and Anne-Laure Jousselme. 2018. Heterogeneous Integrated Dataset for Maritime Intelligence, Surveillance, and Reconnaissance (Version 0.1). https://zenodo.org/record/1167595.
- Riveiro (2011) Maria Riveiro. 2011. Visual Analytics for Maritime Anomaly Detection. Ph.D. Dissertation. University of SkövdeUniversity of Skövde, School of Humanities and Informatics, The Informatics Research Centre.
- Roy and Davenport (2010) Jean Roy and Michael Davenport. 2010. Exploitation of maritime domain ontologies for anomaly detection and threat analysis. In 2010 International WaterSide Security Conference. 1–8.
- Santipantakis et al. (2018) Georgios M. Santipantakis, Akrivi Vlachou, Christos Doulkeridis, Alexander Artikis, Ioannis Kontopoulos, and George A. Vouros. 2018. A Stream Reasoning System for Maritime Monitoring. In 25th International Symposium on Temporal Representation and Reasoning, TIME 2018, Warsaw, Poland, October 15-17, 2018. 20:1–20:17. https://doi.org/10.4230/LIPIcs.TIME.2018.20
- Shahir et al. (2015) Hamed Yaghoubi Shahir, Uwe Glasser, Amir Yaghoubi Shahir, and Hans Wehn. 2015. Maritime situation analysis framework: Vessel interaction classification and anomaly detection. In 2015 IEEE International Conference on Big Data (Big Data). 1279–1289.
- Snidaro et al. (2015) Lauro Snidaro, Ingrid Visentini, and Karna Bryan. 2015. Fusing Uncertain Knowledge and Evidence for Maritime Situational Awareness via Markov Logic Networks. Inf. Fusion 21 (Jan. 2015), 159–172.
- Terroso-Saenz et al. (2016) Fernando Terroso-Saenz, Mercedes Valdes-Vela, and Antonio F. Skarmeta-Gomez. 2016. A complex event processing approach to detect abnormal behaviours in the marine environment. Information Systems Frontiers 18, 4 (01 Aug 2016), 765–780.
- van Laere and Nilsson (2009) Joeri van Laere and Maria Nilsson. 2009. Evaluation of a workshop to capture knowledge from subject matter experts in maritime surveillance. In Proceedings of FUSION. 171–178.
- Vandecasteele and Napoli (2012) Arnaud Vandecasteele and Aldo Napoli. 2012. An enhanced spatial reasoning ontology for maritime anomaly detection. In 2012 7th International Conference on System of Systems Engineering (SoSE). 1–6.
- Vespe et al. (2016) Michele Vespe, Maurizio Gibin, Alfredo Alessandrini, Fabrizio Natale, Fabio Mazzarella, and Giacomo C. Osio. 2016. Mapping EU fishing activities using ship tracking data. Journal of Maps 12, sup1 (2016), 520–525.