Evidence for recent GeV brightening of the SN 1987A region
Abstract
We report on a recent (2016–2018) enhancement of the GeV emission from the SN 1987A region as observed with Fermi/LAT. The observed signal is characterised by a power-law spectrum with a slope of and is detected only at energies GeV. The Fermi/LAT data constrain the position of the signal to within around SN 1987A. Although a recent increase in the gamma-ray emission from SN 1987A seems to be a natural explanation for the detected emission, given the youth of the source and its rapid evolution, the Fermi/LAT location also overlaps with several other potential gamma-ray sources: 30 Dor C, the Honeycomb nebula, RX J0536.9-6913, and a hypothetical, previously unknown transient source. We argue that multiwavelength observations of the region performed during the next few years can clarify the nature of the signal and encourage such observations. We also present upper limits on the time-averaged flux of SN 1987A based on years of Fermi/LAT exposure, which can be used to better constrain the particle acceleration models of this source.
1 Introduction
SN 1987A, which occurred on Feb. 23rd 1987, is a naked-eye core collapse supernova located in the Large Magellanic Cloud (LMC). Its brightness and relatively small distance ( kpc) allowed to study the progenitor star and the explosion in great details. The consequent evolution of the supernova remnant has been monitored with gradually improving instruments over the last 30 years. Nowadays, SN 1987A is a laboratory for fundamental studies covering a broad range from diffusive shock particle acceleration (Ball & Kirk, 1992; Berezhko, Ksenofontov & Völk, 2011, 2015) and modeling of the expansion of supernova remnants (Potter et al., 2014) to sterile neutrinos (Argüelles, Brdar & Kopp, 2016) and axions (Payez et al., 2015).
The spatial and spectral evolution of SN 1987A has been traced from the radio to the hard X-ray band, see e.g. Zanardo et al. (2017); Burrows & Frank (2017); Boggs et al. (2015); Reynolds et al. (2015), and McCray & Fransson (2016) for a recent review. The environment of SN 1987A is very complex, the evolution takes place in an hour-glass shaped cavity bound by a dense ring in the equatorial plane. Most of the X-ray emission is thermal, originating from the shocked material in the dense ring, through which the blast wave was propagating until recently (Frank et al., 2016).
The hydrodynamic model proposed by Berezhko, Ksenofontov & Völk (2011, 2015) suggests efficient cosmic ray proton acceleration at the shock of SN 1987A. This leads to a strong shock modification and consequently to a steep spectrum of accelerated electrons, which allows to explain the steep radio spectrum of the source. Interacting with the surrounding medium, mainly the material in the ring, the accelerated protons are expected to produce a significant level of GeV-TeV -ray emission in -decay processes. The changes of the medium’s density by a factor of a few should lead to corresponding changes of the GeV-TeV flux of the source.
The model by Berezhko, Ksenofontov & Völk (2011, 2015) predicts a gradual brightening of SN 1987A in the GeV-TeV band by a factor of 2 in the 2010 – 2030 epoch with a peak emission that corresponds to the time close or right after the shock has completely penetrated the ring. Contrary to this, no VHE emission has been detected from SN 1987A so far despite several dedicated analyses of the region in the GeV (Abdo et al., 2010; Ackermann et al., 2016) and TeV (H.E.S.S. Collaboration et al., 2015) bands.
In the following, we present the results of an analysis of more than 10 years of monitoring data of SN 1987A obtained with Fermi/LAT in the GeV – 3 TeV energy band, which can be used to constrain evolutionary models of the object. The analysis resulted in a detection of GeV emission from the SN 1987A region, for the last two years of the observations (2016-2018). We accompany our analysis with X-ray XMM-Newton and Swift/XRT data and discuss the possible multiwavelength counterparts of GeV signal.
2 Data analysis
2.1 Fermi/LAT data analysis
Fermi/LAT data that were selected for the analysis which is presented in this paper cover more than 10 years (Aug. 2008 to Dec. 2018). For the main analysis, we used the latest available fermitools with P8_R3 response functions (CLEAN photon class)111See the description of the Fermi/LAT response functions .
To extract the spectra for all cases presented below, we performed a standard binned likelihood analysis of the region around SN 1987A. The spectral analysis is based on the fitting of the spatial / spectral model of the sky region around the source of interest to the data. The region-of-interest considered in the analysis is a circle of 14 degrees radius around SN 1987A. The model of the region includes all sources from the FL8Y catalogue222See the source list description document as well as components for isotropic and galactic diffuse emission given by the standard spatial/spectral templates iso_P8R3_CLEAN_V2.txt and gll_iem_v06.fits.
The spectral template for each FL8Y source in the region was selected according to the catalogue model. The normalisations of the sources were considered to be free parameters during the fitting procedure. In order to avoid possible systematic effects, we have also included the FL8Y sources located up to beyond the ROI into the model, with all parameters fixed to their catalogue values. Following the recommendation of the Fermi/LAT collaboration, we performed our analysis enabling energy dispersion handling. All upper limits presented in this work were extracted for points with test-statistics (TS; Mattox et al. 1996) with the UpperLimits python module provided with the Fermi/LAT software and correspond to a 95 per cent () confidence level.
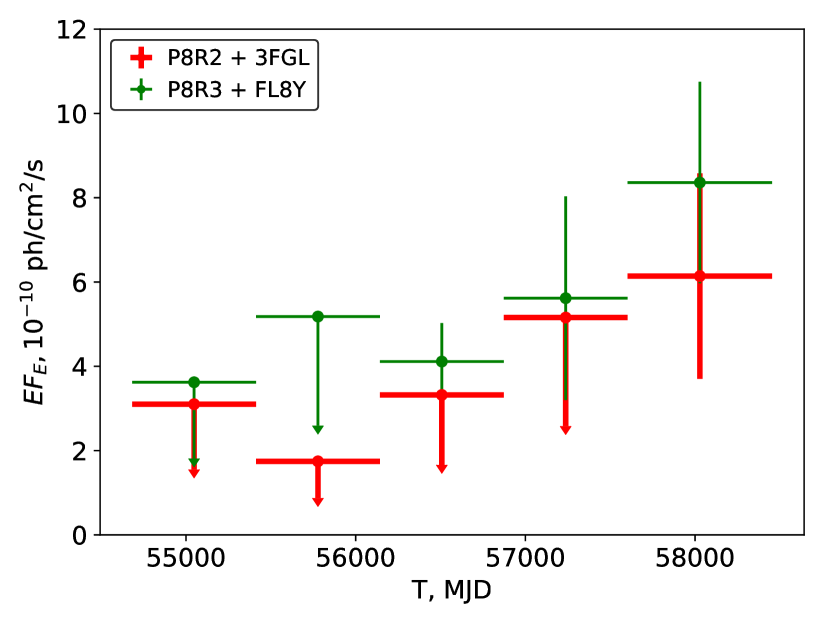
At the initial stage of the analysis, we performed the spectral analysis as described above for five 2-year-long time bins at energies above 1 GeV, with the goal to build a light-curve for SN 1987A. We found that the source was detected with (i.e. above significance) in the last two time bins (Aug. 2014 – Aug. 2016 and Aug. 2016 – Dec. 2018). The light-curve is shown with green symbols in Fig. 1, the test-statistics of the last two bins is and corresponding to and detection significance, respectively. During Aug. 2012 – Aug. 2014 (the third point in the light-curve) the source is only marginally detected with . Given the five considered time bins, a trial factor of 5 can be applied, which still yields a detection significance in the last time bin of .
To cross-check the results, we also analysed the data calibrated with the P8_R2 instrumental functions (as recommended for analysis by the Fermi/LAT collaboration before the P8_R3 IRFs were released in Dec. 2018) and used the 3FGL catalogue of Fermi sources for the model of the region. In this case, we also explicitly added to the model of the region sources that were found by the Fermi/LAT collaboration during the dedicated analysis of the LMC (Ackermann et al., 2016).
The results of the cross-check analysis are shown in Fig. 1 with red symbols. These results are compatible with those of the main analysis, although with the P8_R3 IRFs the source is detected already at earlier times and with slightly higher significance. This can be attributed to the improved background rejection of the P8_R3 calibration. To be conservative, we focus only on the 2016-2018 detection of SN 1987A which is confirmed with both analysis chains ( with the cross-check analysis).
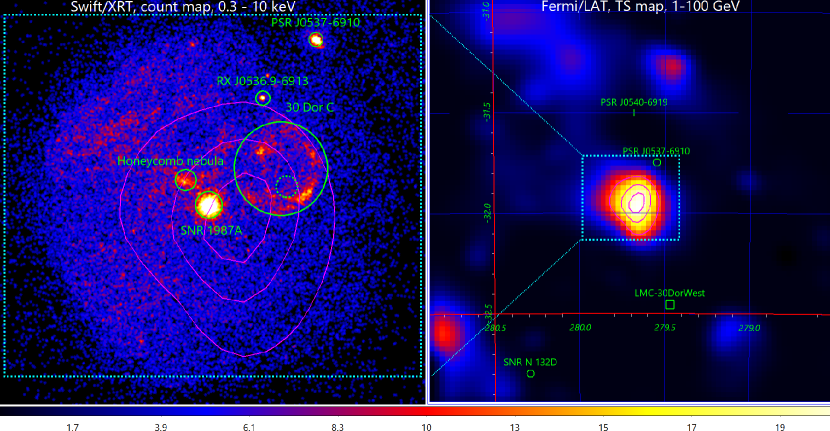
In the following, we refer to the period of the detection of the GeV signal (Aug. 2016 – Dec. 2018) as “high-flux period”, and as “low-flux period” to the whole time period before the signal detection (Aug. 2008 – Aug. 2016). The test-statistics map for the high-flux period, built in the 1-100 GeV energy band, is presented in the right panel of Fig. 2. All sources included into the model, except SN 1987A, were taken into account and thus do not appear in this map. The magenta contours indicate the confidence regions for the position of the non-modeled source.
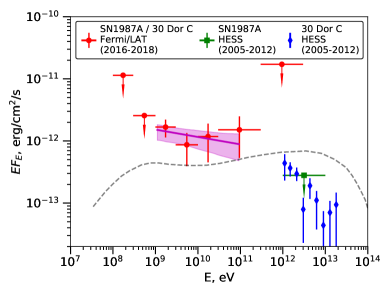
Besides SN 1987A, the contour includes a number of possible counterpart sources, including 30 Dor C, the Honeycomb nebula, and RX J0536.9-6913. The left panel of Fig. 2 presents the Swift/XRT map of the region with marked positions of possible counterpart sources. The spectrum of the signal observed during the high-flux period is characterised by a power-law spectrum with a slope of at energies 1-100 GeV, see Fig. 3.
In our analysis we also considered the time-averaged Fermi/LAT data and explicitly calculated flux upper limits for each energy interval. The results for the spectral upper limits are shown in Fig. 3, right panel.
2.2 X-ray data
We accompanied the analysis with historic XMM-Newton and Swift/XRT observations including the data from recent (May 2018) dedicated Swift/XRT TOO observation of the region. Swift/XRT data was reprocessed and analysed with the xrtpipeline v.0.13.4 and heasoft v.6.22 software packages, following recommendations of the Swift/XRT team333See e.g. the Swift/XRT User’s Guide. To reduce potential Swift/XRT pileup problems for a bright soft source, we extracted the spectrum of SN 1987A from an annulus with an excluded central region of radius.
The considered XMM-Newton data consists of three observations (ObsIds: 0763620101, 0783250201, 0804980201 ) performed just before and during the high GeV flux period (Nov. 2015, Nov. 2016 and Oct. 2017 correspondingly). EPIC-pn spectra were extracted using SAS version 17.0.0. All spectra were extracted from a -radius circular region centred on the source. The background spectra were extracted from a nearby source-free region. The spectra of SN 1987A were additionally corrected for pileup, excluding the central -radius region, using the method described in the relevant SAS data analysis thread444See “How to evaluate and test pile-up in an EPIC source” thread and modelled with a thermal, three-component plane-parallel shock model (vpshock in XSPEC) similar to Maggi et al. (2012).
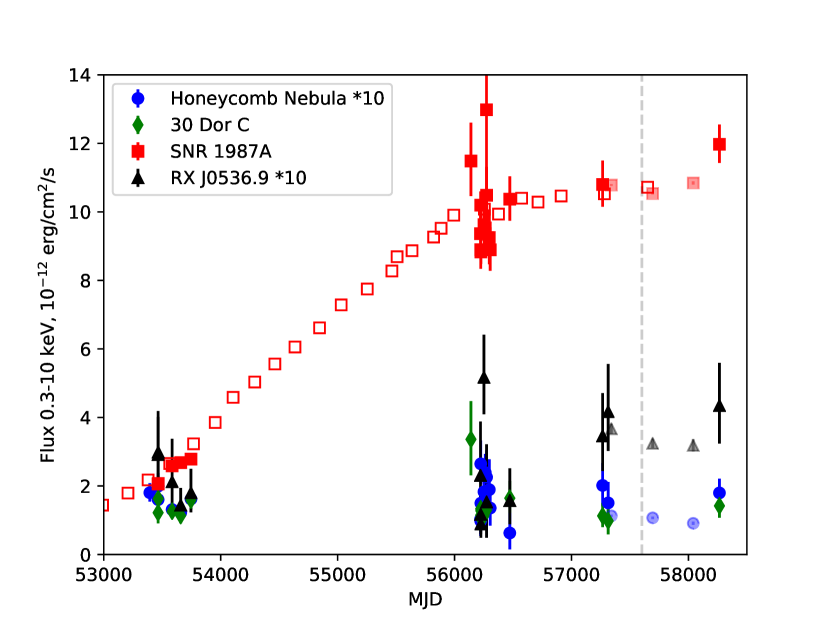
The spectral analysis was performed with XSPEC v.12.10.0c. The evolution of the 0.3–10 keV flux of SN 1987A and nearby X-ray sources within Fermi/LAT localization uncertainties is shown in Fig. 4.
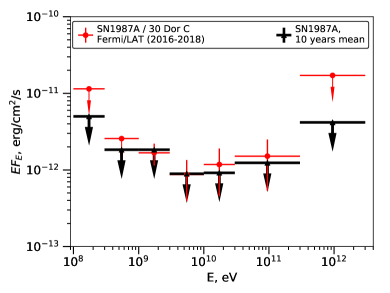
Right: Flux upper limits of SN 1987A, from 10 years of Fermi/LAT data. Red points illustrate the spectrum of SN 1987A during 2016–2018.
3 Results and discussion
The Fermi/LAT localisation area of the signal with a radius of (see Fig. 2) contains a few possible multiwavelength counterparts, including SN 1987A, 30 Dor C, the Honeycomb nebula, and RX J0536.9-6913 which is just barely beyond the localisation contour. The poor statistics of the GeV data also does not allow to exclude the presence of a transient source active for some period during Aug. 2016-2018.
Assuming that the source of the signal is located in the LMC, we estimate the luminosity of the emission during the high-flux period to be
| (1) |
This luminosity is characteristic for supernova remnants detected in the GeV band (see e.g. Dermer & Powale, 2013), which marginally supports a supernova remnant (SN 1987A or Honeycomb nebula) origin of the GeV emission. In the following, we discuss the details of the possible counterparts to the GeV signal.
3.1 SN 1987A
SN 1987A is the most likely and intriguing potential counterpart for the -ray emission, since a GeV-TeV brightening of the source is expected around 2010–2030 (Berezhko, Ksenofontov & Völk, 2011, 2015). The GeV flux observed in 2016-2018 is higher than the one predicted by the model, see the dashed curve in Fig. 3. However, SN 1987A is developing in a rather complex environment with a variety of densities and with varying shock speeds. In such conditions it can be difficult to accurately predict the cosmic ray acceleration efficiency and the gamma-ray emissivities from the first principles. A rather uncertain renormalisation factor of 5 applied by Berezhko, Ksenofontov & Völk (2011) to their modeled -ray spectrum, indicates the level of uncertainty of the prediction and shows that the measured spectrum is actually reasonably consistent with the model.
The X-ray light-curve of SN 1987A demonstrates a comparatively stable behavior, see Fig. 4 for the combined Swift/XRT, XMM-Newton and Chandra light-curves (adapted from Frank et al. (2016); Burrows & Frank (2017)). An indication of a % flux increase can be seen in the Swift/XRT data close to high GeV flux period.
The absence of such variations in the sparser but higher quality Chandra and XMM-Newton data may point towards an instrumental (e.g. pileup) origin of this flux variation. A stable X-ray flux of SN 1987A during the high GeV-flux period can in general be understood if the gamma-ray emission from SN 1987A is dominated by the -decay component, as suggested also by Berezhko, Ksenofontov & Völk (2011, 2015).
On the other hand, if confirmed, the increase of the X-ray flux would suggest a leptonic scenario of the emission production in SN 1987A, but only if the increase of the X-ray flux is not due to thermal emission, but caused by X-ray synchrotron emission of relativistic electrons accelerated at the SN 1987A shock. This additional spectral component would come on top of the currently observed bright thermal emission, which would explain the relatively small changes of the X-ray flux. We would like to note that the statistics of the discussed Swift/XRT observation does not allow to make any conclusions on the presence or absence of such a component.
Radio observations of SN 1987A could serve as another potentially interesting way to probe the origin of the emission. For a leptonic scenario one would naturally expect a much higher increase of the radio flux in comparison to hadronic models. However, published radio data only cover the period before 2012 (Zanardo et al., 2017) and cannot serve for this purpose.
Another option is to exploit the slope of the SN 1987A radio spectrum. The index (Callingham et al., 2016) implies rather different GeV-band slopes for the leptonic and hadronic scenarios, respectively. Assuming a synchrotron self-absorption model for the radio emission, the slope of the electron population is estimated to be . If the GeV emission has a leptonic (IC) origin, the GeV slope would therefore be . Within hadronic models, the GeV slope is under the assumption that relativistic electrons and protons share the same index. The quality of the Fermi/LAT data however does not allow us to firmly discriminate between the two slopes. Checking the difference between the best-fit log-likelihoods of the models with the spectral slope of SN 1987A frozen to the corresponding values we explicitly verified that both indices are just marginally beyond the slope confidence range ( for and for ).
In case the observed GeV emission is not connected to SN 1987A, the reported flux from the region has to be interpreted as an upper limit on the flux from SN 1987A, see Fig. 3 (right panel) for the upper limits based on years of Fermi/LAT data. We would like to note that these limits by themselves are already constraining for the evolutionary models of this object.
3.2 Other possible counterparts
30 Dor C
was classified as a superbubble by Mathewson et al. (1985). Superbubbles, created and powered by the collective action of stellar winds and SNRs, have for a while been considered to be possible cosmic ray accelerators (Bykov, 2001; Ferrand & Marcowith, 2010). After dedicated searches the Cygnus Cocoon (Ackermann et al., 2011; Bartoli et al., 2014; Neronov & Malyshev, 2015; The VERITAS Collaboration et al., 2018) and 30 Dor C (H.E.S.S. Collaboration et al., 2015) were discovered to emit GeV-to-TeV -rays. The -ray emission from the shocks in superbubbles, however, is believed to be variable at years timescales (see e.g. Bykov, 2001), which challenges the association of the variable GeV signal with 30 Dor C.
The emission from individual young supernova remnants within the 30 Dor C superbubble (see e.g. Lazendic-Galloway, R. Dickel & Jones, 2008; Kavanagh et al., 2015) may however be variable on much shorter timescales and could thus in principle be responsible for the observed GeV signal.
We would like also to note that the observed GeV emission could be also associated with certain small-scale structures in 30 Dor C, e.g. bright X-ray knots, see Kavanagh et al. (2019). The origin of these knots is unclear but thought to be associated with enhanced emission in shock-cloud interaction regions (Kavanagh et al., 2019). In this case the knot emission can be variable on time-scales of few years (Inoue, Yamazaki & Inutsuka, 2009) and could potentially be associated with the observed GeV emission.
The Honeycomb nebula
is a relatively faint X-ray source located spatially close to SN 1987A, see Fig. 2. Discovered in the early 90’s (Wang, 1992), the Honeycomb nebula is argued to be a peculiar supernova remnant developing in a shell of material of an older explosion (Meaburn et al., 2010). The supernova remnant origin of this source and the peculiar conditions in which its shell is expanding may suggest that the GeV emission of the Honeycomb nebula is similar to that of SN 1987A. This emission can be variable on a yrs time scale and could be detected by Fermi/LAT. There is also the possibility of a microquasar nature of the Honeycomb nebula as proposed by Meaburn et al. (2010). Microquasars are known to be variable GeV emitters with spectra continuing to at least tens of GeVs (see e.g. Fermi LAT Collaboration et al., 2009; Zdziarski et al., 2018; Malyshev, Zdziarski & Chernyakova, 2013; Zdziarski et al., 2017). These objects are detected in the GeV band only in a certain state, which could explain the variability of the GeV signal detected from the SN 1987A region. The absence of clear X-ray variability of the Honeycomb nebula, however, supports the supernova remnant nature of this source. We nevertheless formally cannot exclude a switching of the Honeycomb nebula to another X-ray state for a significant duration during the period of the measured high GeV flux.
RX J0536.9-6913/Transient source.
RX J0536.9-6913 is an X-ray source discovered by ROSAT (Sasaki, Haberl & Pietsch, 2000). It was argued to be a background AGN by Haberl et al. (2001), based on the high hydrogen column density derived from XMM-Newton observations and a characteristic radio spectral index.
AGNs are known to be strongly variable sources with spectra extending to GeV and TeV energies. Although the Fermi/LAT signal is centered away of this source we cannot strongly exclude that the observed GeV emission originates from a flaring state of this source. The recent X-ray Swift/XRT observations do not exhibit an increase of the flux of RX J0536.9-6913 and do not reveal any other high-flux transient source in the region. This allows us to constrain the variability timescale to be months to years, which is consistent with AGN variability timescales.
4 Conclusion
The statistics of the recent observations of Fermi/LAT of the SN 1987A region does not permit to draw a firm conclusion on the counterpart of the detected GeV emission from the region and cannot exclude an extragalactic transient source origin of the signal. Still, the data show an enhancement of GeV emission at the statistical significance level for the last two years of observations, for which SN 1987A provides the most natural origin of the emission, given its youth and rapid overall evolution. We argue that multiwavelength monitoring of the region within the next few years will allow a conclusion whether the observed GeV excess originates from a variable transient source or from a quasi-steady source like SN 1987A. We encourage detailed studies of the region to identify the counterpart to the enhanced Fermi/LAT emission.
Acknowledgements. The authors acknowledge support by the state of Baden-Württemberg through bwHPC. This work was supported by the Carl-Zeiss Stiftung through the grant “Hochsensitive Nachweistechnik zur Erforschung des unsichtbaren Universums” to the Kepler Center für Astro- und Teilchenphysik at the University of Tübingen. This work made use of data supplied by the UK Swift Science Data Centre at the University of Leicester. We acknowledge the use of public data from the Swift data archive and thanks the entire Swift team for accepting and planning Target-of-Opportunity request.
References
- Abdo et al. (2010) Abdo A. A. et al., 2010, A&A, 512, A7
- Ackermann et al. (2011) Ackermann M. et al., 2011, Science, 334, 1103
- Ackermann et al. (2016) Ackermann M. et al., 2016, A&A, 586, A71
- Argüelles, Brdar & Kopp (2016) Argüelles C. A., Brdar V., Kopp J., 2016, ArXiv e-prints
- Ball & Kirk (1992) Ball L., Kirk J. G., 1992, ApJ, 396, L39
- Bartoli et al. (2014) Bartoli B. et al., 2014, ApJ, 790, 152
- Berezhko, Ksenofontov & Völk (2011) Berezhko E. G., Ksenofontov L. T., Völk H. J., 2011, ApJ, 732, 58
- Berezhko, Ksenofontov & Völk (2015) Berezhko E. G., Ksenofontov L. T., Völk H. J., 2015, ApJ, 810, 63
- Boggs et al. (2015) Boggs S. E. et al., 2015, Science, 348, 670
- Burrows & Frank (2017) Burrows D. N., Frank K. A., 2017, in American Astronomical Society Meeting Abstracts, Vol. 229, American Astronomical Society Meeting Abstracts #229, p. 148.01, see presentation at http://www.science.oregonstate.edu/ lazzatid/FOE2017/CONTRIBUTIONS/Burrows.pdf
- Bykov (2001) Bykov A. M., 2001, Space Sci. Rev., 99, 317
- Callingham et al. (2016) Callingham J. R. et al., 2016, MNRAS, 462, 290
- Dermer & Powale (2013) Dermer C. D., Powale G., 2013, A&A, 553, A34
- Fermi LAT Collaboration et al. (2009) Fermi LAT Collaboration et al., 2009, Science, 326, 1512
- Ferrand & Marcowith (2010) Ferrand G., Marcowith A., 2010, A&A, 510, A101
- Frank et al. (2016) Frank K. A., Zhekov S. A., Park S., McCray R., Dwek E., Burrows D. N., 2016, ApJ, 829, 40
- Haberl et al. (2001) Haberl F., Dennerl K., Filipović M. D., Aschenbach B., Pietsch W., Trümper J., 2001, A&A, 365, L208
- H.E.S.S. Collaboration et al. (2015) H.E.S.S. Collaboration et al., 2015, Science, 347, 406
- Inoue, Yamazaki & Inutsuka (2009) Inoue T., Yamazaki R., Inutsuka S.-i., 2009, ApJ, 695, 825
- Kavanagh et al. (2015) Kavanagh P. J., Sasaki M., Bozzetto L. M., Points S. D., Filipović M. D., Maggi P., Haberl F., Crawford E. J., 2015, A&A, 583, A121
- Kavanagh et al. (2019) Kavanagh P. J. et al., 2019, A&A, 621, A138
- Lazendic-Galloway, R. Dickel & Jones (2008) Lazendic-Galloway J., R. Dickel J., Jones P., 2008, The Astrophysical Journal, 596, 287
- Maggi et al. (2012) Maggi P., Haberl F., Sturm R., Dewey D., 2012, A&A, 548, L3
- Malyshev, Zdziarski & Chernyakova (2013) Malyshev D., Zdziarski A. A., Chernyakova M., 2013, MNRAS, 434, 2380
- Mathewson et al. (1985) Mathewson D. S., Ford V. L., Tuohy I. R., Mills B. Y., Turtle A. J., Helfand D. J., 1985, The Astrophysical Journal Supplement Series, 58, 197
- Mattox et al. (1996) Mattox J. R. et al., 1996, ApJ, 461, 396
- McCray & Fransson (2016) McCray R., Fransson C., 2016, ARA&A, 54, 19
- Meaburn et al. (2010) Meaburn J., Redman M. P., Boumis P., Harvey E., 2010, MNRAS, 408, 1249
- Neronov & Malyshev (2015) Neronov A., Malyshev D., 2015, ArXiv e-prints
- Payez et al. (2015) Payez A., Evoli C., Fischer T., Giannotti M., Mirizzi A., Ringwald A., 2015, J. Cosmology Astropart. Phys., 2, 006
- Potter et al. (2014) Potter T. M., Staveley-Smith L., Reville B., Ng C.-Y., Bicknell G. V., Sutherland R. S., Wagner A. Y., 2014, ApJ, 794, 174
- Reynolds et al. (2015) Reynolds S. P., Zoglauer A., Boggs S. E., Harrison F., NuSTAR Team, 2015, in American Astronomical Society Meeting Abstracts, Vol. 225, American Astronomical Society Meeting Abstracts #225, p. 140.22
- Sasaki, Haberl & Pietsch (2000) Sasaki M., Haberl F., Pietsch W., 2000, Astronomy and Astrophysics Supplement Series, 143, 391
- The VERITAS Collaboration et al. (2018) The VERITAS Collaboration et al., 2018, ArXiv e-prints
- Wang (1992) Wang L., 1992, The Messenger, 69, 34
- Zanardo et al. (2017) Zanardo G., Staveley-Smith L., Ng C.-Y., Indebetouw R., Matsuura M., Gaensler B. M., Tzioumis A. K., 2017, in IAU Symposium, Vol. 331, Supernova 1987A:30 years later - Cosmic Rays and Nuclei from Supernovae and their Aftermaths, Marcowith A., Renaud M., Dubner G., Ray A., Bykov A., eds., pp. 274–283
- Zdziarski et al. (2017) Zdziarski A. A., Malyshev D., Chernyakova M., Pooley G. G., 2017, MNRAS, 471, 3657
- Zdziarski et al. (2018) Zdziarski A. A. et al., 2018, MNRAS, 479, 4399